Article

Triply Periodic Minimal Surfaces Mullite Structures for Humidity Detection

Politecnico di Torino, Department of Applied Science and Technology, INSTM R.U PoliTO-LINCE Laboratory, Corso Duca degli Abruzzi 24, 10129 Turin, Italy
*
Author to whom correspondence should be addressed.
Chemosensors 2025, 13(5), 168; https://doi.org/10.3390/chemosensors13050168
Submission received: 28 March 2025 / Revised: 24 April 2025 / Accepted: 1 May 2025 / Published: 5 May 2025

Abstract

:
Three-dimensional-printed complex mullite structures based on triply periodic minimal surfaces (TPMSs, namely, Schwartz and Gyroid) with two different thicknesses (Schwartz 1 and Gyroid 1–4 mm, Schwartz 2 and Gyroid 2–6 mm) were fabricated and tested as humidity sensors. The samples were sintered at 1450 °C and tested in the range from 0% to 89% relative humidity (RH) at room temperature to evaluate the effect of geometry and thickness on humidity sensitivity. After water vapor exposure at room temperature, the response was 2.84 under 89 RH% for the Schwartz 1 structure (1.36 for the Schwartz 2 structure) and 1.21 for the Gyroid 1 structure (7.00 for the Gyroid 2 structure). The results showed that, at 89% RH, the best response of the sensors was achieved for the Gyroid 2 structure. Sensors exhibit good repeatability, and there was no interference in the presence of other gases.

1. Introduction

The measurement and control of humidity are of great importance not only for human comfort but also for many different sectors of industry and technology, such as environmental monitoring, weather forecasting, agriculture, manufacturing, aerospace, and medical applications [1,2,3,4,5]. Thus, there is a constant need to develop new humidity sensors with high selectivity, sensitivity, and fast response times. In this work, resistive humidity sensors were chosen because of their simple manufacturing process and low production cost.
According to the measuring signal, the humidity sensors can be of the following types: capacitive, resistive, impedance, optical, frequency (quartz crystal microbalance (QCM), surface acoustic wave (SAW)), emerging electrochemical sensors, and ion gradient self-powered humidity sensors [6,7,8,9,10]. Resistive humidity sensors are based on the electrical resistivity changes in semiconductors, conductive polymers, or composites because of water molecule adsorption. At present, many humidity sensing ceramic materials, such as perovskites (NdCoO3, BaTiO3, etc.) [11], metal oxides (Fe2O3, CuO, SnO2, ZnO, etc.) [12,13,14,15,16,17], spinels (CoCr2O4, MgFe2O4, etc.) [18,19,20], halloysite nanotubes [21], attapulgite [22], and sepiolite nanofibers [23], have been used for the resistive humidity sensors.
Triply periodic minimal surface (TPMS) structures have zero curvature at every point on the surface and, due to unique topologies, have attracted significant interest [24,25]. TPMS porous structures have some advantages in comparison with other structures: their geometry can be exactly expressed through mathematical functions. By changing the parameters of the mathematical functions, it is possible to control the size, shape, and distribution of pores and porosity. Moreover, TPMS structures have smooth curvatures and joints, which are important advantages for different applications.
Mullite TPMS structures have a high specific surface area and high thermal stability. However, it is difficult to produce mullite TPMS structures by traditional methods due to their complex shape. Recently, three-dimensional (3D) printing technology has been successfully used to produce ceramics with high-quality patterned structures [26,27]. Among them are inkjet printing, selective laser melting (SLM), and digital light processing (DLP). The latter method offers the possibility to produce complex geometric shapes based on a 3D CAD model. This permits precise control of the shape, size, and distribution of the pores in the printed structure.
TPMS 3D printed structures are used only in a few cases for sensor applications. Zhou et al. prepared Ti-doped SiOC gyroid structures by vat photopolymerization [28]. It had high selectivity towards n-butanol and maintained gas sensitivity at 500 °C. These structures were also used as piezoresistive sensors with good durability and reliability, which exhibited no performance degradation after 500 compressing cycles. Peng et al. fabricated piezoresistive sensors of polydimethylsiloxane with complex internal pores based on 3D-printed sacrificial models [29]. Among the various structures, the diamond-based ones showed the highest responsive strain of 61%, with a resistance response value of 0.97. Fortunato et al. created a piezoresistive pressure sensor using Grid and TPMS structures of 3D porous flexible open-cell foams [30]. These foams were fabricated by the 3D printing of sacrificial templates, followed by leaching, and infiltration with various low-viscosity polymers, and, in the final stage, the pores were coated with graphene nanoplatelets. The maximum sensitivity of these sensors for pressures below 10 kPa was 0.088 kPa−1 (for pressures of 80 kPa–0.24 kPa−1). Imanian et al. produced wearable, simple, and low-cost piezoresistive sensors based on TPMS for biomonitoring applications [31]. The sensors demonstrated good durability under cyclic compression forces and good stability. Davoodi et al. printed sensors based on interconnected TPMS structures from surface-doped porous silicone [32]. The piezoresistive sensor signals under repeated mechanical loads were stable and had high stability and cyclic repeatability. The humidity sensitivity of the surface-embedded graphene sensors, as compared to the surface-deposited graphene sensors, was found to be insignificant. Han et al. created a 3D hybridized conductive network structure utilizing transition metal carbides/sodium alginate and multi-walled carbon nanotubes, by means of parametric structural design, and using the fused deposition molding printing technique [33]. In the wide operating range (up to 10 MPa), the sensors had high sensitivity (4.67 MPa−1–7.03 MPa−1), long-term fatigue resistance (more than 10,000 cycles), and fast response and recovery times (200 ms and 300 ms).
In this research, the photocurable mullite ceramic slurry was prepared first. Two types of mullite TPMS structures (Schwartz and Gyroid structures) with two different thicknesses were produced by DLP technology. Sensors were then sintered at 1450 °C. Their electrical response as a function of RH (from 0% to 89% RH at RT) and with respect to interfering gases (NO2, CO2, NH3, and CH4) was studied for the first time.

2. Materials and Methods

2.1. Fabrication of Ceramic Substrates

2.1.1. Mullite Powders Characterization

Ceramic substrates were additively manufactured using mullite (3Al2O3⋅2SiO2), specifically, two commercial powders, JMS-70 (by Mf Jingxin New Material Co., Zhenwu Town, Jiangdu District, Yangzhou City, Jiangsu Province, China) [34] and MC MM (by MC CERATECH CORP, Aichi, Japan) [35]. Both the raw materials were kindly supplied by Saint-Gobain Research Provence (France) and derived by a sintering process. In the present work, the two commercial powders will be distinguished based on their finer and coarser particle sizes, thus indicated, respectively, as Mf (fine mullite, JMS-70) and Mc (coarse mullite, MC MM). Our previous work [36] contains all the details about powder characterization in terms of particle size distribution (determined by laser granulometry), phase indexation (X-ray diffraction), and chemical composition (X-ray fluorescence).
An amount of 150 g of as-received powders was poured in a plastic jar with zirconia balls (d = 2 mm), water, and magnesium nitrate hexahydrate (Mg(NO3)2⋅6H2O, supplied by Sigma-Aldrich, 99.0% purity), as a sintering aid; the proportions with respect to the mullite are shown in Table 1. The amount of Mg(NO3)2⋅6H2O was calculated to obtain 1 wt% of MgO by thermal decomposition. Ball-milling was performed for 48 h using a Labinco roller bench (Labinco BV, Breda, The Netherlands) and setting a rotational speed of 1.4 rpm. After drying, the ball-milled powders were calcined at 650 °C for 1 h with a 10 °C/min heating ramp [37].
After ball-milling and calcination, the Mc and Mf powders showed a D50 (average particle size) of 9.2 and 4.4 μm, respectively (Table 2).
The pressed pellets fired at 1450 °C also evidenced differences in terms of open porosity, total pore area, and average pore diameter between the two mullites (Table 2): the Mf samples exhibit a slightly higher open porosity percentage, and a doubled total pore area compared to the Mc ones. On the other side, pores with a larger size are present in the Mc pellets. In fact, despite its coarser size, the Mc powder has a higher iron oxide content (0.63 wt% for Mc vs 0.33 wt% for Mf, determined by XRF), and, as explained in a previous work [36], this can explain the slightly higher densification.
The Mc and Mf powders were also characterized by XRD analysis: both patterns showed the presence of mullite peaks (main phase, JCPDS file number 15-0776), as well as of free aluminum oxide (α-Al2O3, hexagonal phase, JCPFD file 96-900-7499). In addition, no relevant differences between the patterns of the as-received, ball-milled, and calcined powders were evidenced.

2.1.2. Mullite Slurry Elaboration

An already established protocol [35,38] was used to obtain two DLP printable ceramic slurries: a photosensitive commercial resin (Blank resin C, by Admatec Europe BV, Alkmaar, The Netherlands), containing acrylate-based monomers and diphenyl(2,4,6-trimethylbenzoyl) phosphine oxide as a photo-initiator, was mixed with the two different mullite powders. A mullite solid loading of 69 wt% was reached by adding 5 wt% of a dispersant (disperbyk-103, BYK Chemie, Wesel, Germany). After 45 min of mechanical stirring and 6 h homogenization in a planetary ball milling at 350 rpm with agate spheres of 10 mm diameter (Fritsch Pulverisette, Fritsch GmbH, Idar-Oberstein, Germany), a rotary pump was used to degass the slurries for 30 min. A rotational rheometer (Kinexus Pro+, Netzsch Gerätebau GmbH, Selb, Germany) was used to perform rheological tests at 25 °C, with stainless steel parallel plates of 20 mm in diameter at 1 mm of distance; a shear rate range of 0.1–1000 s−1 was considered.

2.1.3. Digital Light Processing (DLP) of TPMS Mullite Architectures

Mullite macroporous scaffolds were manufactured by DLP using an Admaflex 130 printer (by Admatec Europe BV, Alkmaar, The Netherlands), as in previous works [36,38]. A 125 μm doctor blade spreads uniformly the ceramic slurry on a moving tape and, then, a UV light with a 405 nm wavelength photopolymerizes the resin layer-by-layer on a moving platform. Printing parameters were optimized to print porous TPMS architectures with both Mc and Mf mullite slurries: respectively, 1255 and 683.75 mW/cm2 as LED power, and 3.8 and 3.0 s as exposure time were set. In both cases, a layer thickness of 30 mm gave good results in terms of adhesion between the different printed layers, and a delay of 6 s before exposure guaranteed the removal of air bubbles from the slurry. Two TPMS architectures were successfully printed: Schwartz Primitive and Gyroid. The .stl files of the 3D printed designs were modelled using Blender (by Blender Foundation, Amsterdam, The Netherlands) and AutoCAD 2018 software (Autodesk, San Francisco, CA, USA). The nominal specifications of the monoliths manufactured for sensing tests were collected from the modelling software. A nominal diameter and height of 2.1 cm and ca. 0.5 cm, respectively, were set. From the nominal surface area (SA) and volume (V), the surface-to-volume ratio was calculated as SA/V. Furthermore, the surface area was related to the weight of ceramic structures to calculate the specific surface area (SSA). The void percentage φ was determined in accordance with Equation (1):
φ ( % ) = V void V total × 100 = 1 V lattice V dense × 100
where Vlattice and Vdense are, respectively, the volume of the lattice structure and the volume of a dense cylinder with the same external dimensions.

2.1.4. Post-Processing, Sintering and Characterization

DLP printed monoliths were submitted to post-printing treatments: first, water debinding at 30 °C was performed to remove the hydro-soluble components of the resin and the uncured residual slurry; then, samples were dried in air and then in oven at 70 °C overnight. Thermal treatments were performed under air atmosphere in an electric furnace (Nabertherm, Nabertherm GmbH, Lilienthal, Germany), following a cycle previously optimized [36,38] (Figure 1): a slow thermal debinding up to 1000 °C allows to avoid crack formation during the polymeric component decomposition, while the sintering was completed at 1450 °C, maintaining a certain residual porosity in the mullite structure. Monoliths were then characterized in terms of ρ (g/cm3), geometrical density, determined by mass and geometric measurements, and by buoyancy method, following Archimedes’ principle (Density Determination Kit, Sartorius YDK01, Göttingen, Germany). The measurements were related to the mullite theoretical density of 3.17 g/cm3.
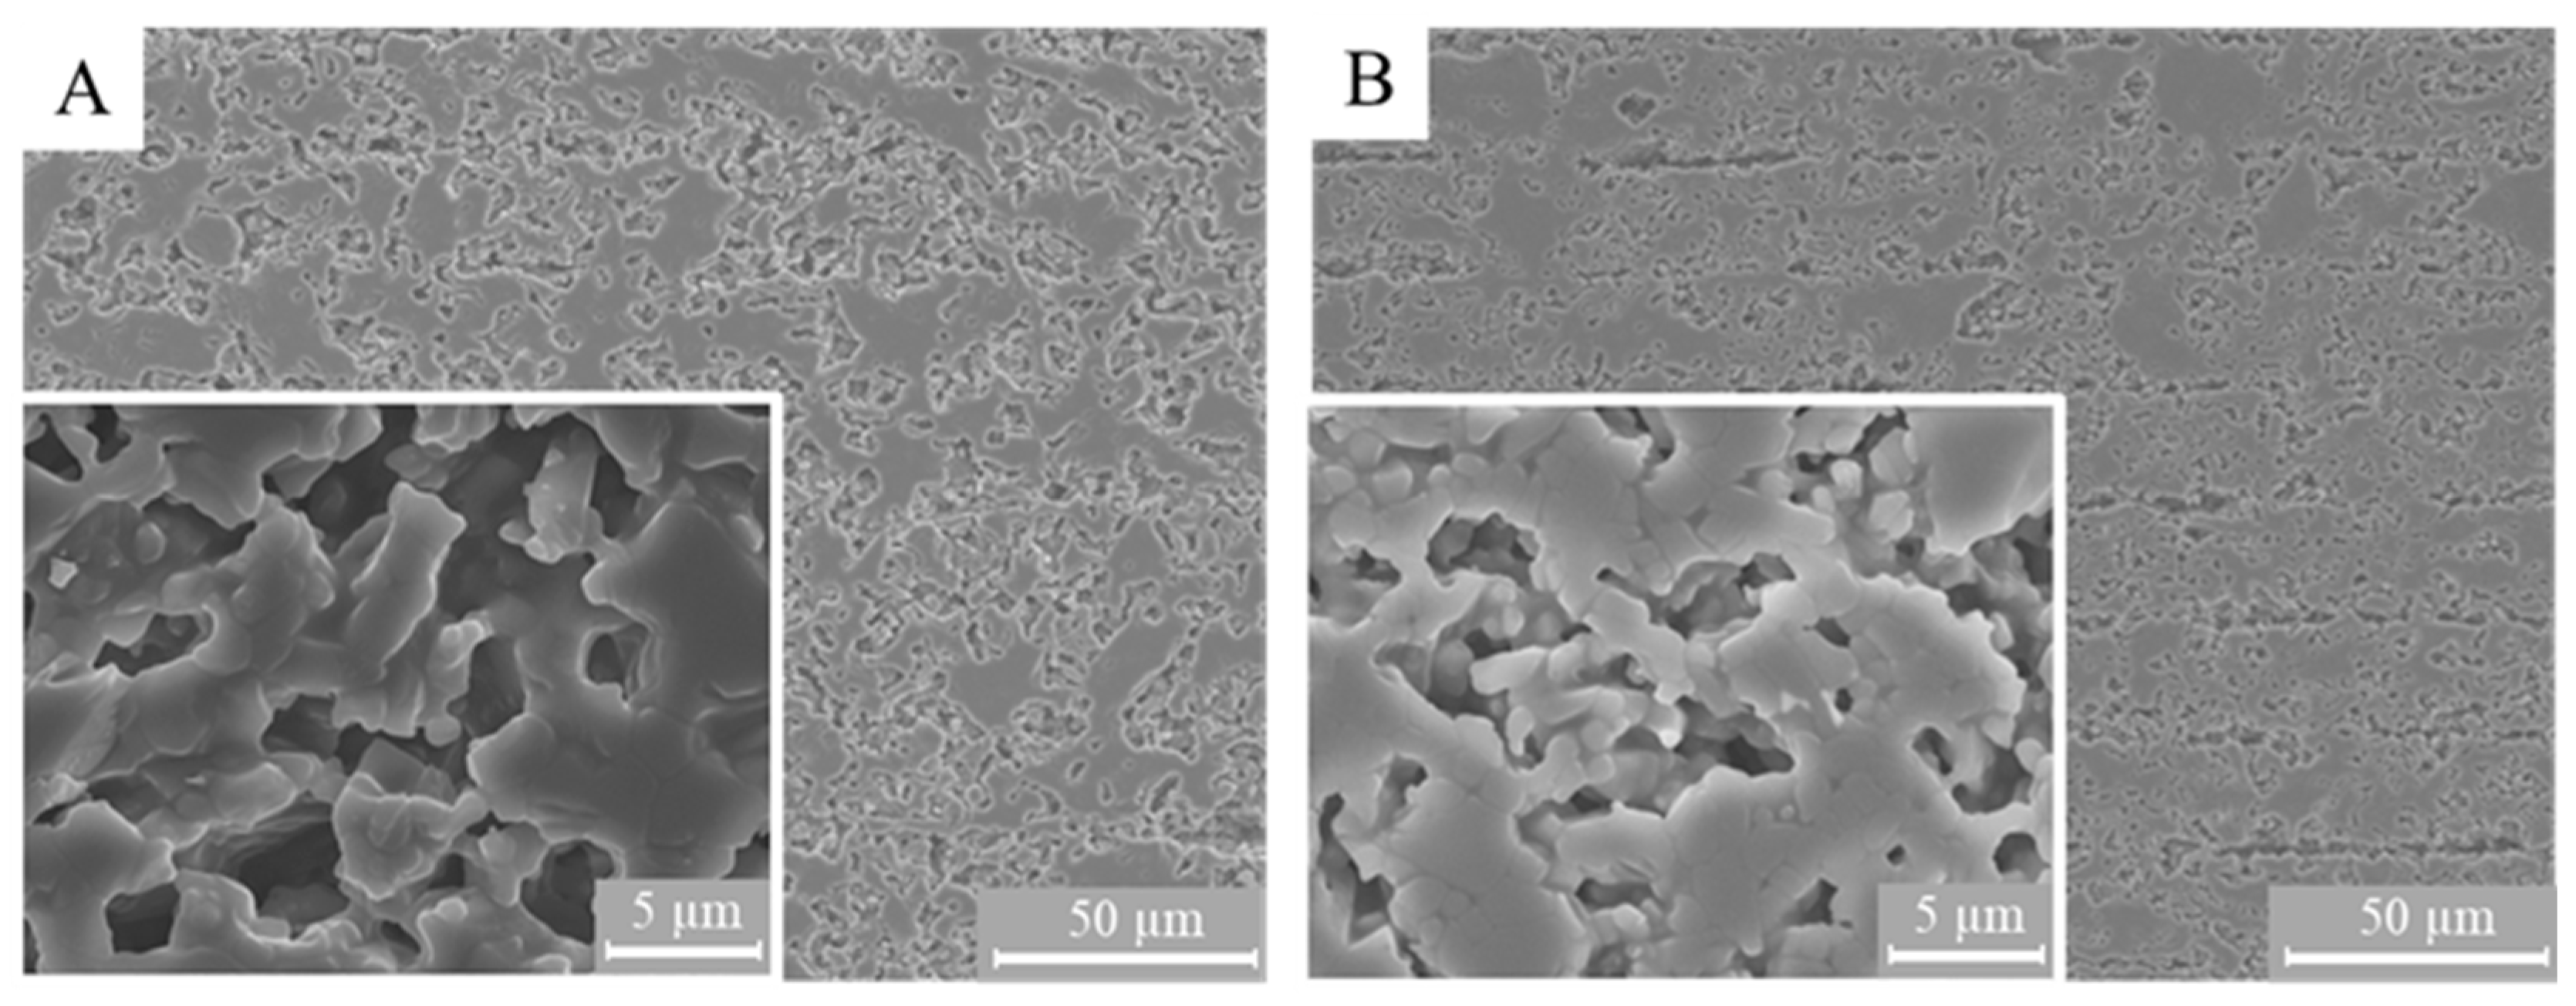
The sintering temperature is a crucial parameter affecting, on one side, the microstructural porosity and, on the other side, the monolith’s structural resistance. As explained in detail in a previous work [36], the sintering was performed up to 1450 °C in order to balance both these aspects: a lower temperature can increase the microstructural permeability, but does not guarantee proper handling for geometrically complex monoliths. The FE-SEM micrographs of 3D printed pellets made of Mc and Mf mullite are presented in Figure 2A and B, respectively. Samples’ fracture surfaces were observed after polishing to better highlight the microstructure resulting from the additive manufacturing shaping. Indeed, printing layers are displayed by micrographs at lower magnification and appear more clearly for the Mf sample; they show a thickness comparable with the nominal layer thickness set for the printing jobs (30 µm) [36]. For both samples, it is evident that the full densification is not reached and interparticle porosities occur, in agreement with MIP measurements. In particular, the microstructures shown by the micrographs at higher magnification highlight the presence of bigger pores in the Mc samples in comparison to the smaller porosities in the Mf microstructure. Thus, FE-SEM analysis coherently reflects the average pore diameters measured by MIP (Table 2). Differences between the Mf and Mc monoliths in terms of open porosity, total pore area, and average pore diameter are significant but not relevant enough to cause a difference in terms of permeability. Thus, tortuosity and pore connectivity are mainly influenced by the macro-architecture. Further and specific tests are needed for the evaluation of the gas permeability behavior in the same flow conditions operated for the gas sensing experiments performed in the current work. However, similar architectures were analyzed in terms of Darcy’s permeability coefficient in a previous work [39], which did not highlight relevant differences between Schwartz Primitive and gyroid designs in the investigated flow rate range.

2.2. Fabrication and Measurement of Humidity Sensors

The electrodes were made of an aluminum tape (commercial tape).
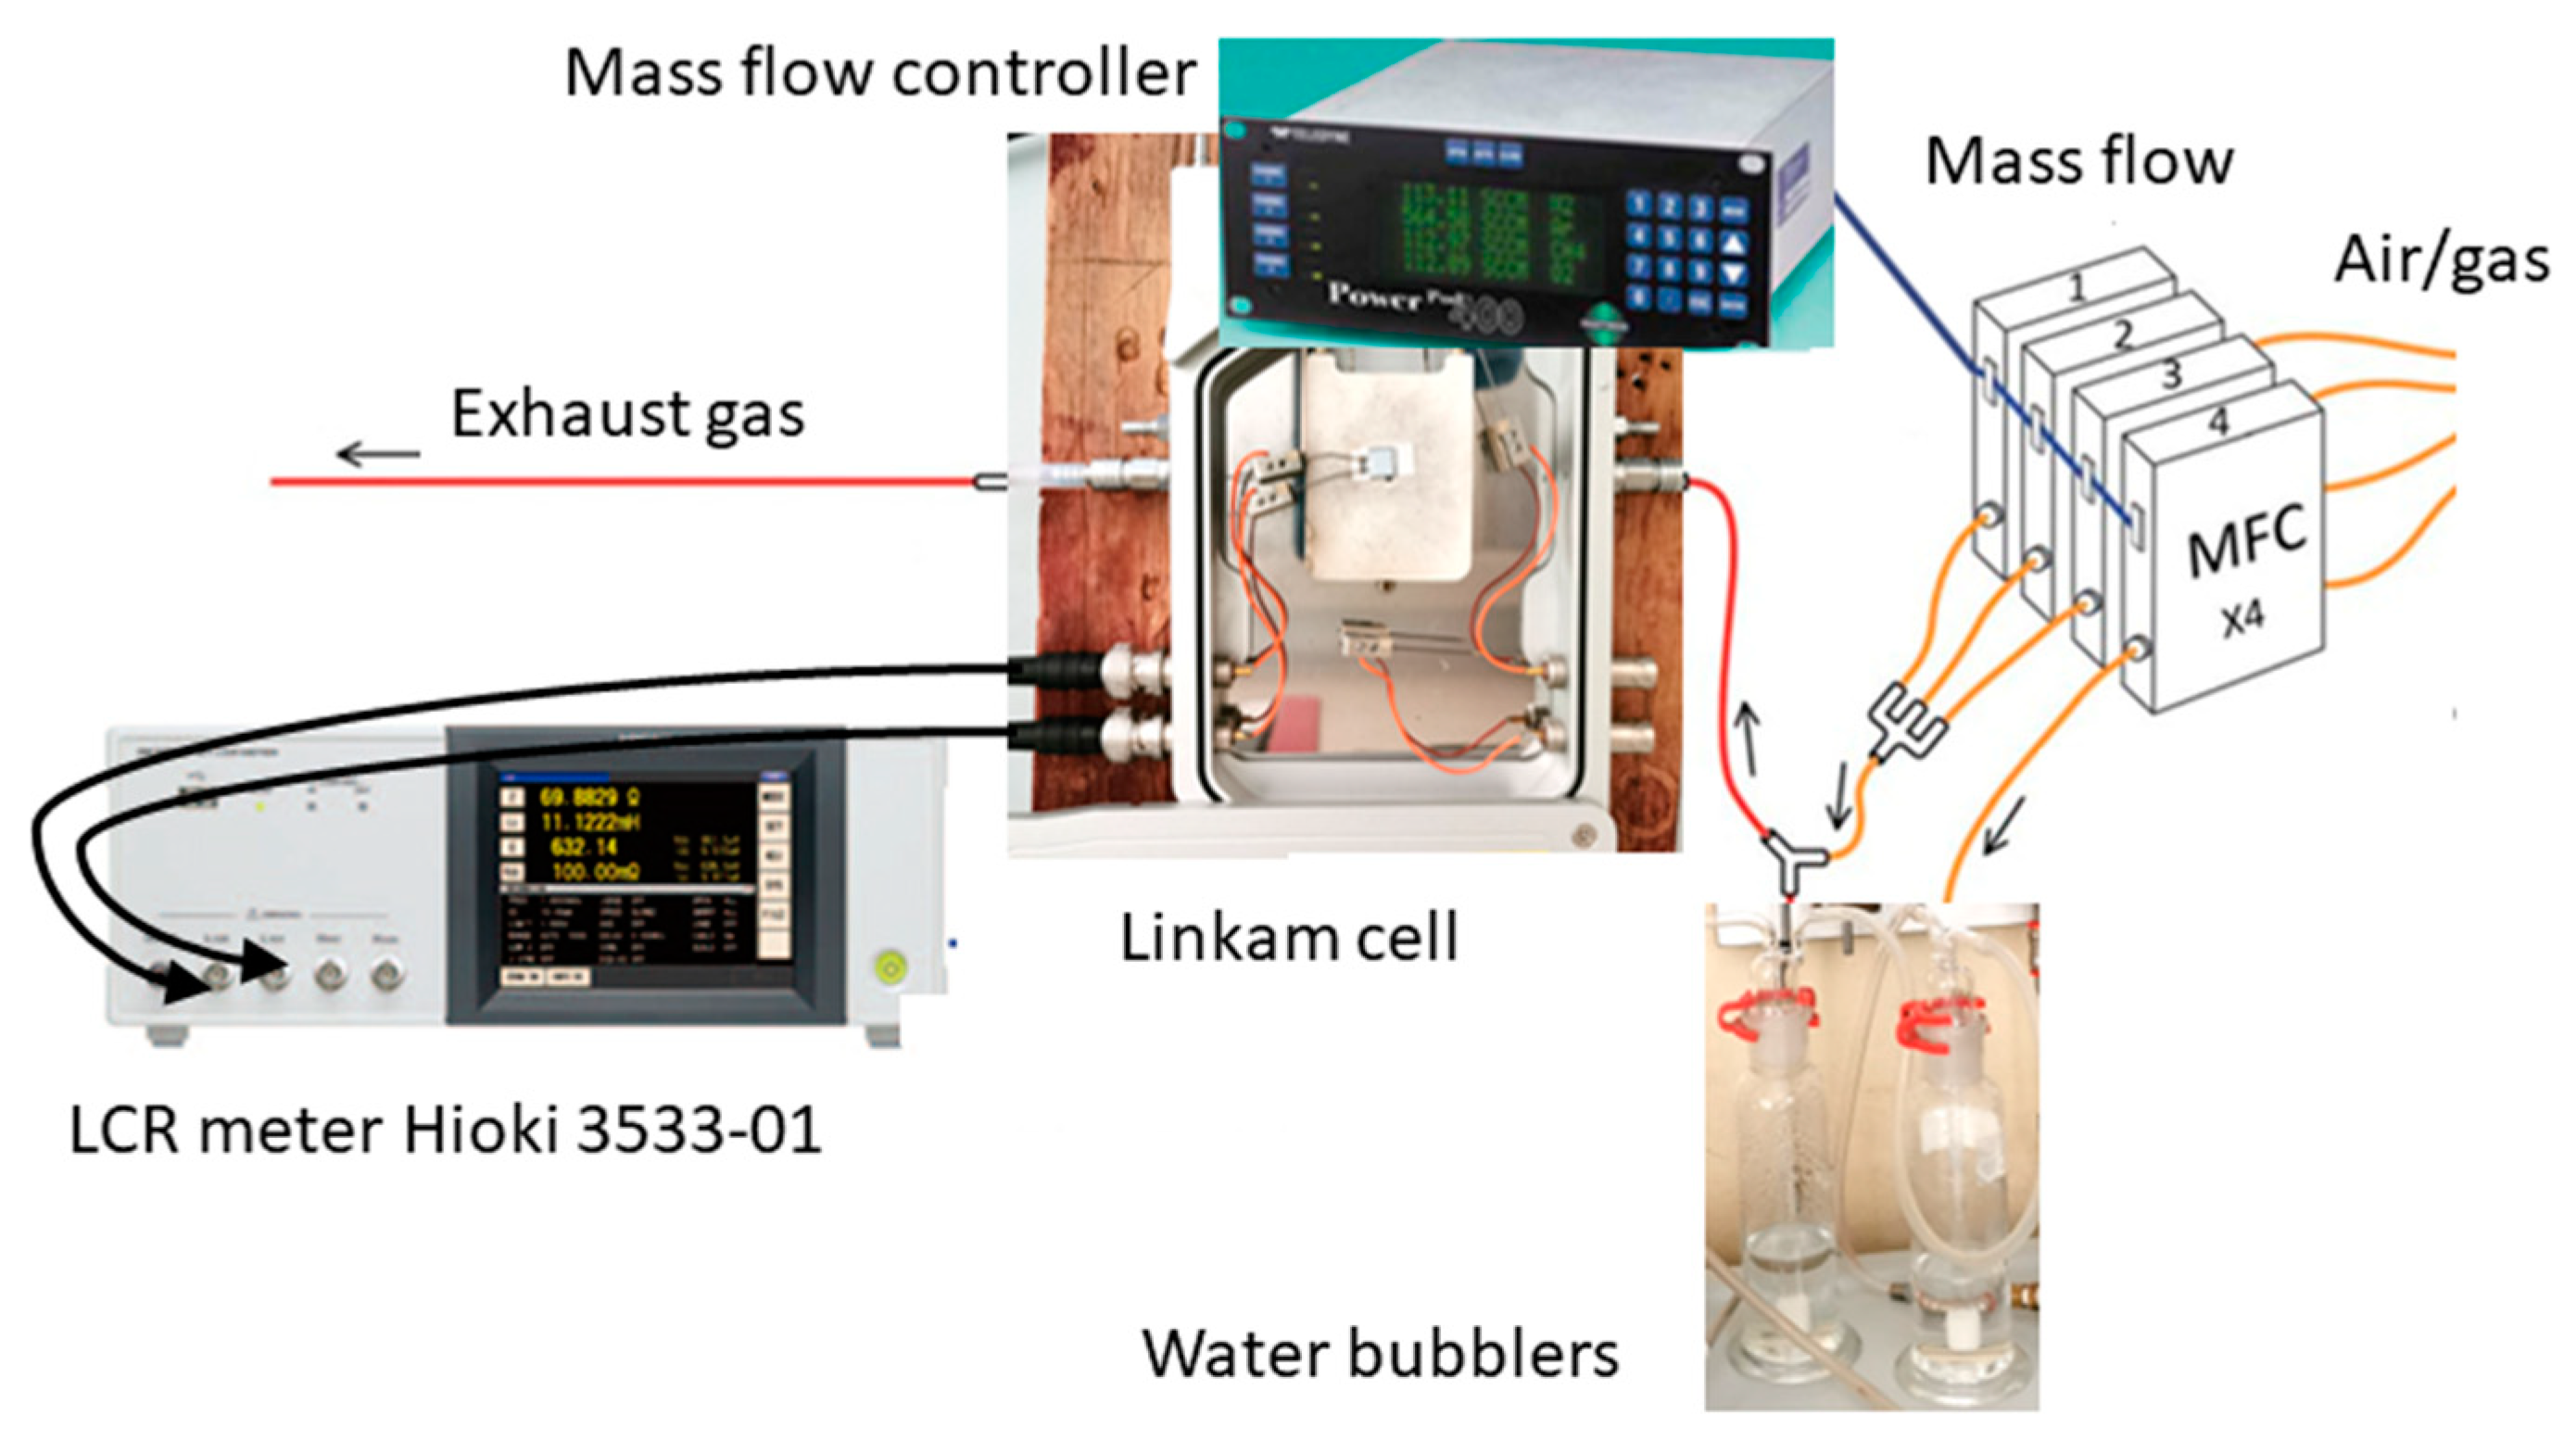
The sensor’s response to humidity was studied in a laboratory system in the 0–90% RH range at room temperature (23 °C), under an air flow rate of 320 mL/min. The RH was increased progressively by steps, each one 20 min. In this system (Figure 3), the air flow (Siad, San Mauro Torinese, Italy, research grade) was controlled by mass flows (driven by a mass flow controller: Teledyne 4000; MF302, Teledyne Hastings, USA;) and divided into two flows. The first one passes through the water bubbler, generating a saturated humid flow, whereas the second one was anhydrous. Then, both flows were combined. A commercial probe (Delta Ohm DO9406, Caselle di Selvazzano, Italy; accuracy: ±0.1% in the 0–100% RH range and between 20 and 250 °C) for humidity and temperature measurements was used as reference for the determination of RH and temperature values inside the measurement chamber [40]. An LCR meter (Hioki 3533-01, Ueda, Japan) was used to measure the sensors’ impedance phase and modulus during tests under a dynamic flow. The applied voltage was set to 1 V to avoid water electrolysis during the measurements in water vapor presence, while the frequency was fixed to 1 kHz, a much higher frequency than the network one (50–60 Hz), to limit any potential electric perturbation.
Cross-sensitivity tests were also conducted for different gases, like NO2 (2.5 ppm in the air), CO2 (500 ppm in the air), CH4 (100 ppm in the air), and NH3 (44 ppm in the air), under the same flow rate. All gases were research grade and were provided by Siad, San Mauro Torinese, Italy.
The response of the sensor (R) was determined in accordance with Equation (2):
R = Z 0 Z g
where Z0 and Zg are, respectively, the impedance modulus under dry air and the impedance modulus under humid air of sensor.
The response time, as well as the recovery time, were calculated as the time required by a sensor to achieve 90% of the maximum impedance variation in the presence of humid air and the time required for a sensor to reach 90% of the maximum impedance change in the case of gas desorption.

3. Results and Discussion

3.1. Sensors Characterization

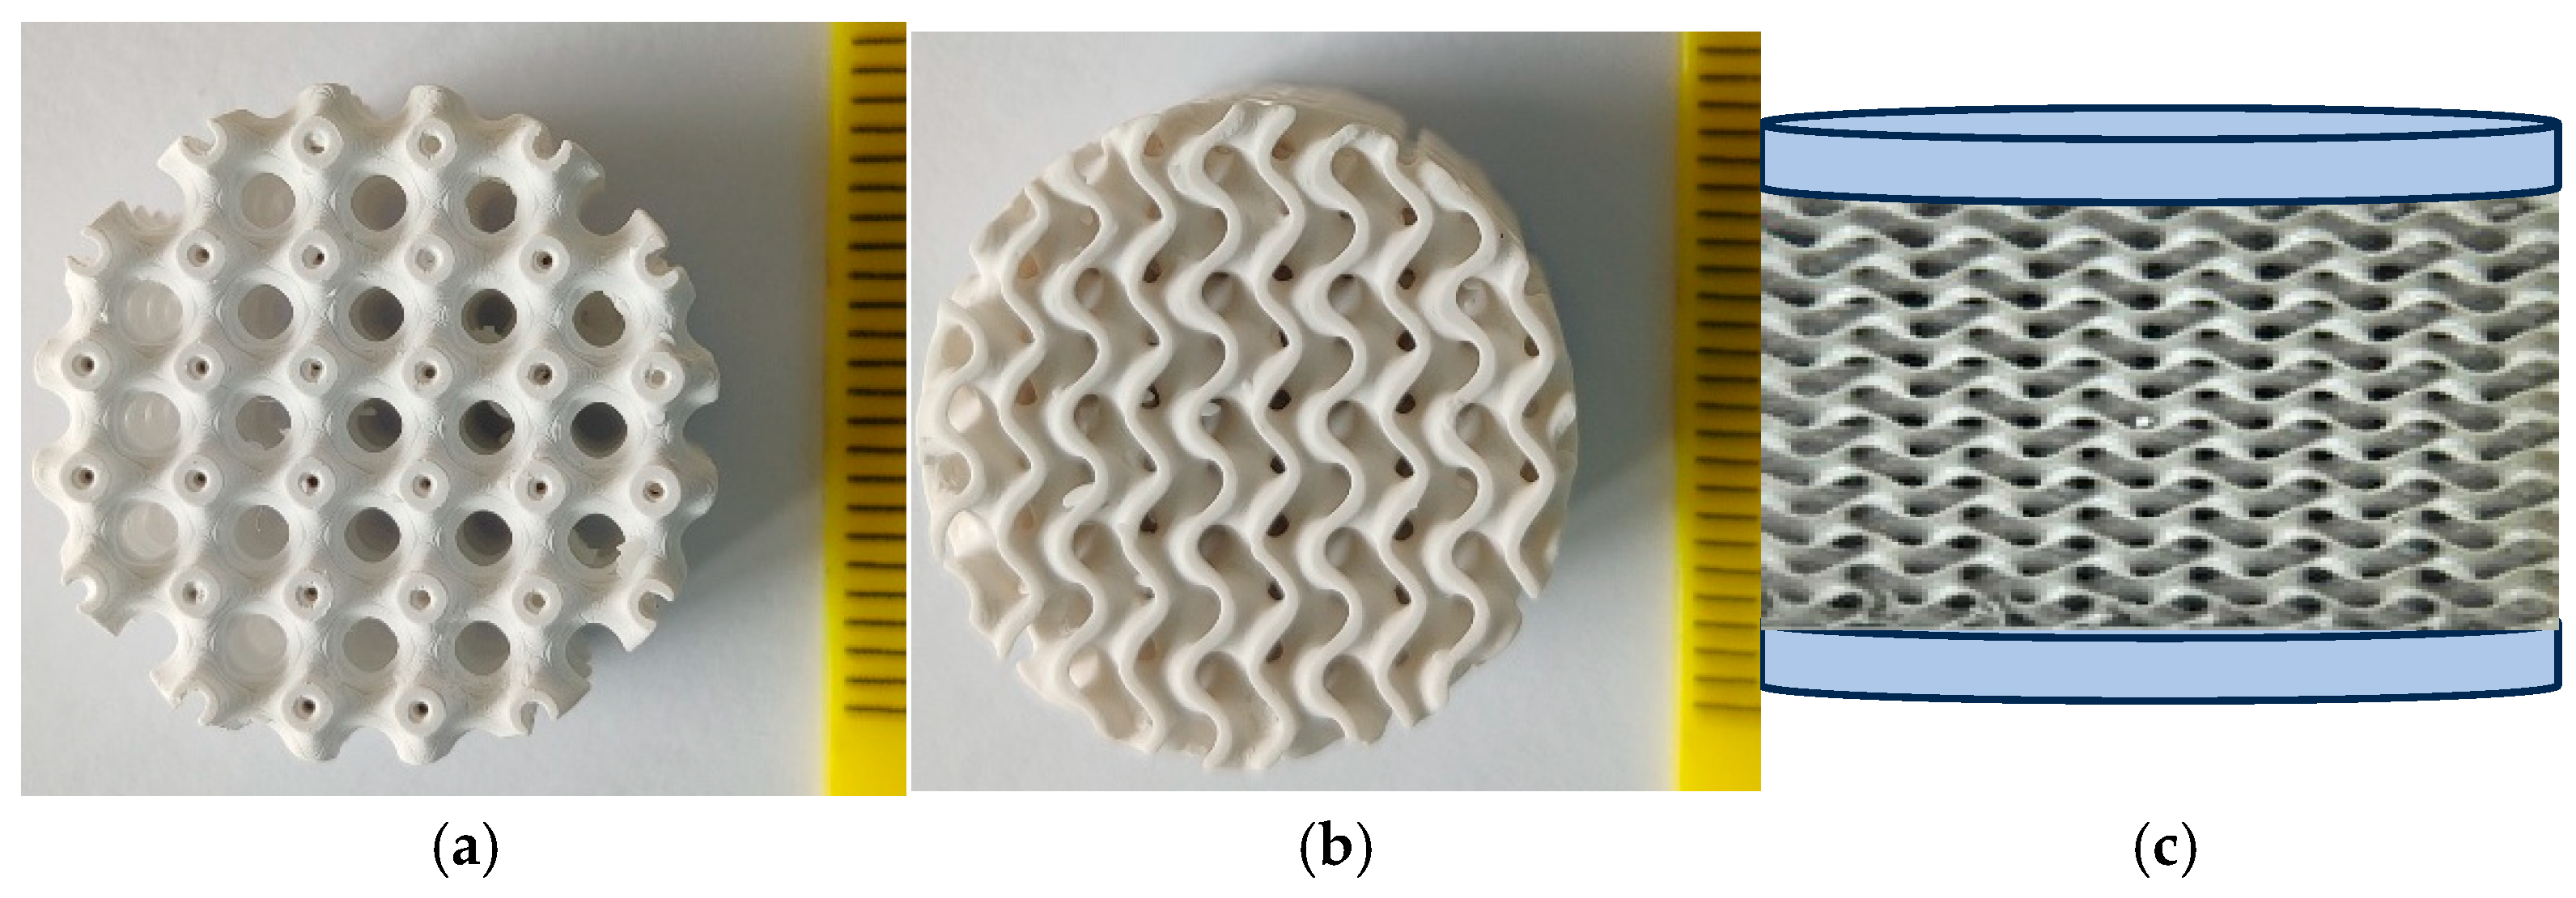
Three-dimensional printed mullite sensor structures with the following architectures were prepared: Schwartz with thicknesses of 4 (S1) and 6 mm (S2), and Gyroid with thicknesses of 4 (G1) and 6 mm (G2). Images of the printed sensors are reported in Figure 4: (a)—Schwartz, (b)—Gyroid; (c)—schematic illustration of the sensor structure with aluminum tape as upper and lower electrodes.

3.2. Humidity-Sensing Properties

The sensor response, in terms of impedance variation of printed sensors S1, S2, G1, and G2 under 89% RH, is plotted in Figure 5. Under dry air, the initial impedance values were 75 MΩ for S1, 132 MΩ for S2, 96 MΩ for G1, and 101 MΩ for G2. After water vapor exposure, the impedance value under 89 RH% dropped down to 26 MΩ for S1, 98 MΩ for S2, 79 MΩ for G1, and 14 MΩ for G2.
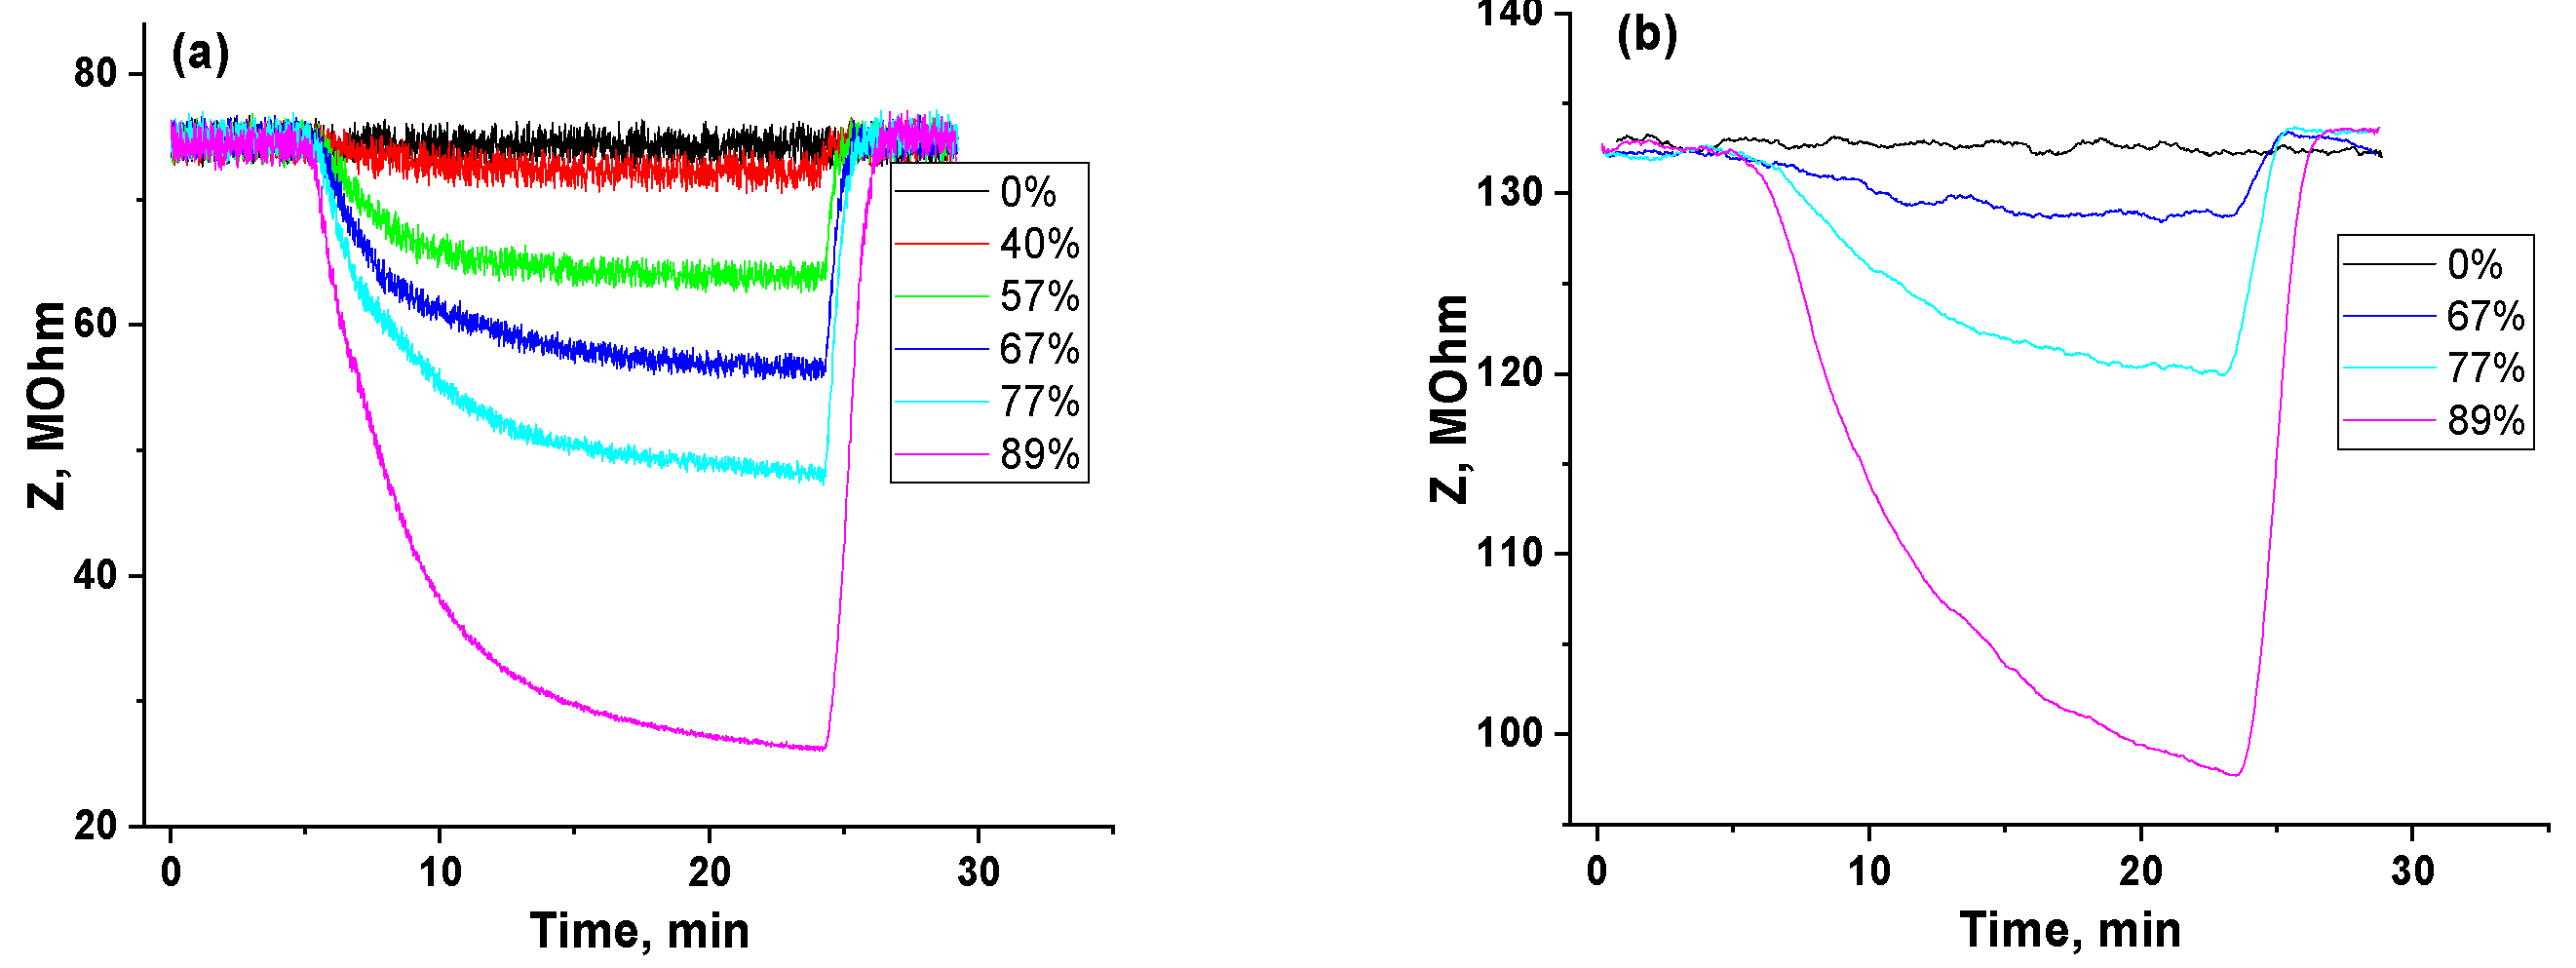
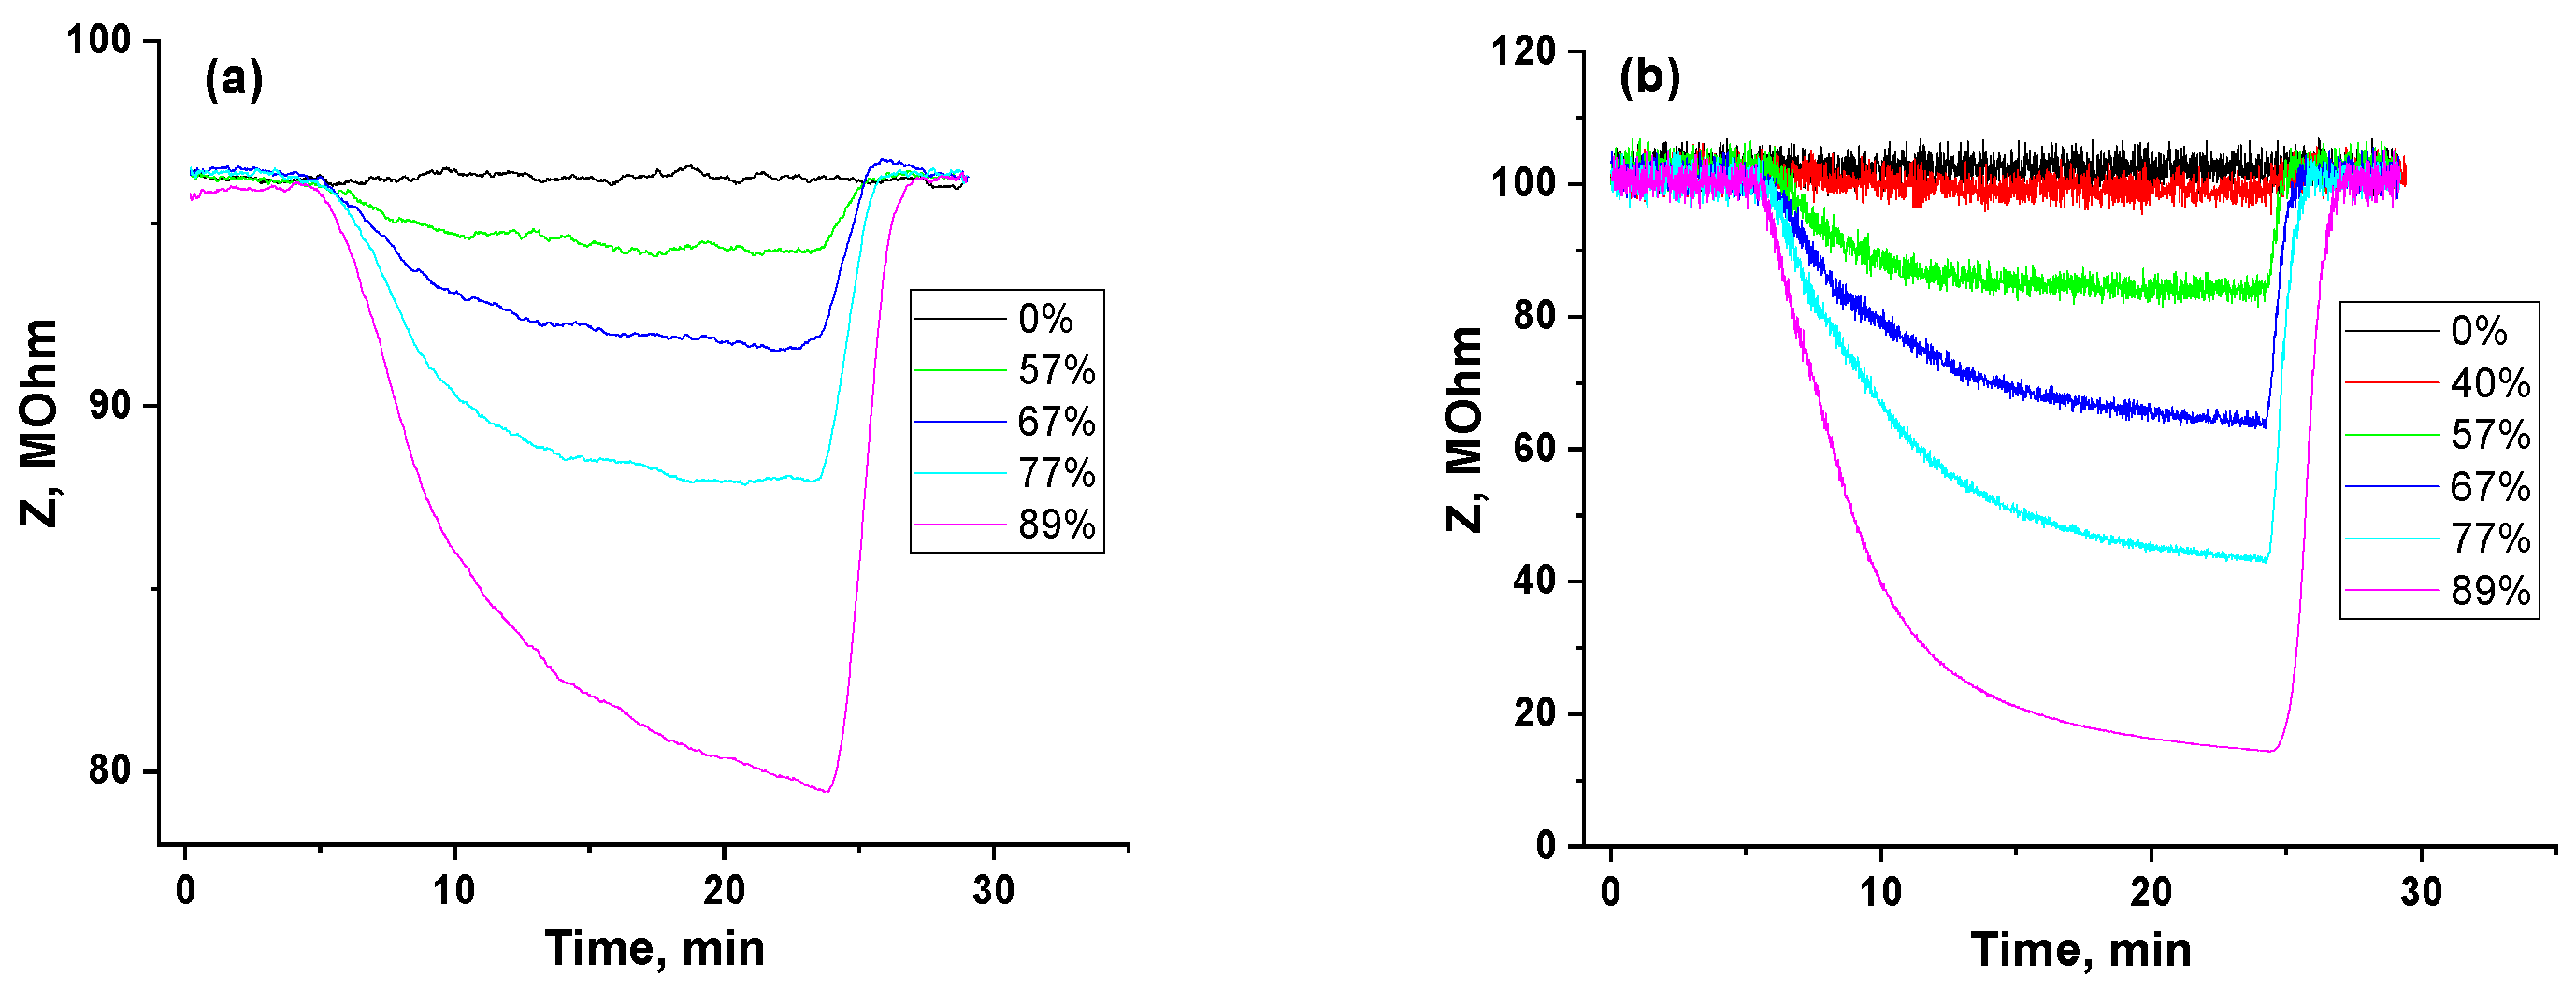
In the next stage, the sensor response dependence of Schwartz and Gyroid structure on the thickness of the sensing layer was investigated. Figure 6a,b shows the sensor S1 and S2 response variations. After water vapor exposure, the sensor response values were 1.18 for S1 under 57 RH%, 1.33 for S1, and 1.03 for S2 under 67 RH%. Nevertheless, under 77 RH%, the sensor response values were 1.57 for S1 and 1.1 for S2, and, in the presence of 89 RH%, they reached 2.84 for S1 and 1.36 for S2.
Figure 7a,b shows that, at 57% RH, the sensor response was 1.02 for G1 and 1.22 for G2; at 67% RH, it was 1.05 for G1 and 1.59 for G2. When the humidity increased to 77% RH, the sensor response values enhanced to 1.1 for G1 and 2.33 for G2. Furthermore, under 89% RH, the response values peaked at 1.21 for G1 and 7 for G2. It was found that, as the RH% increased, the impedance value of all sensors decreased. The sensors had high resistance values under low RH values because only a limited amount of water molecules were adsorbed. In contrast, the sensors adsorbed more water molecules under high RH values, causing their impedance to decrease significantly.
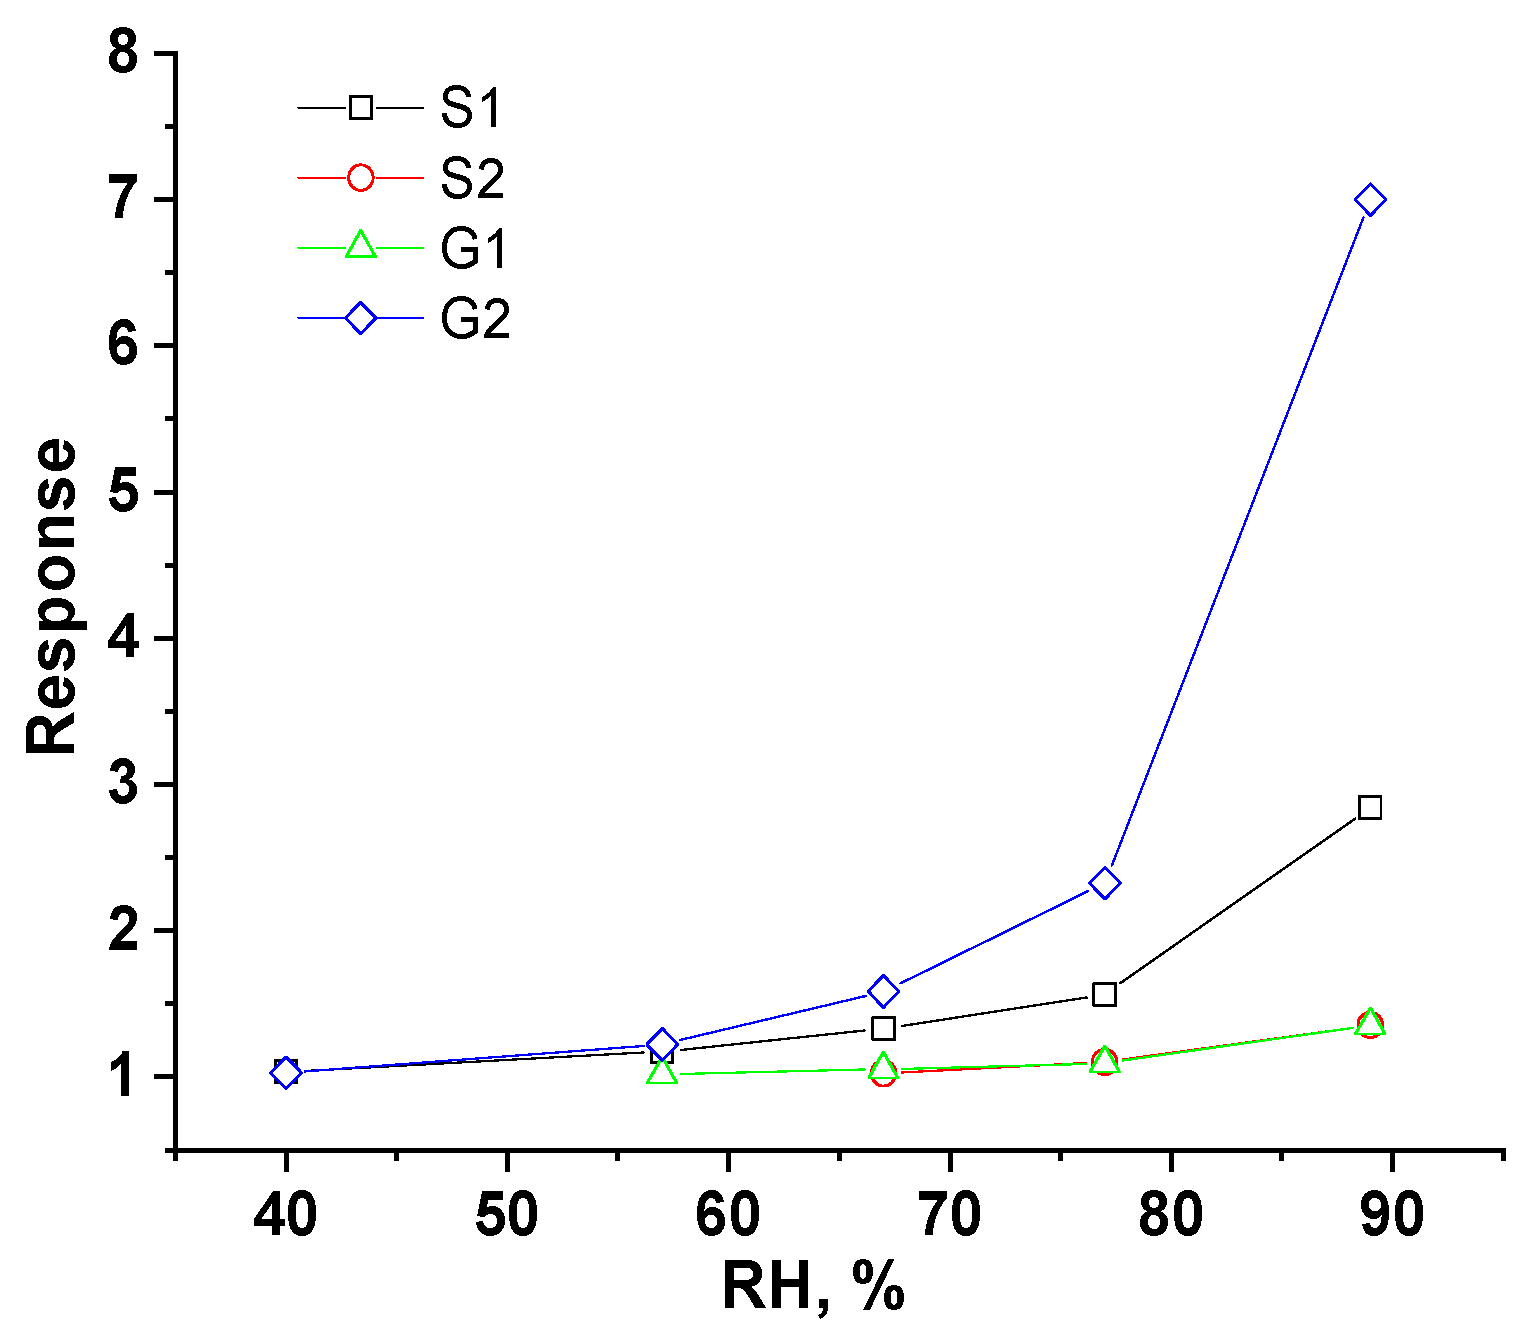
Comparing the performance of the sensors under 89% humidity (see Figure 8), S1 shows a 2.1 times higher sensor response as compared to S2 (2.84 and 1.36, respectively), whereas G2 shows a 5.8 times higher sensor response as compared to G1 (7 and 1.21, respectively). The sensors also had negligible hysteresis within the measurement error.
When looking at the response of sensors S2 and G1 (Figure 8), it can be noticed that there is apparently only a limited or no influence of the height and of the type of structure. On the contrary, the responses of sensors S1 and G2 are higher with respect to the previous ones, highlighting the importance of the mullite powder (Mf in this case).
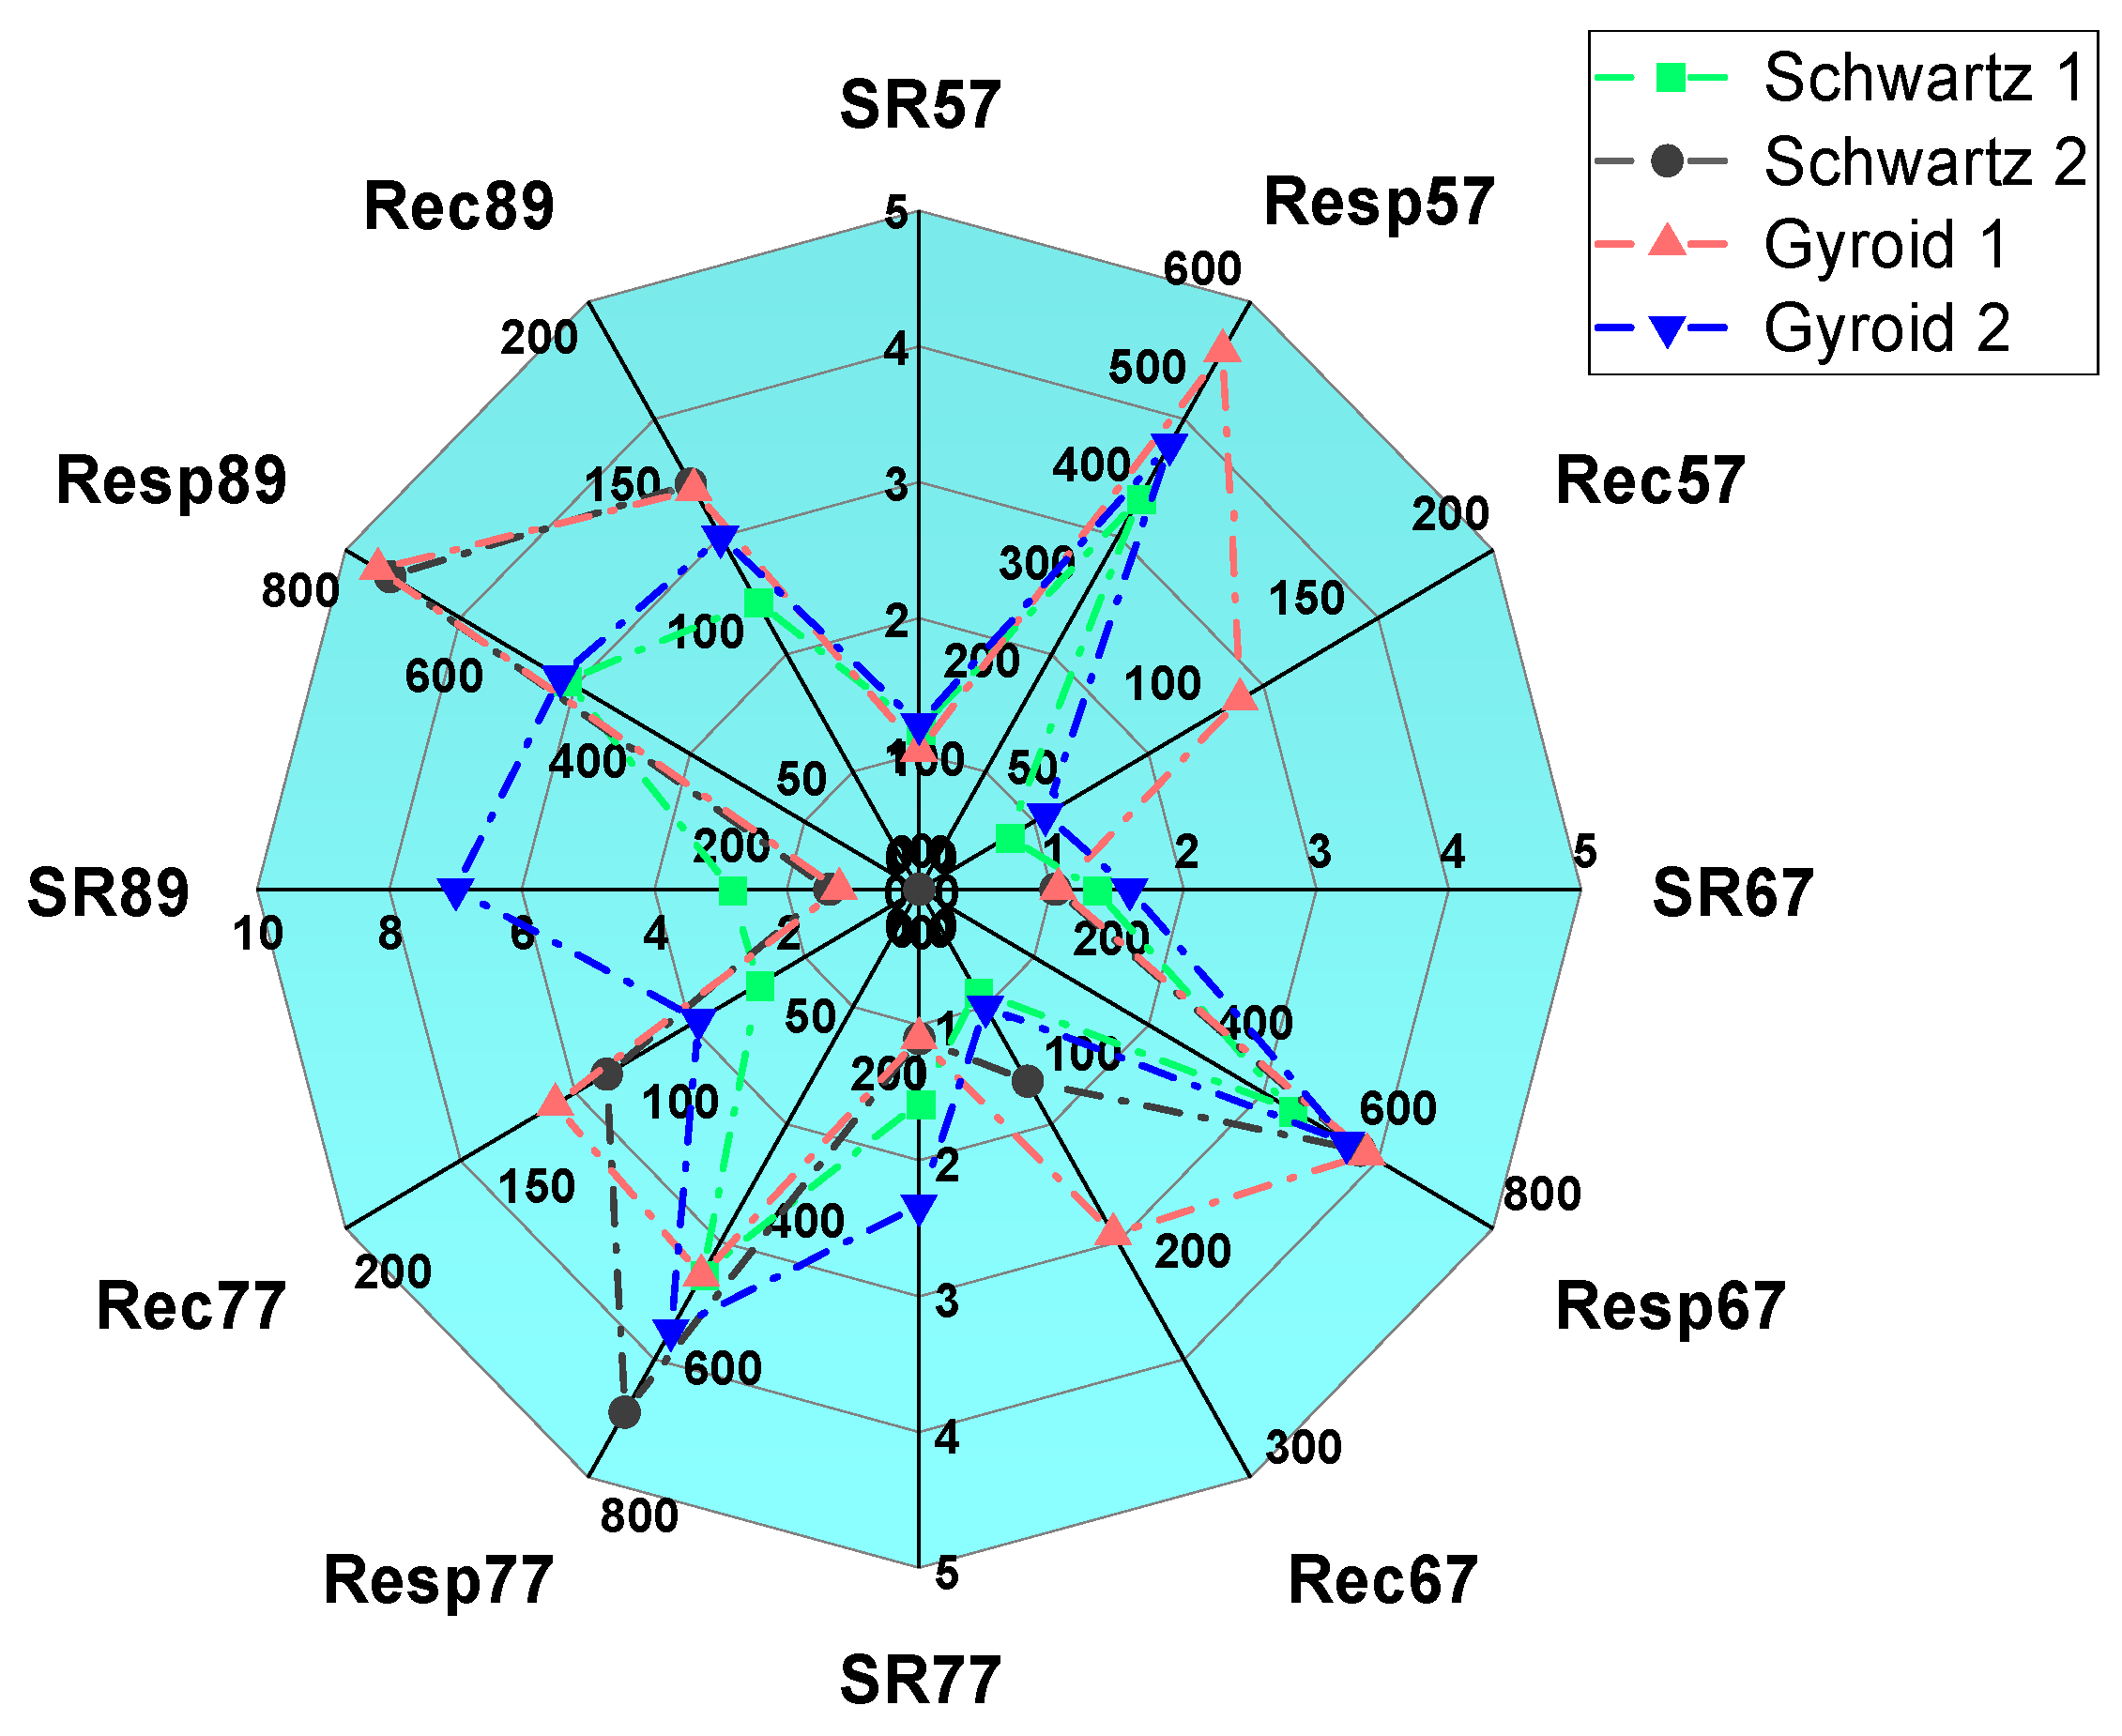
Table 3 and Figure 9 summarize the sensors’ response and response/recovery times at different humidity levels of the sensors S1, S2, G1, and G2. When the atmosphere switches from 89 RH%, and vice versa, the response and recovery times of S2 (738 and 138 s, respectively) are longer than those of S1 (492 and 98 s, respectively). At the same time, the response and recovery times of G1 (755 and 136 s, respectively) are longer than those of G2 (501 and 120 s, respectively). These differences can be explained by the mullite architecture and pore size. In the case of the S2 and G1 structures, the lower sensor response and longer response/recovery times can be attributed to the difference in porosity between the printed mullite samples. The sintered mullite structures that were produced from the Mc powder have less open porosity (29% for Mc vs 32% for Mf), a smaller total pore area (0.5 m2/g for Mc vs 1 m2/g for Mf), and a bigger average pore diameter (0.87 μm for Mc vs 0.54 μm for Mf) (Table 2). The presence of capillary pores allows water condensation according to the Kelvin equation [3]:
r K = 2 γ M ρ R T l n ( P s P )
where rK is the Kelvin radius, P is the water vapor pressure, Ps is the water vapor pressure at saturation, γ, ρ, and M are the surface tension, density, and molar weight of water. Water condensation occurs in all pores with a radius up to rK at a certain temperature and water vapor pressure. The smaller the Kelvin radius, the more easily condensation happens. Then, the Mf samples with smaller pores favored water condensation, and this led to a greater drop in the impedance values.
Long response times are usually due to the difficult access of the sensing material surface, due to the tortuosity of pores, for the target gas molecules, while a stronger binding of gas molecules on the same surface is responsible for long recovery times. In this case, again, S2 and G1 sensors generally showed worse performances (Table 3). This was probably due to a more tortuous path of water molecules to adsorb on the Mc mullite pores with respect to the Mf ones.
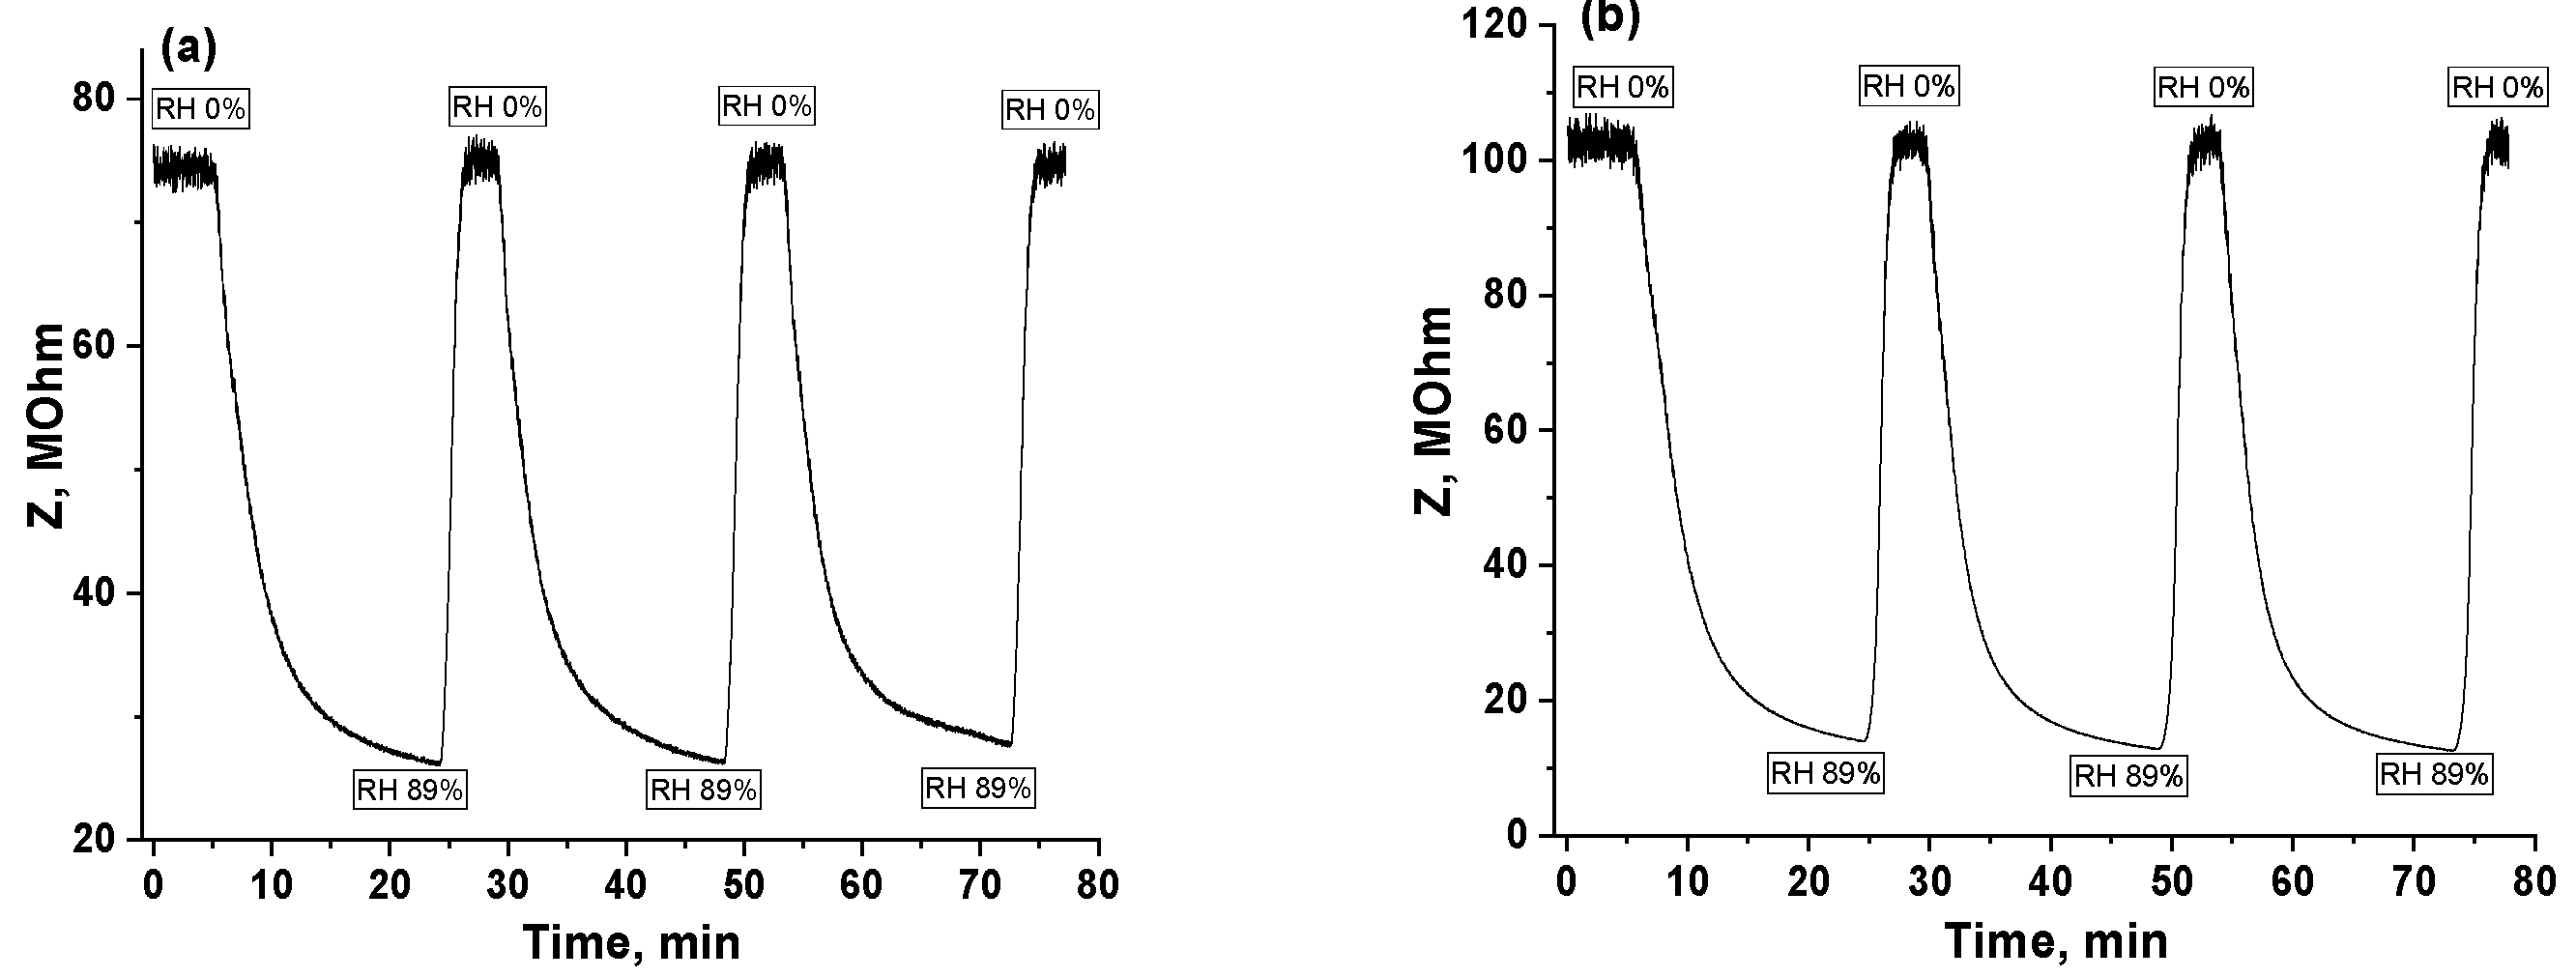
Repeatability is another important characteristic for evaluating the performance of the sensors. In Figure 10, three consecutive measurements on S1 and G2 sensors after three pulses under 89% RH, starting from dry air, are displayed. Both sensors showed good repeatability. The sensor response for S1 was 2.84, 2.86, and 2.71 for the first, second, and third cycles, respectively (for G2—7.00, 7.34, and 7.80, respectively).
The humidity sensing mechanism of the 3D printed mullite sensor is based on the surface protonic conduction. After exposure to the humidity, the 3D-printed mullite sensors’ impedance changes are influenced by the amount of adsorbed water molecules. With the increase in the humidity level, the impedance value decreases due to further water molecule adsorption [41,42].
In Ref. [43], copper ferrite-yttrium oxide nanocomposite humidity sensors were investigated. At low humidity levels, OH ions were chemisorbed onto the positively charged metal cations of the sensing material and formed a first chemisorbed layer. As the humidity level increases, each water molecule binds to two neighbouring hydroxyl groups through hydrogen bonds, forming the first physisorbed layer. As relative humidity increases further in the second layer, H3O+ is formed through those molecules that are singly bound to the underlying layer. Then, the hydronium group releases a proton to a neighboring water molecule, which accepts it while releasing another proton, and so on. This process is called a Grotthuss chain reaction [44].
2 H 2 O     H 3 O + + O H
H 2 O + H 3 O +     H 3 O + + H 2 O
At higher humidity levels, the water molecules condense in pores, and electrolytic conduction can take place at the same time [3].
Tests were also performed under methane 100 ppm, nitrogenous oxide 2.5 ppm, carbon dioxide 500 ppm, and ammonia 44 ppm at room temperature. The exposure time was 5 min, and no interferences towards the investigated gases were noticed.
Table 4 illustrates the results of the recent literature data (of the last five years) on resistive ceramic oxide humidity sensors. The tested sensors show interesting performances. The performance can probably be further improved through targeted sensitization.

4. Conclusions

In this article, the 3D printing technology was used to produce mullite humidity sensors with two types of TPMS structure (Schwartz and Gyroid structures). Sensors were sintered at 1450 °C and tested from 0% to 89% relative humidity at RT.
At room temperature, the impedance value dropped from 75 MΩ under dry air to 26 MΩ under 89 RH% for the Schwartz 1 structure (from 132 MΩ to 98 MΩ for the Schwartz 2 structure) and from 96 MΩ under dry air to 79 MΩ for the Gyroid 1 structure (from 101 MΩ to 14 MΩ for the Gyroid 2 structure). The results showed that, at 89% RH, the best response of the sensors was achieved for the Gyroid 2 structure. When the RH level changed from 0% to 89%, the best response times were equal to 492 s for Schwartz 1 and 501 s for Gyroid 2, whereas the recovery times were equal to 98 s for Schwartz 1 and 120 s for Gyroid 2. There was apparently only a limited or no influence of the height and of the type of 3D structure. On the contrary, the response of sensors S1 and G2 was higher with respect to the previous ones, highlighting the importance of the mullite powder (Mf in this case) and the porosity.
The sensors exhibited good repeatability. In addition, the tests carried out for NO2 (2.5 ppm in the air), CO2 (500 ppm in the air), CH4 (100 ppm in the air), and NH3 (44 ppm in the air) under the same flow rate showed no interference.
In this work, we showed the possibility of producing the three-dimensional-printed complex mullite structures based on TPMS and their use as resistive ceramic humidity sensors. The design of the sensors should be optimized to print flat surfaces on the top and at the bottom of the Gyroid and the Schwartz structures, where brush electrodes, for example, in place of the aluminum tape, were used in this work. Another optimization method is to keep the TPMS architecture but to use another sensing material, for example, ZnO. In any case, one of the possible applications of the proposed sensors is the use for humidity detection in soils where high values of humidity are present. Mullite is already used as the porous tip of tensiometers for soil moisture determination and could be a good candidate for this aim. Due to their thermal and chemical stability, it is also possible to use the proposed sensors in harsh environments.

Author Contributions

Conceptualization, Y.M., P.P. and J.-M.T.; methodology, A.B., Y.M. and B.C.; software, A.B. and Y.M.; validation, J.-M.T., B.C. and P.P.; formal analysis, J.-M.T.; investigation, A.B. and Y.M.; data curation, A.B. and Y.M.; writing—original draft preparation, Y.M.; writing—review and editing, All authors; supervision, J.-M.T. and P.P.; All authors have read and agreed to the published version of the manuscript.

Funding

This research received no external funding.

Institutional Review Board Statement

Not applicable.

Informed Consent Statement

Not applicable.

Data Availability Statement

The data presented in this study are available on request from the corresponding author.

Conflicts of Interest

The authors declare no conflicts of interest.

References

  1. Tulliani, J.-M.; Inserra, B.; Ziegler, D. Carbon-Based Materials for Humidity Sensing: A Short Review. Micromachines 2019, 10, 232. [Google Scholar] [CrossRef] [PubMed]
  2. Korotcenkov, G. Handbook of Gas Sensor Materials, Properties, Advantages and Shortcomings for Applications, Volume 2: New Trends and Technologies; Springer: Berlin/Heidelberg, Germany, 2014. [Google Scholar]
  3. Traversa, E. Ceramic sensors for humidity detection: The state-of-the-art and future developments. Sens. Actuators B 1995, 23, 135–156. [Google Scholar] [CrossRef]
  4. Sajid, M.; Khattak, Z.J.; Rahman, K.; Hassan, G.; Choi, K.H. Progress and future of relative humidity sensors: A review from materials perspective. Bull. Mater. Sci. 2022, 45, 238. [Google Scholar] [CrossRef]
  5. Tulliani, J.-M.; Baroni, C.; Zavattaro, L.; Grignani, C. Strontium-Doped Hematite as a Possible Humidity Sensing Material for Soil Water Content Determination. Sensors 2013, 13, 12070–12092. [Google Scholar] [CrossRef] [PubMed]
  6. Korotcenkov, G. Handbook of Gas Sensor Materials, Properties, Advantages and Shortcomings for Applications, Volume 1: Conventional Approaches; Springer: Berlin/Heidelberg, Germany, 2013; pp. 389–408. [Google Scholar]
  7. Fraden, J. Handbook of Modern Sensors. Physics, Designs and Applications, 5th ed.; Springer: Berlin/Heidelberg, Germany, 2016; pp. 507–524. [Google Scholar]
  8. Kuzubasoglu, B.A. Recent Studies on the Humidity Sensor: A Mini Review. ACS Appl. Electron. Mater. 2022, 4, 4797–4807. [Google Scholar] [CrossRef]
  9. Qi, P.; Xu, Z.; Zhang, T. In Situ Growth of Dopamine on QCM for Humidity Detection. Chemosensors 2022, 10, 522. [Google Scholar] [CrossRef]
  10. Zhang, M.; Duan, Z.; Yuan, Z.; Jiang, Y.; Tai, H. Observing Mixed Chemical Reactions at the Positive Electrode in the High-Performance Self-Powered Electrochemical Humidity Sensor. ACS Nano 2024, 18, 34158–34170. [Google Scholar] [CrossRef]
  11. Ateia, E.E.; Arman, M.M.; Morsy, M. Synthesis, characterization of NdCoO3 perovskite and its uses as humidity sensor. Appl. Phys. A 2019, 125, 883. [Google Scholar] [CrossRef]
  12. Dhariwal, N.; Yadav, P.; Kumari, M.; Jain, P.; Sanger, A.; Kumar, V.; Thakur, O.P. Iron oxide-based nanoparticles for fast-response humidity sensing, real-time respiration monitoring, and noncontact sensing. IEEE Sens. J. 2023, 23, 22217–22224. [Google Scholar] [CrossRef]
  13. Li, J.; Ling, W.; Wen, S.; Nie, H.; Li, J. Performance analysis of Fe2O3/CNT humidity sensor based on adsorption kinetics and DFT computations. Ceram. Int. 2024, 50, 7239. [Google Scholar] [CrossRef]
  14. Pathan, A.S.; Gapale, D.L.; Bhosale, S.V.; Landge, A.S.; Jadkar, S.R.; Arote, S.A. Studies on resistive-type humidity sensing properties of copper-zinc mixed metal oxide nanostructures. Inorg. Chem. Commun. 2023, 153, 110824. [Google Scholar] [CrossRef]
  15. Kumar, A.; Kumari, P.; Kumar, M.S.; Gupta, G.; Shivagan, D.D.; Bapna, K. SnO2 nanostructured thin film as humidity sensor and its application in breath monitoring. Ceram. Int. 2023, 49, 24911–24921. [Google Scholar] [CrossRef]
  16. Pascariu, P.; Tudorache, F.; Romanitan, C.; Serban, A.B.; Koudoumas, E. 1% lanthanide-doped ZnO nanostructures as a versatile approach for state-of-the-art capacitive and resistive humidity sensors. Ceram. Int. 2025, in press. [Google Scholar] [CrossRef]
  17. Burman, D.; Choudhary, D.S.; Guha, P.K. ZnO/MoS2-based enhanced humidity sensor prototype with android app interface for mobile platform. IEEE Sens. J. 2019, 19, 3993–3999. [Google Scholar] [CrossRef]
  18. Angadi, V.J.; Tudorache, F.; Ubaidullah, M.; Pandit, B.; Manjunatha, S.O.; Wang, S. Role of holmium on the humidity sensing properties of the CoCr2O4 ceramics for possible applications in humidity sensors. J. Mater. Sci. Mater. Electron. 2023, 34, 1583. [Google Scholar] [CrossRef]
  19. Manjunatha, K.; Ho, M.K.; Hsu, T.E.; Kumar, A.; Wu, S.Y.; Hardi, S.S.; Chethan, B.; Prasad, V.; Pandit, B.; Ubaidullah, M.; et al. Structure, microstructure, and enhanced sensing behavior of nickle ferrite-cobalt chromate for humidity sensor applications. J. Mater. Sci. Mater. Electron. 2024, 35, 471. [Google Scholar] [CrossRef]
  20. Hiremath, V.G.; Yahia, I.S.; Zahran, H.Y.; Chethan, B.; Malimath, G.H.; Ravikiran, Y.T.; Angadi, V.J. Humidity sensing behaviour of Rubidium-doped Magnesium ferrite for sensor applications. J. Mater. Sci. Mater. Electron. 2022, 33, 11591–11600. [Google Scholar] [CrossRef]
  21. Duan, Z.; Zhao, Q.; Wang, S.; Huang, Q.; Yuan, Z.; Zhang, Y.; Jiang, Y.; Tai, H. Halloysite nanotubes: Natural, environmental-friendly and low-cost nanomaterials for high-performance humidity sensor. Sens. Actuators B Chem. 2020, 317, 128204. [Google Scholar] [CrossRef]
  22. Duan, Z.; Zhao, Q.; Wang, S.; Yuan, Z.; Zhang, Y.; Li, X.; Wu, Y.; Jiang, Y.; Tai, H. Novel application of attapulgite on high performance and low-cost humidity sensors. Sens. Actuators B Chem. 2020, 305, 127534. [Google Scholar] [CrossRef]
  23. Duan, Z.; Jiang, Y.; Zhao, Q.; Wang, S.; Yuan, Z.; Zhang, Y.; Liu, B.; Tai, H. Facile and low-cost fabrication of a humidity sensor using naturally available sepiolite nanofibers. Nanotechnology 2020, 31, 355501. [Google Scholar] [CrossRef]
  24. Al-Ketan, O.; Lee, D.; Rowshan, R.; Al-Rub, R.K.A. Functionally graded and multi-morphology sheet TPMS lattices: Design, manufacturing, and mechanical properties. J. Mech. Behav. Biomed. Mater. 2020, 102, 103520. [Google Scholar] [CrossRef] [PubMed]
  25. Feng, J.; Fu, J.; Yao, X.; He, Y. Triply periodic minimal surface (TPMS) porous structures: From multi-scale design, precise additive manufacturing to multidisciplinary applications. Int. J. Extrem. Manuf. 2022, 4, 022001. [Google Scholar] [CrossRef]
  26. Ngo, T.D.; Kashani, A.; Imbalzano, G.; Nguyen, K.T.Q.; Hui, D. Additive manufacturing (3D printing): A review of materials, methods, applications and challenges. Compos. B Eng. 2018, 143, 172–196. [Google Scholar] [CrossRef]
  27. Chen, Z.; Li, Z.; Li, J.; Liu, C.; Lao, C.; Fu, Y.; Liu, C.; Yang, L.; Wang, P.; Yi, H. 3D printing of ceramics: A review. J. Eur. Ceram. Soc. 2019, 39, 661–687. [Google Scholar] [CrossRef]
  28. Zhou, S.X.; Yao, L.; Zhao, T.; Mei, H.; Cheng, L.F.; Zhang, L.T. Ti doped SiOC precursor to activate gyroid sensing structures. Carbon 2022, 196, 253–263. [Google Scholar] [CrossRef]
  29. Peng, K.; Yu, T.; Wu, P.; Chen, M. Piezoresistive Porous Composites with Triply Periodic Minimal Surface Structures Prepared by Self-Resistance Electric Heating and 3D Printing. Sensors 2024, 24, 2184. [Google Scholar] [CrossRef]
  30. Fortunato, M.; Pacitto, L.; Pesce, N.; Tamburrano, A. 3D-Printed Graphene Nanoplatelets/Polymer Foams for Low/Medium-Pressure Sensors. Sensors 2023, 23, 7054. [Google Scholar] [CrossRef]
  31. Imanian, M.E.; Kardan-Halvaei, M.; Nasrollahi, F.; Imanian, A.; Montazerian, H.; Nasrollahi, V. 3D printed flexible wearable sensors based on triply periodic minimal surface structures for biomonitoring applications. Smart Mater. Struct. 2022, 32, 015015. [Google Scholar] [CrossRef]
  32. Davoodi, E.; Montazerian, H.; Haghniaz, R.; Rashidi, A.; Ahadian, S.; Sheikhi, A.; Chen, J.; Khademhosseini, A.; Milani, A.S.; Hoorfar, M.; et al. 3D-Printed Ultra-Robust Surface-Doped Porous Silicone Sensors for Wearable Biomonitoring. ACS Nano 2020, 14, 1520–1532. [Google Scholar] [CrossRef]
  33. Han, J.; Li, Z.; Kong, S.; Tang, S.; Feng, D.; Li, B. Wide-response-range and high-sensitivity piezoresistive sensors with triple periodic minimal surface (TPMS) structures for wearable human-computer interaction systems. Compos. Part B Eng. 2024, 287, 111840. [Google Scholar] [CrossRef]
  34. Sintered Mullite—Jiangsu Jingxin New Materials Co., Ltd. Available online: https://www.jxrefractory.com/product/sintered-mullite.html?gad_source=1&gad_campaignid=21462533965&gclid=EAIaIQobChMI3aax6oWMjQMVul8PAh0xLCiyEAAYASAAEgIt0PD_BwE (accessed on 19 April 2025).
  35. ITOCHU—Synthetic Mullite. 2024. Available online: https://www.itc-cera.co.jp/english/prod/prod04.html (accessed on 15 January 2025).
  36. Bertero, A.; Coppola, B.; Milovanov, Y.; Palmero, P.; Schmitt, J.; Tulliani, J.-M. DLP 3D-printed mullite ceramics for the preparation of MOFs functionalized monoliths for CO2 capture. Ceramics 2024, 7, 1810–1835. [Google Scholar] [CrossRef]
  37. Montanaro, L.; Tulliani, J.M.; Perrot, C.; Negro, A. Sintering of Industrial Mullites. J. Eur. Ceram. Soc. 1997, 11, 1715–1723. [Google Scholar] [CrossRef]
  38. Bertero, A.; Schmitt, J.; Kaper, H.; Coppola, B.; Palmero, P.; Tulliani, J.-M. MOFs functionalization of 3D printed mullite complex architectures for CO2 capture. Appl. Mater. Today 2024, 40, 102407. [Google Scholar] [CrossRef]
  39. Bertero, A.; Coppola, B.; Schmitt, J.; Gimello, O.; Trens, P.; Palmero, P.; Tulliani, J.-M. 3D printed mullite monoliths with triply periodic minimal surface (TPMS) architectures functionalized with HKUST-1 for CO2 capture. Microporous Mesoporous Mater. 2025, 390, 113601. [Google Scholar] [CrossRef]
  40. Di Francia, E.; Guzmán, H.; Pugliese, D.; Hernández, S.; Tulliani, J.M. Nanostructured Cu/Zn/Al-based oxide as a new sensing material for NO2 detection. Sens. Actuators B Chem. 2024, 420, 136456. [Google Scholar] [CrossRef]
  41. Milovanov, Y.; Bertero, A.; Coppola, B.; Palmero, P.; Tulliani, J.-M. Mullite 3D Printed Humidity Sensors. Ceramics 2024, 7, 807–820. [Google Scholar] [CrossRef]
  42. Shooshtari, M.; Salehi, A.; Vollebregt, S. Effect of Humidity on Gas Sensing Performance of Carbon Nanotube Gas Sensors Operated at Room Temperature. IEEE Sens. J. 2020, 21, 5763–5770. [Google Scholar] [CrossRef]
  43. Reddy, L.B.; Megha, R.; Prakash, H.R.; Ravikiran, Y.T.; Ramana, C.H.V.V.; Kumari, S.V.; Kim, D. Copper ferrite yttrium oxide (CFYO) nanocomposite as remarkable humidity sensor. Inorg. Chem. Commun. 2019, 99, 180–188. [Google Scholar] [CrossRef]
  44. Chen, Z.; Lu, C. Humidity Sensors: A Review of Materials and Mechanisms. Sens. Lett. 2005, 3, 274–295. [Google Scholar] [CrossRef]
  45. Milovanov, Y.; Dadkhah, M.; Afify, A.S.; Tulliani, J. Copper-Substituted Calcium Orthophosphate (CaxCu1−x)HPO4·nH2O for Humidity Detection. Crystals 2025, 15, 153. [Google Scholar] [CrossRef]
  46. Doroftei, C.; Leontie, L. Porous nanostructured gadolinium aluminate for high-sensitivity humidity sensors. Materials 2021, 14, 7102. [Google Scholar] [CrossRef] [PubMed]
  47. Jiang, W.; Su, M.; Zheng, Y.; Fei, T. Efficient electron transfer through interfacial water molecules across two-dimensional MoO3 for humidity sensing. ACS Appl. Mater. Interfaces 2024, 16, 7406–7414. [Google Scholar] [CrossRef] [PubMed]
  48. Huang, S.; Shan, H.; Zhao, Y.; Ren, Y.; Gu, X. Preparation of humidity sensors based on CsPbBr3 quantum dots for applications in microcrack detection. Chin. J. Inorg. Chem. 2024, 40, 383–393. [Google Scholar]
  49. Sekulić, D.L.; Ivetić, T.B. Characterization of an Impedance-Type Humidity Sensor Based on Porous SnO2/TiO2 Composite Ceramics Modified with Molybdenum and Zinc. Sensors 2023, 23, 8261. [Google Scholar] [CrossRef]
  50. Malik, P.; Duhan, S.; Malik, R. A high-performance humidity sensor based on 3D porous SnO2-encapsulated MCM-48 for real-time breath monitoring and contactless gesture detection. Mater. Adv. 2024, 5, 2510–2525. [Google Scholar] [CrossRef]
  51. Khan, A.; Hussain, S.T.; Naeem, A.; Sadiqa, A.; Ahmad, A.; Shehzada, M.A.A.; Albaqami, M.D. Next-generation calcium oxide nanoparticles: A breakthrough in energy storage and humidity sensing. Results Chem. 2025, 14, 102073. [Google Scholar] [CrossRef]
  52. Burman, D.; Santra, S.; Pramank, P.; Guha, P. Pt decorated MoS2 nanoflakes for ultrasensitive resistive humidity sensor. Nanotechnology 2018, 29, 115504. [Google Scholar] [CrossRef]
  53. Kassas, A.; Zahwa, I.; Hussein, B.; Bernard, J.; Lelièvre, C.; Mouyane, M.; Noudem, J.; Houivet, D. Enhanced humidity sensing performance of LiF-doped MgTiO3 ceramics via spark plasma sintering. Heliyon 2024, 10, e33999. [Google Scholar] [CrossRef]
  54. Angadi, V.J.; Batoo, K.M.; Hussain, S.V.; Lakshmiprasanna, H.R.; Manjunatha, K.S.; Manjunatha, O. Role of Superparamagnetic Nanoparticles in Humidity Sensing Behavior of Holmium doped Manganese-Bismuth ferrites for Relative Humidity Sensor applications. J. Mater. Sci. Mater. Electron. 2022, 33, 24308–24320. [Google Scholar] [CrossRef]
  55. Swathi, K.M.; Chethan, B.; Kiran, B.; Kumar, A.; Nadaf, S.; Laxmeshwar, S.S.; Savanur, H.M.; Al-Enizi, A.M.; Ubaidullah, M.; Pandit, B.; et al. Enhanced sensing response of Cd2+ substitution cobalt chromate ceramics for humidity sensors. J. Mater. Sci. Mater. Electron. 2024, 35, 179. [Google Scholar] [CrossRef]
  56. Hiremath, V.G.; Malimath, G.H.; Chethan, B.; Abd EL-Gawaad, N.S.; Abdallah, S.A.O.; Angadi, V.J. Enhanced humidity sensing stability of Dy3+-doped Mg-Rb ferrites for room temperature operatable humidity sensor applications. J. Mater. Sci. Mater. Electron. 2023, 34, 1537. [Google Scholar] [CrossRef]
  57. Laxmeshwar, S.S.; Kulkarni, S.S.; Nadaf, S.; Swathi, K.M.; Savanur, H.M.; Chethan, B.; Prasad, V.; Angadi, V.J.; Ubaidullah, M.; Pandit, B.; et al. Observation of enhanced sensing response and recovery time of lutetium-doped zinc ferrite ceramics for humidity sensor application. J. Mater. Sci. Mater. Electron. 2023, 34, 2038. [Google Scholar] [CrossRef]
  58. Reddy, L.P.B.; Prakash, H.G.R.; Ravikiran, Y.T.; Ganiger, S.K.; Angadi, V.J. Structural and humidity sensing properties of niobium pentoxide-mixed nickel ferrite prepared by mechano-chemical mixing method. J. Mater. Sci. Mater. Electron. 2020, 31, 21981–21999. [Google Scholar] [CrossRef]
  59. Veena, V.S.; Amith Yadav, H.J.; Pasha, A.; Angadi, V.J.; Ubaidullah, M.; Shaikh, S.F.; Pandit, B. Role of post-transition metal (Bi2O3) on the structural, microstructural and humidity sensing behavior of Bi@Zinc ferrites composite for room temperature operatable humidity sensors. J. Mater. Sci. Mater. Electron. 2023, 34, 992. [Google Scholar] [CrossRef]
  60. Hasan, S.; Azhdar, B. NiFe2O4 and ZnFe2O4 nanoparticles synthesis by sol-gel auto-combustion for humidity sensor applications. J. Sol-Gel Sci. Technol. 2023, 105, 416–429. [Google Scholar] [CrossRef]
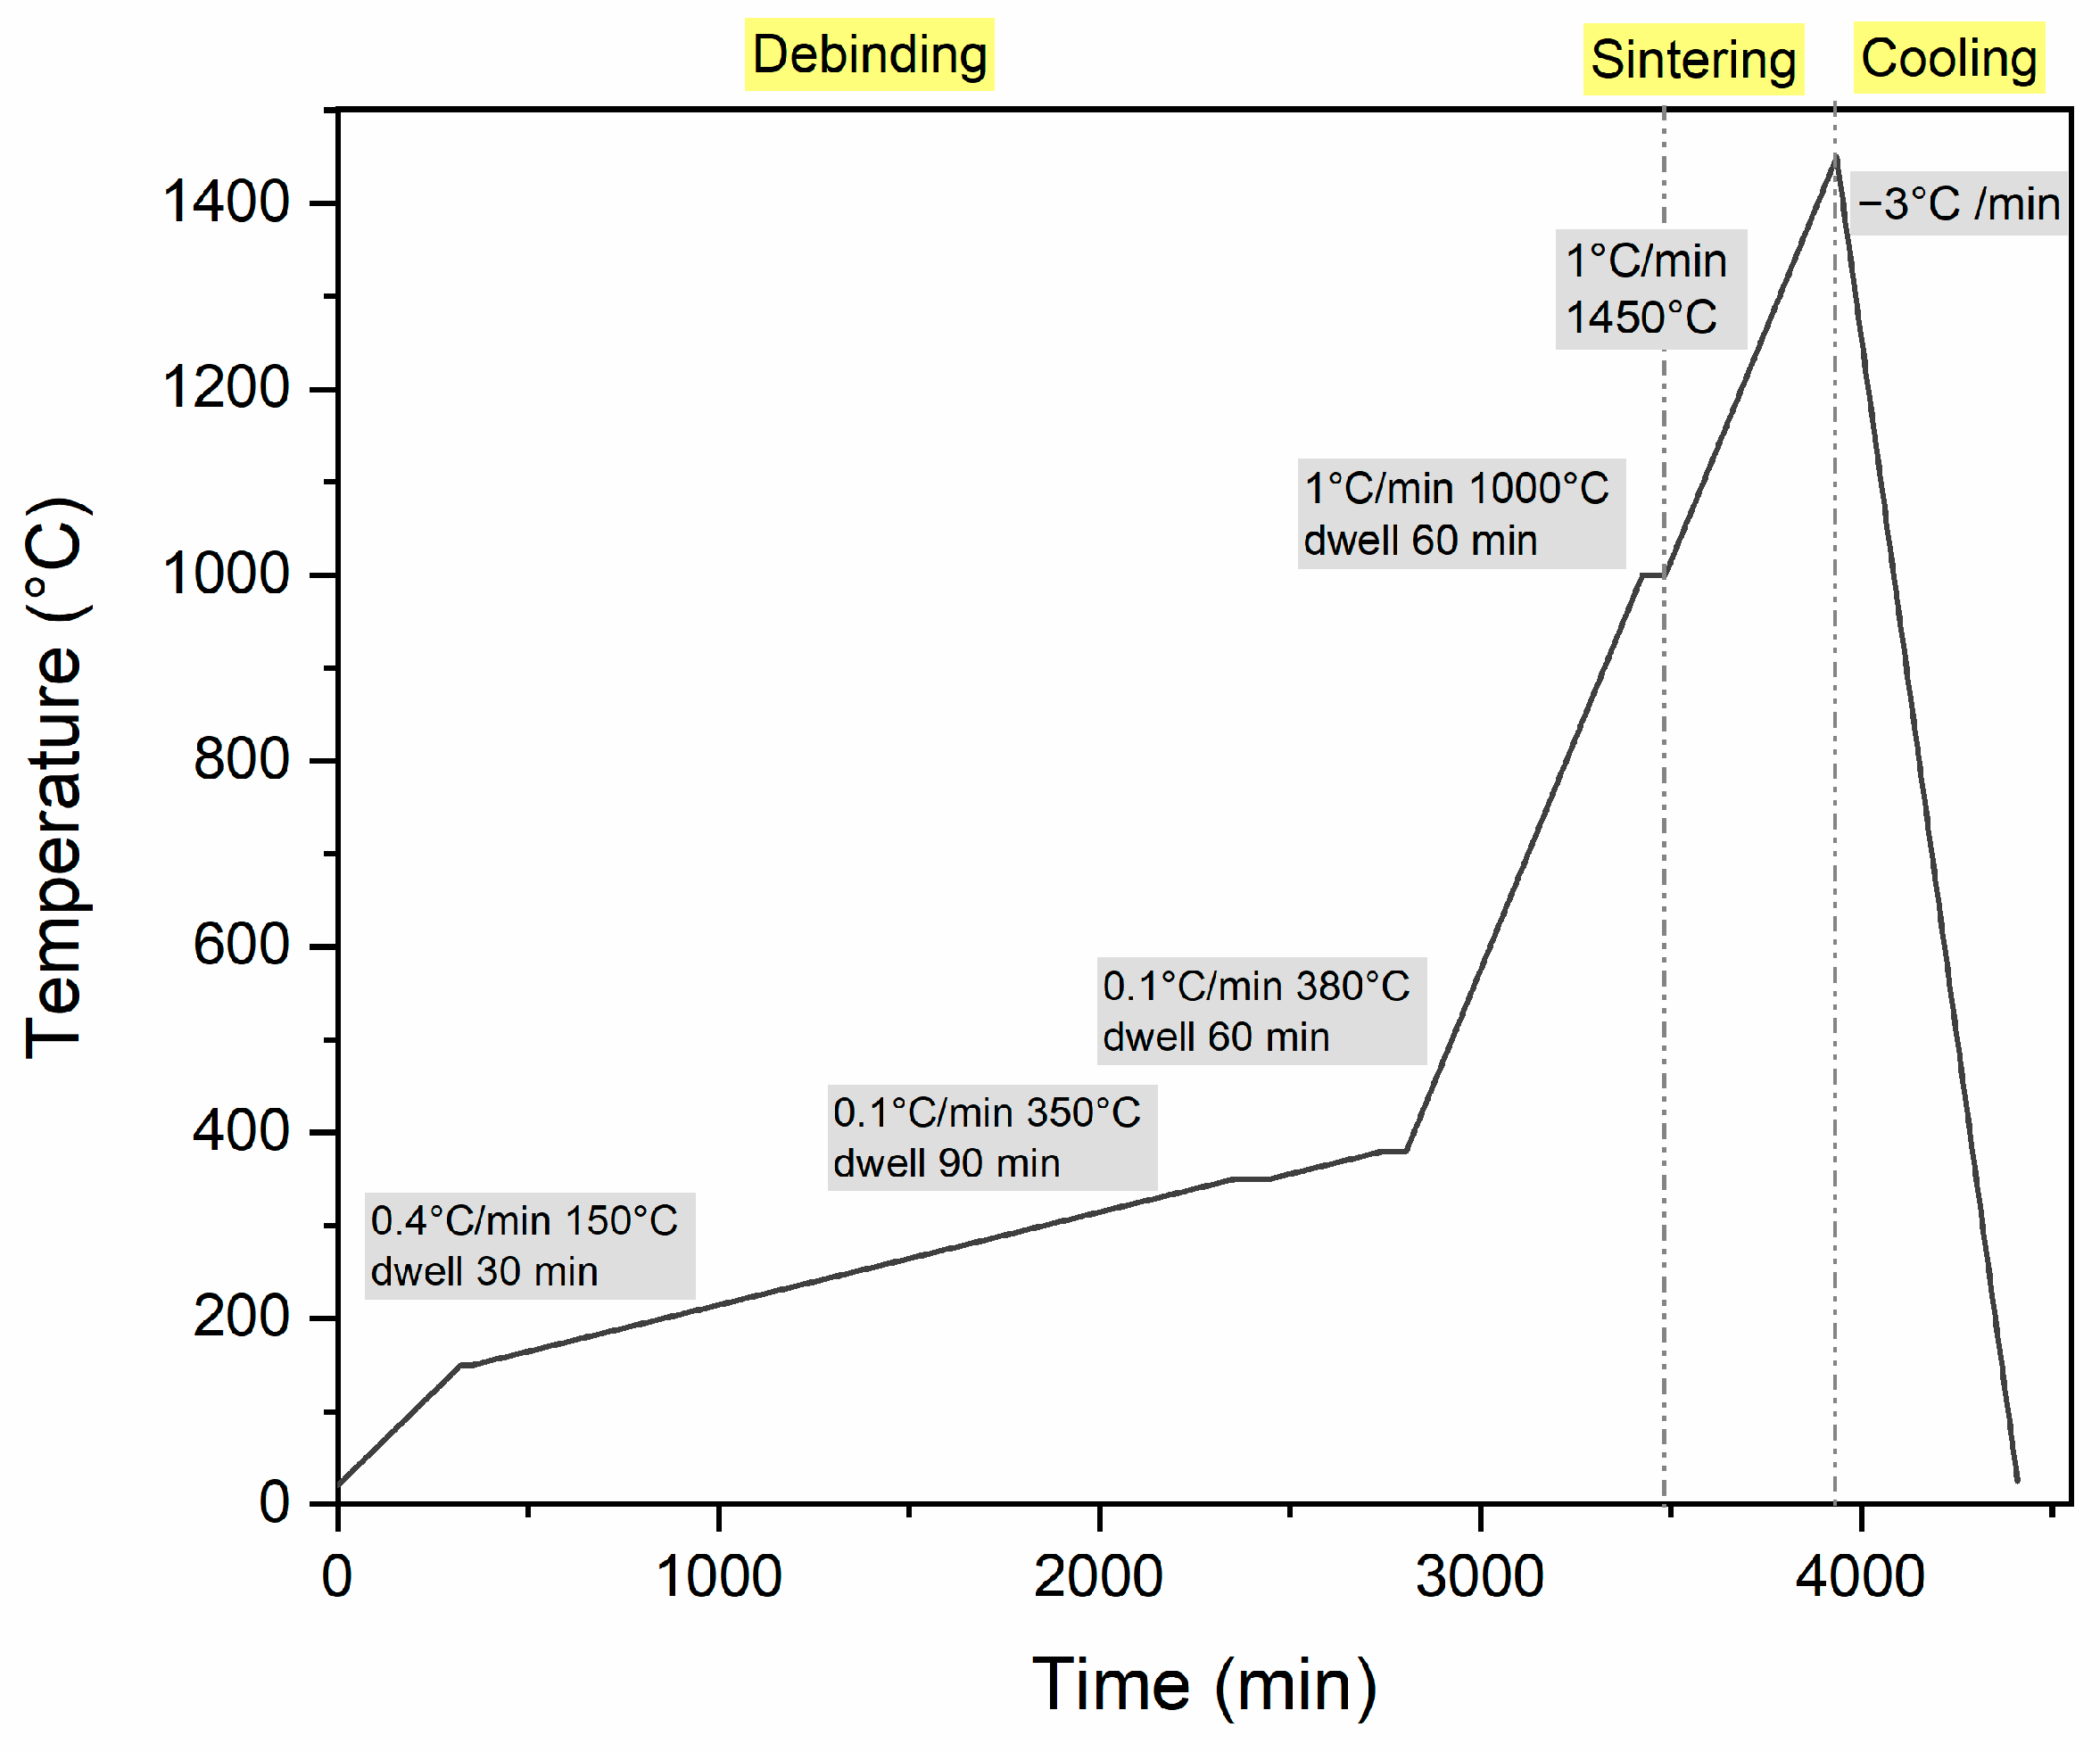
Figure 1. Schematic diagram of thermal debinding and sintering cycle.
Chemosensors 13 00168 g001
Figure 2. FE-SEM micrographs of the pressed pellets sintered at 1450 °C: (A) Mc and (B) Mf.
Chemosensors 13 00168 g002
Figure 3. Scheme of the laboratory system for gas sensors testing. Reprinted with permission from reference [40].
Chemosensors 13 00168 g003
Figure 4. Optical micrograph of the 3D printed mullite structures (scale in mm): (a) Schwartz and (b) Gyroid; (c)-schematic illustration of the sensor structure with aluminum tape as upper and lower electrodes.
Chemosensors 13 00168 g004
Figure 5. Sensor response as a function of relative humidity value for S1, S2, G1, and G2 under 89% RH starting from dry air.
Chemosensors 13 00168 g005
Figure 6. Impedance variation as a function of relative humidity value for 3D printed mullite sensors: (a) S1, (b) S2.
Chemosensors 13 00168 g006
Figure 7. Impedance variation as a function of relative humidity value for 3D printed mullite sensors: (a) G1, (b) G2.
Chemosensors 13 00168 g007
Figure 8. Response of sensors S1, S2, G1, and G2 at different RH values (in the range 40–89% RH).
Chemosensors 13 00168 g008
Figure 9. Radar plot of sensors characteristics (SR57 = sensor response dry air—57% RH, Resp57 = response time dry air—57% RH, Rec57 = recovery time dry air—57% RH, SR67 = sensor response dry air—67% RH, Resp67 = response time dry air—67% RH, Rec67 = recovery time dry air—67% RH, SR77 = sensor response dry air—77% RH, Resp77 = response time dry air—77% RH, Rec77 = recovery time dry air—77% RH, SR89 = sensor response dry air—89% RH, Resp89 = response time dry air—89% RH, Rec89 = recovery time dry air—89% RH; for SR57, SR67, SR77 and SR89: the higher the values, the better, for resp57, resp67, resp77, resp89, rec57, rec67, rec77 and rec89: the lower the values, the better).
Chemosensors 13 00168 g009
Figure 10. Repeatability measurements of the mullite sensors S1 (a) and G2 (b) under 89% RH.
Chemosensors 13 00168 g010
Table 1. Ball-milling proportions in weight.
ComponentRatio Respect to Mullite
MgO1:99
Zirconia spheres6:1
Water2:1
Table 2. Average particle size (D50) values for Mf and Mc mullite powders, open porosity, total pore area, and average pore diameter determined by mercury intrusion porosimetry (MIP) for Mf and Mc pressed pellets sintered at 1450 °C.
PowderD50, μmOpen Porosity, %Total Pore Area, m2/gAverage Pore Diameter, μm
Mf4.432.01.00.54
Mc9.229.10.50.87
Table 3. The sensor’s response and response/recovery times at different humidity levels associated with 3D printed mullite sensors.
HumiditySensor Response (R = Zo/Zg)Response Time, sRecovery Time, s
S1S2G1G2S1S2G1G2S1S2G1G2
40%1.04 1.03
57%1.18 1.021.22399 55045431 11244
67%1.331.031.051.59518615625596529817660
77%1.571.101.102.335227125266005610912777
89%2.841.361.217.0049273875550198138136120
Table 4. Comparison of mullite sensor’s performance with results described in recent literature data on ceramic oxide humidity sensors.
MaterialSensor Response,
R = Zo/Zg
Response
Time, s
Recovery
Time, s
Reference
CuFe2O4-Y2O3 nanocomposite4895 at 97% RH923[43]
(Ca1-xCux)HPO4.nH2O x = 0 to 151,250 at 90% RH29283[45]
Nanosize α-Fe2O3 nanoparticles48,569 at 95% RH94[12]
GdAlO38000 at 97% RH4560[46]
CuO-ZnO nanostructureunder (25–90)% RH2916[14]
SnO2 thin film3.1 at 95% RH84576[15]
2D MoO34024 at 75% RH840[47]
1% (La, Ce, Pr, Nd and Sm):ZnO nanocompositesunder (22–97)% RH62–89∼300[16]
Perovskite CsPbBr3-Fe quantum dots1.1 at 70% RH3838[48]
SnO2/TiO2 modified with Mo and Zn∼ 100 at 85% RH1827[49]
Porous SnO2/MCM-48105 at 98% RH912[50]
CaO nanoparticlesunder (11–97)% RH79147[51]
Pt nanoparticles decorated MoS2 nanoflakes∼4000 at 85% RH92154[52]
Fe2O3/CNTunder (11–97)% RH1725[13]
ZnO/MoS2∼301 at 85% RH138166[17]
CoHoxCr2-xO x = 0.005 to 0.02∼102 at 85% RHNANA[18]
MgTiO3 doped with 2 wt% of LiF105 at 90% RHNANA[53]
Mn0.95Bi0.05Fe2-xHoxO4 x  =  0 to 0.03∼15 at 97% RH7991[54]
NiFe2O4/CoCr2O4∼10 under (11–97)% RH1015[19]
Co1-xCdxCr2O4 x  =  0 to 0.15∼24 under (11–99)% RH14.68.6[55]
NdCoO3∼50% under (11–97)% RH3NA[11]
Mg0.9Rb0.1DyxFe2-xO4 x = 0 to 0.03under (11–98)% RH1890[56]
MgxRb1−xFe2O4 x = 0.025 to 0.1∼18 at 97% RH2030[20]
ZnFe2 − xLuxo4 x = 0 to 0.7∼10 at 97% RH6.535.6[57]
(1−x) NiFe2O4 /(x) Nb2O5
x  =  0.10 to 0.5
1190 at 97% RH2030[58]
Bi@ZnFe2O4 x = 0 to 0.05∼6 at 97% RH7991[59]
NiFe2O44 at 90% RHNANA[60]
ZnFe2O422 at 90% RHNANA[60]
Planar mullite structure322.9 at 85% RH91167[25]
3D mullite structure7 at 89% RH501120This work
Disclaimer/Publisher’s Note: The statements, opinions and data contained in all publications are solely those of the individual author(s) and contributor(s) and not of MDPI and/or the editor(s). MDPI and/or the editor(s) disclaim responsibility for any injury to people or property resulting from any ideas, methods, instructions or products referred to in the content.