Article

Organophosphorus Pesticide Photoelectrochemical/Electrochemical Dual-Mode Smartsensors Derived from Synergistic Co,N-TiO2@ZrO2/3DGH Platform

Cancer Hospital of Dalian University of Technology, School of Chemistry, Dalian University of Technology, Dalian 116024, China
*
Authors to whom correspondence should be addressed.
Chemosensors 2025, 13(5), 167; https://doi.org/10.3390/chemosensors13050167
Submission received: 19 March 2025 / Revised: 29 April 2025 / Accepted: 1 May 2025 / Published: 5 May 2025

Abstract

:
Organophosphorus pesticides (OPs), while pivotal for agricultural productivity, pose severe environmental and health risks due to their persistence and bioaccumulation. Existing detection methods, such as chromatography and spectroscopy, face limitations in field adaptability, cost, and operational complexity. To address these challenges, this study introduces a novel dual-mode photoelectrochemical–electrochemical (PEC-EC) sensor based on a Co,N-TiO2@ZrO2/3DGH nanocomposite. The sensor synergistically integrates zirconium oxide (ZrO2) for selective OP capture via phosphate-Zr coordination, cobalt-nitrogen co-doped titanium dioxide (Co,N-TiO2) for visible-light responsiveness, and a three-dimensional graphene hydrogel (3DGH) for enhanced conductivity. In the PEC mode under light irradiation, OP adsorption induces charge recombination, yielding a logarithmic photocurrent attenuation with a detection limit of 0.058 ng mL−1. Subsequently, the EC mode via square wave voltammetry (SWV) self-validates the results, achieving a detection limit of 0.716 ng mL−1. The dual-mode system demonstrates exceptional reproducibility, long-term stability, and selectivity against common interferents. Parallel measurements revealed <5% inter-mode discrepancy, validating the intrinsic self-checking capability. This portable platform bridges the gap between laboratory-grade accuracy and field-deployable simplicity, offering transformative potential for environmental monitoring and food safety management.

1. Introduction

Organophosphorus pesticides (OPs) represent a class of synthetic phosphorus-containing organic compounds characterized by the presence of phosphate (P=O) or thiophosphate (P=S) ester bonds in their molecular structures [1]. Over the past five decades, these compounds have enabled the exponential growth of agricultural productivity, with global annual consumption surpassing 3 million metric tons. However, environmental persistence of Ops and bioaccumulation through ecological chains have raised alarming concerns. Chronic exposure to trace OP residues can result in neurodegenerative disorders, developmental abnormalities, and endocrine disruption for humans, with severe cases manifesting as headaches, shock, and even fatalities [2]. Due to their pronounced toxicity, maximum residue limits (MRLs) for OPs are typically set at stringent levels. For instance, the internationally established MRL for OPs in potatoes stands at 0.05 mg/kg, reflecting the need for rigorous control over permissible exposure thresholds [3]. Thus, it is critical to develop analytical systems capable of detecting OPs with a wide detection range and a low detection limit, while maintaining operational adaptability in resource-limited field environments [4].
Conventional chromatographic and spectroscopic methods remain benchmarks for precision. Gas chromatography–mass spectrometry (GC-MS) achieves unparalleled sensitivity (LOD: 1.5 pg mL−1) by coupling high-resolution separation with selective ion fragmentation, but its dependence on laboratory infrastructure and skilled operators hinders field use [5]. Liquid chromatography–tandem mass spectrometry (LC-MS/MS) expands detectability to non-volatile OPs. This analytical method offers the capability for multiplex analysis; however, it necessitates extensive sample cleanup to mitigate matrix effects [6]. Spectroscopic techniques like surface-enhanced Raman spectroscopy (SERS) employ plasmonic nanoparticles to amplify OP-specific vibrational fingerprints, enabling on-site detection at nM levels in crops, yet struggle with quantitative reproducibility across heterogeneous samples [7,8]. Electrochemical (EC) biosensors have the advantages of portability and rapid response [9,10], and the new generation of electrochemical sensors feature recyclability and low cost based on sustainable and environmentally friendly materials, as well as superior detection limits and sensor performance [11]. However, they still face inherent limitations in the detection of pesticides in actual environments. Acetylcholinesterase-based systems suffer from enzyme denaturation (50% activity loss within a week at 25 °C) and false positives triggered by organic reducing agents in soil or produce extracts. While these methods provide critical detection capabilities, the ongoing challenge lies in harmonizing laboratory-grade accuracy with operational simplicity for real-world agricultural monitoring [12].
Recent advancements in photoelectrochemical (PEC) sensing have demonstrated exceptional potential for environmental monitoring, leveraging light–matter interactions at semiconductor interfaces to achieve femtomolar-level sensitivity [13]. Compared to optical techniques suffering from background interference (>30% signal distortion in fluorescence methods) or complex optical configurations (as in surface plasmon resonance), PEC systems offer inherent advantages including simplified instrumentation and enhanced anti-interference capabilities [14]. Consequently, photoelectrochemical sensing platforms have emerged as a prominent tool in pesticide detection by integrating photoactive materials with biorecognition elements, achieving exceptional sensitivity, minimal background interference, and rapid signal transduction. The fundamental mechanism involved light-induced electron–hole pair generation within photoactive substrates, with subsequent modulation through target-specific interactions including enzyme inhibition phenomena and aptamer–target binding events that ultimately manifested as quantifiable photocurrent alterations [15,16]. However, photocurrent responses exhibited instability under fluctuating illumination conditions, while the influence of biorecognition elements on the photoelectrode’s optoelectronic properties, combined with the stringent requirements of environmental conditions, compromised sensing accuracy and diminished reliability in field applications. Over 80% of sensing systems require external validation through reference laboratory methods, negating the core advantage of field-deployable analysis [17,18]. Therefore, the development of a portable sensing platform enabling self-validation to ensure sensing accuracy and remove the need for additional large detection instruments is urgently needed.
The complementary characteristics of PEC and EC sensing modalities present intriguing opportunities for self-validating dual-mode systems, yet existing implementations remain hampered by fundamental design flaws. Most reported dual-mode sensors employ redundant sensing components for each detection pathway, significantly increasing manufacturing complexity and cost. To improve the self-validation capability, we designed a portable dual-mode sensing platform for OP monitoring, utilizing a Co,N-TiO2@ZrO2/3DGH nanocomposite as the sensing material. In the ternary integrated compound, zirconium oxide (ZrO2) specifically captured organophosphates through phosphate–zirconium coordination, thereby replacing biorecognition elements while improving the photoelectric material’s resistance to unstable external conditions and long-term stability [19]. Cobalt-nitrogen co-doped titanium dioxide (Co,N-TiO2) nanorods demonstrated superior visible-light photoresponsivity, while the three-dimensional graphene hydrogel (3DGH) architecture exhibited exceptional electrical conductivity that facilitated highly efficient charge transfer processes. Consequently, this sensing platform enabled dual-mode organophosphate detection through both photoelectrochemical and electrochemical methodologies without requiring biorecognition elements. The elimination of biological components conferred enhanced operational stability, superior interference resistance, and significantly mitigated the detrimental effects of biorecognition elements on photoelectrode performance characteristics. The PEC detection method was carried out under light irradiation, in which OP adsorption induces charge recombination at ZrO2 interfaces, generating logarithmic photocurrent attenuation with a 0.058 ng mL−1 detection limit. Then, the light was turned off, and the Square Wave Voltammetry (SWV) detection method was applied to self-check the obtained concentration of OPs. The designed portable dual-mode photoelectrochemical–electrochemical sensor, featuring self-verification capability and selectable operation modes, offered novel insights into OP detection while establishing a universal framework for developing next-generation multifunctional sensing systems. This advancement demonstrated transformative potential to revolutionize paradigms in precision agriculture and global food safety management.

2. Materials and Methods

2.1. Reagents and Chemicals

Tetrabutyl titanate (TBT), cobaltous nitrate (Co(NO3)2·6H2O), urea (CH4N2O), zirconyl chloride (ZrOCl2), triethanolamine (TEA), potassium chloride (KCl), potassium dihydrogen phosphate (KH2PO4), sodium dihydrogen phosphate (NaH2PO4), disodium hydrogen phosphate (Na2HPO4), and standard solutions of pesticides detected in this experiment, including Trifluralin (TFL), Dicamba (DCB), Fernesta Lironox Butapon (FLB), Alachlor (AL), Allidochlor (ADL), Glyphosate (GP), Acetamiprid (ATP), Dipterex (DT), Malathion(MLT) and Parathion-methyl (MP), were procured from Aladdin Reagent Co., Ltd. (Shanghai, China). Nitric acid (HNO3), hydrochloric acid (HCl), sulfuric acid (H2SO4), sodium hydroxide (NaOH), and anhydrous ethanol were obtained from Sinopharm Chemical Reagent Co., Ltd. (Beijing, China). For the samples, commercially available Dichlorvos (DDVP) solution, lettuce and cucumbers were purchased from the Dalian Malan Square Farmers’ Market. All chemicals were of analytical grade and used without further purification. All solutions were prepared using deionized water.

2.2. Preparation of Co, N-TiO2 Nanoparticles

The preparation of Co, N-TiO2 is as follows [20]:
Initially, 30 mL of ethanol was placed into a 100 mL beaker, followed by the addition of 3 mL of a 5 M HNO3 solution. Subsequently, titanium tetrabutoxide (TBT) was slowly introduced into the mixture and continuously stirred for 30 min to prepare a solution of titanium tetrabutoxide. Next, 30 mL of ethanol was placed into a 250 mL round-bottom flask, to which 2.0 g of urea and 0.12 g of cobalt nitrate hexahydrate (Co(NO3)2·6H2O) were added, along with 2 mL of deionized water. The previously prepared titanium tetrabutoxide solution was then added dropwise to the flask at a rate of 1 mL/min, and the mixture was stirred for an additional 120 min. Upon completion of stirring, the resultant solution was transferred into a 100 mL high-pressure reactor vessel, which was subsequently placed in an oven at 120 °C for a reaction period of 16 h. After the reaction concluded, the product was washed multiple times with deionized water and dried overnight in an oven at 100 °C. Finally, the dried sample was subjected to calcination in a muffle furnace at 450 °C for 3 h to eliminate the solvent and other impurities.

2.3. Preparation of ZrO2 Nanoparticles

The preparation of ZrO2 nanoparticles is as follows [21]:
First, 5.0 g of zirconyl chloride octahydrate (ZrOCl2·8H2O) was dissolved in 50 mL of deionized water and stirred magnetically until complete dissolution occurred, resulting in a colorless and transparent solution. Subsequently, polyvinylpyrrolidone (PVP) was added and slowly titrated with 1 M ammonia solution to adjust the pH of the solution to 9–11, yielding a white gelatinous precipitate (zirconium hydroxide gel). Throughout this process, continuous stirring was maintained to ensure uniform precipitation. The resultant mixture was transferred into a 100 mL hydrothermal reactor lined with polytetrafluoroethylene. The reactor was placed in an oven, heated to 180 °C, and remained at this temperature for 18 h. Upon completion of the reaction, the system was allowed to cool naturally to room temperature, and then the product was centrifuged to collect the precipitate. The precipitate was washed three times alternately with deionized water and ethanol to remove impurities and residual surfactants. The washed precipitate was dried in an oven at 60–80 °C for 12 h to obtain ZrO₂ powder. To further enhance the crystallinity, the powder was placed in a muffle furnace, heated at a rate of 2 °C min−1 to 400 °C, and held at this temperature for 4 h to ultimately obtain highly crystalline ZrO₂ nanoparticles.

2.4. Preparation of Co, N-TiO2@ZrO2/3DGH Nanocomposites

For the Co, N-TiO2@ZrO2/3DGH composite, a certain proportion of ZrO2 nanoparticles, Co, N-TiO2 nanoparticles and graphene oxide (GO) were dispersed in 30 mL deionized water under ultrasonication for 1 h. The suspension was transferred to a 50 mL autoclave and reacted at 180 °C for 24 h. After cooling, precipitates were collected, washed with deionized water and ethanol, and freeze-dried under a vacuum [20].

2.5. Photoelectrochemical and Electrochemical Detection of OPs

Photoelectrochemical and electrochemical measurements were conducted in a three-electrode system with 0.10 M phosphate-buffered saline (PBS, pH 7.4) containing triethanolamine (TEA) as a sacrificial agent and K4[Fe(CN)6] as the SWV indicator. The system comprised a modified indium tin oxide (ITO) working electrode, saturated Ag/AgCl reference electrode, and platinum plate counter electrode. Working electrodes were modified via drop-casting (Co, N-TiO2@ZrO2/3DGH:10 mg mL−1). The electrode area was fixed by the method of laser cutting double-sided tape, all cut into circles with a diameter of 0.5 cm, so the electrode area was 0.25×0.25×π cm2. Electrochemical electrode modification was achieved through drop-casting. In photoelectrochemical measurements, chronoamperometry was employed as the selected testing mode, with an applied potential of 0 V versus the reference electrode and a data acquisition interval of 0.2 s. For electrochemical characterization, square wave voltammetry was implemented under the following parameters: a potential window spanning from −0.2 V to 0.8 V, a step potential of 0.005 V, an amplitude of 0.02 V, and a frequency of 25 Hz. A high-power xenon lamp (CEL-PE300L-3A) served as the light source. Electrochemical impedance spectroscopy (EIS) measurements were tested on an electrochemical workstation (PSGTAT302N, Autolab). Electrochemical measurements were completed using an electrochemical workstation (CHI660e, CHI). More detailed information about the fabrication and detection of the PEC-EC sensor is provided in Scheme 1.

2.6. Sample Preparation, Extraction, and Matrix Study

At the initial stage of the experiment, researchers collected fresh cucumber and lettuce samples free from pesticide residues from local markets in Dalian and divided them into experimental and control groups. The experimental group samples were sprayed with DDVP pesticide at the recommended commercial concentration, and then both groups were exposed to the outdoor environment for 24 h. The surfaces of the pesticide-sprayed and untreated samples were treated by ultrasonic cleaning to obtain surface wash solutions (SSWSs). The extraction solvent was a mixture of 85% methanol and 15% phosphate-buffer solution (PBS, pH = 7.4). In the sample pretreatment stage, the samples were mechanically crushed using commercial crushing equipment, and then centrifuged at 6000 rpm for 10 min in a centrifuge to separate the solid and liquid phases. The supernatant was used as the solvent, and a portion of the supernatant was added to a 10 ng/mL DDVP solution for measurement. The sample extraction method was carried out according to the protocol reported by Rocco and colleagues [22].

2.7. Characterization

An X-ray powder diffractometer (XRD, λCu = 1.54056 Å) was employed to identify the crystal structure of Co, N-TiO2, ZrO2 and Co, N-TiO2@ZrO2/3DGH photoelectric materials with a scan rate of 5° min−1 from 10 to 70° on D8 Advance. Scanning electron microscopy (SEM, SU8220, Hitachi, Tokyo, Japan) was used to study the morphology of Co, N-TiO2, ZrO2, 3DGH and Co, N-TiO2@ZrO2/3DGH. Furthermore, the structure of the materials was further explored using a Field Emission Transmission Electron Microscope (FETEM, JEM-200, JEOL, Tokyo, Japan). X-ray photoelectron spectra (XPS) were obtained by X-ray photoelectron spectroscopy (XPS, ESCALAB 250Xi) using Al Kα (hν = 1486.6 eV) radiation. Raman spectra were recorded using a confocal Raman microscope (inVia Qontor).

3. Results and Discussion

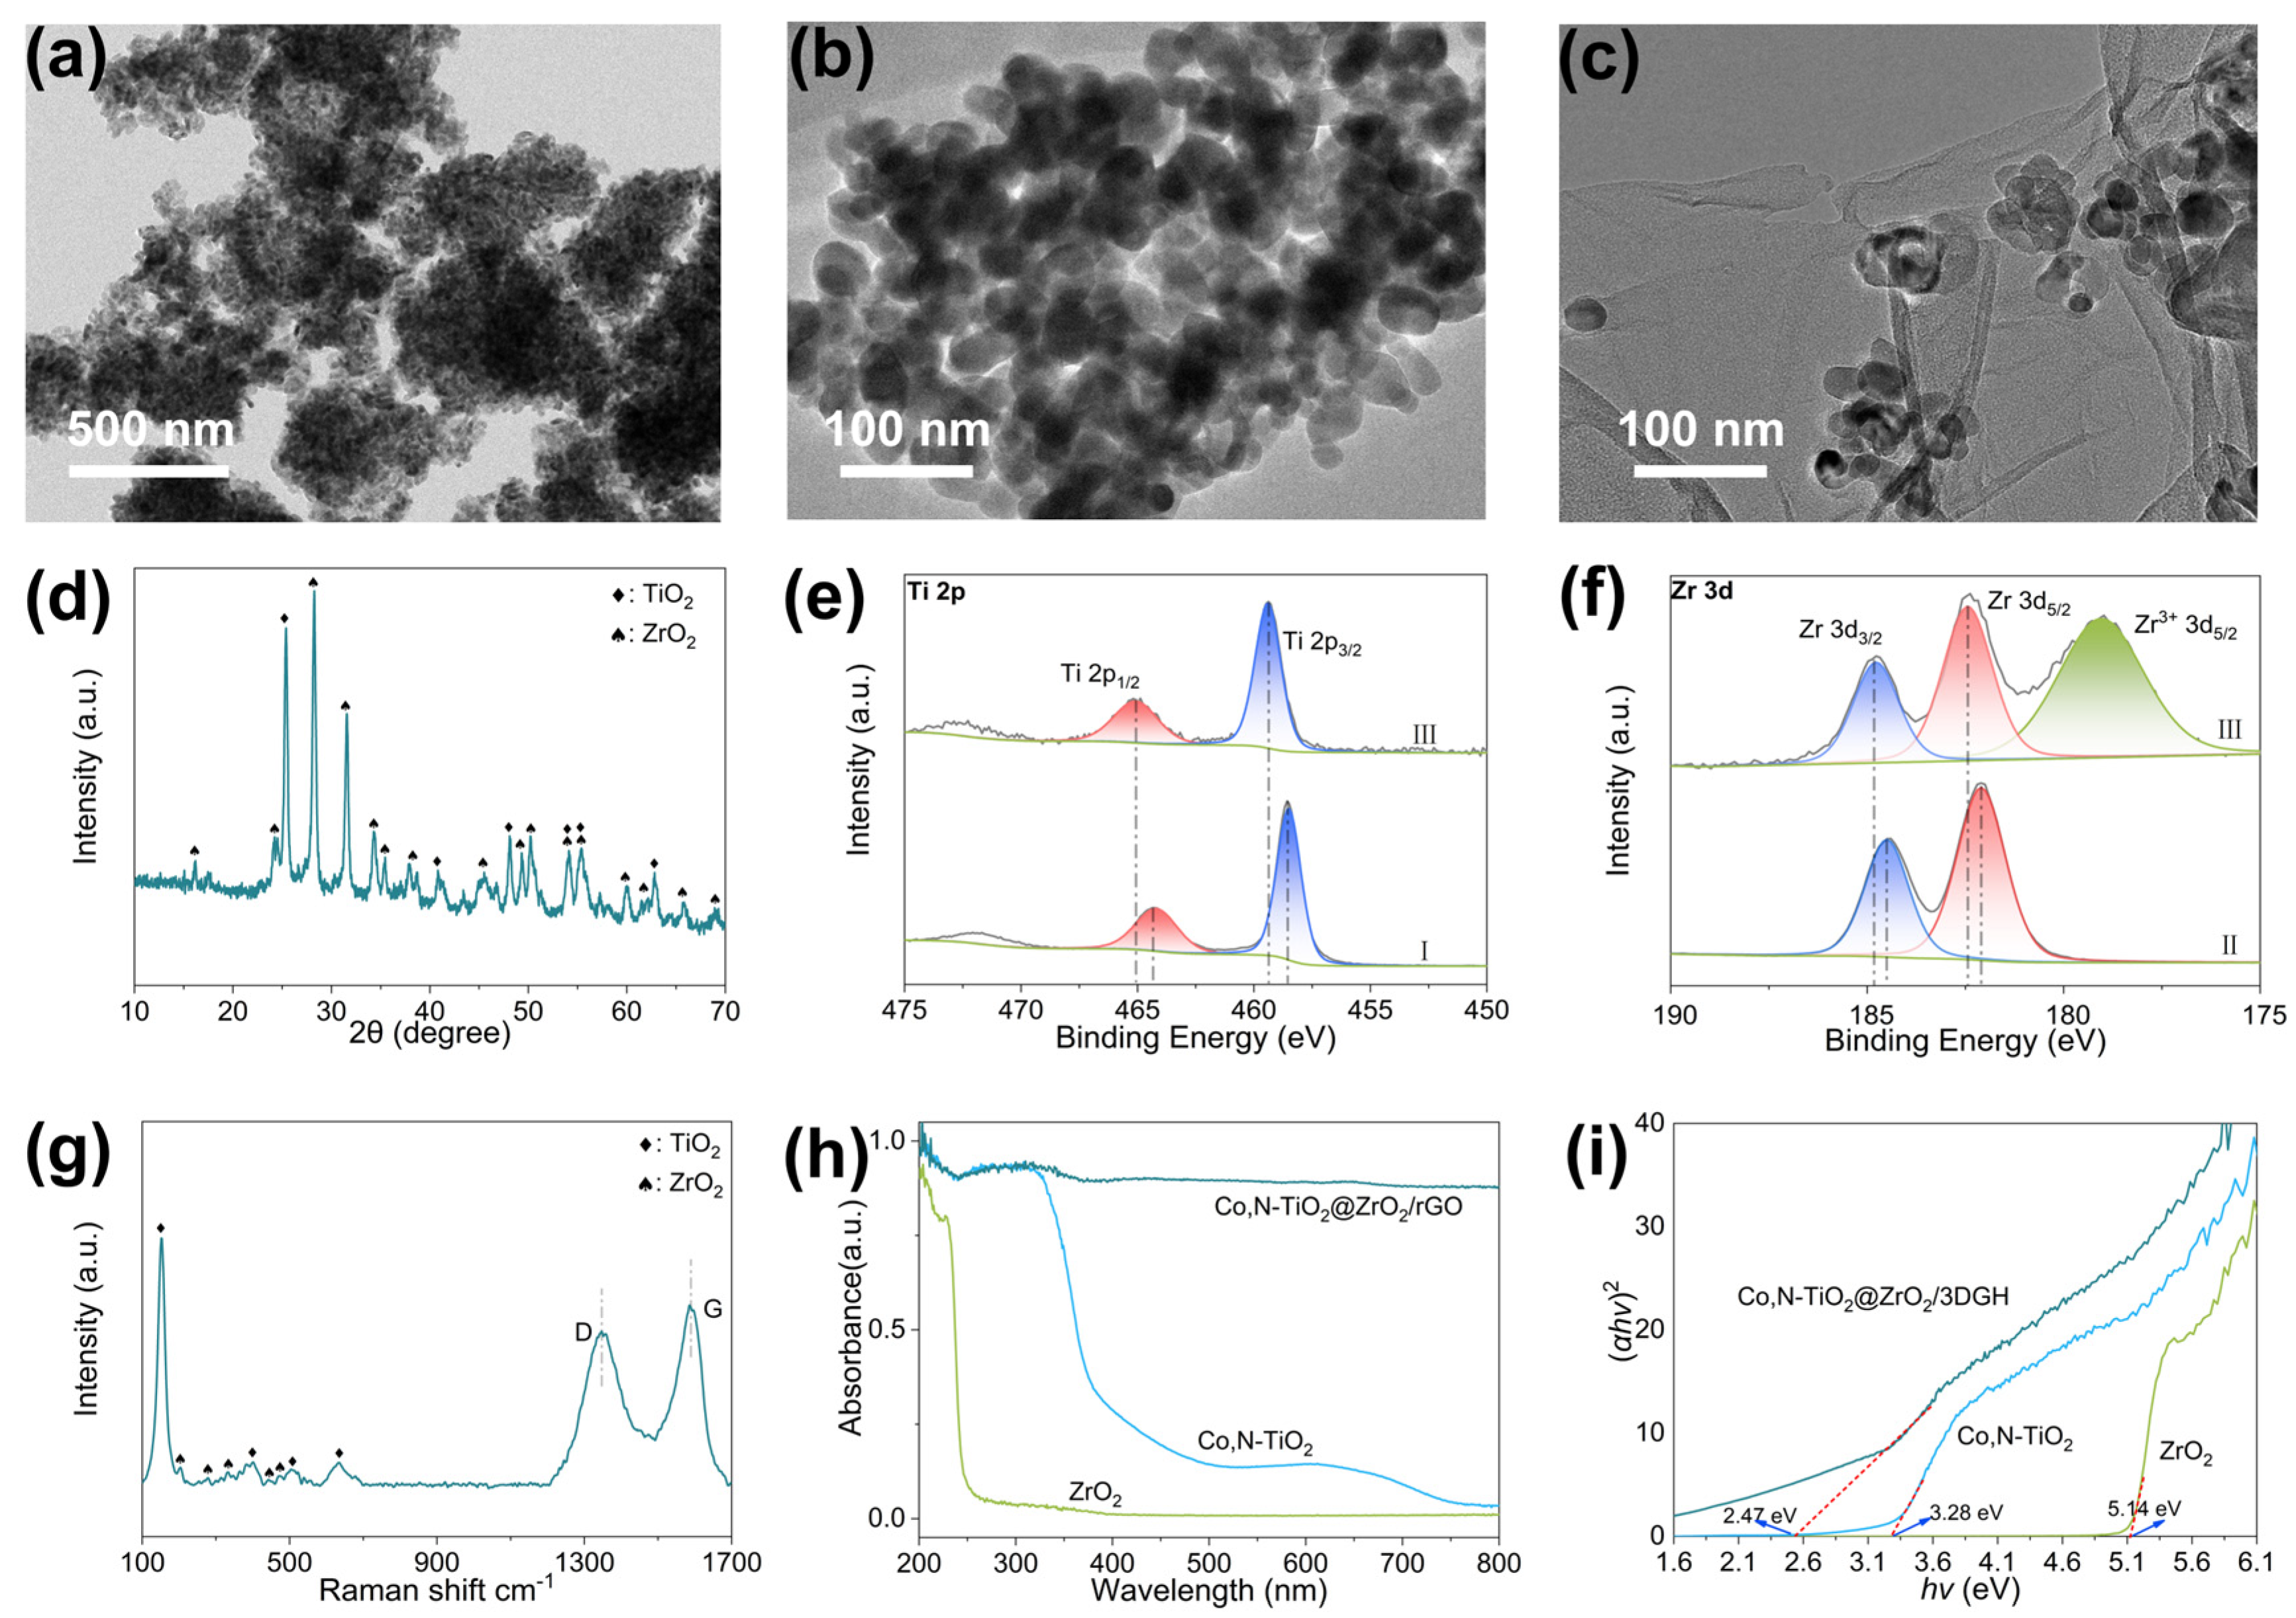
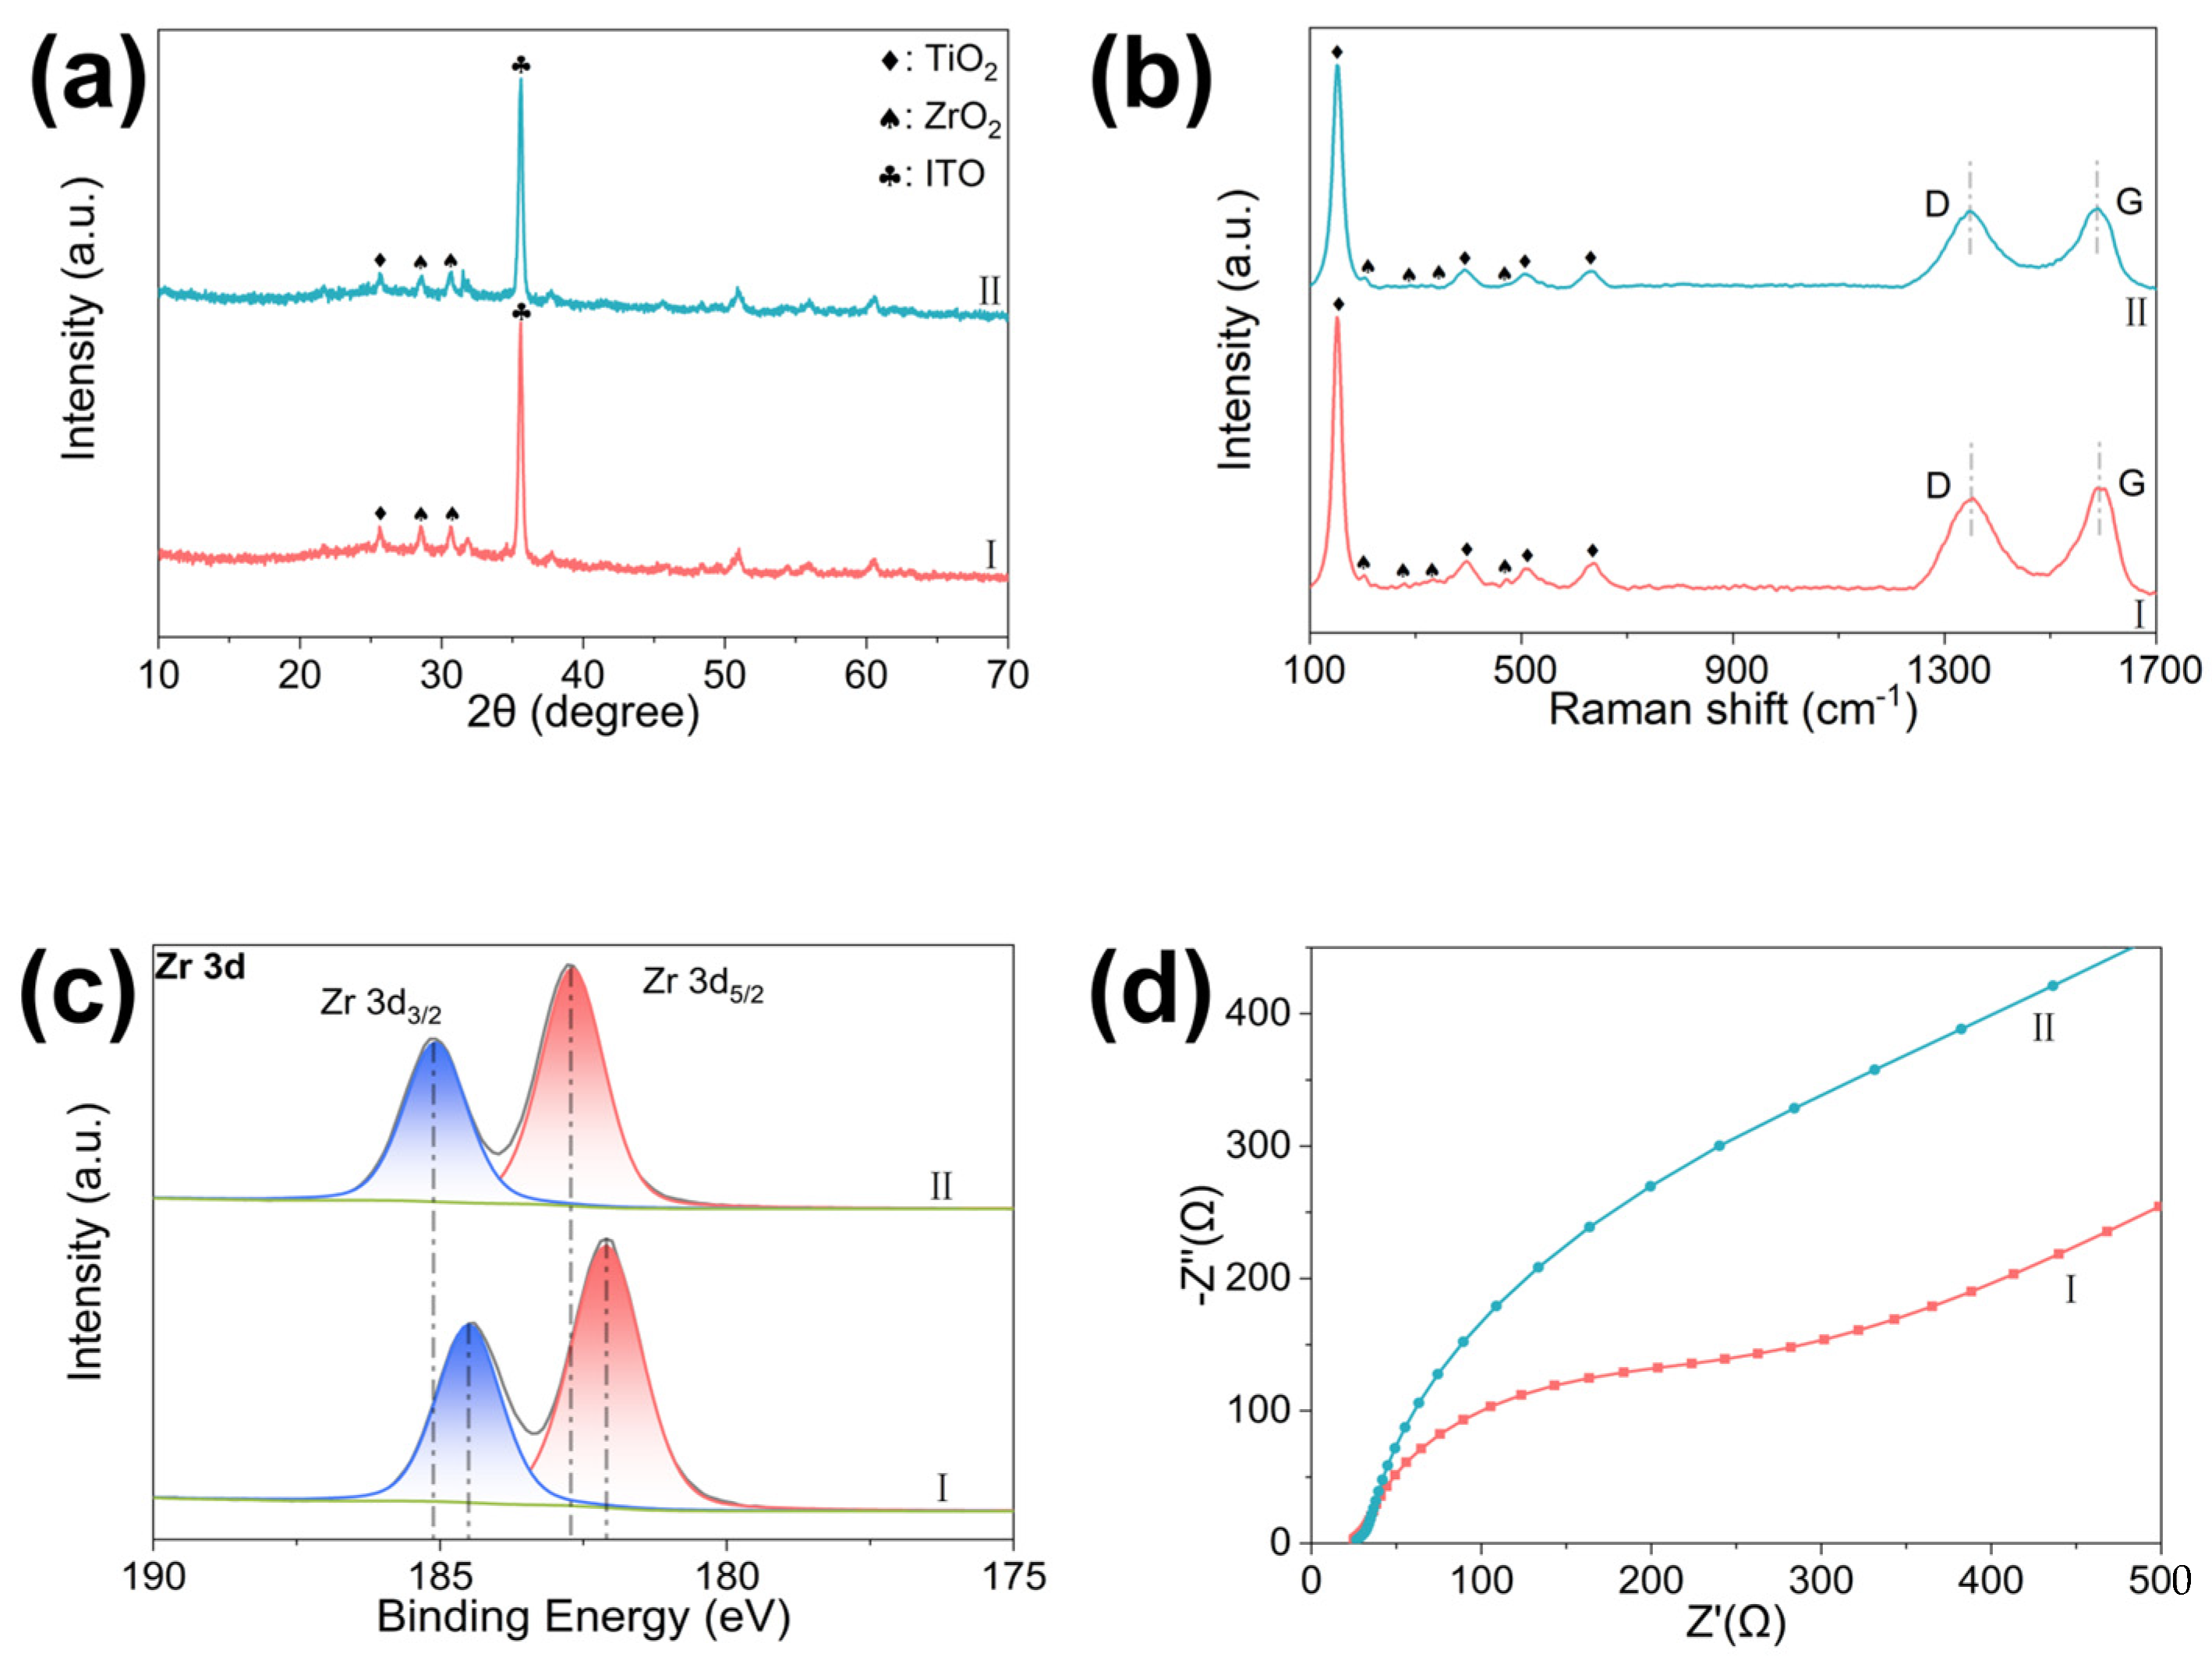
3.1. Characterization of Co,N-TiO2@ZrO2/3DGH Nanostructure

Surface morphologies of Co,N-TiO2, ZrO2, and Co,N-TiO2@ZrO2/3DGH nanomaterials were thoroughly examined using transmission electron microscopy (TEM). As shown in Figure 1a,b, both Co,N-TiO2 and ZrO2 exhibited approximate diameters of 30 nm. High-resolution transmission electron microscopy (HRTEM) images in Figure S1 provide the lattice fringes of these nanoparticles. Homogeneous integration of C, N, O, Co, Ti and Zr in Co,N-TiO2@ZrO2/3DGH was confirmed in elemental mapping images (Figure S2). Further confirmation of the successful synthesis of the two types of nanoparticles was achieved through pertinent analysis.
Crystal structures of materials were analyzed through X-ray diffraction (XRD). Specific diffraction peaks at 25.3, 37.8, 48.0, 53.9, 55.1, 62.7, and 68.8° in Co,N-TiO2 corresponded to (101), (004), (200), (105), (211), (204), and (116) crystal planes, respectively (PDF card #97-008-2084, Figure S3). The XRD pattern of ZrO2 displayed multiple diffraction peaks at 17.4, 24.1, 28.2, 31.5, 34.2, 35.3, 40.7, 44.6, 50.2, 55.5, 60.1, and 62.8°, corresponding to (010), (110), (-111), (111), (002), (020), (-112), (112), (220), (-221), (221), and (202) crystal planes, respectively (PDF card #98-000-0105). In the XRD pattern of Co,N-TiO2@ZrO2/3DGH (Figure 1d), significant peak overlap near 55° created challenges in distinguishing between TiO2 and ZrO2 diffraction features. Upon comparative analysis, the diffraction peaks of Co,N-TiO2@ZrO2/3DGH correspond to those of both TiO2 and ZrO2. Compared with the XRD patterns of pure TiO2 and ZrO2, this pattern contains most of the characteristic peaks of TiO2 and ZrO2, and the bulge of the baseline around 25° also confirms the existence of the 002 crystal plane of 3DGH, proving the successful preparation of Co,N-TiO2@ZrO2/3DGH.
X-ray photoelectron spectroscopy (XPS) investigations were performed to examine electronic states. Notable shifts in peak positions suggested the occurrence of charge transfer phenomena. In Co,N-TiO2@ZrO2/3DGH composite material, high-resolution Ti 2p and Zr 3d XPS analyses revealed a significant shift in the characteristic peak positions compared to pure Co,N-TiO2 and ZrO2 components. Furthermore, within the Zr 3d spectrum, Co,N-TiO2@ZrO2/3DGH exhibited additional XPS characteristic peaks (179.1 eV) relative to pure ZrO2. This phenomenon might be attributed to the reduction reaction that occurred during the formation of 3DGH in the process of ZrO2 and 3DGH being composites. This reaction acted on ZrO2 and led to the formation of oxygen vacancies in ZrO2 materials. Thus, it provided more exposed Zr sites for the specific adsorption of organic phosphorus molecules by ZrO2. The findings of these in XPS collectively indicate that there are significant interfacial interactions among Co, N-TiO2, ZrO2 and 3DGH. This result confirms that the successful synthesis and charge transfer of the nanocomposite were achieved through the spontaneous formation of the Co,N-TiO2@ZrO2/3DGH interface.
Raman spectroscopy further characterized material properties. For ZrO2, distinct peaks at 178, 220, 335, 382, 475, 560, 620, and 635 cm−1 were attributed to lattice vibrations (178, 220 cm−1), Zr-O bending vibrations (382 cm−1), and Zr-O stretching vibrations (335, 475, 560, 620, 635 cm−1), respectively (Figure 1g). Co,N-TiO2 exhibited characteristic peaks at 144, 399, 513, and 639 cm−1, corresponding to Ti-O stretching (144, 513, 639 cm−1) and bending vibrations (399 cm−1), respectively. 3DGH showed two prominent peaks at 1330 and 1576 cm−1, assigned to D and G bands. Although there is some overlap in the Raman spectral characteristic peaks of TiO2 and ZrO2, the Raman spectrum of Co,N-TiO2@ZrO2/3DGH was identified to contain all the characteristic peaks of each component, and the relevant characteristic peaks indicated that TiO2 and ZrO2 nanoparticles were successfully anchored on the surface of 3DGH (Figure S4).
Taking into account that optical absorption properties are critical determinants of semiconductor photoelectrochemical performance, ultraviolet–visible diffuse reflectance spectroscopy (UV-Vis DRS) analyses were conducted (Figure 1h and Figure S5a). Pure ZrO2 exhibited strong absorption below 240 nm, while pure TiO2 demonstrated significant absorption between 230 and 370 nm. Co,N-TiO2 displayed slightly enhanced visible light absorption compared to undoped TiO2. The Co,N-TiO2@ZrO2/3DGH nanocomposite showed remarkable absorption intensity enhancement in the visible region accompanied by a red shift in the absorption edge, suggesting superior potential for visible-light photocatalytic activity compared to individual components. To quantitatively evaluate bandgap characteristics, Tauc plot methodology was implemented for the estimation of optical bandgap energies (Equation (1)) [23].
( α h ν ) ^ n = ε ( h ν − E g )
where ε represents a proportionality constant, h corresponds to Planck’s constant, α denotes the absorption coefficient, ν signifies frequency, and n = 2. Linear extrapolation of (αhν)2 versus hν plots yielded calculated Eg values of 2.47 eV for Co,N-TiO2@ZrO2/3DGH, 3.28 eV for Co,N-TiO2, 3.39 eV for TiO2 and 5.14 eV for ZrO2 (Figure 1i and Figure S5b). The observed 0.81 eV bandgap narrowing from Co,N-TiO2 to Co,N-TiO2@ZrO2/3DGH was attributed to synergistic electronic interactions between rGO nanosheets and Co,N-TiO2 nanoparticles. The reduction in bandgap from 3.39 eV for pure TiO2 to 3.28 eV for Co,N-TiO2 can be attributed to the effective reduction in the bandgap of TiO2 through the doping of Co and N elements.

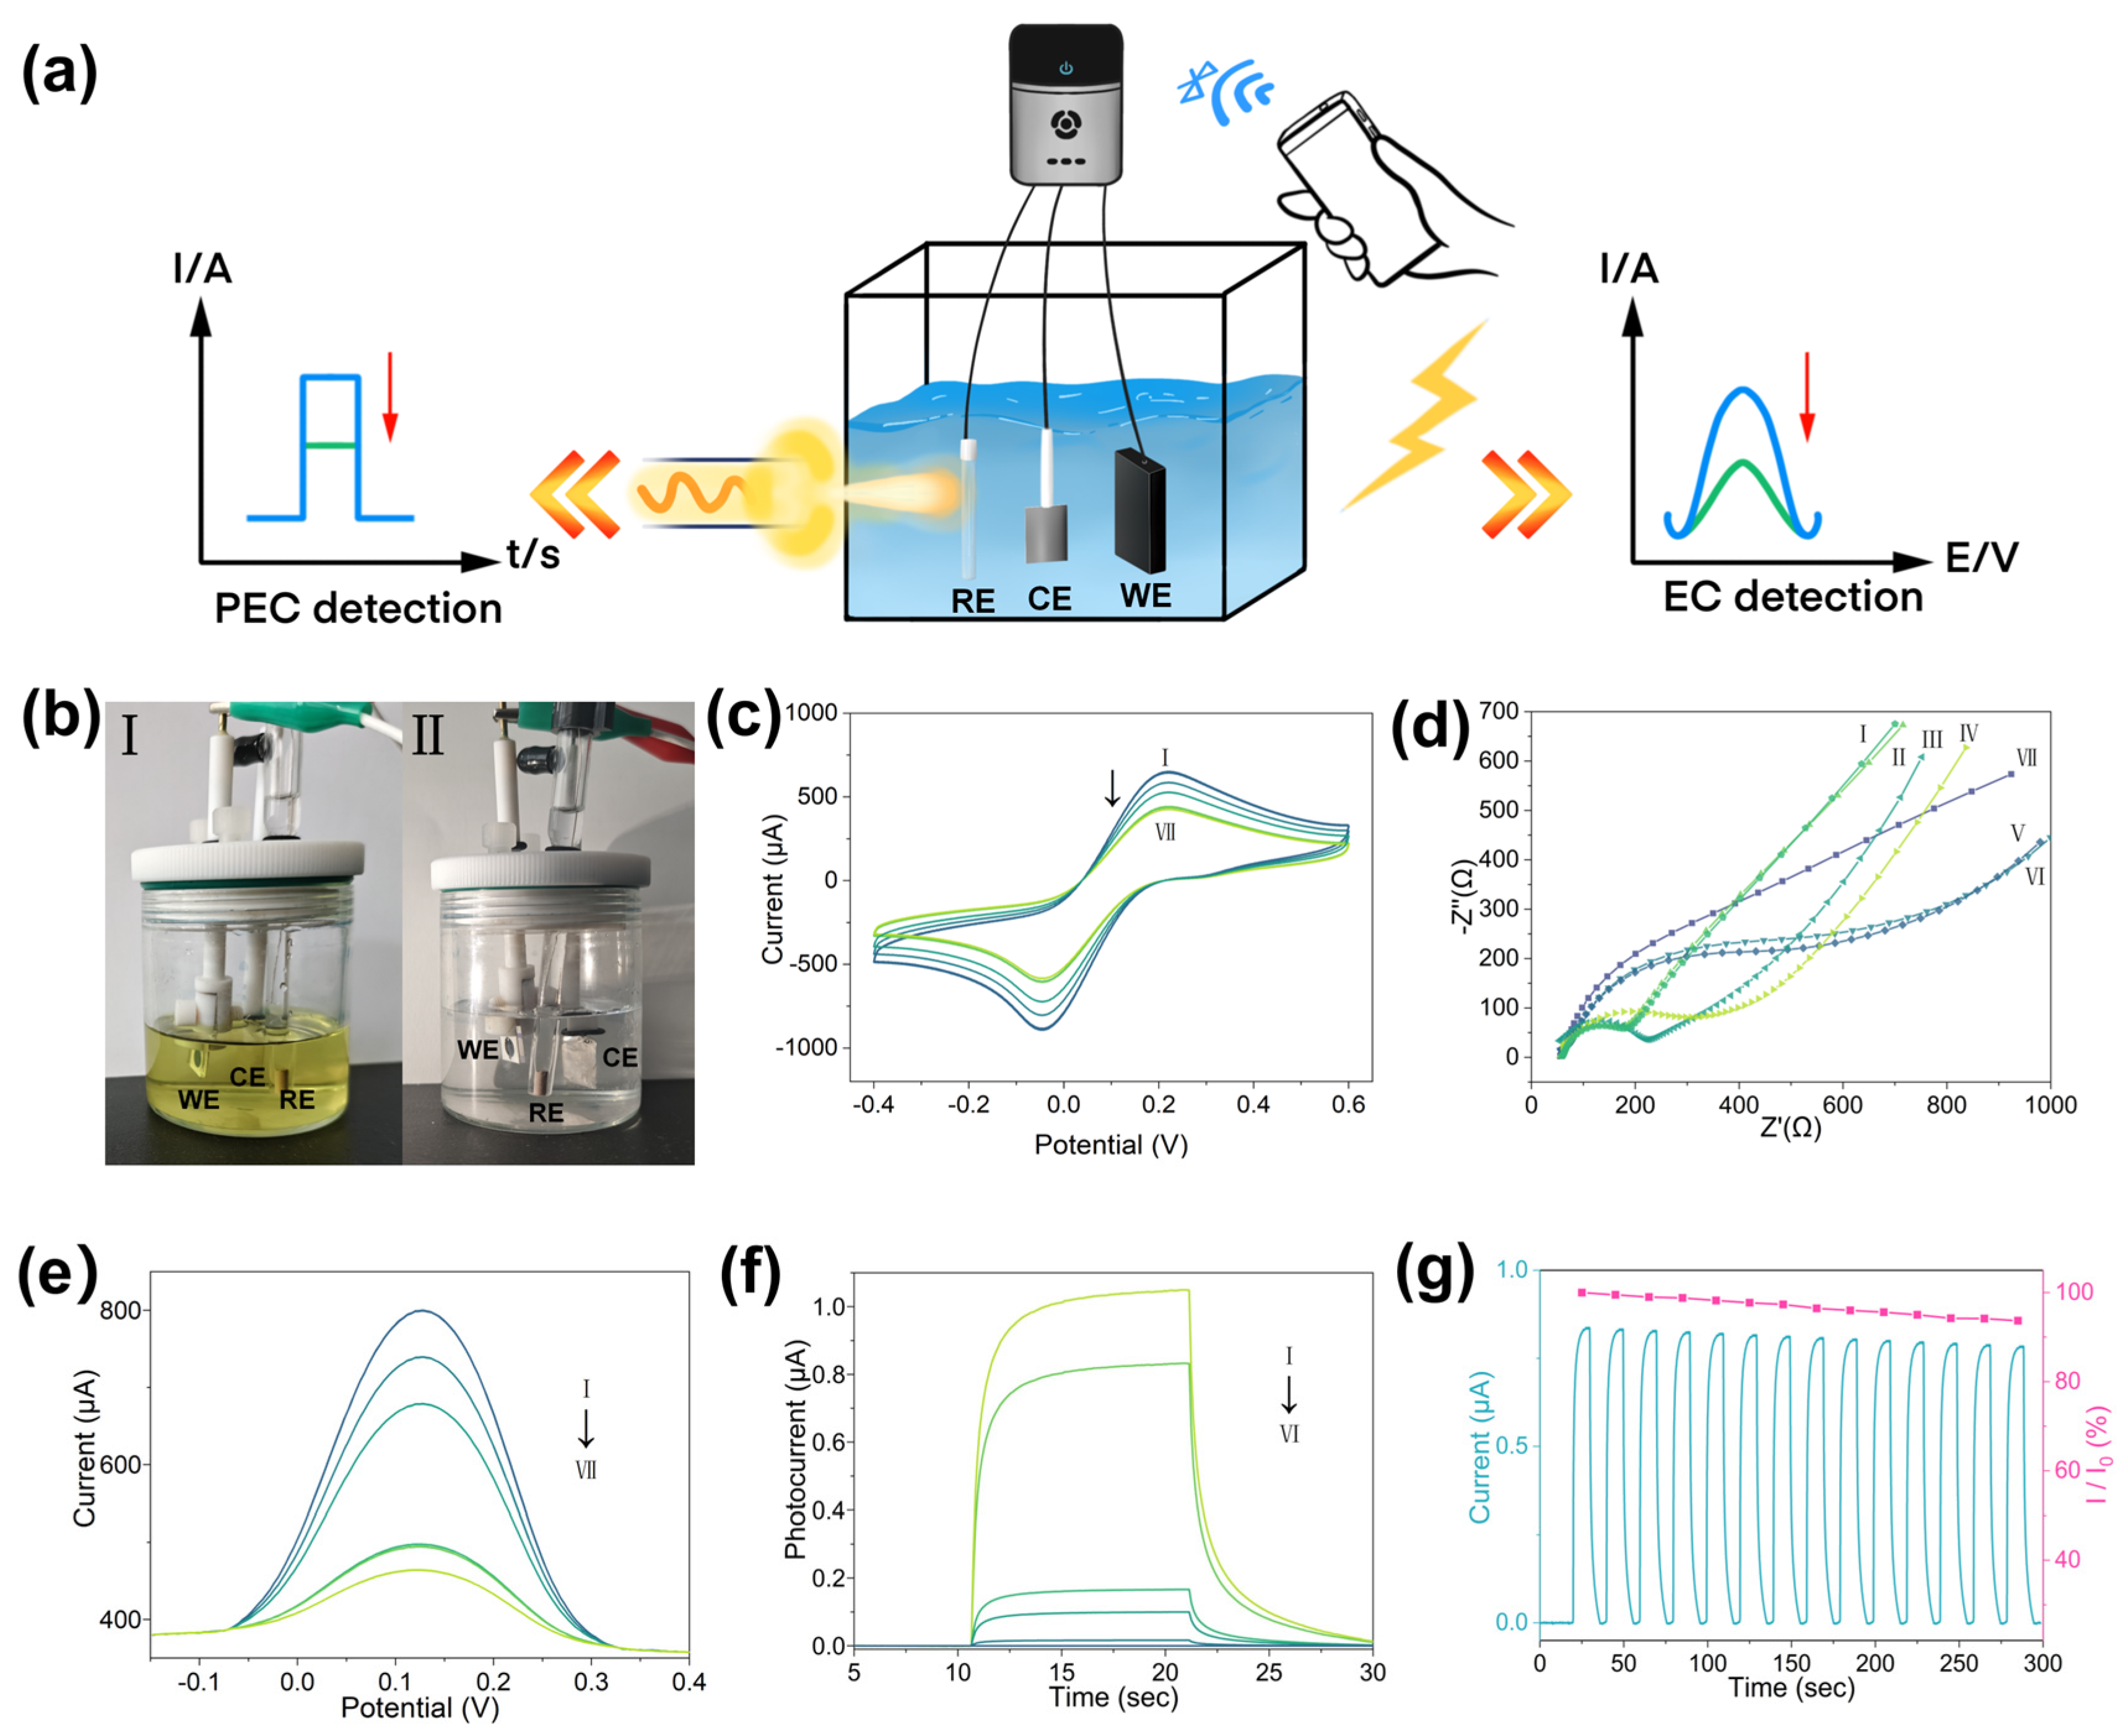
3.2. Sensing Mechanism of Co,N-TiO2@ZrO2/3DGH Nanostructure

To investigate the detection mechanisms of OPs by PEC-EC sensors, in situ X-ray diffraction (XRD) analysis was performed on Co,N-TiO2@ZrO2/3DGH-modified ITO electrodes before (Ⅰ) and after (Ⅱ) Parathion-methyl (MP) addition (Figure 2a). The characteristic diffraction peak intensity of ITO at 35.3° remained essentially stable upon MP introduction, whereas ZrO2 diffraction peak intensity exhibited attenuation. Peak intensity ratios between ZrO2 characteristic peaks at 28.6° and 30.5° and ITO characteristic peaks were calculated as 0.28/0.23 and 0.28/0.24 before and after OP adsorption, respectively. This observation indicates that during the in situ XRD test, the specific adsorption of the added MP on the ZrO2 surface leads to the formation of Zr-MP complexes. The generation of this complex significantly interferes with the XRD analysis, specifically manifested as a reduction in the effective exposed surface area of the zirconia crystal, ultimately resulting in a statistically significant attenuation of the characteristic diffraction peak intensity.
The in situ Raman spectroscopy characterization technique analysis revealed that the relative intensity of the D peak and G peak of 3DGH in the Co,N-TiO2@ZrO2/3DGH composite material system, as well as the four characteristic vibration modes of the Co,N-TiO2 nanoparticles in the 400–800 cm−1 wavenumber range, did not show significant changes before and after the introduction of MP (Figure 2b). This phenomenon indicates that MP did not have a chemical interaction with the 3DGH carrier and the Co,N-TiO2 active component of the material matrix. Notably, the characteristic vibration peak intensity of ZrO2 significantly weakened or even completely disappeared after MP adsorption, confirming that MP molecules preferentially adsorbed onto the surface of the ZrO2 nanocoating through coordination, forming a monolayer coverage and thereby shielding its Raman scattering signal. This result is consistent with the attenuation of the ZrO2 crystal plane diffraction peak intensity observed in the XRD analysis, jointly verifying the selective adsorption characteristics of MP in the composite material.
X-ray photoelectron spectroscopy (XPS) was employed to characterize and analyze the valence state and binding energy changes of Co,N-TiO2@ZrO2/3DGH composite materials before and after MP adsorption, in order to identify their active sites. As shown in Figure 2c, after MP adsorption, the binding energy of the Zr 3d orbital in zirconia exhibited a significant shift. When MP was introduced, the binding energies of both the Zr 3d5/2 and 3d3/2 characteristic peaks shifted positively. This phenomenon can be attributed to the chemical adsorption of MP molecules on the ZrO2 surface, forming Zr-MP complexes. In the generated Zr-S-P chemical bond, due to the significantly higher electronegativity of the P atom compared to the Zr atom, the P atom exerts an electron-attracting effect on the Zr atom through the S bridging group, resulting in a decrease in the electron cloud density of the Zr 3d orbital and an increase in its binding energy.
The electrochemical impedance spectroscopy (EIS) system characterized the changes in charge transfer properties of the modified electrode before and after MP exposure (Figure 2d). The experimental data showed that the Nyquist semicircle radius of the EIS spectra significantly increased after MP molecule adsorption, which was attributed to the in situ formation of Zr-MP coordination complexes on the surface of the nanocomposite material. Notably, the inherent insulating property of MP molecules led to a significant increase in the electron transfer energy barrier on the surface of the contaminated electrode. This phenomenon was in line with the previous characterization results, further verifying the theoretical analysis of the MP molecule recognition mechanism in the aforementioned research conclusion.
Based on experimental evidence, conclusions were drawn that ZrO2 nanoparticles on Co,N-TiO2@ZrO2/3DGH surfaces can specifically adsorb OP molecules. This adsorption process increased electrode surface resistance and occupied active sites, thereby weakening redox interactions between electrode surfaces and ferricyanide ions. Consequently, reduced redox peak currents in SWV tests were observed, enabling the use of the EC detection method. Furthermore, such interfacial obstruction hindered the transfer of photo-generated electrons, promoting the recombination of electron–hole pairs and ultimately diminishing photocurrent responses in PEC measurement.
In-depth mechanistic investigations confirmed the exceptional dual-mode sensing performance of the fabricated sensors, establishing a fundamental basis for developing quantitative detection devices targeting OP compound concentrations.

3.3. Testing and Optimization of the PEC-EC Dual-Mode Sensor

The EC sensing performance of Co,N-TiO2@ZrO2/3DGH-modified ITO electrodes was evaluated using an electrochemical workstation, while PEC sensing performance was evaluated under xenon lamp illumination (Figure 3a,b). Cyclic voltammetry (CV) curves of Co,N-TiO2 and ZrO2 exhibited reversible redox peaks corresponding to ferricyanide ion redox reactions (Figure 3c). After the addition of Co,N-TiO2 and ZrO2 to 3DGH, Co,N-TiO2@ZrO2/3DGH-based electrodes exhibited enhanced current responses, which could be explained by its inherent high conductivity. As shown in Figure 3d, EIS characterization revealed variations in charge transfer mechanisms through semicircle size changes. After the EIS fitting, as shown in Figure S6, pure TiO2, Co,N-TiO2, and ZrO2 semiconductors, due to their limited conductivity, showed large semi-circular arcs in their EIS spectra, indicating a high charge transfer resistance (Rct) at the interface. Incorporation of Co,N-TiO2 and ZrO2 with 3DGH resulted in decreasing Rct, indicating the increasing conductivity of Co,N-TiO2@ZrO2/3DGH. The high conductivity of designed materials contributed to promising potential for MP detection, indicating inherent conductivity and ensuring promising potential for MP detection.
After systematic optimization of material ratios, dual-mode sensor construction was successfully validated (Figure S7). SWV and photocurrent tests were conducted as shown in Figure 3e,f. Photocurrent response tests in PBS solution revealed that Co,N-TiO2/3DGH exhibited favorable visible-light responsiveness. While ZrO2 modification slightly attenuated photocurrent intensity, Co,N-TiO2@ZrO2/3DGH maintained satisfactory photoelectric performance. These findings aligned with CV curves in Figure 3c and EIS data in Figure 3d. Long-term photoresponse stability testing confirmed excellent illumination durability of nanocomposite, retaining 93.7% initial photoresponsivity after 280 s of continuous irradiation (Figure 3g).

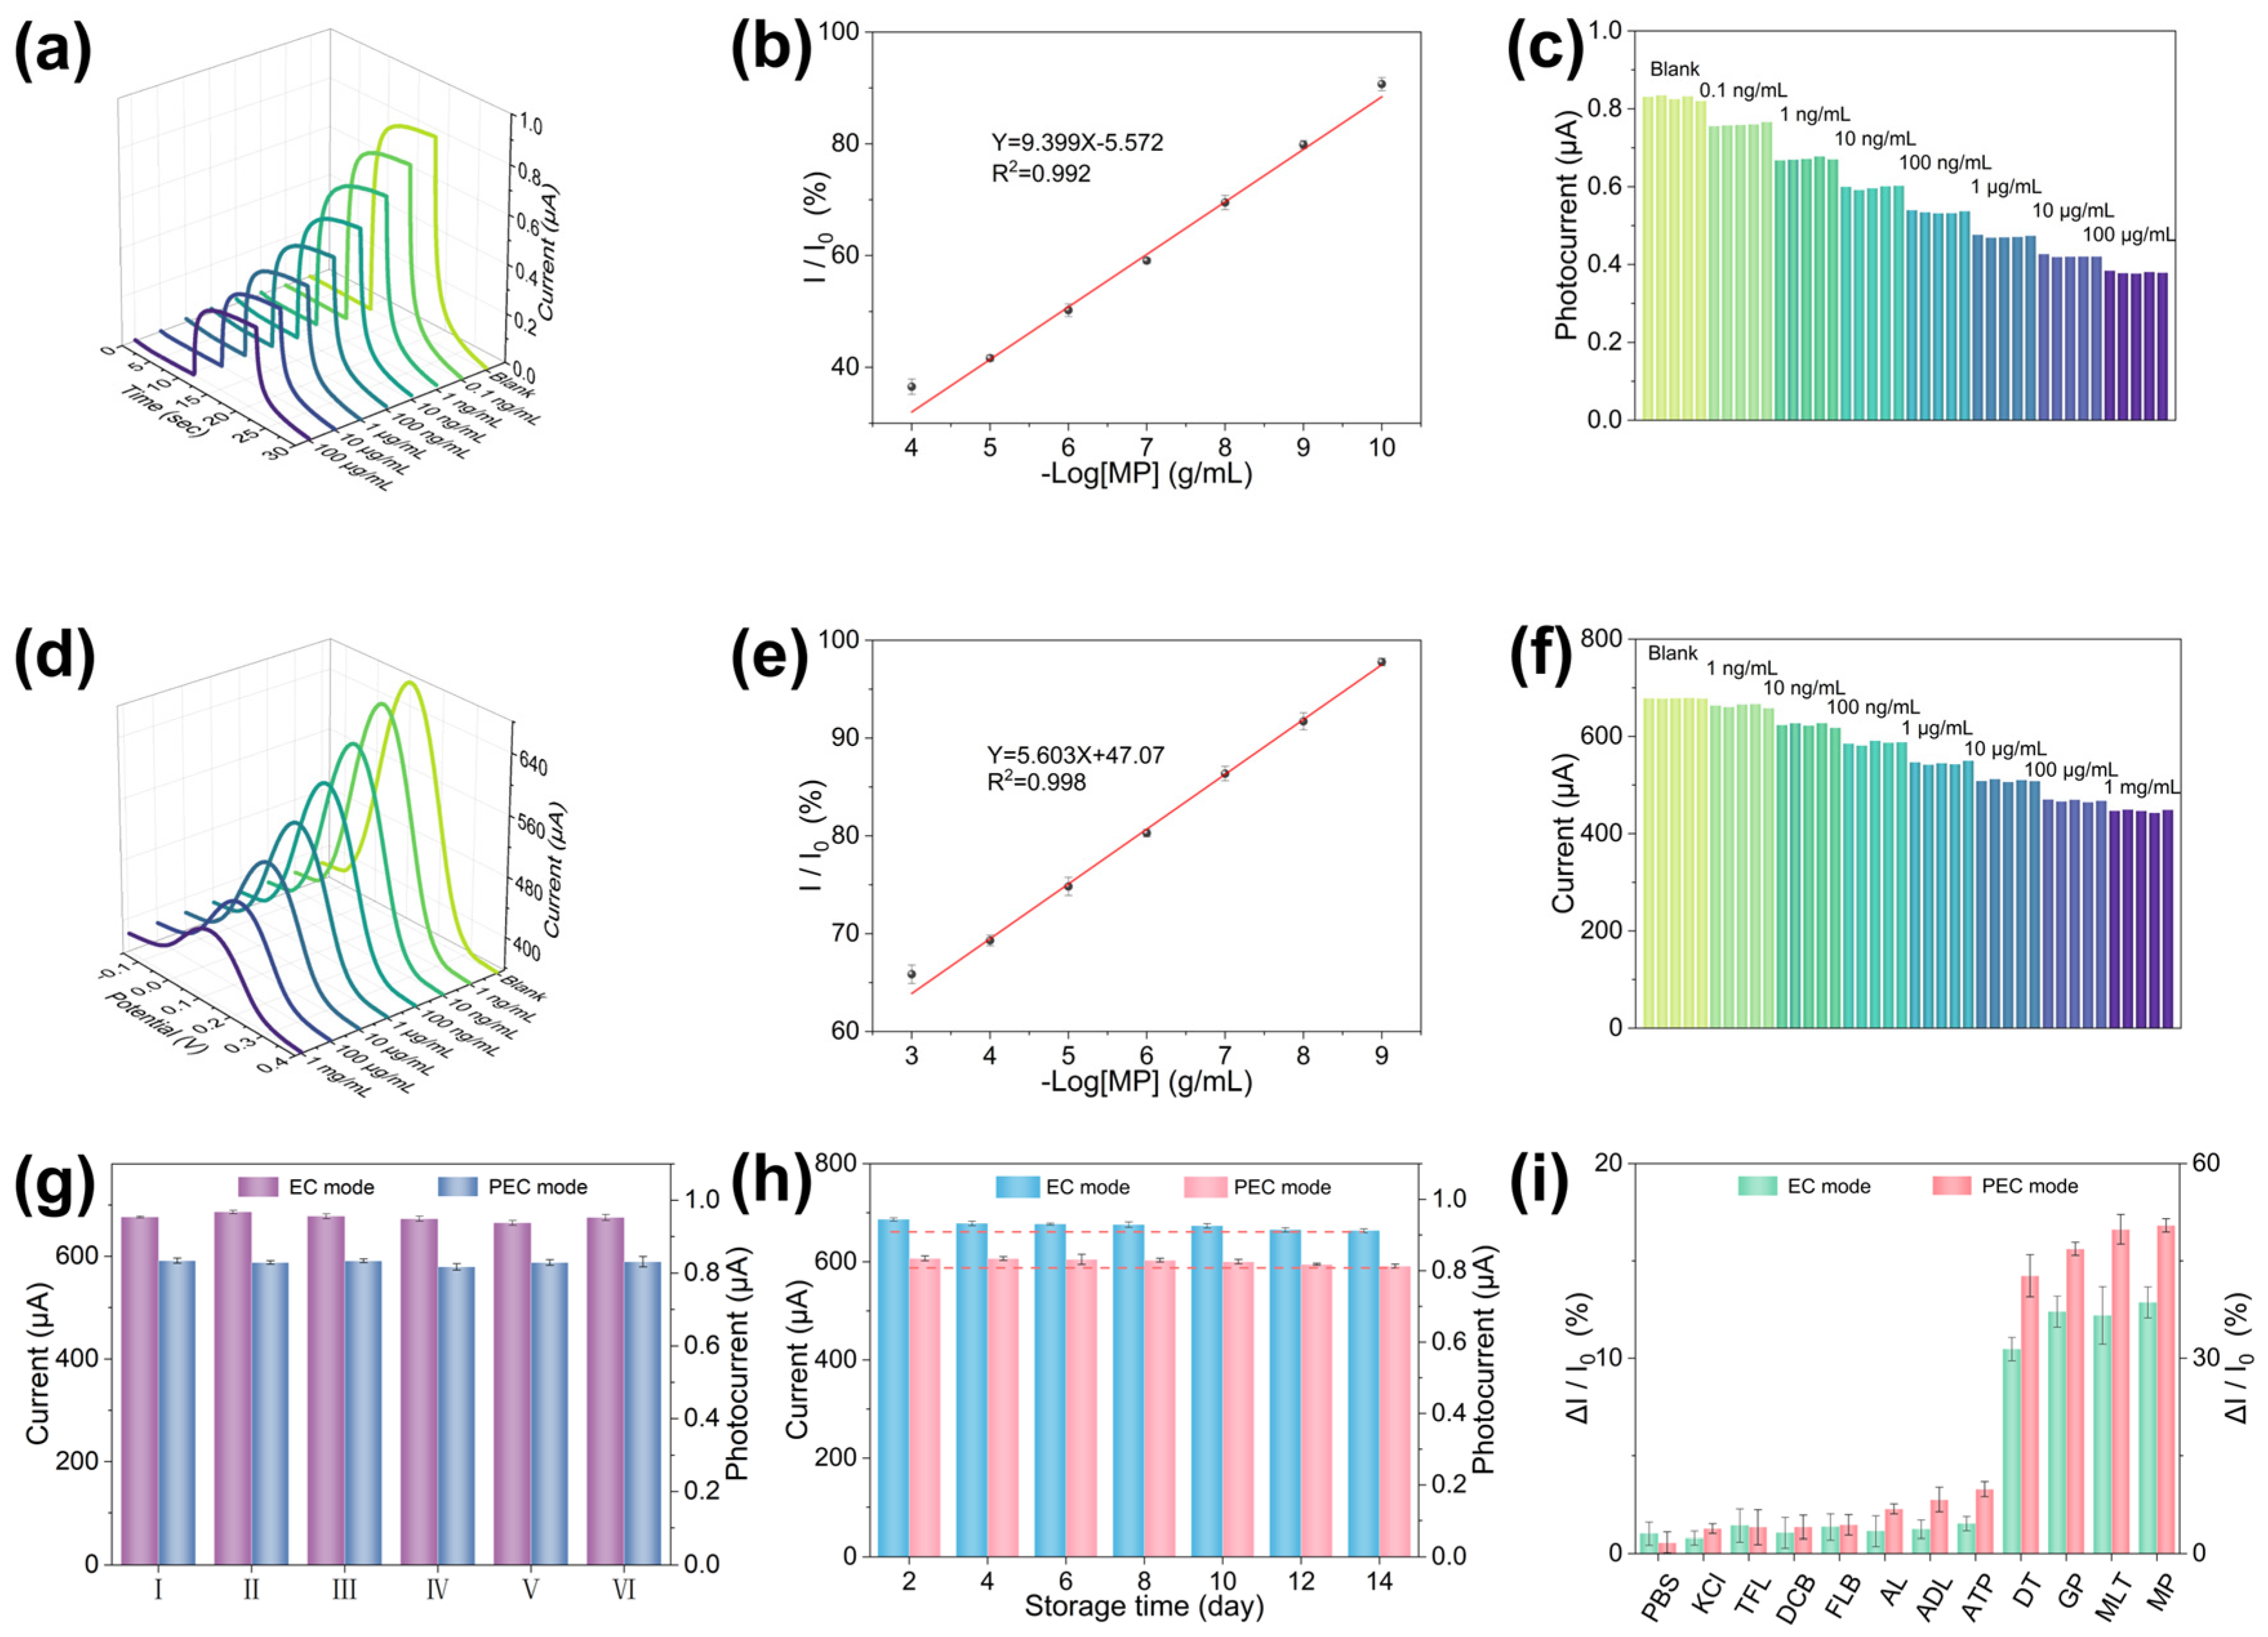
3.4. Performance Analysis of the PEC-EC Dual-Mode Sensor

Detection sensitivity toward MP was enhanced through systematic optimization of external conditions influencing sensor performance (Figure S8). To systematically evaluate the detection performance of the dual-mode sensor for OPs, this study quantitatively analyzed its response characteristics in solutions of different concentrations of methyl parathion (MP), malathion (MLT), and dichlorvos (DDVP). The experimental results are systematically presented in Figure 4 and Supporting Materials Figures S9 and S10. Under optimized parameters, analytical capabilities of dual-mode sensors were comprehensively evaluated. In PEC mode (Figure 4a), photocurrent signals were observed to decrease progressively with increasing MP concentrations. A significant linear relationship between photocurrent reduction and logarithmic MP concentrations was established over 0.1 ng mL−1 to 100 μg mL−1 range (Figure 4b), described by the equation Y = 9.399X − 5.572 (R2 = 0.994). The PEC mode detection results and fitting curves of the sensor tested later for different concentrations of MLT and DDVP solutions are shown in Figures S9 and S10. The highly similar slopes and intercepts of the fitting curves indicate the sensor’s sensing performance for the organophosphorus family. Parallel testing confirmed consistent sensing performance across different sensor batches when detecting identical MP concentrations (Figure 4c).
Similar signal variation trends were observed in the EC mode (Figure 4d), where SWV peak currents demonstrated excellent linear correlation with logarithmic MP concentrations from 1 ng mL−1 to 1 mg mL−1 (Figure 4e), following the equation Y = 5.603X + 47.07 (R2 = 0.998). The EC mode detection results and fitting curves of the sensor tested later for different concentrations of MLT and DDVP solutions are shown in Figures S9 and S10. Parallel testing results in the EC mode exhibited comparable reproducibility to PEC measurements (Figure 4f). Performance of the dual-mode sensor surpasses that of the recently developed organic phosphorus sensors (Table S1).
LODs were calculated as 0.058 ng mL−1 for the PEC mode and 0.716 ng mL−1 for the EC mode. Stability and repeatability evaluations proved critical for ensuring the reliability of dual-mode portable sensors. Reproducibility was assessed using six parallel Co,N-TiO2@ZrO2/3DGH electrodes detecting 10 ng mL−1 MP, yielding relative standard deviations (RSDs) of 1.21% (EC) and 1.16% (PEC) (Figure 4g), indicating exceptional consistency. Storage stability tests under ambient dark conditions for 14 days revealed photocurrent responses retained 96% of the initial values in the PEC mode, while SWV currents maintained 94.7% of the original responses in the EC mode (Figure 4h), demonstrating superior long-term stability.
Selectivity investigations against common agricultural interferents (Na+, K+, PO43−, TFL, DCB, FLB, ADL, AL, ATP) and organophosphorus pesticides (DT, GP, MLT, MP) confirmed minimal signal interference in both detection modes (Figure 4i). Sensors exhibited remarkable specificity toward target organophosphorus compounds, validating practical applicability in complex environmental matrices.

3.5. Application of PEC-EC Dual-Mode Sensor in Real Samples

In this study, common vegetables available on the market and commercialized technical-grade DDVP (dichlorvos) were selected as experimental subjects to conduct a simulation experiment of pesticide application and residue detection. The experimental procedure included the following steps: the samples were divided into two groups in the pretreatment stage, where one group was sprayed with DDVP solution at the recommended application concentration of 3 μg/mL, and the other group was sprayed with tap water, and then placed outdoors for 24 h (the concentration of DDVP dropped sharply during the process of extracting pesticide residues). Subsequently, ultrasonic cleaning was performed to detect the residues, and the tissues were homogenized using a commercial homogenizer and centrifuged to obtain the supernatant. Then, a 10 ng/mL DDVP solution was prepared in sequence. Ultimately, four sample solutions were obtained for testing: surface washing solution of the sample (SSWS); surface washing solution of the sample after pesticide application (SSWS-P); supernatant of the crushed sample (SCS); DDVP standard solution prepared based on the supernatant of the crushed sample (SCS-P). Through systematic detection and analysis (the results and testing process are shown in Figure S11 and Table 1), the experimental data fully verified the effectiveness and reliability of the dual-mode detection system established in this study for the analysis of organophosphorus pesticide residues.

4. Conclusions

This study successfully developed a dual-mode PEC-EC sensor based on Co,N-TiO2@ZrO2/3DGH nanocomposites for ultrasensitive detection of OPs. Systematic optimization of material compositions and external conditions enabled exceptional sensitivity of the sensor, with LODs as low as 0.058 ng mL−1 (PEC mode) and 0.716 ng mL−1 (EC mode). Remarkable reproducibility (RSD < 1.21%), long-term stability (>94% retention after 14 days), and selectivity against common agricultural interferents validated the sensor reliability in complex environments. Parallel measurements demonstrated less than 5% inter-mode discrepancies between PEC and EC detection methods, confirming the intrinsic self-validation capability of the sensing platform. The synergistic integration of 3DGH conductivity with Co,N-TiO2@ZrO2 adsorption and photocatalytic properties established a robust platform for OP compound detection, paving the way for portable analytical devices in environmental monitoring and food safety applications.

Supplementary Materials

The following supporting information can be downloaded at https://www.mdpi.com/article/10.3390/chemosensors13050167/s1: Figure S1: HRTEM images of Co,N-TiO2 and ZrO2; Figure S2: Elemental mapping of Co,N-TiO2@ZrO2/3DGH nanocomposite; Figure S3: XRD pattern of Co,N-TiO2 and ZrO2; Figure S4: Raman spectrums of ZrO2, Co,N-TiO2 and 3DGH; Figure S5: UV–Vis diffuse reflectance spectra and Tauc plots of Co,N-TiO2 and TiO2; Figure S6: The Randles equivalent circuit; Figure S7: Effect of different synthetic conditions; Figure S8: Effect of different test conditions. Figure S9: Dual-mode sensor tests different concentrations of MLT; Figure S10: Dual-mode sensor tests using different concentrations of DDVP; Figure S11: The process and results of real sample testing. Table S1: Sensing performance comparison of recent organophosphorus sensors [24,25,26,27,28,29,30,31,32,33,34].

Author Contributions

N.Z. and H.M. (Hongting Ma) conceived the idea and supervised the project. Z.Z. performed the experiment and data analysis. H.M. (Hao Mo) performed partial experiment and data analysis. Z.Z., H.M. (Hongting Ma) and N.Z. jointly wrote the paper. All authors have read and agreed to the published version of the manuscript.

Funding

This research was funded by the National Natural Science Foundation of China (Grant No. 22404014), Interdisciplinary project of Dalian University (Grant No. DLUXK-2023-YB-008), LiaoNing Revitalization Talents Program (Grant No. XLYC2403047), the Fundamental Research Funds for the Central Universities (Grant No. DUT24YG212) and State Key Laboratory of New Textile Materials and Advanced Processing Technologies (Grant No. FZ2023009). The authors acknowledge the assistance of the Instrumental Analysis Center, Dalian University of Technology, China.

Institutional Review Board Statement

Not applicable.

Informed Consent Statement

Not applicable.

Data Availability Statement

The data presented in this study are available upon request from the corresponding author.

Acknowledgments

The authors acknowledge the assistance of the Instrumental Analysis Center, Dalian University of Technology, China.

Conflicts of Interest

The authors declare no conflicts of interest.

References

  1. Wee, S.Y.; Aris, A.Z. Ecological risk estimation of organophosphorus pesticides in riverine ecosystems. Chemosphere 2017, 188, 575–581. [Google Scholar] [CrossRef]
  2. Rani, L.; Thapa, K.; Kanojia, N.; Sharma, N.; Singh, S.; Grewal, A.S.; Srivastav, A.L.; Kaushal, J. An extensive review on the consequences of chemical pesticides on human health and environment. J. Clean. Prod. 2021, 283, 124657. [Google Scholar] [CrossRef]
  3. Liang, J.; Dong, Z.; Xu, N.; Chen, T.; Liang, J.; Xia, M.; Wang, F. A comprehensive review of multifunctional nanozymes for degradation and detection of organophosphorus pesticides in the environment. Toxics. 2024, 12, 926. [Google Scholar] [CrossRef]
  4. Xue, J.; Mao, K.; Cao, H.; Feng, R.; Chen, Z.; Du, W.; Zhang, H. Portable sensors equipped with smartphones for organophosphorus pesticides detection. Food Chem. 2024, 4, 1374563. [Google Scholar] [CrossRef] [PubMed]
  5. Hao, C.; Helm, P.A.; Morse, D.; Reiner, E.J. Liquid chromatography-tandem mass spectrometry direct injection analysis of organophosphorus flame retardants in Ontario surface water and wastewater effluent. Chemosphere 2018, 191, 288–295. [Google Scholar] [CrossRef]
  6. Wang, H.; Leeming, M.G.; Cochran, B.J.; Hook, J.M.; Ho, J.; Nguyen, G.T.H.; Zhong, L.; Supuran, C.T.; Donald, W.A. Nontargeted Identification of Plasma Proteins O-, N-, and S-Transmethylated by O-Methyl Organophosphates. Anal. Chem. 2020, 92, 15420–15428. [Google Scholar] [CrossRef] [PubMed]
  7. Xu, S.; Li, M.; Li, X.; Jiang, Y.; Yu, L.; Zhao, Y.; Wen, L.; Xue, Q. Engineering an Ag/Au bimetallic nanoparticle-based acetylcholinesterase SERS biosensor for in situ sensitive detection of organophosphorus pesticide residues in food. Anal. Bioanal. Chem. 2023, 415, 203–210. [Google Scholar] [CrossRef]
  8. Li, T.; Wen, B.; Zhang, Y.; Zhang, L.; Li, J. Au@ZrO2 core-shell nanoparticles as a surface-enhanced Raman scattering substrate for organophosphorus compounds detection. J. Raman Spectrosc. 2022, 53, 1386–1393. [Google Scholar] [CrossRef]
  9. Wen, L.; Wang, J.; Liu, Z.; Tao, C.-A.; Rao, J.; Hang, J.; Li, Y. A portable acetylcholinesterase—based electrochemical sensor for field detection of organophosphorus. RSC Adv. 2023, 13, 6389–6395. [Google Scholar] [CrossRef]
  10. Kotagiri, Y.G.; Sandhu, S.S.; Morales, J.F.; Fernando, P.U.A.I.; Tostado, N.; Harvey, S.P.; Moores, L.C.; Wang, J. Sensor Array Chip for Real-Time Field Detection and Discrimination of Organophosphorus Neurotoxins. ChemElectroChem 2022, 9, e202200349. [Google Scholar] [CrossRef]
  11. Cancelliere, R.; Rea, G.; Severini, L.; Cerri, L.; Leo, G.; Paialunga, E.; Mantegazza, P.; Mazzuca, C.; Micheli, L. Expanding the circularity of plastic and biochar materials by developing alternative low environmental footprint sensors. Green Chem. 2023, 25, 6774–6783. [Google Scholar] [CrossRef]
  12. Wondimu, K.T.; Geletu, A.K.; Kedir, W.M. Recent developments in monitoring of organophosphorus pesticides in food samples. J. Agric. Food Res. 2025, 19, 101709. [Google Scholar] [CrossRef]
  13. Shi, L.; Yin, Y.; Zhang, L.-C.; Wang, S.; Sillanpää, M.; Sun, H. Design and engineering heterojunctions for the photoelectrochemical monitoring of environmental pollutants: A review. Appl. Catal. B Environ. 2019, 248, 405–422. [Google Scholar] [CrossRef]
  14. Yang, P.; Hou, X.; Gao, X.; Peng, Y.; Li, Q.; Niu, Q.; Liu, Q. Recent Trends in Self-Powered Photoelectrochemical Sensors: From the Perspective of Signal Output. ACS Sens. 2024, 9, 577–588. [Google Scholar] [CrossRef] [PubMed]
  15. Zhang, L.; Feng, L.; Zhuang, X.; Tang, P.; Chen, G.; Wang, H. A visible-light-driven photoelectrochemical sensor for the sensitive and selective detection of chlorpyrifos via CoS2 quantum dots/CdS nanowires nanocomposites with 0D/1D heterostructure. Chem. Eng. J. 2023, 476, 146770. [Google Scholar] [CrossRef]
  16. Wang, H.; Li, C.; Zhang, J.; Yang, Z.; Li, J.; Cao, Y.; Wu, K.; Liu, Z.; Hao, J.; Ye, X. NIR-excitable POM-encapsulated Yb-Bi2S3 decorated graphene for wearable photoelectrochemical sensing. Adv. Funct. Mater. 2024, 34, 2315917. [Google Scholar] [CrossRef]
  17. Liu, J.; Liu, Y.; Wang, W.; Li, J.; Yu, X.; Zhu, Q.; Dai, Z. Component reconstitution-driven photoelectrochemical sensor for sensitive detection of Cu2+ based on advanced CuS/CdS p-n junction. Sci. China Chem. 2019, 62, 1725–1731. [Google Scholar] [CrossRef]
  18. Peng, J.; Huang, Q.; Zhuge, W.; Liu, Y.; Zhang, C.; Yang, W.; Xiang, G. Blue-light photoelectrochemical sensor based on nickel tetra-amined phthalocyanine-graphene oxide covalent compound for ultrasensitive detection of erythromycin. Biosens. Bioelectron. 2018, 106, 212–218. [Google Scholar] [CrossRef]
  19. Liu, R.; Wang, Y.; Li, B.; Liu, B.; Ma, H.; Li, D.; Dong, L.; Li, F.; Chen, X.; Yin, X. VXC-72R/ZrO2/GCE-based electrochemical sensor for the high-sensitivity detection of methyl parathion. Materials 2019, 12, 3637. [Google Scholar] [CrossRef]
  20. Hao, N.; Dai, Z.; Xiong, M.; Hua, R.; Lu, J.; Wang, K. A portable solar-driven ratiometric photo-electrochromic visualization biosensor for detection of ochratoxin A. Sens. Actuators B Chem. 2020, 306, 127594. [Google Scholar] [CrossRef]
  21. Hassan, N.S.; Jalil, A.A. A review on self-modification of zirconium dioxide nanocatalysts with enhanced visible-light-driven photodegradation of organic pollutants. J. Hazard. Mater. 2022, 423, 126996. [Google Scholar] [CrossRef] [PubMed]
  22. Cancelliere, R.; Di Tinno, A.; Cataldo, A.; Bellucci, S.; Kumbhat, S.; Michelia, L. Nafion-based label-free immunosensor as a reliable warning system: The case of AFB1 detection in cattle feed. Microchem. J. 2023, 191, 108868. [Google Scholar] [CrossRef]
  23. Klein, J.; Kampermann, L.; Mockenhaupt, B.; Behrens, M.; Strunk, J.; Bacher, G. Limitations of the Tauc Plot Method. Adv. Funct. Mater. 2023, 33, 2304523. [Google Scholar] [CrossRef]
  24. Huang, S.; Yao, J.; Li, B.; Ning, G.; Xiao, Q. Integrating target-responsive CD-CdTe QD-based ratiometric fluorescence hydrogel with smartphone for visual and on-site determination of dichlorvos. Microchim. Acta 2021, 188, 318. [Google Scholar] [CrossRef]
  25. Shen, Y.; Gao, X.; Zhang, Y.; Chen, H.; Ye, Y.; Wu, Y. Polydopamine-based nanozyme with dual-recognition strategy-driven fluorescence-colorimetric dual-mode platform for Listeria monocytogenes detection. J. Hazard. Mater. 2022, 439, 129582. [Google Scholar] [CrossRef]
  26. Wei, D.; Li, M.; Wang, Y.; Zhu, N.; Hua, X.; Zhao, B.; Zhang, Z.; Yin, D. Encapsulating gold nanoclusters into metal-organic frameworks to boost luminescence for sensitive detection of copper ions and organophosphorus pesticides. J. Hazard. Mater. 2023, 441, 129890. [Google Scholar] [CrossRef] [PubMed]
  27. Jin, R.; Kong, D.; Yan, X.; Zhao, X.; Li, H.; Liu, F.; Sun, P.; Lin, Y.; Lu, G. Integrating target-responsive hydrogels with smartphone for on-site ppb-Level quantitation of organophosphate pesticides. ACS Appl. Mater. Interfaces 2019, 11, 27605–27614. [Google Scholar] [CrossRef]
  28. Chen, Q.; Li, S.; Liu, Y.; Zhang, X.; Tang, Y.; Chai, H.; Huang, Y. Size-controllable Fe-N/C single-atom nanozyme with exceptional oxidase-like activity for sensitive detection of alkaline phosphatase. Sens. Actuators B Chem. 2020, 305, 127511. [Google Scholar] [CrossRef]
  29. Liu, P.; Li, X.; Xu, X.; Niu, X.; Wang, M.; Zhu, H.; Pan, J. Analyte-triggered oxidase-mimetic activity loss of Ag3PO4/UiO-66 enables colorimetric detection of malathion completely free from bioenzymes. Sens. Actuators B Chem. 2021, 338, 129866. [Google Scholar] [CrossRef]
  30. Xie, Y.; Yu, Y.; Lu, L.; Ma, X.; Gong, L.; Huang, X.; Liu, G.; Yu, Y. CuO nanoparticles decorated 3D graphene nanocomposite as non-enzymatic electrochemical sensing platform for malathion detection. J. Electroanal. Chem. 2018, 812, 82–89. [Google Scholar] [CrossRef]
  31. Gao, P.; Hussain, M.Z.; Zhou, Z.; Warnan, J.; Elsner, M.; Fischer, R.A. Zr-based metalloporphyrin MOF probe for electrochemical detection of parathion-methyl. Biosens. Bioelectron. 2024, 261, 116515. [Google Scholar] [CrossRef] [PubMed]
  32. Xiao, Z.; Li, Y.; Nie, Y.; Lu, L.; Yang, C. A Cu2+-triggered turn-on fluorescence non-enzymatic probe based on covalent organic framework for the detection of methyl parathion. Anal. Chim. Acta 2025, 1346, 343775. [Google Scholar] [CrossRef] [PubMed]
  33. Zhang, K.; Elder, T.; Cheng, Z.; Zhan, K.; Peng, Y.; Li, M. Cellulose nanofiber-templated metal-organic frameworks for fluorescent detection of methyl parathion pesticides. J. Environ. Chem. Eng. 2024, 12, 112670. [Google Scholar] [CrossRef]
  34. Ma, J.; Huang, G.; Li, J.; Li, J.; Yan, L.; Wei, J.; Zhang, Q. Facile green preparation of highly fluorescent nitrogen-doped carbon dots from bagasse for sensitive methyl parathion detection. Food Chem. 2025, 466, 142183. [Google Scholar] [CrossRef] [PubMed]
Scheme 1. Schematic illustration for the fabrication of Co,N-TiO2@ZrO2/3DGH and the electrochemical detection of malathion.
Chemosensors 13 00167 sch001
Figure 1. TEM images of (a) Co, N−TiO2, (b) ZrO2, and (c) Co,N−TiO2@ZrO2/3DGH. (d) XRD patterns of Co,N−TiO2@ZrO2/3DGH. XPS of (e) Ti 2p and (f) Zr 3d states in (I) Co, N−TiO2, (II) ZrO2 and (III) Co,N−TiO2@ZrO2/3DGH. (g) Raman spectra of Co,N−TiO2@ZrO2/3DGH. (h) UV–vis diffuse spectra and (i) corresponding Tauc plot curves of Co, N−TiO2, ZrO2 and Co,N−TiO2@ZrO2/3DGH.
Chemosensors 13 00167 g001
Figure 2. (a) In situ XRD patterns, (b) in situ Raman spectra, and (c) comparative XPS of the Zr 3d and (d) comparative EIS Nyquist plots of Co,N-TiO2@ZrO2/3DGH electrodes before (I) and after (II) MP exposure.
Chemosensors 13 00167 g002
Figure 3. (a) Schematic diagram of dual-mode portable sensors; (b) picture of dual-mode portable sensor, (I) EC mode, (II) PEC mode; (c) CVs, (d) EIS and (e) SWVs of (I) Co,N−TiO2/3DGH, (II) TiO2/3DGH, (III) ZrO2/3DGH, (IV) Co,N−TiO2@ZrO2/3DGH, (V) Co,N−TiO2, (VI) TiO2 and (VII) ZrO2; (f) photocurrent responses of (I) Co,N−TiO2/3DGH, (II) Co,N−TiO2@ZrO2/3DGH, (III) TiO2/3DGH, (IV) Co,N−TiO2, (V) TiO2 and (VI) ZrO2/3DGH; (g) stability of Co,N −TiO2@ZrO2/3DGH electrode.
Chemosensors 13 00167 g003
Figure 4. (a) Photocurrent response of MP at different concentrations in PEC mode. (b) Relationship between photocurrent response and concentration of MP in the concentration range of 0.1 ng mL−1–100 μg mL−1. (c) Reproducibility of the proposed PEC mode. (d) SWV response of different concentrations of MP in EC mode. (e) Relationship between SWV response and concentration of MP in the concentration range of 1 ng mL−1−1 mg mL−1. (f) Reproducibility of the proposed EC mode. (g) The stability of this dual-mode portable sensor tested in 10 ng mL−1 MP (using 6 sensors in parallel testing).(h) The electrodes were stored for 2, 4, 6, 8, 10 and 14 days to detect MP (10 ng mL−1) using the PEC mode and EC mode of the dual-mode sensor, respectively. (i) Selective testing of dual-mode portable sensors in the PEC and EC modes, where all fertilizers and pesticides were at a concentration of 10 ng mL−1.
Chemosensors 13 00167 g004
Table 1. Determination of DDVP concentrations in real samples (n = 3).
Test SolutionPEC ModeEC Mode
SSWS0.17 ± 0.04 ng/mL0.21 ± 0.03 ng/mL
SSWS-P14.74 ± 0.15 ng/mL15.49 ± 0.22 ng/mL
SCS0.49 ± 0.03 ng/mL0.68 ± 0.05 ng/mL
SCS-P
(10 ng/mL)
9.78 ± 0.18 ng/mL10.45 ± 0.23 ng/mL
Disclaimer/Publisher’s Note: The statements, opinions and data contained in all publications are solely those of the individual author(s) and contributor(s) and not of MDPI and/or the editor(s). MDPI and/or the editor(s) disclaim responsibility for any injury to people or property resulting from any ideas, methods, instructions or products referred to in the content.

