Abstract
The gas-sensitive performance and selectivity of gas sensors via different Sn-doped indium oxide (In2O3) films have been investigated. The response characteristics were significantly enhanced to methanol (CH4O), ethanol (C2H6O), and acetone (C3H6O) with the increase in Sn content, while the response time and the recovery time became shorter. The sensor exhibited the strongest response to ethanol, followed by acetone and then methanol with all the ratios of In2O3 (90%, 85%, and 80%) and SnO2 (10%, 15%, and 20%). The mechanism of Sn doping on the gas sensing selectivity was calculated using the density functional theory (DFT) method, which perfectly explained the experimental results. The sensors demonstrated high selectivity towards ethanol, even in the presence of interfering gases. In addition, the sensors showed effective detection of the target gas with 10 ppb and demonstrated good repeatability. This work systematically analyzed the priority selectivity of In2O3-based gas sensors, providing a new path for gas detection in multi-interference and complex environments.
1. Introduction
Methanol, ethanol, and acetone are the most commonly used organic solvents in human production and daily life, which have demonstrated a wide range of potential applications in various areas such as the food industry, biotechnology, medical sterilizations, chemical engineering, and health protection [1]. However, methanol is toxic and volatile, and can be oxidized to formaldehyde and formic acid through inhalation or skin contact, posing a serious threat to the human nervous and hematological systems [2]. Ethanol is volatile and flammable, and individuals exposed to high ethanol concentrations for prolonged periods of time may encounter a range of health issues such as respiratory disturbances, headaches, drowsiness, eye irritation, and liver damage [3]. Acetone is also volatile and flammable, and penetrates the human body via multiple routes, causing damage to lung, liver, and kidney tissues [4].
Currently, electrochemical sensors, contact combustion sensors, infrared sensors, and semiconductor gas sensors are the main gas sensors in the field of gas detection [5,6,7,8]. In semiconductor sensors, the metal oxide semiconductor (MOS) has emerged as the most widely used gas-sensitive material due to its exceptional performance characteristics, such as high response, rapid response and recovery speeds, excellent long-term stability, low economic cost, and ease of system integration [9]. However, this type of sensor still faces several challenges, especially in terms of poor gas selectivity and limited anti-interference ability. To address these issues, researchers have been exploring many methods to improve sensor performance, such as doping [10,11,12], surface modification with noble metals [13,14,15], constructing heterojunction structures [16,17,18], and designing nanoscale architectures [19,20,21].
As an n-type semiconductor material, indium oxide (In2O3) exhibits great potential for gas sensing applications due to its wide bandgap (ranging from 3.5 to 4.3 eV) [22], high electrical conductivity, and ability to detect multiple gases [23]. Our previous work prepared many kinds of gas sensors based on In2O3 materials with different nanostructures, such as nanowires and nano-pyramids, by magnetron sputtering [24,25]. Other researchers have also created lots of structures in this area, such as Co3O4/In2O3 heterojunctions [26] and 3D flower-like In2O3 nanosheets [27].
In this study, a large number of gas sensors with different Sn-doped In2O3 films were prepared via magnetron sputtering. Mixture gas tests were conducted; the three typical gases of methanol, ethanol, and acetone were selected as test targets. The prepared Sn-doped In2O3 sensors exhibited extremely high selectivity to ethanol, followed by acetone and methanol. The density functional theory (DFT) method was applied to reveal the mechanism of Sn doping on the gas sensing performance of crystal structures. Compared with the existing studies, this paper systematically explores for the first time the regulatory effect of different Sn doping ratios on the gas-sensitive selectivity of In2O3 thin films and combines DFT calculations to reveal the electronic mechanism of Sn-O bond adsorption of methanol, ethanol, and acetone. This work provides a new strategy for optimizing the selectivity of MOS sensors through precise doping.
2. Experimental Sections
2.1. Preparation of Gas Sensors
Magnetron sputtering was employed to fabricate gas-sensitive materials onto the surfaces of ceramic tubes. Three targets with different In2O3/SnO2 mass ratios (In2O3:SnO2 = 90 wt%:10 wt%, designated as S1; 85 wt%:15 wt%, designated as S2; and 80 wt%:20 wt%, designated as S3) were selected. During the sputtering process, a sputtering power of 300 W (in RF mode), a deposition temperature of 300 °C, a sputtering pressure of 2 Pa, an argon flow rate of 25 sccm, and a sputtering time of 4 min were used to ensure the uniformity and densification of the films. Then, the samples were annealed at 480 °C for 30 s through a rapid annealing furnace. And then, the annealed samples were welded to a heating wire and a six-pin base using solder wire. The sensor was composed of a ceramic tube and a heating wire. The electrodes on the surface of the ceramic tube were platinum electrodes, and the distance between the electrodes was 1 mm. The sensors were heated, and the heating temperature was incrementally raised from 240 °C to 390 °C (the corresponding heating voltage was 3.8 V to 5.2 V), with each 25 °C increase occurring every 10 min. At last, the sensors were heated at 390 °C for 30 min until the resistance of the sensors stabilized. The specific experimental process is shown in Figure 1.
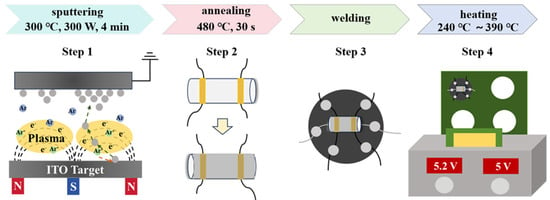
Figure 1.
Schematic diagram of Sn-doped In2O3 sensor preparation process.
2.2. Sensing Selectivity Test Method
The gas sensitive test was conducted using a WS-30A (Winsen, Zhengzhou), with a measurement voltage of 5 V and a heating voltage of 4.28 V (corresponding to a test temperature of 280 °C). The gas sensitive test was carried out in an 18 L sealed space. The required liquid volume corresponding to the target gas concentration was calculated using Equation (1). When the sensor was used to detect reducing gases, the response could be defined as Equation (2).
In Equation (1), the volume represents the extracted liquid volume, Cgas is the gas concentration corresponding to the extracted liquid, M is the relative molecular mass of the gas, V is the volume of the sealed space, ρliquid is the density of the extracted liquid, and ω is the mass fraction of the extracted liquid. In Equation (2), S is the response value of the gas sensor, Rair is the resistance of the sensor in air, and Rgas is the resistance of the sensor in the target gas.
For the priority selectivity test of mixed gases, two micro-syringes were used to extract the liquid volumes corresponding to the required concentrations of the target gas and interfering gas, respectively. These were then mixed in the evaporation station in sequence. The liquid was evaporated to gas, and a small fan in the sealed space was used to evenly distribute the mixed gas in the sealed space for testing.
2.3. Computational Methods
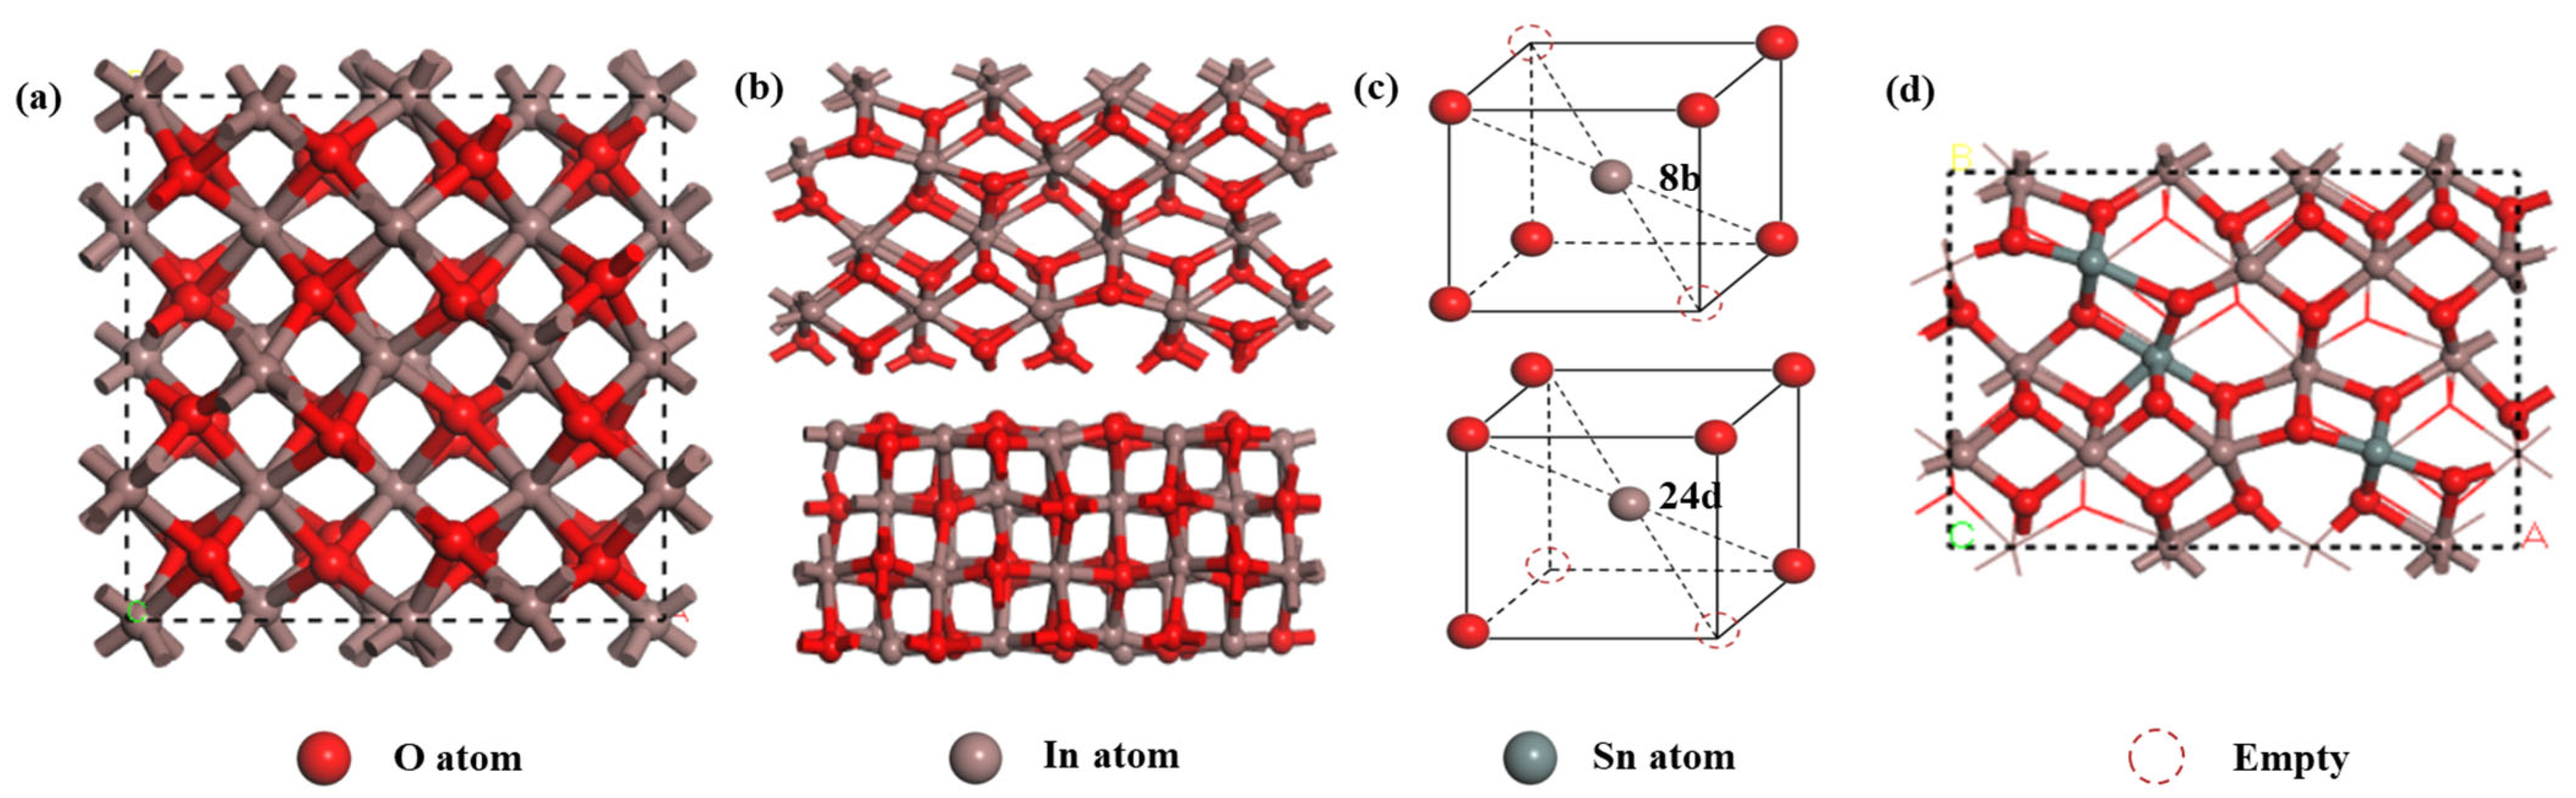
The Cambridge Sequential Total Energy Package (CASTEP) module in Materials Studio (MS) was utilized for the calculations. This module was based on the pseudopotential plane-wave method of DFT, and Generalized Gradient Approximation (GGA) in the form of Perdew–Burke–Ernzerhof (PBE) was selected as the exchange–correlation functional. Additionally, the DFT-D2 method was introduced for dispersion correction to enhance the calculation accuracy [28,29]. The In2O3 material exhibits both a cubic ferromanganese structure and a hexagonal corundum-type structure [30]. In this study, the more stable cubic ferromanganese structure was chosen for our calculations, which possesses a lattice parameter of 10.15 Å and a forbidden band width of 2.45 eV [31]. A three-dimensional schematic of the structure is depicted in Figure 2a.

Figure 2.
(a) Schematic representation of the cubic crystal structure of In2O3; (b) illustration of the (110) surface of In2O3; (c) lattice diagram depicting In atoms positioned within octahedral sites formed by O atoms; and (d) computer model of Sn-doped In2O3.
Considering the characteristics of the crystal growth direction of In2O3, the (110) low-index plane was selected for calculations because of its heightened activity during the crystal growth process, as illustrated in Figure 2b. In the calculation setup, the plane-wave truncation energy was set to 380 eV, and the K-point grid in the Brillouin zone was set to 3 × 3 × 3. To ensure the accuracy of the calculation results, the spin state of the electrons and dipole correction were fully considered [32]. Furthermore, a vacuum layer of 20 Å was introduced along the Z-direction to mitigate inter crystalline interactions arising from periodic boundary conditions.
In the doping simulations, substitutional doping was employed. The In2O3 structure contains two different types of In atoms at the 8b and 24d positions. A single Sn atom is more likely to replace an In atom at the 8b position, and two Sn atoms tend to replace In atoms at both the 8b and 24d positions, respectively [33]. We adopted the doping order of b-d-b-d in this study. As a result, three Sn atoms were successfully doped into the structure, as shown in Figure 2d. For all the calculations, the tolerances for energy, maximum force, and maximum displacement were set as 10−5 eV/atom, 0.03 eV/Å, and 0.001 Å, respectively.
3. Results and Discussion
3.1. Morphologies and Elemental Composition for Different Films
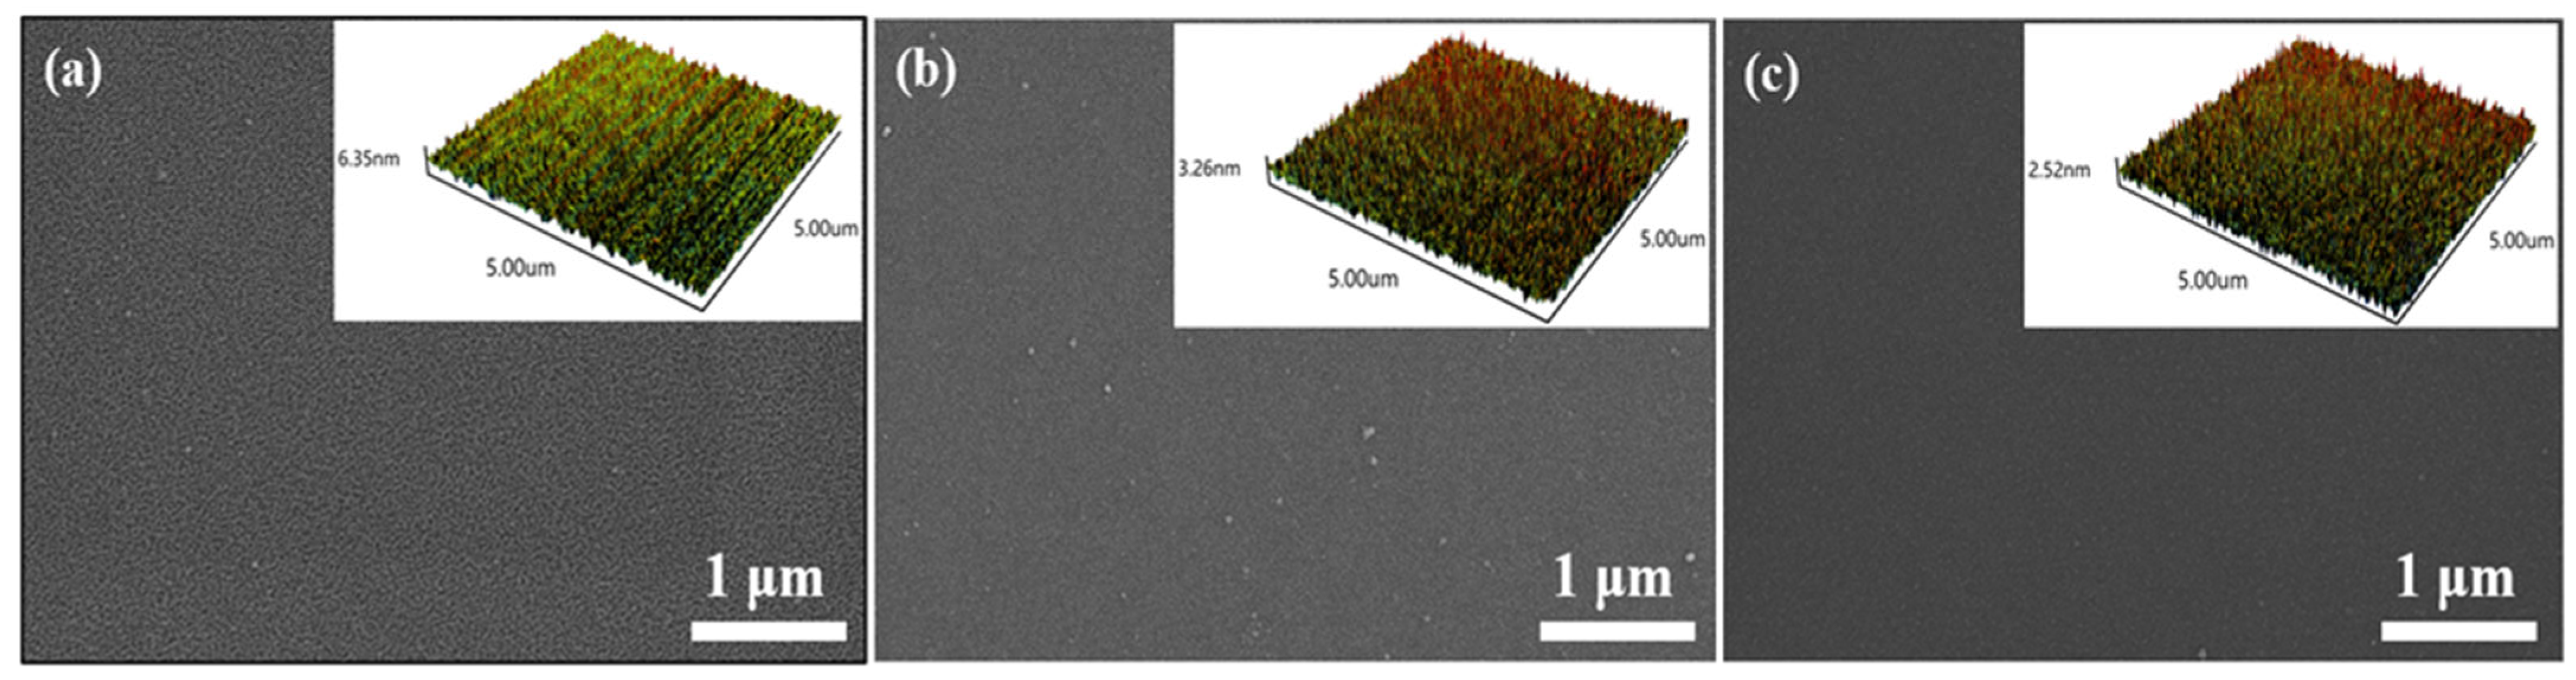
As shown in Figure 3, the SEM images show the morphology of different Sn-doped In2O3 films with the thickness of 77.7 nm, 61.8 nm, and 46.2 nm, and the insets are the AFM results. The root mean square (RMS) error for S1, S2, and S3 was 0.878 nm, 0.684 nm, and 0.520 nm, respectively, which means the doping of Sn can decrease the surface roughness of films. This phenomenon indicates that the doping of the Sn has a significant inhibitory effect on the grain growth of In2O3 [34], and the reduction in grain size transforms the sensor into grain-controlling mode [35]. Table 1 provides detailed content data for each constituent element in three different samples. As the mass ratio of In2O3:SnO₂ in targets decreases, the contents of In and O elements in the prepared films exhibit a notable decreasing trend, while the Sn element content increases accordingly. It is noteworthy that the difference in Sn content between S2 and S3 is negligible, suggesting that the doping amount of Sn tends to stabilize below a certain critical ratio.
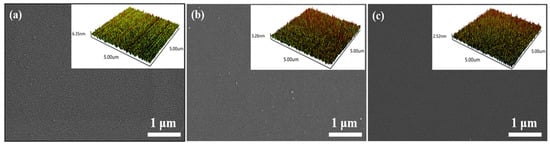
Figure 3.
The SEM and AFM images of (a) S1, (b) S2, and (c) S3 samples.

Table 1.
Elemental contents of samples synthesized via sputtering targets with varied composition ratios.
3.2. Gas Sensing Properties of Sensors
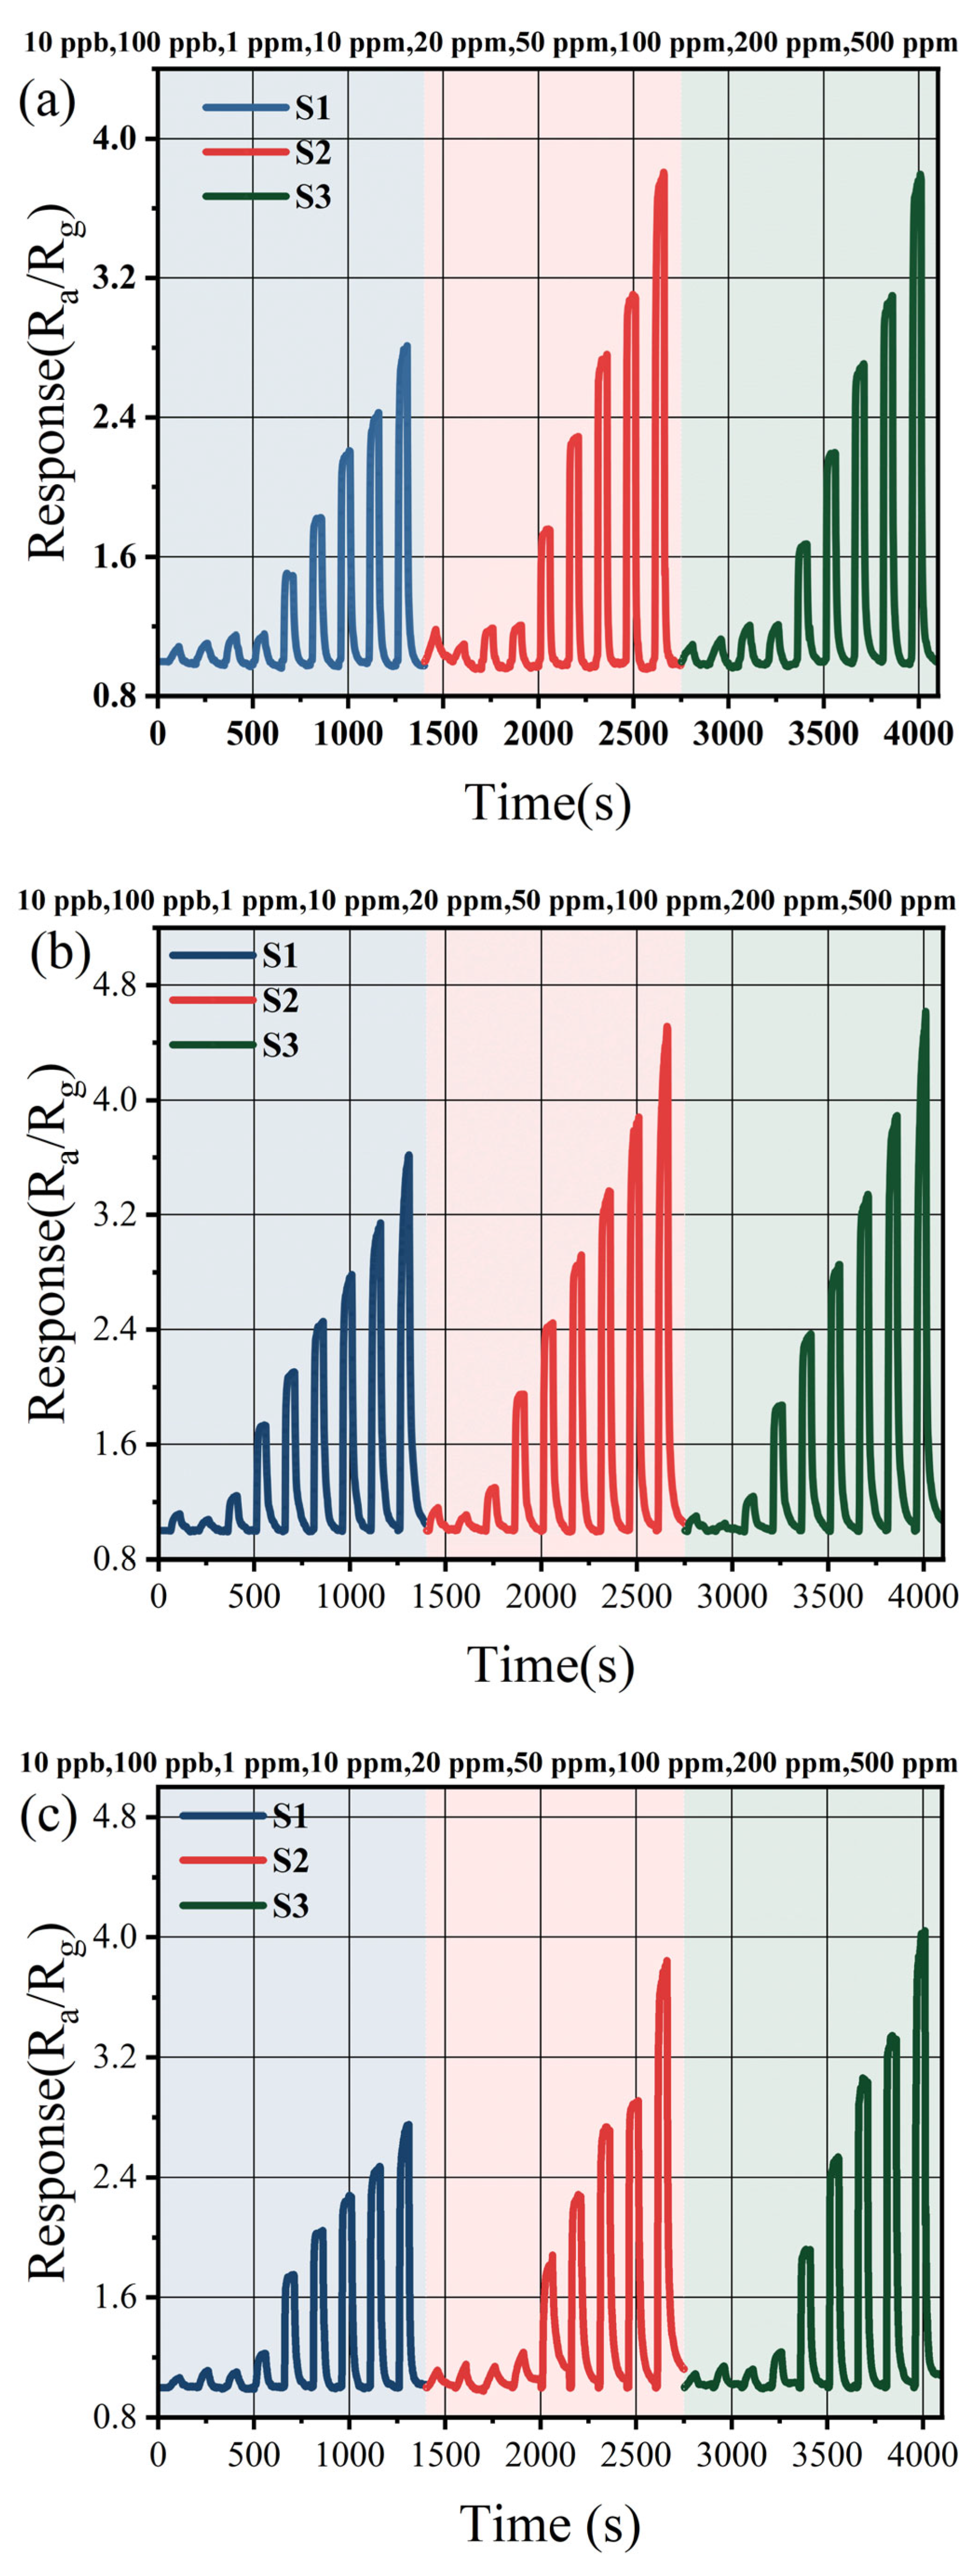
The working temperature of the sensors was set at 280 °C to ensure both high response and a long lifetime. As the Sn content increases, the response to the three target gases is significantly enhanced, and the response and recovery times are significantly reduced. This confirms the positive modulation effect of Sn doping on the gas sensing performance of In2O3. In particular, the sensors exhibit the strongest response to ethanol under the same concentration conditions, followed by acetone and then methanol. The response value of S1 to 100 ppm methanol was 2.21, and the response and recovery times were 6/19 s. The response value of S1 to 100 ppm ethanol was 2.76, and the response and recovery times were 5/8 s. The response value of S1 to 100 ppm acetone was 2.71, and the response and recovery times were 6/17 s. The response value of S2 to 100 ppm ethanol was 2.78, and the response and recovery times were 14/31 s. The response value of S2 to 100 ppm ethanol was 3.36, and the response and recovery times were 9/20 s. The response value of S2 to 100 ppm acetone was 3.34, and the response and recovery times were 9/25 s. The response value of S3 to 100 ppm methanol was 2.27, and the response and recovery times were 6/19 s. The response value of S3 to 100 ppm ethanol was 2.72, and the response and recovery times were 6/34 s. The response value of S3 to 100 ppm acetone was 3.03, and the response and recovery times were 3/16 s.
Figure 4 displays the dynamic response–recovery curves of three sensors toward methanol, ethanol, and acetone across a concentration range from 10 ppb to 500 ppm. For 500 ppm ethanol, the response value of the three sensors were measured as 3.61, 4.51, and 4.62, respectively. Notably, the response of S1 to these three target gases was significantly lower compared to those of S2 and S3. Given the similarity in Sn content between S2 and S3, their response performances toward the aforementioned gases exhibit minimal variability. Furthermore, all three sensors demonstrate effective detection of low concentrations of methanol, ethanol, and acetone. The limit of detection (LOD) of the three prepared sensors for methanol, ethanol, and acetone are 10 ppb. Among them, the response values of S2 to 10 ppb of methanol, ethanol, and acetone are 1.18, 1.16, and 1.11 respectively.
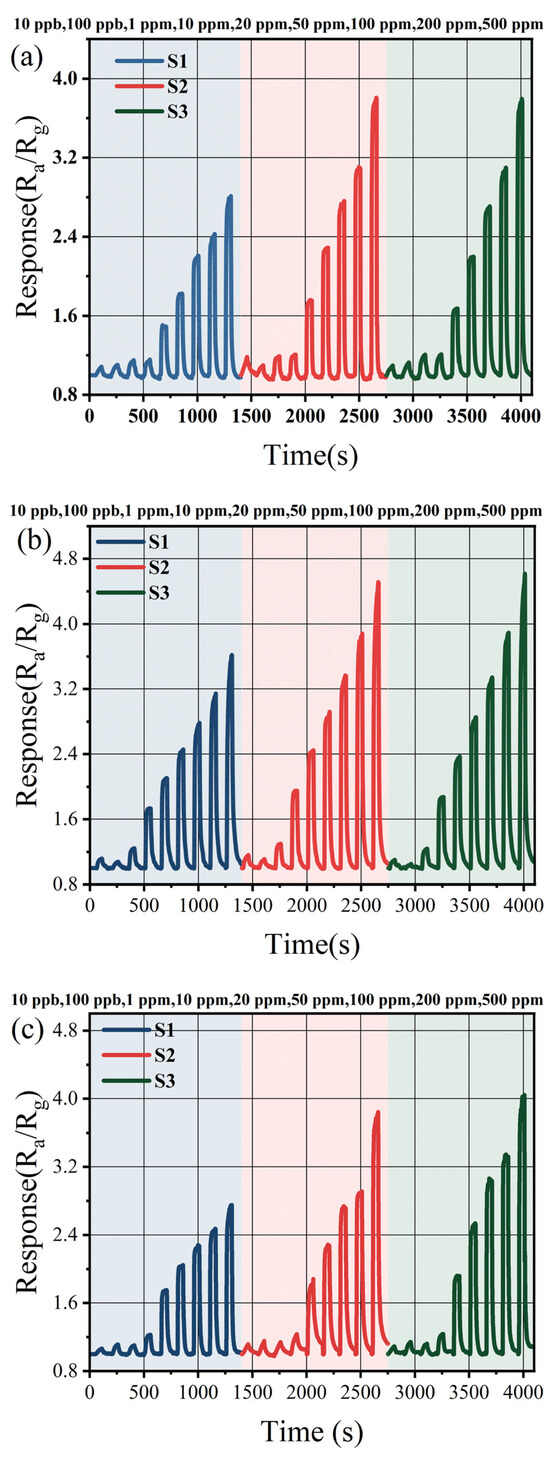
Figure 4.
(a) The methanol concentration test; (b) the ethanol concentration test; and (c) the acetone concentration test.
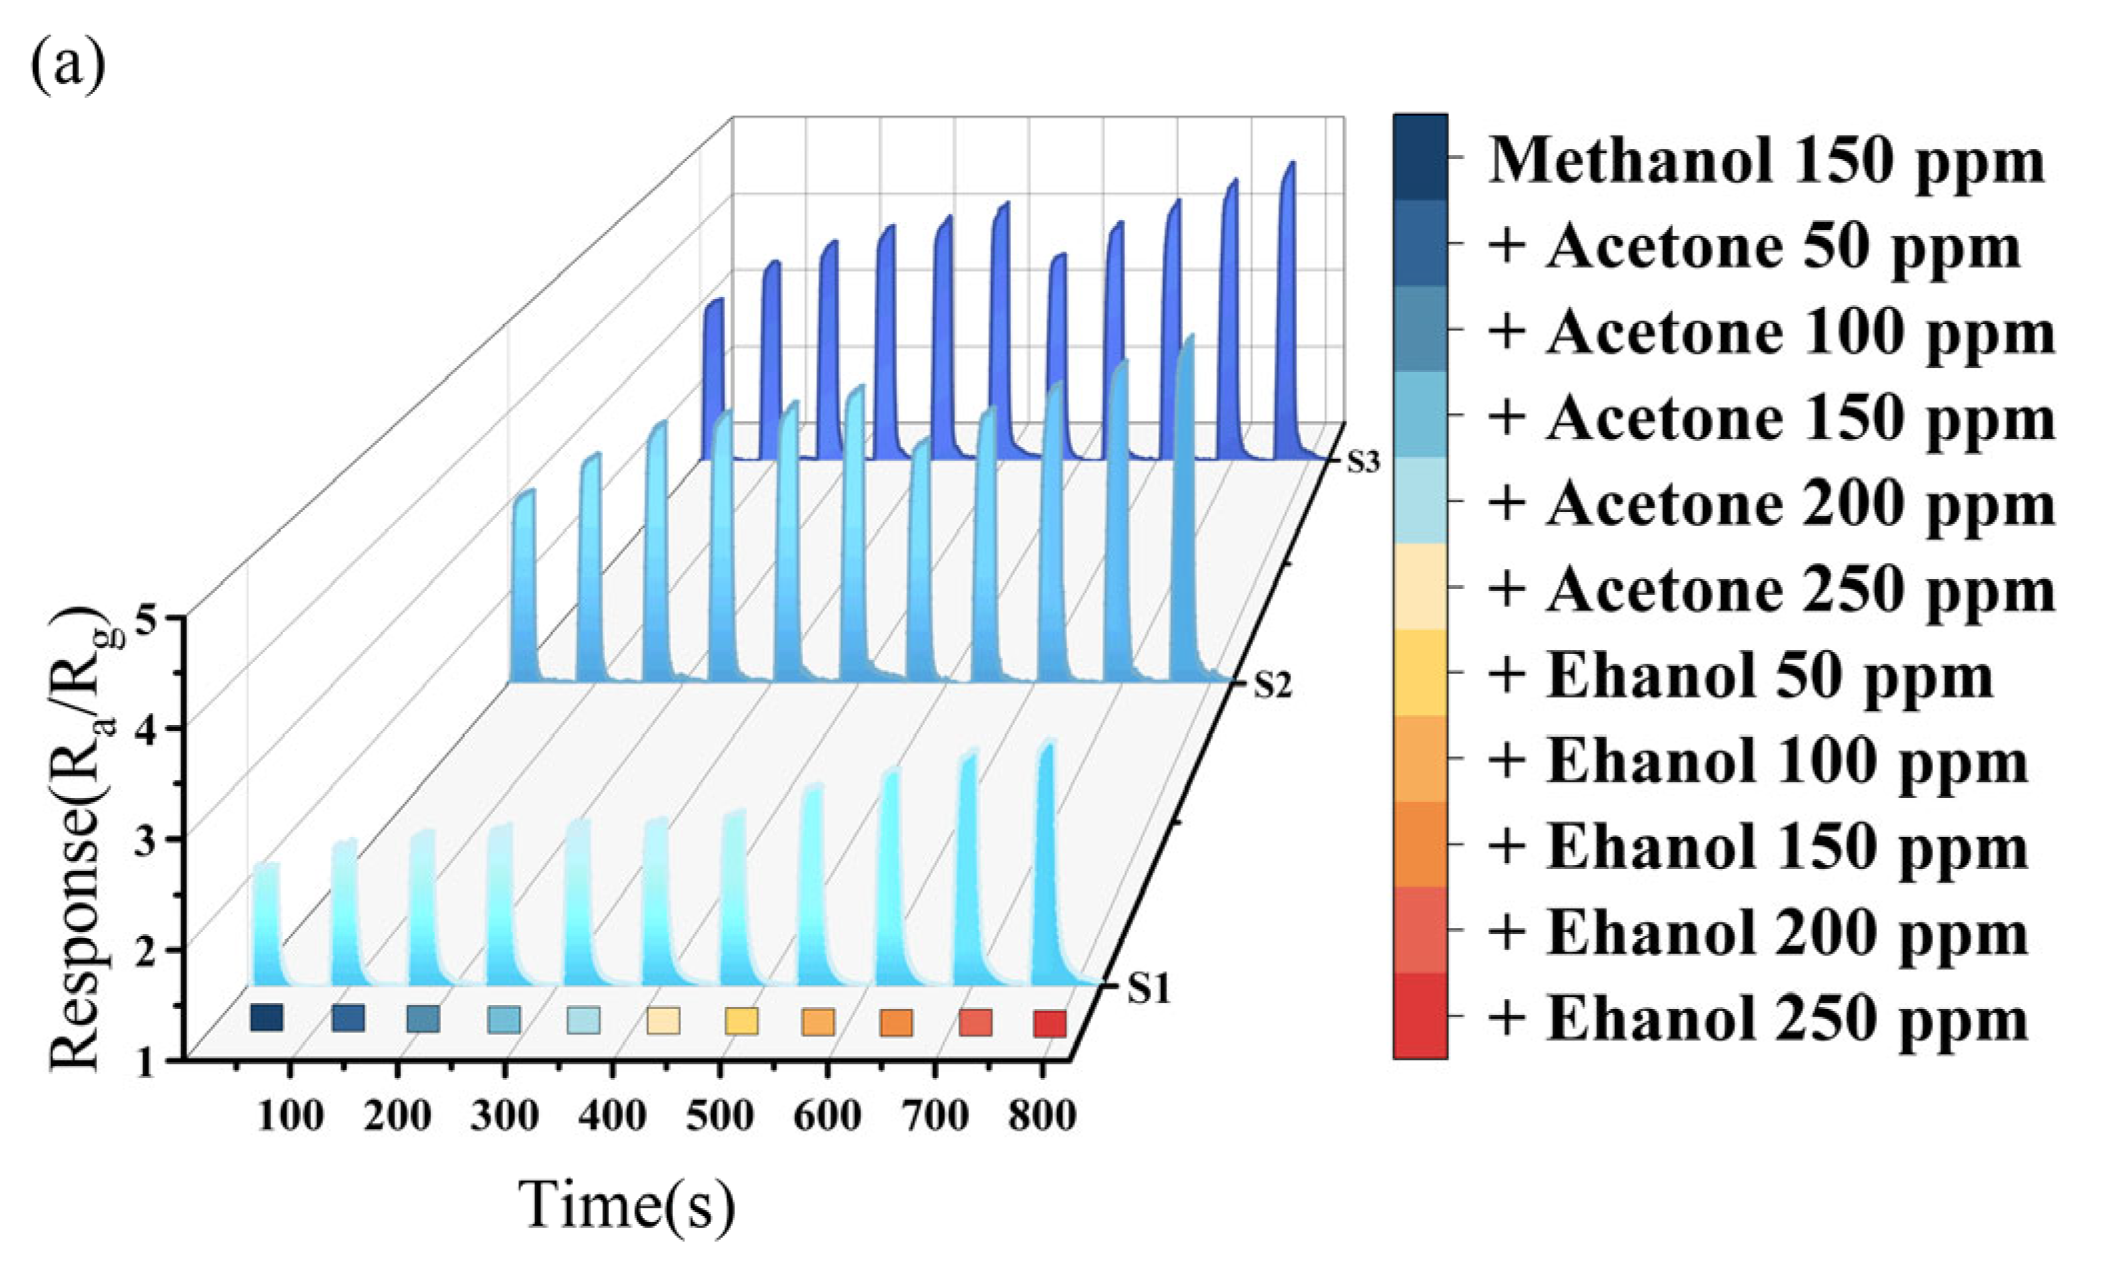
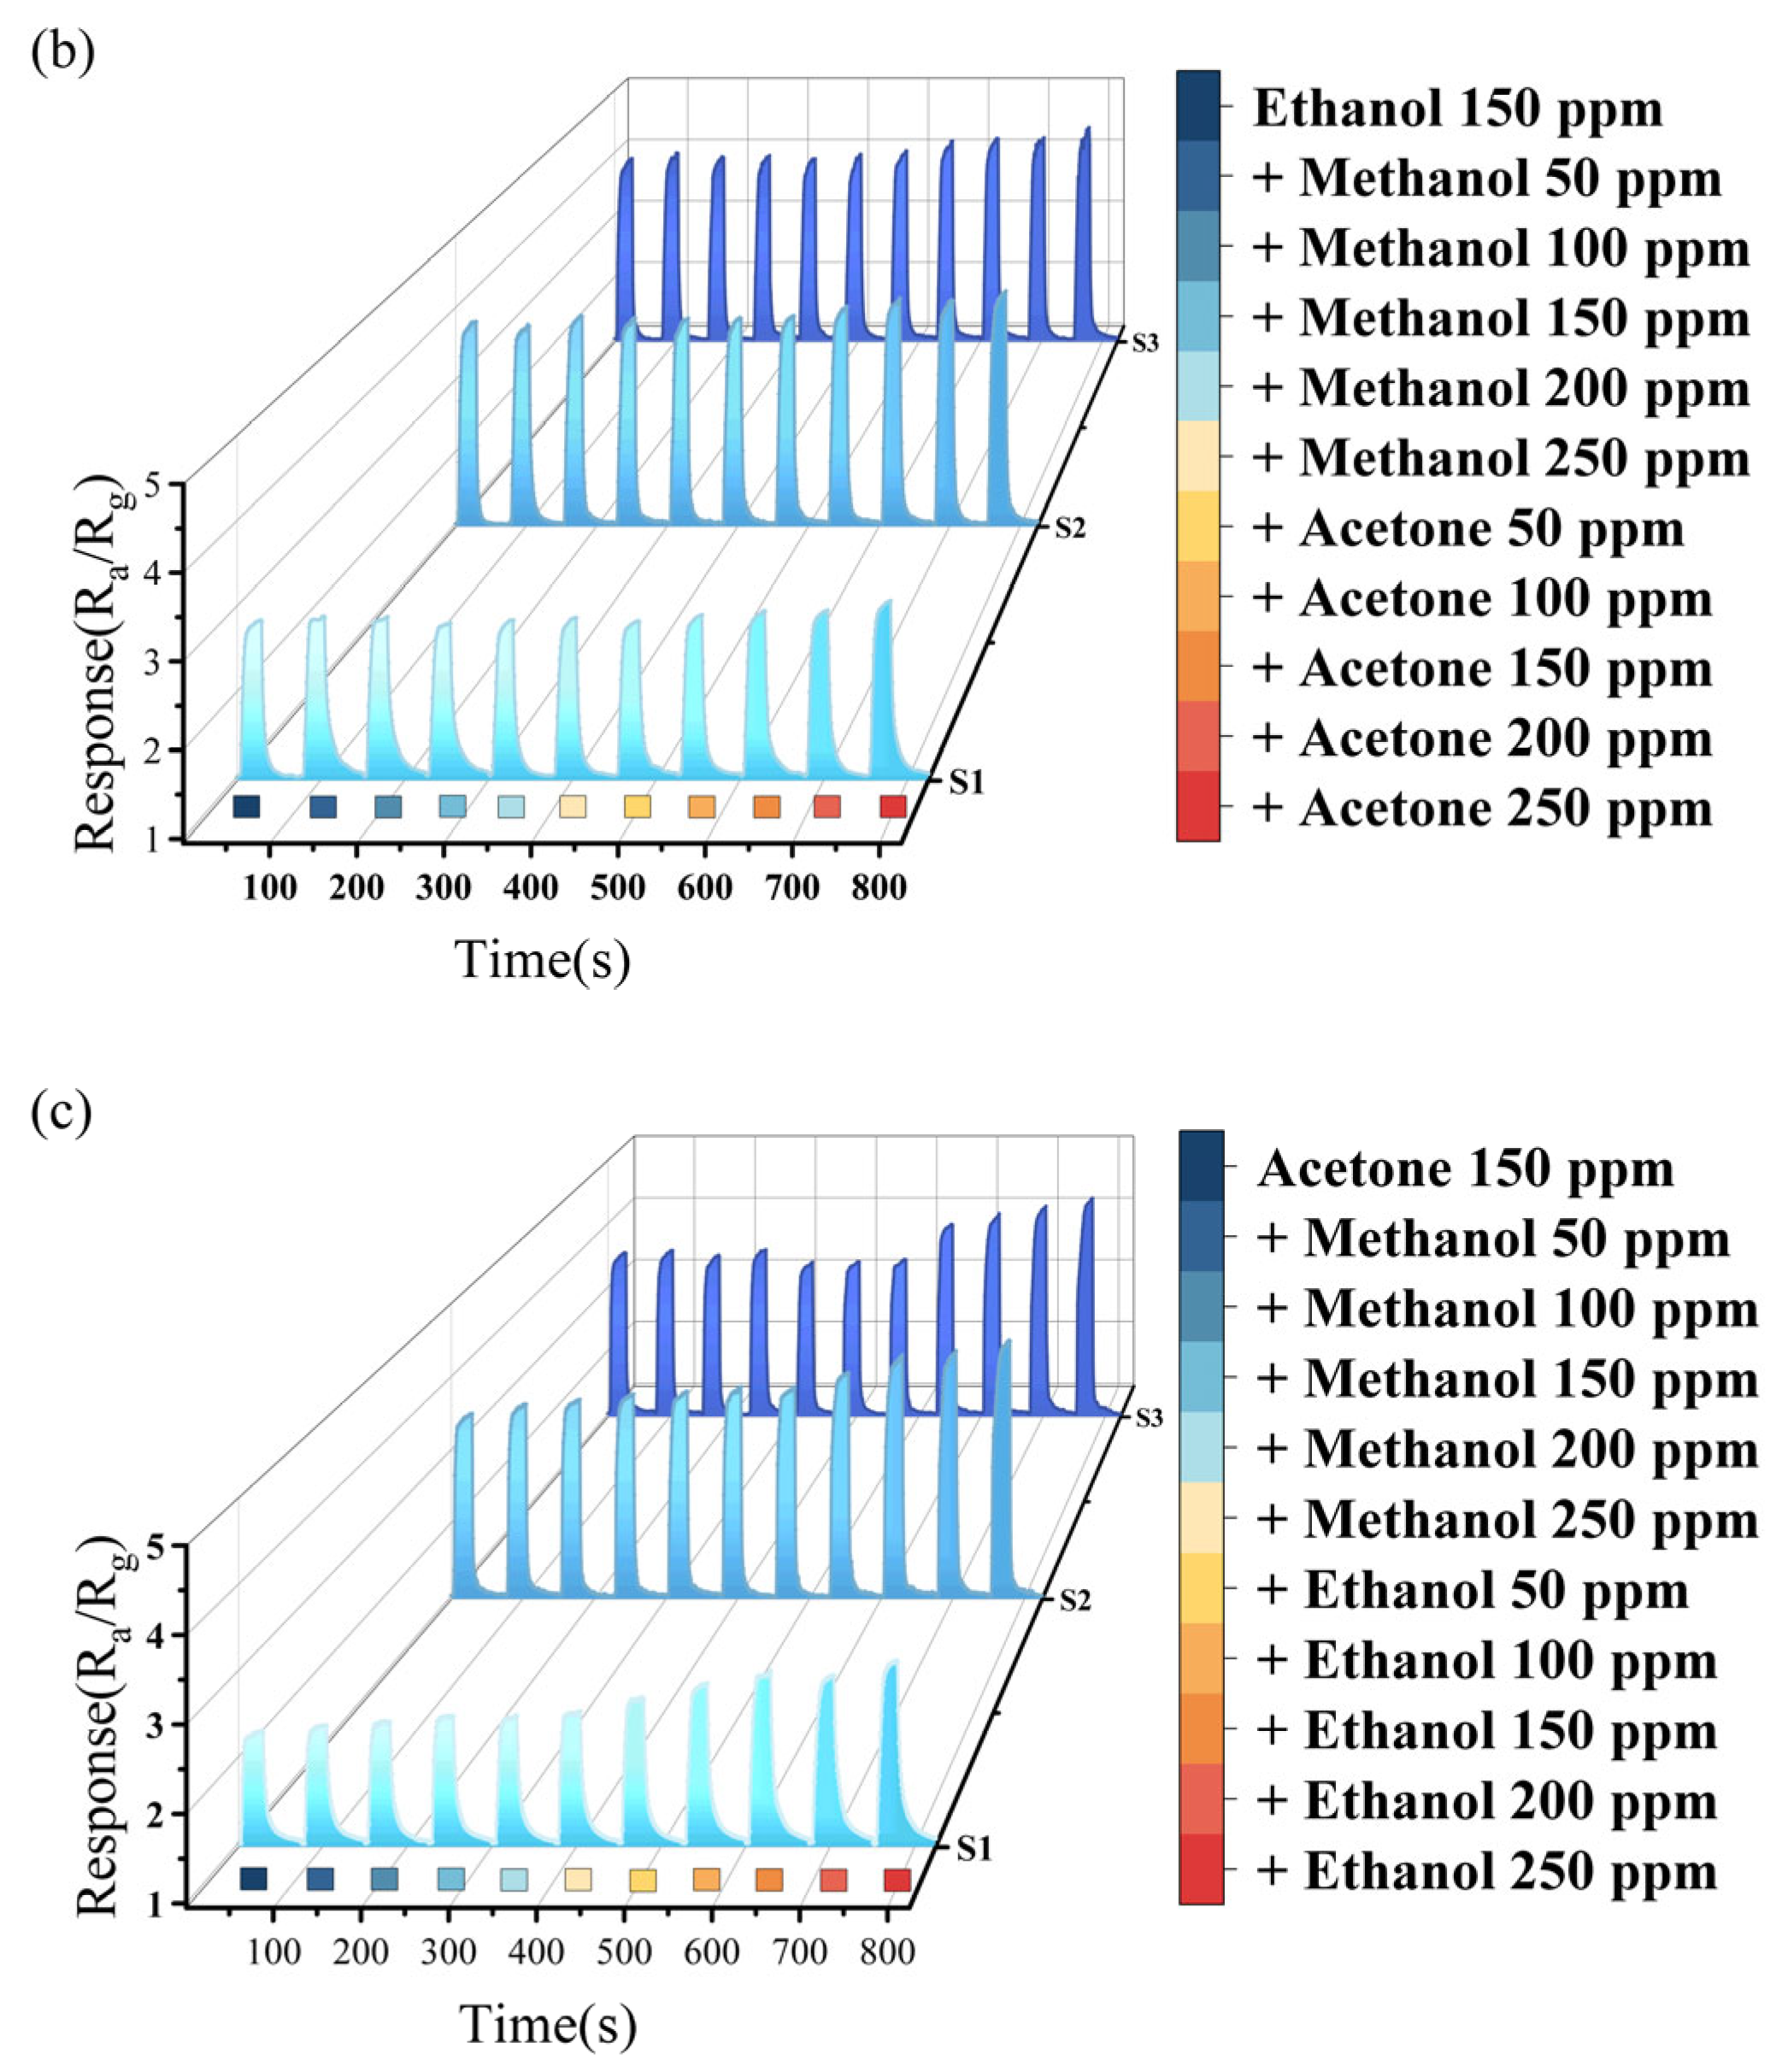
Figure 5 presents the response characteristics of the sensors in the case of pairwise gas mixing (the corresponding 2D image is shown in Supplementary Figure S1). In these tests, a fixed single gas concentration of 150 ppm was used, while the other two gases were added at concentrations ranging from 50 ppm to 250 ppm.

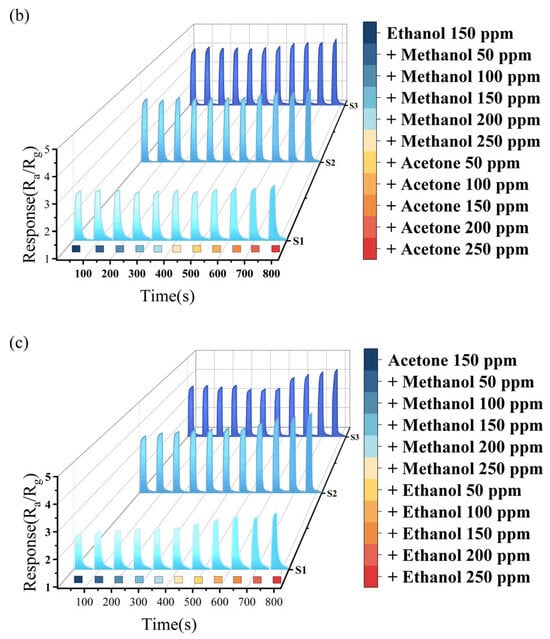
Figure 5.
(a) Methanol mixture gas test; (b) ethanol mixture gas test; and (c) acetone mixture gas test.
Figure 5a reveals an enhancement trend in the response of the three sensors to methanol when acetone or ethanol are added, indicating a synergistic adsorption effect among the mixed gases. As the concentration of the added gas increases, so does the interference with the detection results. The interference effect of ethanol on methanol is stronger than that of acetone on methanol. When the gas of acetone was mixed to 150 ppm, the changes in response value in methanol were 17.8%, 27.8%, and 30.7% for S1, S2, and S3, respectively. In contrast, when the same concentration of ethanol was mixed, the changes were 42.3%, 37.6%, and 41.1%, respectively. So, the S1 sensor exhibits the best selectivity for methanol when acetone is mixed in, and the S2 sensor shows the best selectivity for methanol when ethanol is mixed in.
Figure 5b demonstrates the response characteristics with mixing methanol or acetone into ethanol. No matter how the concentration of methanol changes, the anti-interference performance on ethanol’s detection is best. The response value changes of the three sensors to ethanol ranged from 1% to 1.4% at 150 ppm methanol. In contrast, when mixed with 150 ppm acetone, the magnitude of response value changes to ethanol increased significantly (3.9%, 8.6%, and 8.5%, respectively), suggesting that the interference effect of acetone on ethanol is stronger than that of methanol on ethanol. Among the three samples, all sensors show minimal interference effects in ethanol detection within a methanol-containing environment. And in an acetone-containing environment, S1 demonstrates better selectivity for ethanol.
Figure 5c shows the response characteristics adding methanol or ethanol into acetone. When 150 ppm methanol was added, the response value changes of three sensors were 7.7%, 3.8%, and 1.4%, respectively. However, mixing ethanol at the same concentration (150 ppm) led to significant changes in the three sensors (30.3%, 22.9%, and 17.4%, respectively). In the detection of acetone, methanol exerts less interference effect than ethanol. Regardless of the gas mixed in, S3 exhibits superior selectivity toward acetone. This indicates that the increasing Sn content enhances the selectivity of In2O3 for acetone detection. Although the Sn content of samples S2 and S3 is similar, with S2 having 0.22 at% more Sn than S3, the results of the concentration test showed no significant difference in their responses to methanol and ethanol. However, there was a marked difference in their responses to acetone, with S3 exhibiting a stronger response than S2. In the selectivity test, S3 demonstrated superior selectivity for acetone compared to S2. These results indicate that there is a threshold for the doping content of Sn in In2O3. When the doping content of Sn reaches this threshold, the selectivity for acetone is the best.
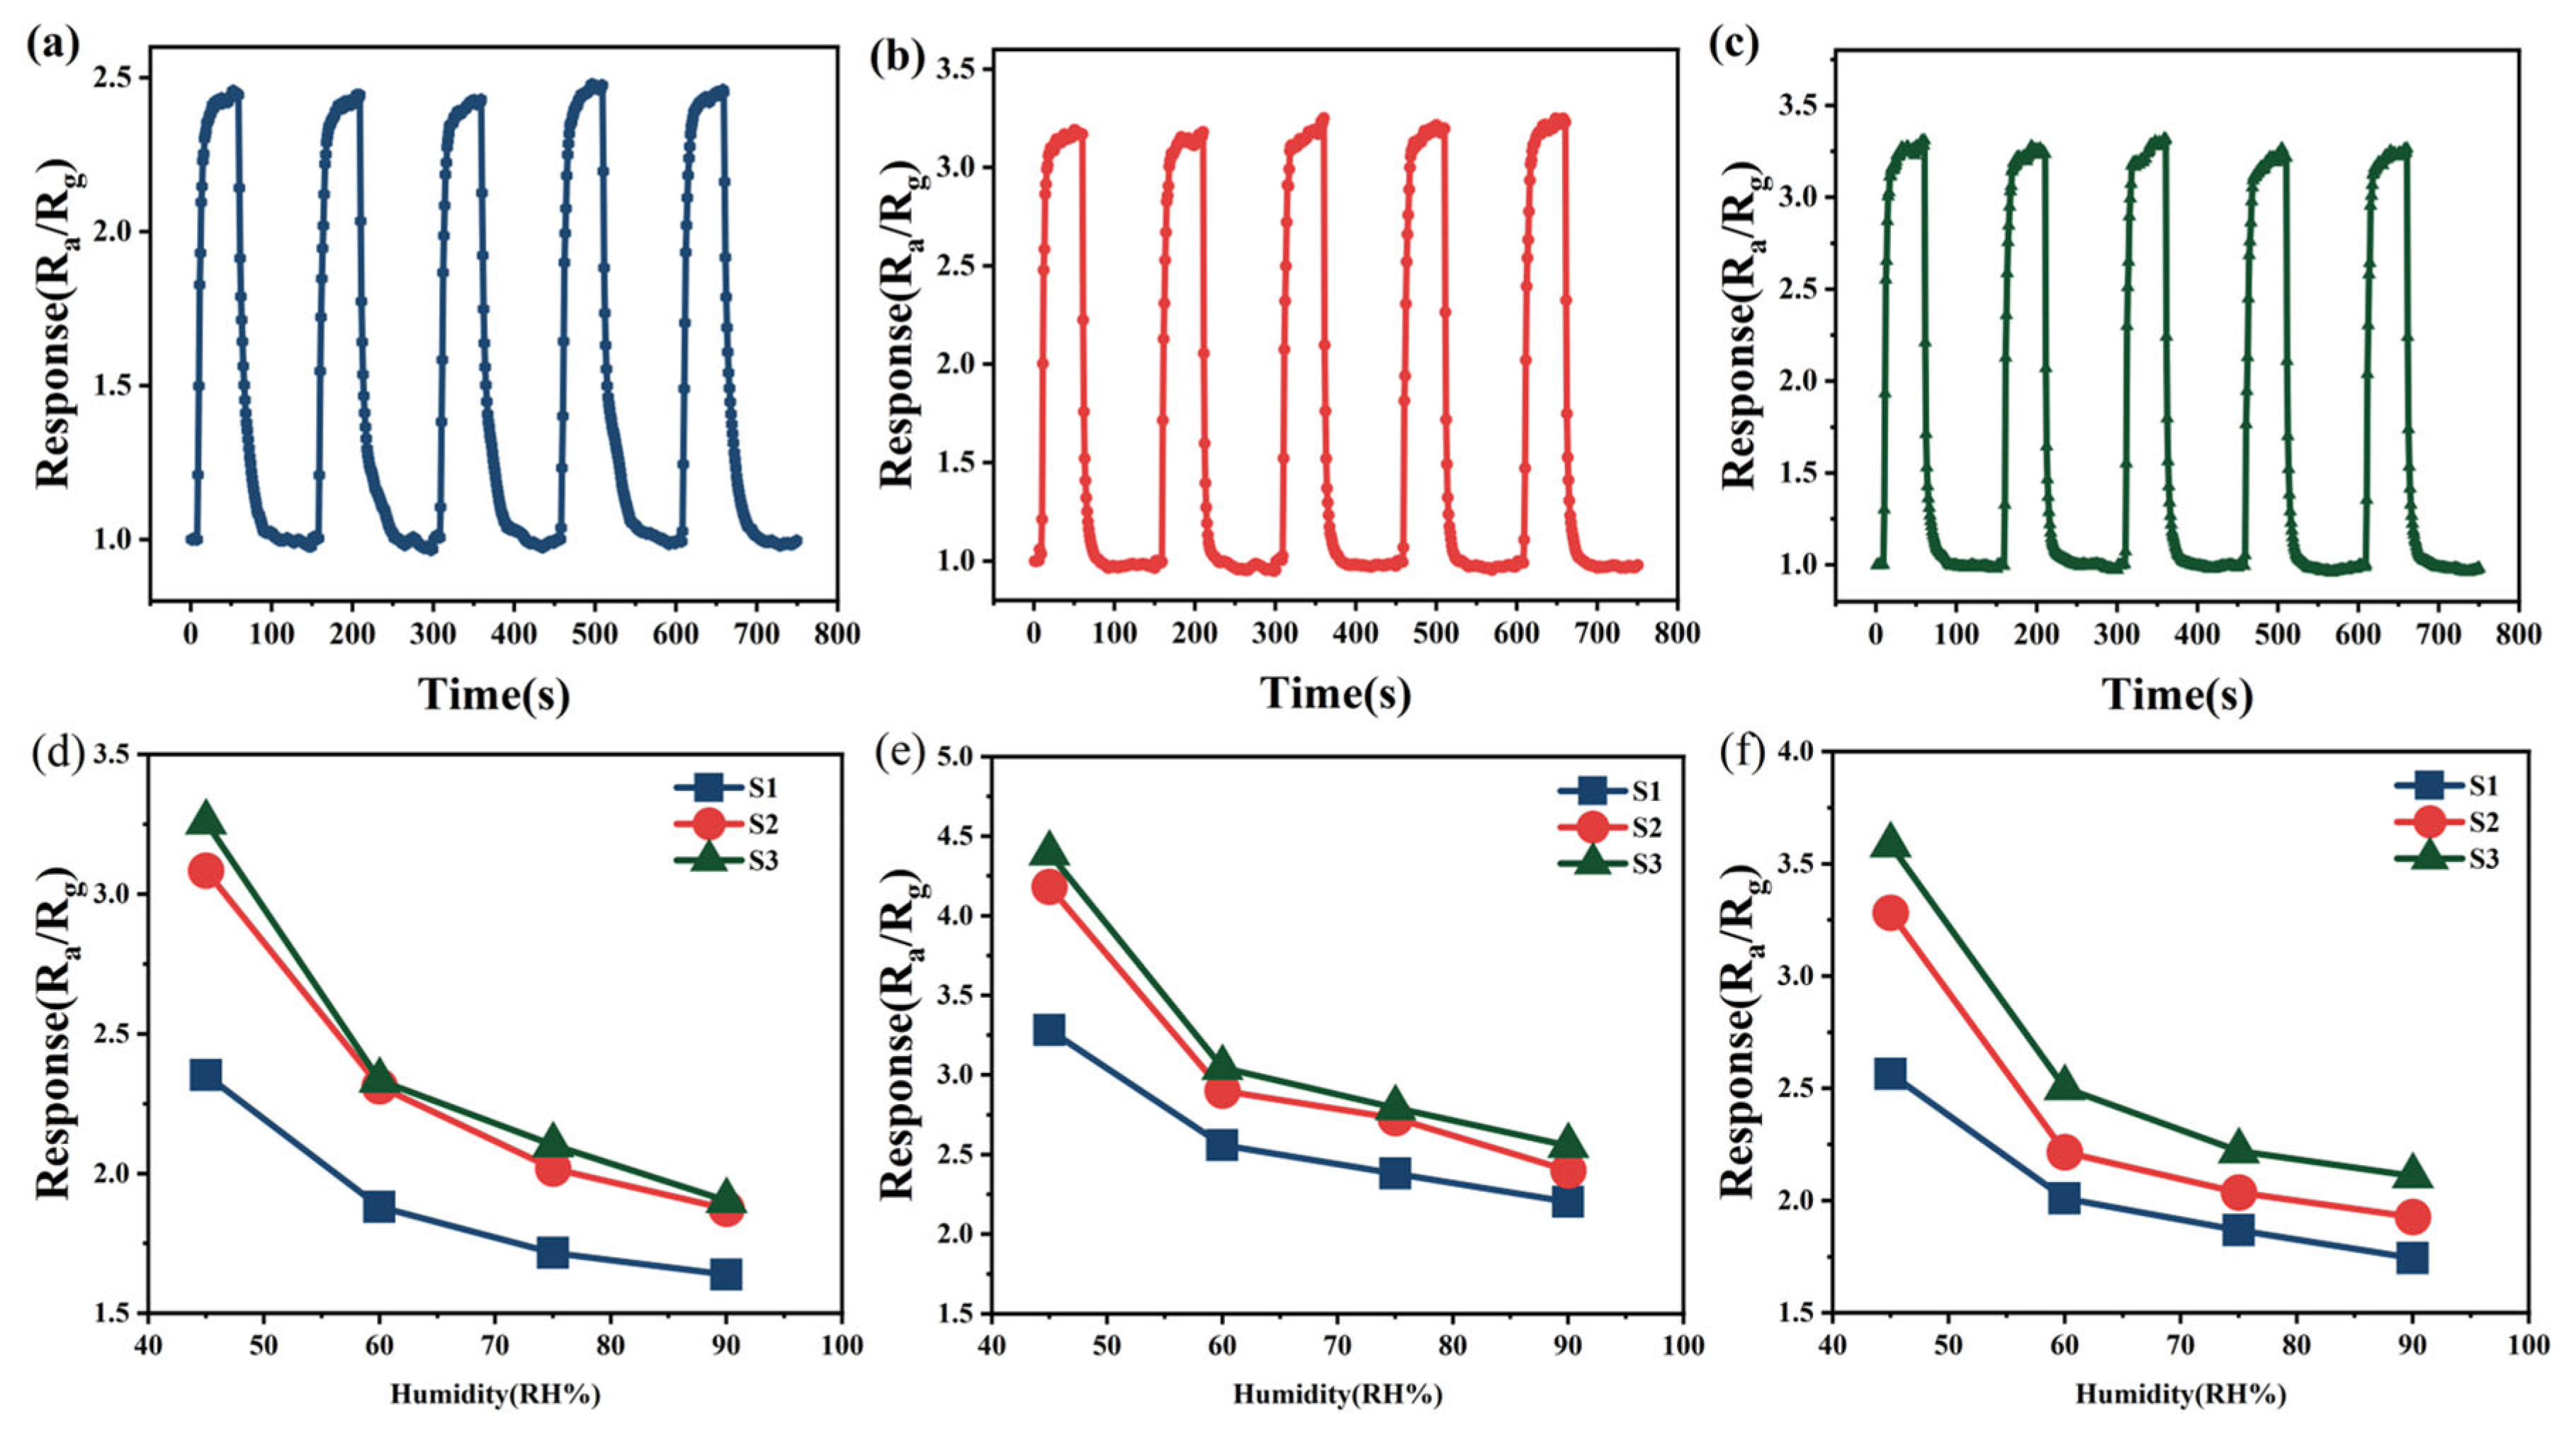
As shown in Figure 6a−c, five consecutive cycles of the repeatability test were conducted for the three semiconductor gas sensors at 100 ppm ethanol. The test results indicate that the response value of each sensor maintains a high degree of consistency over the repeated measurements, with the maximum deviation not exceeding 1.3%. This fully verifies the stability and repeatability of Sn-doped In2O3 sensors in gas detection.
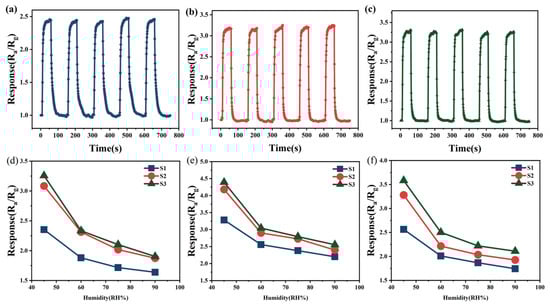
Figure 6.
(a) Repetitive test of S1 on 100 ppm ethanol; (b) repetitive test of S2 on 100 ppm ethanol; (c) repetitive test of S3 on 100 ppm ethanol; (d) humidity test of 200 ppm methanol; (e) humidity test of 200 ppm ethanol; and (f) humidity test of 200 ppm acetone.
Humidity, as one of the pivotal factors influencing the performance of gas sensors, was manipulated within a confined environment to assess the sensors’ gas sensing response characteristics under four distinct humidity conditions (45% RH, 60% RH, 75% RH, and 90% RH), as depicted in Figure 6d–f. The experimental results indicate that as humidity increased from 45% RH to 60% RH, the response of S1, S2, and S3 towards methanol, ethanol, and acetone decreased significantly. Specifically, the response value of the three sensors to 200 ppm methanol dropped to 79.93%, 74.97%, and 71.64% of their original value, respectively. For testing with 200 ppm ethanol, the response reductions were to 77.96%, 69.37%, and 69.34%, respectively. And the declines changed to 78.38%, 67.51%, and 69.83% under 200 ppm acetone, respectively. Notably, S1 exhibited superior humidity resistance compared to S2 and S3.
As humidity further increased, the decreasing trend in the sensors’ response to the target gases gradually slowed down. The decline in response with increasing humidity is attributed to the dissociation of water molecules at oxygen vacancies (Vo) on the oxide surface [36], leading to the occupation of active sites on the sensor’s surface. Both In2O3 and SnO2 belong to n-type oxides, which are inherently rich in Vo on their surfaces. Additionally, the doping of Sn further enhances the Vo concentration within In2O3, shown as Equation (3). The humidity stability advantage of S1 could be attributed to its lower Sn doping amount, resulting in the Vo concentration being lower than that of S2/S3. Since Vo is the main site for water molecule adsorption, S1 demonstrates stronger humidity resistance compared to S2 and S3. Additionally, as humidity continued to rise, the adsorption of water molecules by the sensors gradually approached saturation, resulting in a flattened trend in the changes in the sensors’ response value.
3.3. Gas Adsorption on Sn-Doped In2O3 (110) Surface
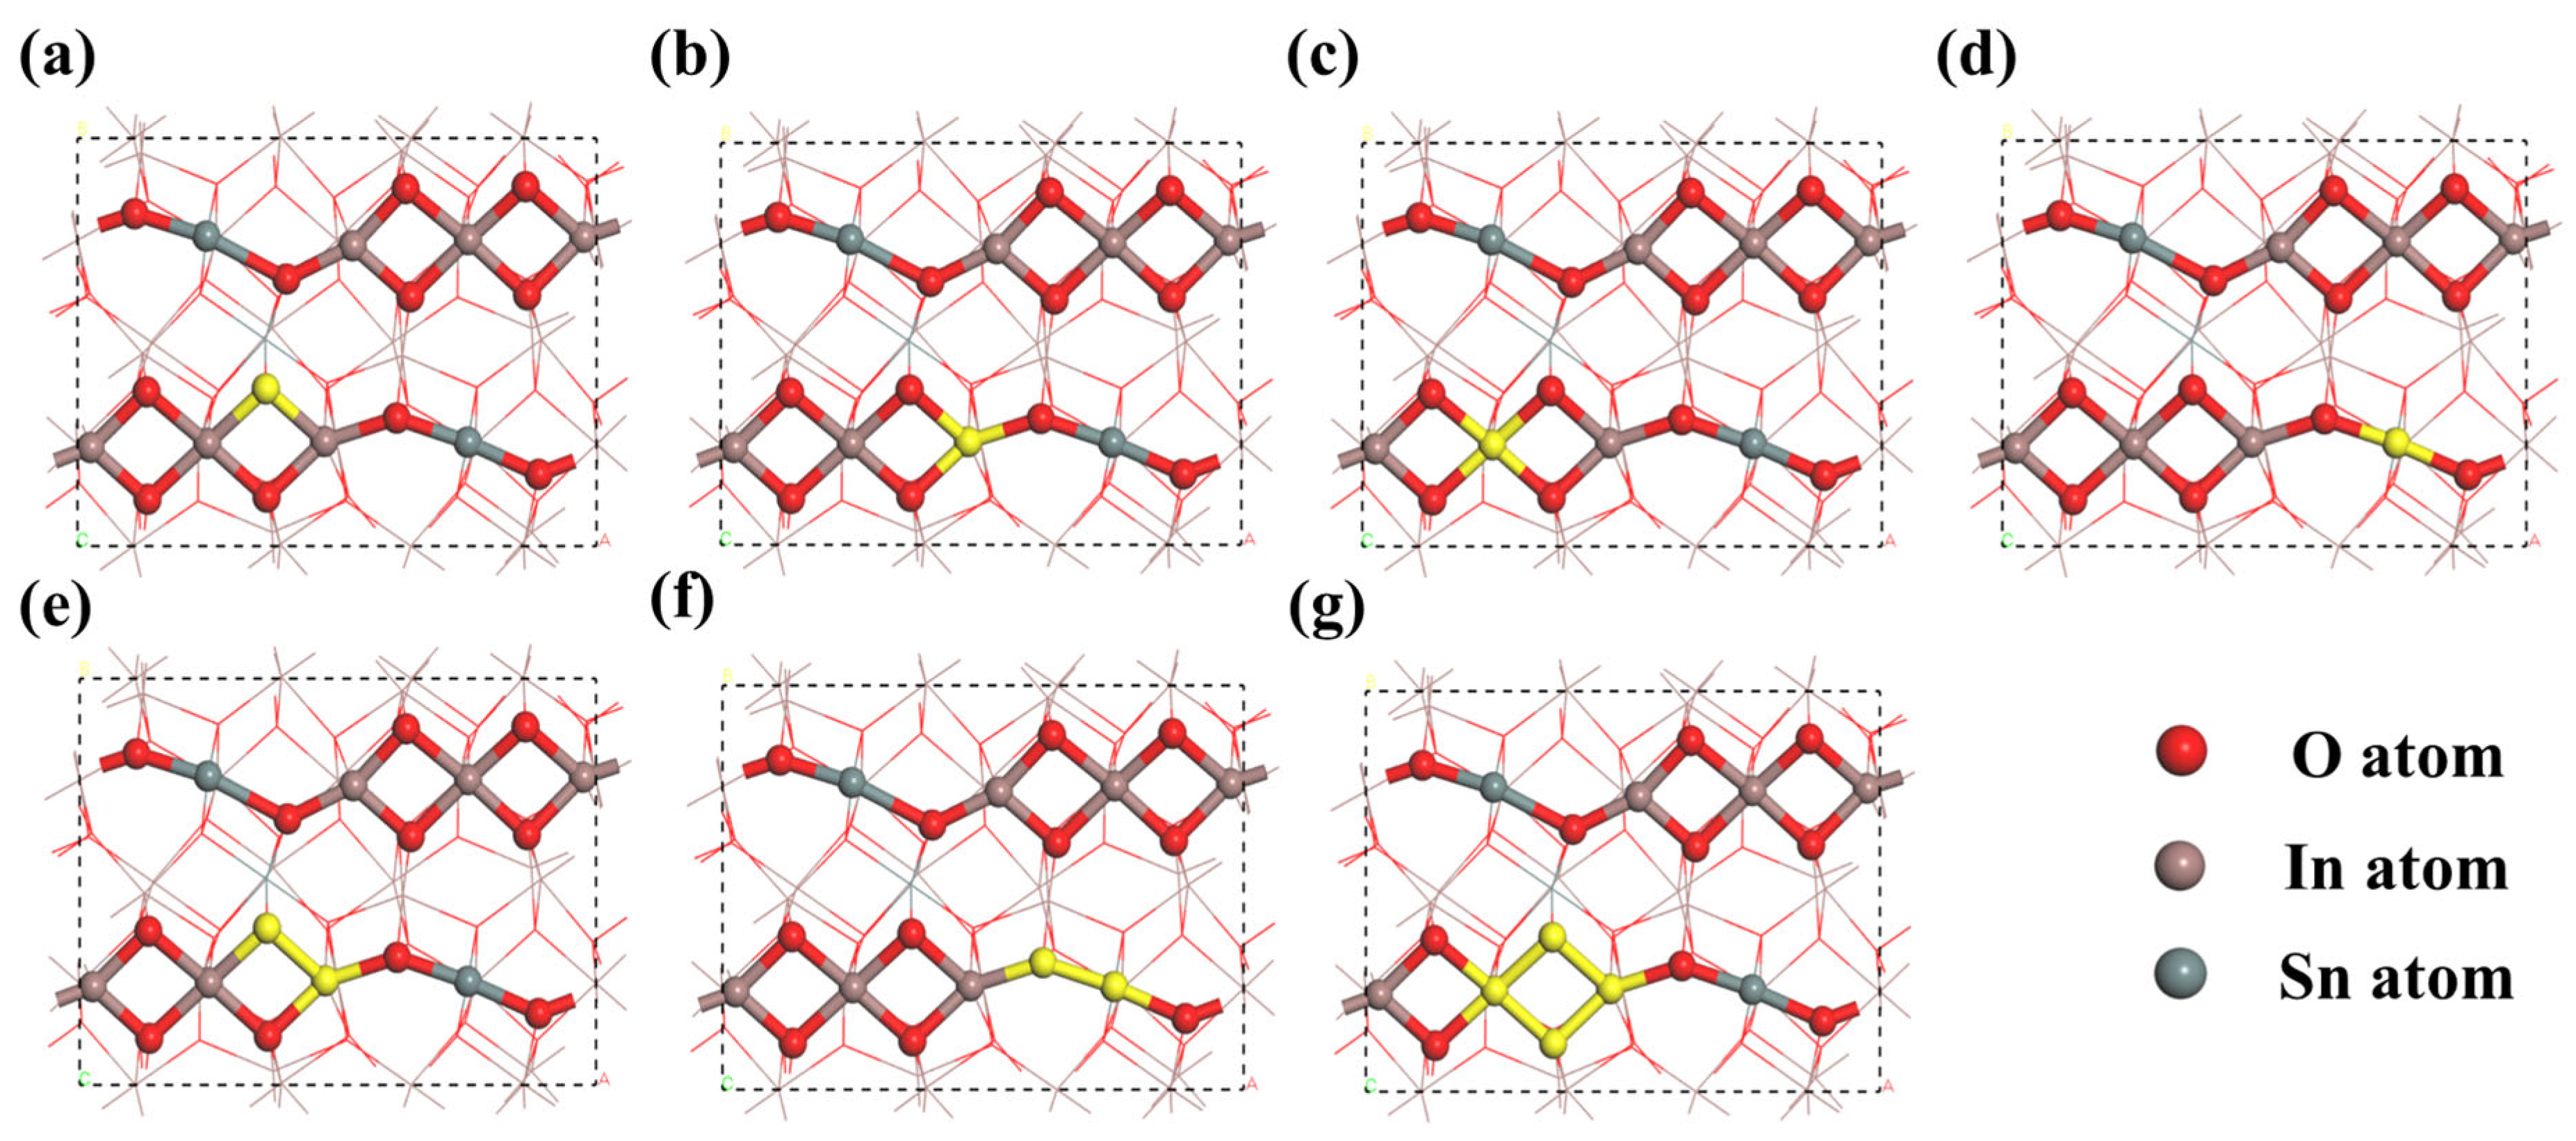
As shown in Figure 7, numerous adsorption sites with varying physical environments exist on the Sn-doped In2O3 (110) surface, which is a characteristic that provides Sn-doped In2O3 with significant adsorption capabilities. In view of the variability in chemical bonding between molecules of different gases, their adsorption behaviors on the Sn-doped In2O3 (110) surface exhibit diversity. To initially investigate the adsorption characteristics of methanol, ethanol, and acetone at different positions within Sn-doped In2O3, a simplified calculation model was employed first.
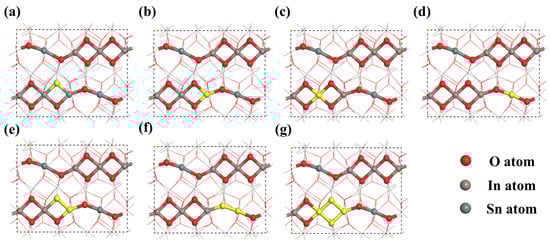
Figure 7.
Different bonding positions on Sn-doped In2O3 (110) surface: (a) oxygen atom, (b) In atom (1), (c) In atom (2), (d) Sn atom, (e) In-O bond, (f) Sn-O bond, and (g) In-O-In-O ring.
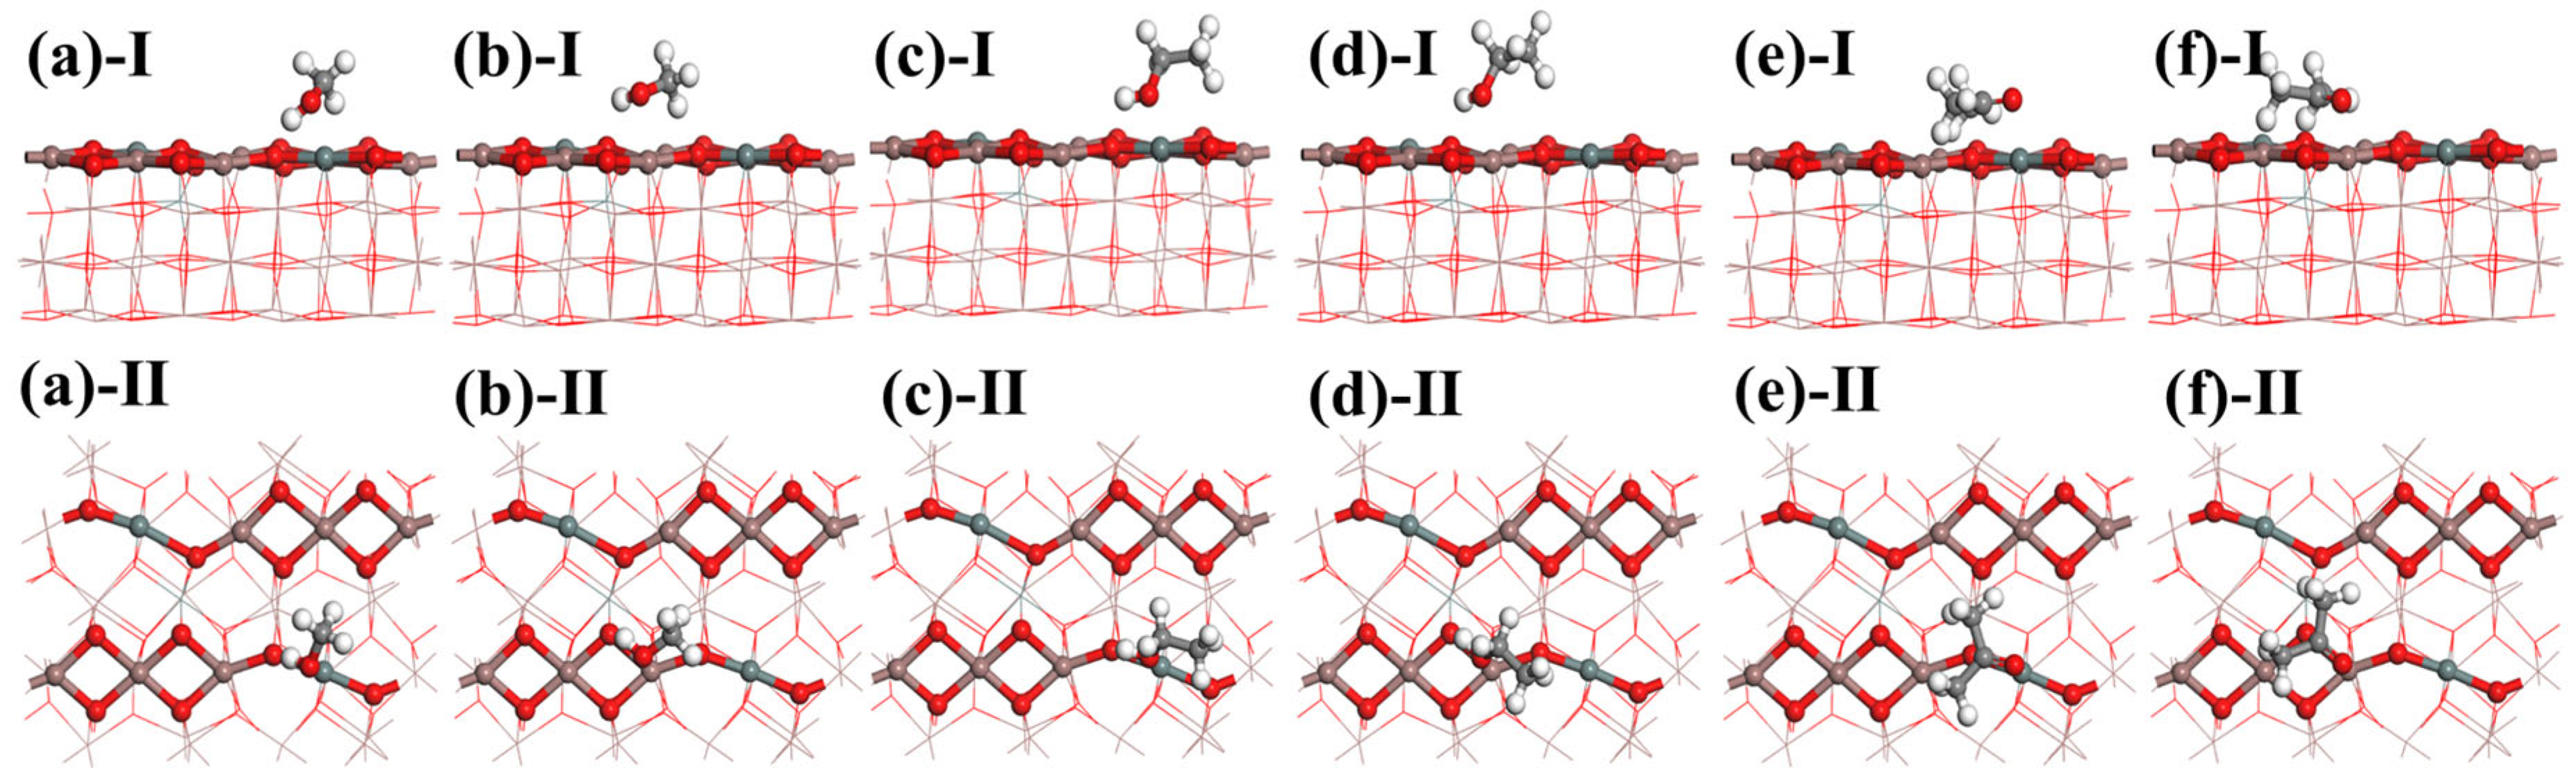
The calculation results reveal that, for methanol and ethanol, the optimal adsorption position in In2O3 is located at the In-O bond. After doping with Sn atoms, the best adsorption position shifts to the Sn-O bond. Methanol and ethanol primarily interact with Sn-doped In2O3 through their H-O bonds. Similarly, the adsorption behavior of acetone resembles that of methanol and ethanol. In In2O3, the optimal adsorption position for acetone is also at the In-O bond, which changes to the Sn-O bond following Sn doping. Acetone interacts primarily with Sn-doped In2O3 through its C=O bond during adsorption. This indicates that the Sn-O and In-O bonds in Sn-doped In2O3 are the primary reactive sites for alcohols and ketone gases. The optimal adsorption configurations are illustrated in Figure 8.
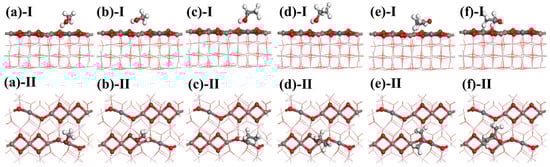
Figure 8.
Adsorption models of methanol: (a) Sn-O and (b) In-O; adsorption models of ethanol: (c) Sn-O and (d) In-O; and adsorption models of acetone: (e) Sn-O and (f) In-O.
In Equation (4), ESn-Doped In2O3+gas represents the total energy of Sn-doped In2O3 and the target gas after adsorption, while ESn-Doped In2O3 and Egas denote the energies of Sn-doped In2O3 and the target gas, respectively, in their unadsorbed states.
As shown in Figure 9a, the adsorption energies of the three gases on the In-O bond are all negative, confirming that the adsorption process between the gases and the sensitive material is exothermic and spontaneous. Furthermore, these adsorption energies on the In-O bond are all lower than −0.4 eV [37], indicating the occurrence of chemisorption between the three gases and In2O3. The lower the adsorption energy, the stronger the binding between gas molecules and the sensitive material, and the more pronounced the electron transfer, leading to a higher response value. Among the three gases, ethanol exhibits the smallest adsorption energy, suggesting that In2O3 has a better response to ethanol compared to methanol and acetone. Additionally, the adsorption energies of the three gases on the Sn-O bond are lower than those on the In-O bond, further indicating that doping In2O3 with Sn significantly enhances its response to methanol, ethanol, and acetone. Notably, the most remarkable change in adsorption energy was observed for acetone, highlighting the stronger effect of Sn doping on ketone gases.
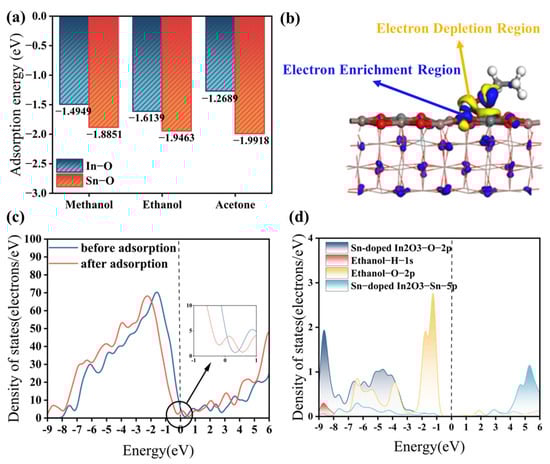
Figure 9.
(a) Adsorption energies of the three gases on Sn-doped In2O3; (b) CDD of ethanol and Sn-doped In2O3; (c) DOS of Sn-doped In2O3: before and after ethanol adsorption; and (d) PDOS of ethanol on Sn-doped In2O3.
Figure 9b illustrates the Charge Density Difference (CDD) of ethanol and Sn-doped In2O3. In this plot, the yellow region represents the electron depletion region, which is concentrated near the H-O bond at the contact interface between ethanol and Sn-doped In2O3 (110). Conversely, the blue region indicates the electron enrichment region, which is mainly distributed on the Sn-doped In2O3 (110) surface. This phenomenon suggests that, as a reducing gas, ethanol loses electrons and acts as an electron donor during adsorption with Sn-doped In2O3, an n-type semiconductor sensitive material. Consequently, the resistance of Sn-doped In2O3, acting as an electron acceptor, is decreased. Chemisorption between ethanol and Sn-doped In2O3 is achieved through significant charge transfer.
Figure 9c displays the Density of States (DOS) of Sn-doped In2O3 before and after gas adsorption. After adsorption, the DOS shifts to lower energy, and the DOS at the fermi energy level increases, indicating an enhancement in electrical conductivity. This occurs because ethanol, acting as a reducing agent, donates electrons to Sn-doped In2O3 during adsorption. Figure 9d shows the Partial Density of States (PDOS) of Sn-doped In2O3 after ethanol adsorption. In the energy range from −9 eV to −3 eV, there are obvious multi-orbital overlaps among the 2p orbitals of the O atoms and the 5p orbitals of the Sn atoms of Sn-doped In2O3 and the 1s orbitals of the H atoms and the 2p orbitals of the O atoms of ethanol. This indicates the occurrence of hybridization and strong interactions between these orbitals. In particular, the electron cloud overlap of the O atom of Sn-doped In2O3 has the largest area and contributes the most significantly to the adsorption process, suggesting that the main active site for adsorption in Sn-doped In2O3 is located at the O atom.
3.4. Gas Sensing Mechanism
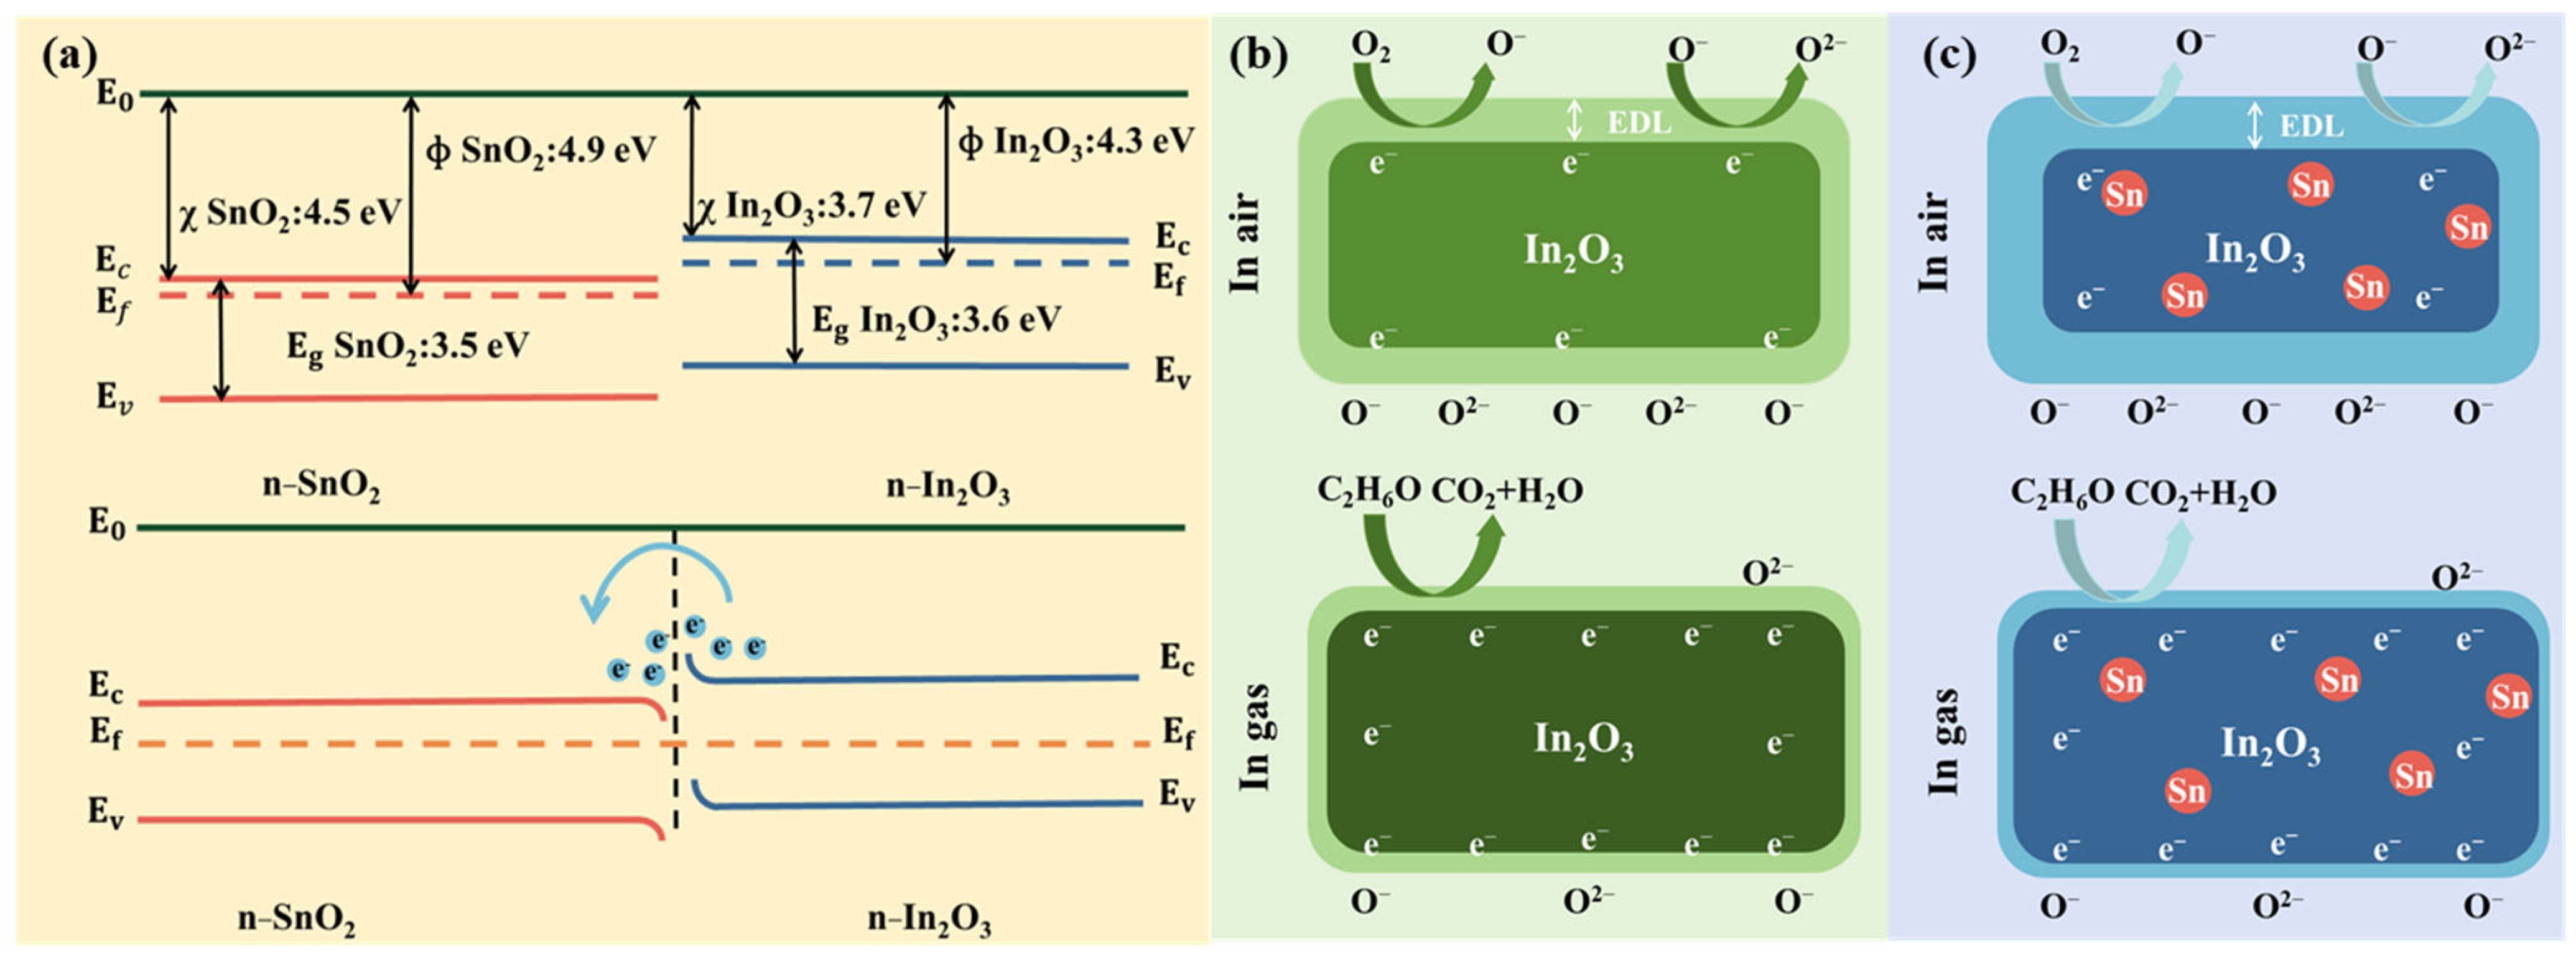
For n-type MOS sensors, the majority carriers are electrons, as depicted in Figure 10b. When the sensitive material on the surface of the gas sensor is exposed to air, oxygen molecules capture electrons from the material, thereby being converted into adsorbed oxygen. This process results in the formation of an Electron Depletion Layer (EDL) on the surface of the sensitive material [38]. The formation of an EDL significantly reduces the electron concentration in the sensitive material, which subsequently decreases its conductivity and increases its resistance. When the sensor is exposed to an atmosphere containing reducing gases, such as ethanol, these gas molecules undergo a redox reaction with the adsorbed oxygen, releasing the previously captured electrons back into the conduction band of the material. This reaction leads to an increase in electron concentration, an enhancement in conductivity, and a corresponding decrease in resistance [39]. A MOS sensor relies on the change in resistance to effectively detect target gases. The reactions between adsorbed oxygen and gases such as methanol, ethanol, and acetone on the surface of In2O3 are described by reaction Equations (5)–(12) [40,41,42]:
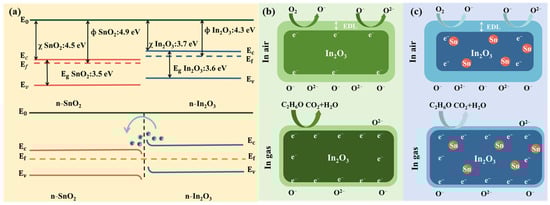
Figure 10.
(a) Energy band structure of In2O3, SnO2, and In2O3-SnO₂ heterojunction, (b) schematic illustration of gas molecule adsorption on In2O3, and (c) schematic illustration of gas molecule adsorption on In2O3-SnO₂ heterojunction.
Both In2O3 and SnO2 are n-type semiconductors, as illustrated in Figure 10a. The work function, electron affinity, and band gap of In2O3 are 4.3 eV, 3.7 eV, and 3.6 eV, respectively. The corresponding parameters for SnO2 are 4.9 eV, 3.7 eV, and 3.6 eV, respectively [43]. When In2O3 is in contact with SnO2, a contact interface is formed due to the misalignment of their fermi energy levels (where the fermi energy level of In2O3 is higher than that of SnO2), and electrons continuously flow from In2O3 to SnO2 until an equilibrium state is established, forming an n-n heterojunction structure [44]. During this process, the SnO2 side accumulates electrons to form an electron-accumulation layer, while the In2O3 side, due to electron loss, forms a wider EDL, resulting in an increase in In2O3’s resistance. When the sensor with an n-n heterojunction structure (composed of In2O3 and SnO2) is exposed to a reducing gas environment, the reducing gas reacts with adsorbed oxygen, causing the thickness of the EDL to decrease and the resistance of the sensor to decrease dramatically. This significant resistance change greatly enhances the response [45]. In addition, the doping of Sn not only effectively inhibits the growth of In2O3 grains, resulting in a larger specific surface area for the material, but also increases the content of Vo in In2O3 [46]. The increase in Vo provides more adsorption sites for gas molecules, which significantly improves the gas sensing performance of In2O3.
Among the three target gas molecules, ethanol has the smallest adsorption energy at the In-O bond, and the main component of the three sensors is still In2O3. Therefore, its response effect to ethanol is the best. The adsorption energy difference of acetone at the Sn-O bond and the In-O bond is the greatest, which indicates that the doping of Sn element is more conducive to the adsorption of acetone. Given that the Sn content of S2 and S3 is significantly higher than that of S1, S1 is more inclined to promote the adsorption of alcohol gases, thereby demonstrating higher anti-interference performance. Meanwhile, S2 and S3, due to their higher Sn content, are more conducive to the adsorption of acetone.
4. Conclusions
In this study, three types of Sn-doped In2O3-based sensors with varying indium-tin mass ratios were prepared using magnetron sputtering followed by a rapid annealing process. Systematic gas-sensitive performance tests were conducted for these sensors with methanol, ethanol, and acetone. Additionally, DFT calculations were performed to gain insights into the sensing mechanisms. The experimental results revealed that the Sn-doped In2O3 sensors exhibited high selectivity to ethanol. Even when high or low concentrations of methanol or acetone were mixed with ethanol, the strongest selectivity of the sensors was towards ethanol. By adjusting the indium/tin mass ratios in the Sn-doped In2O3 composition, we observed a significant enhancement in the gas-sensitive performance of Sn-doped In2O3. In particular, the sensors in this study demonstrated excellent performance for ultra-low-concentration gas detection. This enhancement can be attributed to the formation of a heterostructure at the interface of In2O3 and SnO2, which not only broadens the EDL on the surface of In2O3 but also introduces additional Vo. Considering that water molecules are prone to adsorb and dissociate at Vo on the oxide surface, we found that S1, with a lower Sn content, showed superior stability under varying humidity conditions compared to S2 and S3. All in all, by adjusting the Sn content in In2O3 films, sensors with high selectivity for different gases and stable gas detection capability under varying humidity conditions could be achieved. These findings provide strong technical support for the accurate monitoring of mixed gases in complex space environments.
Supplementary Materials
The following supporting information can be downloaded at: https://www.mdpi.com/article/10.3390/chemosensors13050169/s1, Figure S1: (a-c) Methanol mixture gas test - S1, S2, S3; (d-f) Ethanol mixture gas test - S1, S2, S3; (g-i) Acetone mixture gas test - S1, S2, S3.
Author Contributions
Conceptualization, H.S. and Q.L.; methodology, H.S., Q.L., H.L. and Y.T.; software, H.S.; investigation, H.S., H.L., Y.H., B.Z., J.L. and X.Z.; writing—original draft preparation, H.S. and Q.L.; writing—review and editing, Q.L.; supervision, Q.L.; funding acquisition, Q.L. All authors have read and agreed to the published version of the manuscript.
Funding
This research was funded by the Fundamental Research Funds for the Central Universities (Nos. xzy022024061, xzd012023045, xzy012022088).
Data Availability Statement
The data presented in this study are available on request from the corresponding author.
Acknowledgments
Thanks to the Instrumental Analysis Center of Xi’an Jiaotong University for the SEM and AFM tests.
Conflicts of Interest
Author Yuan Tian was employed by the CCTEG Taiyuan Research Institute Co., Ltd. The remaining authors declare that the research was conducted in the absence of any commercial or financial relationships that could be construed as a potential conflict of interest.
References
- Zhao, X.Y.; Xuan, X.W.; Jiang, D.L.; Li, H.J.; Li, C.P.; Li, M.J. Wireless antenna sensor with CuO@Cu-vertical graphene and cysteine-PDMS composite for ethanol gas detection. Anal. Chem. Acta 2024, 1319, 342969. [Google Scholar] [CrossRef] [PubMed]
- Wang, Y.Z.; Pan, Y.; Jiang, Y.; Xu, M.X.; Jiang, J.C. Wearable electrochemical gas sensor for methanol leakage detection. Microchem. J. 2023, 190, 108715. [Google Scholar] [CrossRef]
- Enferadi, S.M.H.B.; Mirzaei, A. Fe2O3-Co3O4 nanocomposite gas sensor for ethanol sensing studies. Ceram. Int. 2024, 50, 52861–52870. [Google Scholar] [CrossRef]
- Pi, M.Y.; Zheng, L.Y.; Luo, H.Y.; Duan, S.M.; Li, C.L.; Yang, J.; Zhang, D.K.; Chen, S.J. Improved acetone gas sensing performance based on optimization of a transition metal doped WO3 system at room temperature. J. Phys. D Appl. Phys. 2021, 54, 155107. [Google Scholar] [CrossRef]
- Seleka, W.M.; Ramohlola, K.E.; Modibane, K.D.; Makhado, E. Conductive chitosan/polyaniline hydrogel: A gas sensor for room-temperature electrochemical hydrogen sensing. Int. J. Hydrogen Energy 2024, 68, 940–954. [Google Scholar] [CrossRef]
- Takeo, H.; Takeru, H.; Kazunori, N.; Taro, U.; Yasuhiro, S. Effects of catalytic combustion behavior and adsorption/desorption properties on ethanol-sensing characteristics of adsorption/combustion-type gas sensors. J. Asian Ceram. Soc. 2021, 9, 1015–1030. [Google Scholar] [CrossRef]
- Feng, L.Y.; Liu, Y.X.; Wang, Y.; Zhou, H.; Wu, M.; Li, T. An ultra-small integrated CO2 infrared gas sensor for wearable end-tidal CO2 monitoring. iScience 2023, 26, 108293. [Google Scholar] [CrossRef]
- Meng, F.L.; Li, G.C.; Ji, H.Y.; Yuan, Z.Y. Investigation on oxygen vacancy regulation mechanism of ZnO gas sensors under temperature modulation mode to distinguish alcohol homologue gases. Sens. Actuators B Chem. 2025, 423, 136747. [Google Scholar] [CrossRef]
- Wang, Q.; Cheng, X.; Wang, Y.R.; Yang, Y.F.; Su, Q.; Li, J.P.; An, B.X.; Luo, Y.B.; Wu, Z.K.; Xie, E.Q. Sea urchins-like WO3 as a material for resistive acetone gas sensors. Sens. Actuators B Chem. 2022, 355, 131262. [Google Scholar] [CrossRef]
- Patil, V.L.; Dalavi, D.S.; Dhavale, S.B.; Vanalakar, S.A.; Tarwal, N.L.; Kalekar, A.S.; Kim, J.H.; Patil, P.S. Indium doped ZnO nanorods for chemiresistive NO2 gas sensors. New J. Chem. 2022, 46, 7588–7597. [Google Scholar] [CrossRef]
- Wu, K.D.; Debliquy, M.; Zhang, C. Room temperature gas sensors based on Ce doped TiO2 nanocrystals for highly sensitive NH3 detection. Chem. Eng. J. 2022, 444, 136449. [Google Scholar] [CrossRef]
- Nakarungsee, P.; Srirattanapibul, S.; Issro, C.; Tang, I.-M.; Thongmee, S. High performance Cr doped ZnO by UV for NH3 gas sensor. Sens. Actuators A Phys. 2020, 314, 112230. [Google Scholar] [CrossRef]
- Yuan, K.P.; Wang, C.Y.; Zhu, L.Y.; Cao, Q.; Yang, J.H.; Li, X.X.; Huang, W.; Wang, Y.Y.; Lu, H.L.; Zhang, D.W. Fabrication of a Micro-Electromechanical System-Based Acetone Gas Sensor Using CeO2 Nanodot-Decorated WO3 Nanowires. ACS Appl. Mater. Interfaces 2020, 12, 14095–14104. [Google Scholar] [CrossRef]
- Chang, C.H.; Chou, T.C.; Chen, W.C.; Niu, J.S.; Lin, K.W.; Cheng, S.Y.; Tsai, J.H.; Liu, W.C. Study of a WO3 thin film based hydrogen gas sensor decorated with platinum nanoparticles. Sens. Actuators B Chem. 2020, 317, 128145. [Google Scholar] [CrossRef]
- Bruce, J.; Bosnick, K.; Kamali Heidari, E. Pd-decorated ZnO nanoflowers as a promising gas sensor for the detection of meat spoilage. Sens. Actuators B Chem. 2022, 355, 131316. [Google Scholar] [CrossRef]
- Yuan, Z.Y.; Yang, F.; Zhu, H.M.; Meng, F.L.; Ibrahim, M. High-response n-butanol gas sensor based on ZnO/In2O3 heterostructure. Rare Met. 2023, 42, 198–209. [Google Scholar] [CrossRef]
- Duoc, V.T.; Hung, C.M.; Nguyen, H.; Duy, N.V.; Hieu, N.V.; Hoa, N.D. Room temperature highly toxic NO2 gas sensors based on rootstock/scion nanowires of SnO2/ZnO, ZnO/SnO2, SnO2/SnO2 and, ZnO/ZnO. Sens. Actuators B Chem. 2021, 348, 130652. [Google Scholar] [CrossRef]
- Yan, W.J.; Chen, Y.L.; Zeng, X.M.; Wu, G.; Jiang, W.; Wei, D.; Ling, M.; Wei Ng, K.; Qin, Y.X. Ultrasensitive ethanol sensor based on segregated ZnO-In2O3 porous nanosheets. Appl. Surf. Sci. 2021, 535, 147697. [Google Scholar] [CrossRef]
- Wang, D.; Han, C.S.; Zheng, C.X.; Fang, H.R.; Xu, D.F.; Zhao, H.B. Fabrication of a ppb-level NO2 gas sensor by sensitizing nanobundles assembled by In2O3 nanotubes with TiO2 quantum dots. Sens. Actuators B Chem. 2023, 387, 133833. [Google Scholar] [CrossRef]
- Xu, H.; Zhong, H.R.; Hu, J.W.; Rong, X.J.; Zhang, W.H.; Wang, Y.S.; Li, S.J.; Li, G.S.; Wang, D. Facile engineering of metal-organic framework derived SnO2@NiO core-shell nanocomposites based gas sensor toward superior VOCs sensing performance. Chem. Eng. J. 2024, 501, 157692. [Google Scholar] [CrossRef]
- Feng, Z.L.; Wang, H.T.; Zhang, Y.D.; Han, D.; Cheng, Y.Q.; Jian, A.Q.; Sang, S.B. ZnO/GaN n-n heterojunction porous nanosheets for ppb-level NO2 gas sensors. Sens. Actuators B Chem. 2023, 396, 134629. [Google Scholar] [CrossRef]
- Das, B.P.; Nath, T.K.; Mandal, S.; Shit, A.; Nandi, P.; Shit, S.; Chakraborty, B.; Pramanik, P. Structural, magnetic and optical characterization of 5 atomic % Fe doped In2O3 dilute magnetic semiconducting nanoparticles. Mater. Sci. Eng. B-Adv. Funct. Solid-State Mater. 2025, 311, 117823. [Google Scholar] [CrossRef]
- Zhang, Y.L.; Zhang, Z.; Lv, G.L.; Zhang, Y.; Chen, J.T.; Luo, Y.Y.; Duan, G.T. Ultrafast-response H2S MEMS gas sensor based on double phase In2O3 monolayer particle film. Sens. Actuators B Chem. 2024, 412, 135787. [Google Scholar] [CrossRef]
- Li, Q.; Zhang, Y.T.; Feng, L.G.; Wang, Z.M.; Wang, T.; Yun, F. Investigation of the influence of growth parameters on self-catalyzed ITO nanowires by high RF-power sputtering. Nanotechnology 2018, 29, 165708. [Google Scholar] [CrossRef]
- Li, Q.; Zhang, Y.T.; Wang, Z.M.; Li, Y.F.; Ding, W.; Wang, T.; Yun, F. Heavily tin-doped indium oxide nano-pyramids as high-performance gas sensor. AIP Adv. 2018, 8, 115316. [Google Scholar] [CrossRef]
- Kong, D.L.; Wu, W.J.; Hong, B.; Xu, J.C.; Peng, X.L.; Ge, H.L.; Li, J.; Zeng, Y.X.; Wang, X.Q. MIL-68 derived In2O3 microtubes and Co3O4/In2O3 heterostructures for high sensitive formaldehyde gas sensors. Ceram. Int. 2024, 50, 6995–7005. [Google Scholar] [CrossRef]
- Liu, H.; Liu, Q.; Feng, Y.J.; Xu, D.M.; Tang, P.G.; Li, D.Q. Facile assembly of Au nano-particles modified hierarchical mesoporous In2O3 for highly sensitive ethanol gas detection. Sens. Actuators B Chem. 2024, 402, 135103. [Google Scholar] [CrossRef]
- Kurmangaleev, K.S.; Mikhailova, T.Y.; Polunin, K.S.; Ilegbusi, O.J.; Trakhtenberg, L.I. DFT modeling of reaction of H2 with O2 pre-adsorbed on In2O3 (011) surface. Chem. Phys. Lett. 2024, 856, 141649. [Google Scholar] [CrossRef]
- Liu, Y.P.; Li, J.; Hou, W.J.; Zhou, Q.; Zeng, W. Pristine and Ag decorated In2O3 (110): A gas-sensitive material to selective detect NO2 based on DFT study. J. Mater. Res. Technol. 2022, 18, 4236–4247. [Google Scholar] [CrossRef]
- Bordini, L.F.; Ferraz, C.P.; Tofanello, A.; Garcia, M.A.S.; de Almeida, J.M.A.R.; Sousa-Aguiar, E.F.; Romano, P.N. Optimizing methanol synthesis from CO2: Are bulk hexagonal indium oxide structures superior to cubic ones? Catal. Today 2025, 445, 115038. [Google Scholar] [CrossRef]
- Li, Y.; Wei, X.Y.; Liu, Q.Y.; Zang, D.M.; You, R. Visible Light-Activated Room Temperature NO2 Gas Sensing Based on the In2O3@ZnO Heterostructure with a Hollow Microtube Structure. ACS Sens. 2024, 9, 3741–3753. [Google Scholar] [CrossRef] [PubMed]
- Århammar, C.; Silvearv, F.; Ahuja, R.; Araujo, C.M.; Huang, L.M. Tuning magnetic properties of In2O3 by control of intrinsic defects. Europhys. Lett. 2010, 89, 47005. [Google Scholar] [CrossRef]
- Lin, X.L.; Pan, F.C. A first-principles study on the electronic structure and optical properties of indium tin oxide. J. Shandong Norm. Univ. 2016, 31, 64–70. [Google Scholar]
- Yan, H.Y.; Fang, F.; Chen, Z.Q.; Zhang, C.M.; Niu, Q.; Xue, W.; Zhan, Z.L. Response improvement of In2O3 hot-wire gas sensor doped by Sn. J. Mater. Sci. Mater. Electron. 2018, 29, 5173–5179. [Google Scholar] [CrossRef]
- Liu, J.H.; Kong, L.T.; Liu, S.B.; Meng, F.L.; Liu, J.Y.; Jin, Z.; Sun, Y.F. Metal Oxide Nanostructures and Their Gas Sensing Properties: A Review. Sensors 2012, 12, 2610–2631. [Google Scholar] [CrossRef]
- Zhao, L.P.; Jin, R.R.; Wang, C.; Wang, T.S.; Sun, Y.F.; Sun, P.; Lu, G.Y. Flower-like ZnO-Co3O4 heterojunction composites for enhanced acetone sensing. Sens. Actuators B Chem. 2023, 390, 133964. [Google Scholar] [CrossRef]
- Kokalj, A. Corrosion inhibitors: Physisorbed or chemisorbed? Corros. Sci. 2022, 196, 109939. [Google Scholar] [CrossRef]
- Kgomo, M.B.; Shingange, K.; Swart, H.C.; Mhlongo, G.H. Evolution of In2O3 morphology from belt to fibrous-like structure for ethanol detection at low working temperature induced by Cr-addition. Appl. Surf. Sci. 2023, 639, 158210. [Google Scholar] [CrossRef]
- Han, D.M.; Li, X.H.; Zhang, F.M.; Gu, F.B.; Wang, Z.H. Ultrahigh sensitivity and surface mechanism of gas sensing process in composite material of combining In2O3 with metal-organic frameworks derived Co3O4. Sens. Actuators B Chem. 2021, 340, 129990. [Google Scholar] [CrossRef]
- Cheng, P.F.; Wang, Y.L.; Wang, C.; Ma, J.; Xu, L.; Lv, C.; Sun, Y.F. Investigation of doping effects of different noble metals for ethanol gas sensors based on mesoporous In2O3. Nanotechnology 2021, 32, 305503. [Google Scholar] [CrossRef]
- Sun, G.P.; Sun, S.F.; Wang, Y.L.; Hao, X.D.; Hao, Y.; Liu, C.; Gong, C.L.; Yang, Q.Y.; Du, W.A.; Cheng, P.F. A novel gas sensor based on ZnO nanoparticles self-assembly porous networks for morphine drug detection in methanol. Sens. Actuators B Chem. 2024, 420, 136495. [Google Scholar] [CrossRef]
- Cao, S.; Sui, N.; Zhang, P.; Zhou, T.T.; Tu, J.C.; Zhang, T. TiO2 nanostructures with different crystal phases for sensitive acetone gas sensors. J. Colloid Interface Sci. 2022, 607, 357–366. [Google Scholar] [CrossRef] [PubMed]
- Li, F.; Zhang, T.; Gao, X.; Wang, R.; Li, B.H. Coaxial electrospinning heterojunction SnO2/Au-doped In2O3 core-shell nanofibers for acetone gas sensor. Sens. Actuators B Chem. 2017, 252, 822–830. [Google Scholar] [CrossRef]
- Chen, K.; Jiang, Y.R.; Tao, W.; Wang, T.S.; Liu, F.M.; Wang, C.G.; Yan, X.; Lu, G.Y.; Sun, P. MOF Structure engineering to synthesize core-shell heterostructures with controllable shell layer thickness: Regulating gas selectivity and sensitivity. Sens. Actuators B Chem. 2023, 378, 133117. [Google Scholar] [CrossRef]
- Li, Y.Z.; Lang, X.O.; Li, W.M.; Xue, Y.W.; Liu, Y.P.; Lu, H.L. Advances in Noble Metal-Decorated Metal Oxide Nanomaterials for Chemiresistive Gas Sensors: Overview. Nano-Micro Lett. 2023, 15, 1–75. [Google Scholar] [CrossRef]
- Ri, J.S.; Li, X.W.; Shao, C.L.; Liu, Y.; Han, C.H.; Li, X.H.; Liu, Y.C. Sn-doping induced oxygen vacancies on the surface of the In2O3 nanofibers and their promoting effect on sensitive NO2 detection at low temperature. Sens. Actuators B Chem. 2020, 317, 128194. [Google Scholar] [CrossRef]


Disclaimer/Publisher’s Note: The statements, opinions and data contained in all publications are solely those of the individual author(s) and contributor(s) and not of MDPI and/or the editor(s). MDPI and/or the editor(s) disclaim responsibility for any injury to people or property resulting from any ideas, methods, instructions or products referred to in the content. |
© 2025 by the authors. Licensee MDPI, Basel, Switzerland. This article is an open access article distributed under the terms and conditions of the Creative Commons Attribution (CC BY) license (https://creativecommons.org/licenses/by/4.0/).