Article

Size-Selective Adsorption Phenomena and Kinetic Behavior of Alcohol Homologs in Metal–Organic Framework QCM Sensors: Reconciling Apparent Contradictions

Leicester International Institute, Dalian University of Technology, Panjin 124010, China
*
Author to whom correspondence should be addressed.
Chemosensors 2025, 13(8), 269; https://doi.org/10.3390/chemosensors13080269
Submission received: 19 May 2025 / Revised: 19 June 2025 / Accepted: 2 July 2025 / Published: 23 July 2025

Abstract

In this study, we systematically investigated the adsorption behavior of a titanium-based metal–organic framework (MOF) sensing layer on five primary alcohol homologs using the quartz crystal microbalance (QCM) technique. Unexpectedly, response signals were significantly enhanced for molecules exceeding the framework’s pore dimensions, contradicting conventional molecular sieving models. Further investigations revealed that the adsorption time constant ( τ a ) is linearly proportional to the molecular diameter ( R 2 = 0.952 ) and the integral response (AUC) increases almost exponentially with the molecular weight ( R 2 = 0.891 ). Although the effective diffusion coefficient ( D eff ) decreases with increasing molecular size ( D eff d 5.96 , R 2 = 0.981 ), the normalized diffusion hindrance ratio ( D eff / D gas ) decreases logarithmically with an increasing diameter. Larger responses result from stronger host–guest interactions with the framework despite significant diffusion limitations for larger molecules. These findings demonstrate the synergistic regulation of adsorption and diffusion in MOF-QCM systems. Our investigation experimentally elucidates the ’size-selectivity paradox’ in microporous sensing interfaces and establishes a quantitative framework for optimizing sensor performance through balanced control of diffusion kinetics and interfacial interactions in similar materials.

1. Introduction

The detection of volatile organic compounds (VOCs) presents critical analytical challenges across various fields, including environmental monitoring [1], industrial process control [1], clinical disease diagnosis [2], and food quality assessment [3]. In complex matrices, traditional sensing methods face fundamental limitations in terms of sensitivity, selectivity, and stability, particularly when distinguishing structurally similar trace analytes, despite recent technological advancements. These limitations urgently necessitate innovative sensing architectures that transcend conventional detection methods [4]. By strategically combining improved conversion mechanisms with precision-engineered microporous materials, the development path for next-generation sensing platforms has been broadened to meet the increasingly stringent analytical requirements of a wide range of applications.
Quartz crystal microbalance (QCM) technology, with its nanogram-level mass sensitivity, real-time label-free signal output, and high integration potential, has emerged as an excellent choice for gas sensing applications [5]. Unlike spectroscopic or electrochemical techniques that often require complex signal conversion pathways, QCM operates based on the direct piezoelectric principle. This principle converts mass adsorption events into precise frequency changes via the Sauerbrey relationship, establishing a direct correlation between quantifiable sensing results and molecular interaction phenomena. Metal–organic frameworks (MOFs) demonstrate exceptional molecular recognition potential in the surface-sensitive layer—a critical component in QCM sensor optimization [6]. Their modular crystal coordination network structure confers exceptional structural flexibility, enabling precise tuning of adsorption energy, surface functionality, and pore size (0.3–2.0 nm) [7]. As a result, MOF-based QCMs serve as an ideal platform for studying molecular recognition processes, featuring crystallographically defined binding sites, tunable chemical environments, and extensive surface areas.
The current theoretical framework primarily relies on simplified molecular sieve models, assuming that the kinetic diameter of target molecules must be smaller than the framework pore size to enable effective detection [8]. Although significant progress has been made in the development of MOF-functionalized QCM sensors as shown in Table 1, this static geometric model fails to accurately predict experimental observations in many MOF systems [9]. This is because unexpected enhanced responses often occur when molecular sizes approach or exceed the nominal pore size. Recent studies [10] have emphasized the importance of understanding the dynamic structure–property relationships in nanocomposite-enabled chemical sensors. This paradigm suggests that, to accurately predict sensing behavior, the framework must integrate structural dynamics, energy considerations, and kinetic factors, as static models have limitations. These findings indicate that molecular recognition in microporous frameworks is not limited to simple size exclusion but is characterized by multifaceted host–guest interactions, including framework flexibility (e.g., ‘breathing’ or ‘gate opening’ phenomena) [11,12], specific enthalpic contributions from directed host–guest interactions [13], synergistic adsorption effects, and contributions from multiple adsorption sites. This understanding necessitates the development of a structure–function mapping framework capable of integrating experimental results (even seemingly contradictory ones) and establishing robust principles for predicting the design of sensing materials.
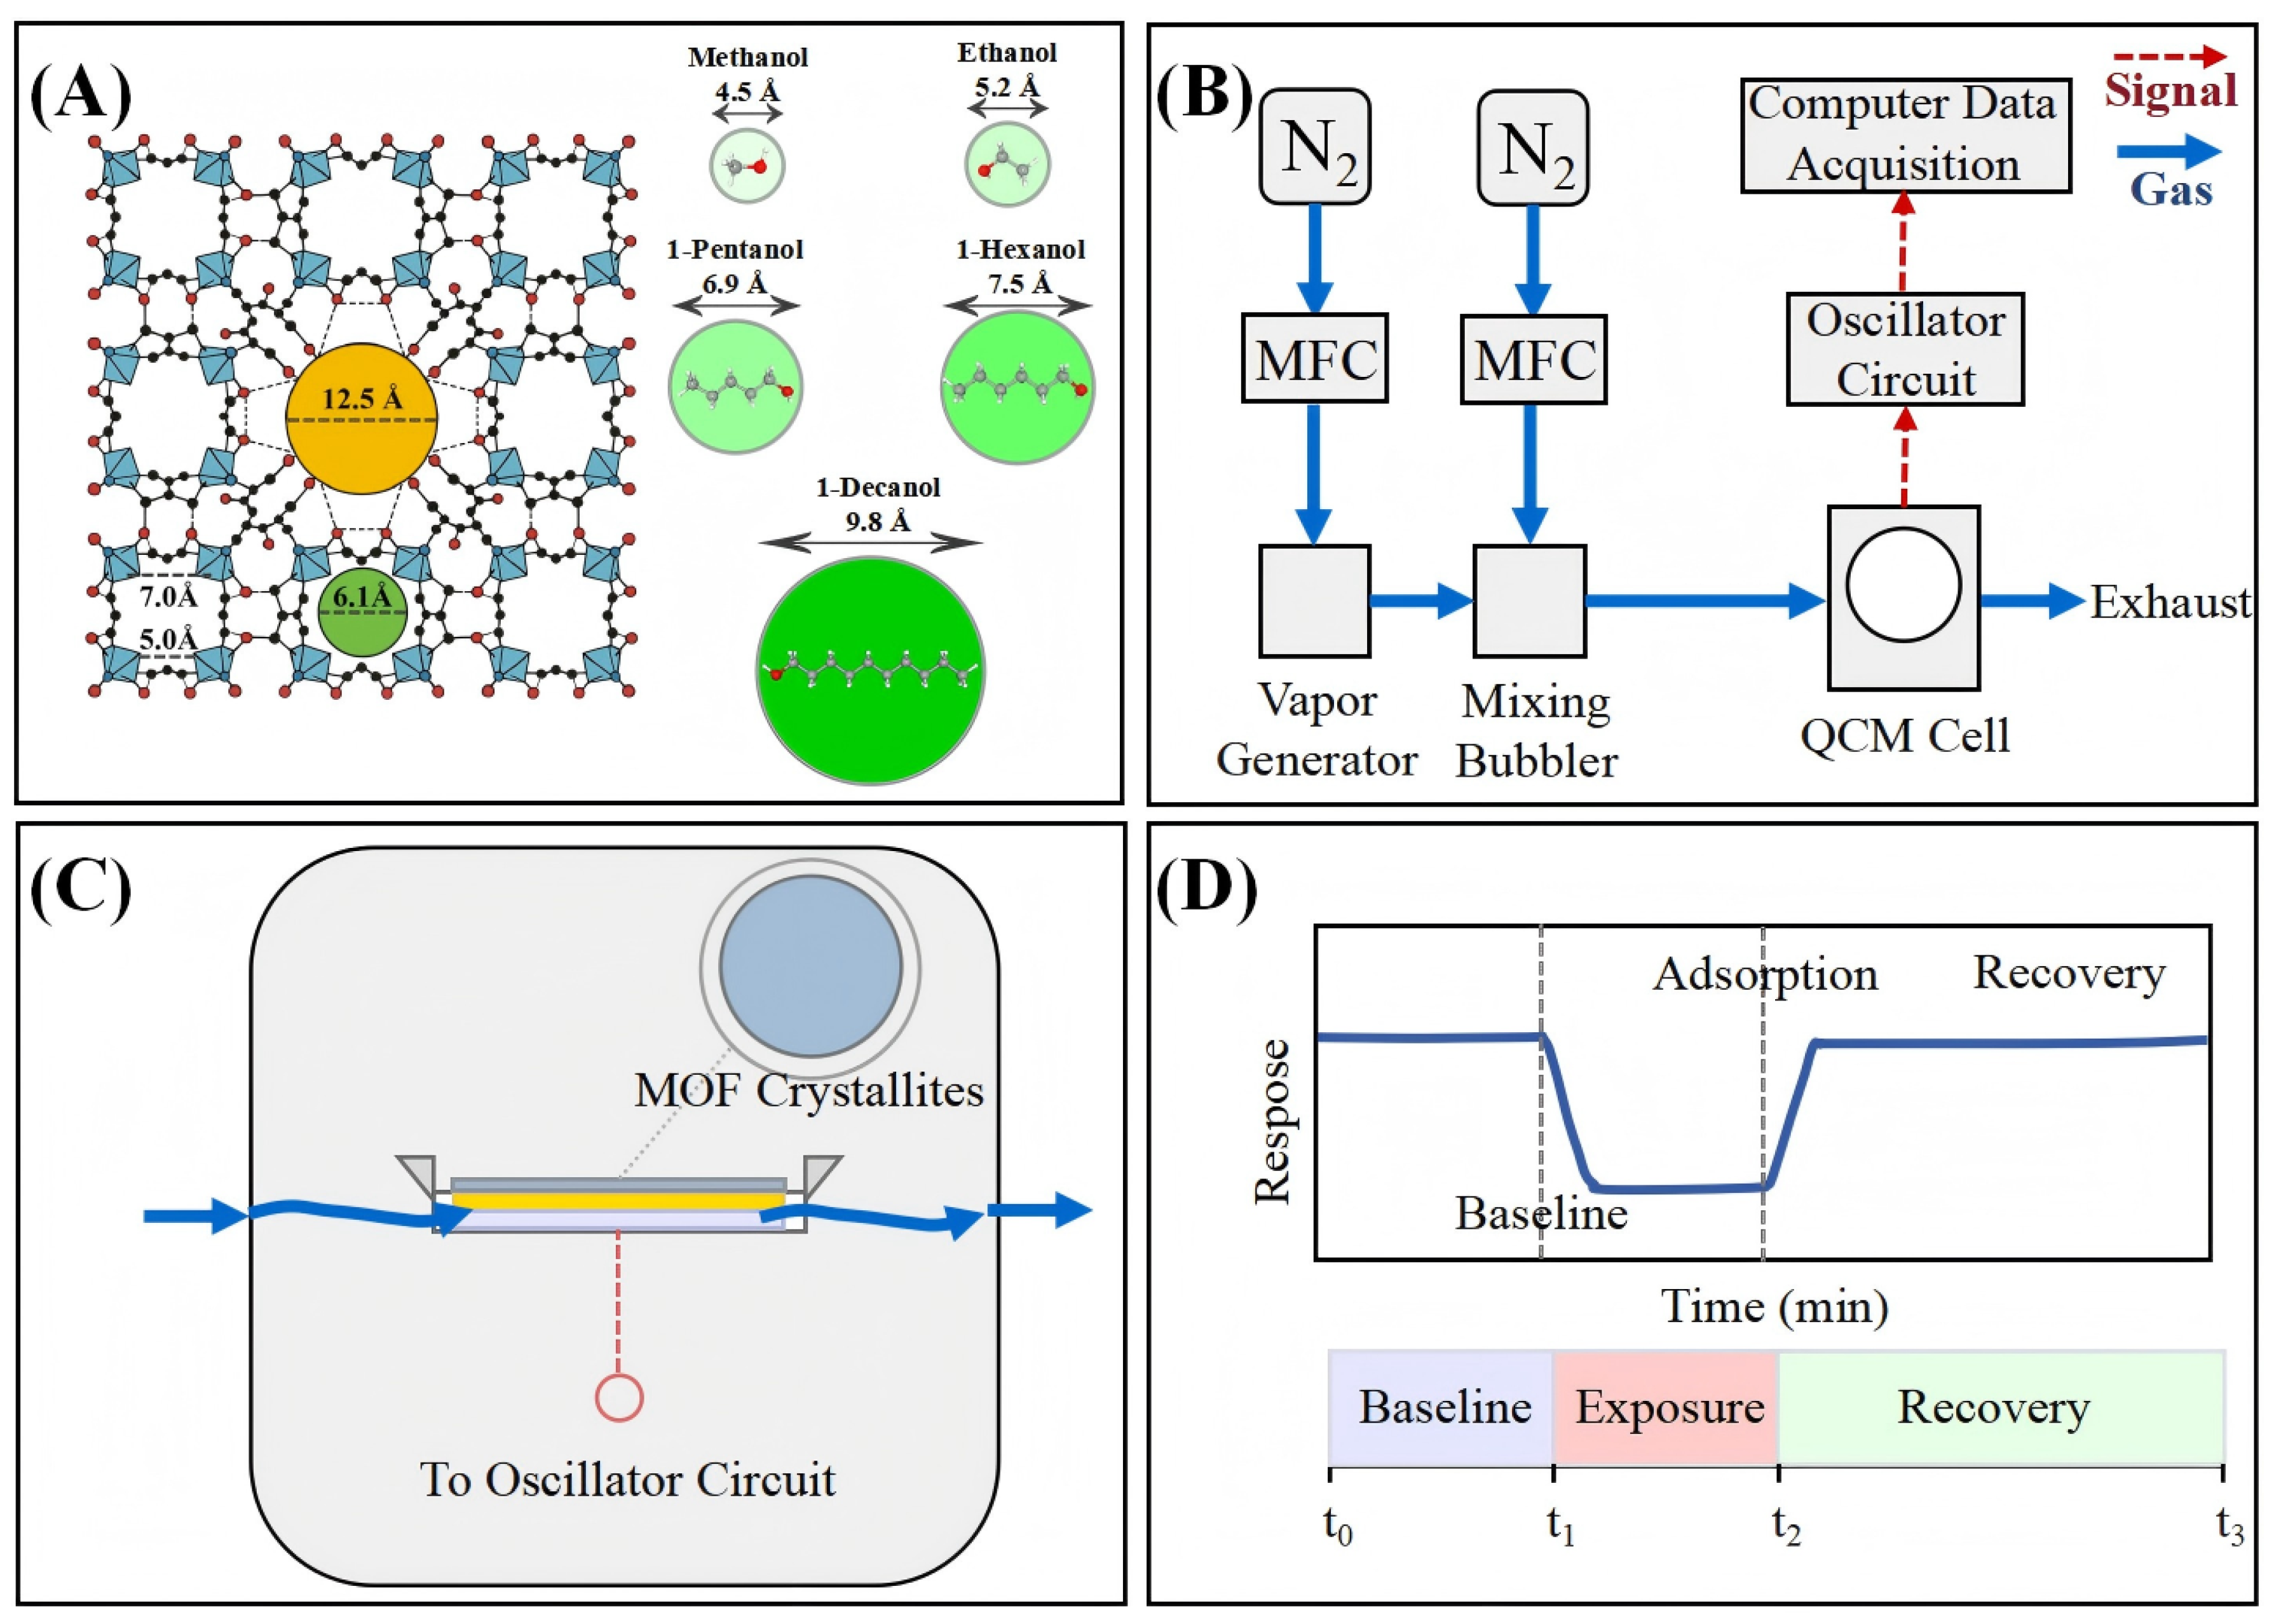
While other MOF materials have been previously explored for gas sensing applications, MIL-125-NH2 offers unique advantages for alcohol detection that have not been systematically investigated. Unlike copper-based MOFs (e.g., HKUST-1) that can undergo partial degradation in the presence of alcohol vapors, or zinc-based frameworks (e.g., ZIF-8) with limited polar interaction sites, MIL-125-NH2 combines exceptional chemical stability with amino-functionalized pores that can establish specific hydrogen bonding with alcohol hydroxyl groups. Additionally, the photocatalytic properties of MIL-125-NH2 under visible light provide potential for self-regeneration capabilities not present in other MOF systems, which could extend sensor lifetime during prolonged alcohol vapor exposure. These distinctive features, combined with the titanium-based framework’s biocompatibility, make MIL-125-NH2 an ideal yet underexplored candidate for alcohol sensing applications. Based on the following strategic considerations, the representative amino-functionalized titanium MOF material MIL-125-NH2 was selected as the model system. Using a homologous series of primary alcohols (methanol to 1-decanol) as molecular probes with systematic size variation and consistent functional groups, we establish quantitative structure–response relationships by analyzing amplitude, kinetics, and diffusion behavior. Surprisingly, when the molecular size exceeds the framework pore diameter, despite a three-order-of-magnitude decrease in the diffusion coefficient, the response amplitude still significantly increases. Molecular flexibility, framework adaptability, cumulative non-covalent interactions, and multi-domain adsorption form a multi-mechanism model explaining this phenomenon contrary to classical sieving principles. These findings provide an advanced theoretical foundation for developing selective microporous sensing interfaces, whose selectivity arises from the synergistic regulation of diffusion and interactions, surpassing traditional size exclusion principles.

2. Materials and Methods

2.1. Overview of the Experimental Design

To investigate size-selective adsorption in MOF-based QCM systems, we developed an integrated experimental approach encompassing material synthesis, structural characterization, sensing interface construction, and quantitative response analysis, as shown in Figure 1. The experimental design employs MIL-125-NH2 as the sensing layer and selects homologous alcohol compounds with the same chemical activity as model analytes, which possess different molecular sizes. This method effectively separates size-dependent effects while minimizing interfering variables such as chemical affinity. The QCM sensing system directly correlates frequency changes with mass adsorption events, providing quantitative measurement indicators for thermodynamic capacity and kinetic behavior.

2.2. Synthesis and Characterization of MIL-125-NH2

For this study, the amino-functionalized titanium-based microporous metal–organic framework, MIL-125-NH2, was synthesized utilizing a previously used method [16] with only minor changes. Titanium (IV) isopropoxide (0.5 mmol) and 2-aminoterephthalic acid (0.5 mmol) were mixed in a glass vial with N,N-dimethylformamide (10 mL) and triethylamine (10 µL) as a modulator. The homogeneous solution was sonicated for ten minutes before being statically heated to 120 °C for 24 h. Centrifugation was used to separate the crystalline product, which was then washed with DMF (3 × 10 mL) and acetone. The collected product was dried in a dynamic vacuum at 150 °C for 12 h.
The synthesized MIL-125-NH2 has a tetragonal structure (space group I4/mmm) comprised of Ti8O8(OH)4 clusters joined by 2-aminoterephthalate linkers, as shown in Figure 1A. This framework has a hierarchical pore system [16] with tetrahedral cages (6.13 Å) and octahedral cages (12.5 Å) coupled by apertures ranging from 5.0 to 7.0 Å. The amino functionalization binds polar analytes through hydrogen bonding, whereas titanium-oxo clusters stabilize the framework.
The synthesized structure was characterized by powder X-ray diffraction (PXRD, Rigaku Miniflex 600, Rigaku Corporation, Tokyo, Japan; Cu-K α radiation), Fourier transform infrared spectroscopy (FTIR, Bruker Tensor 27, Bruker Corporation, Billerica, MA, USA), physical adsorption of nitrogen at 77 K (Micromeritics ASAP 2020, Micromeritics Instrument Corp., Norcross, GA, USA), and scanning electron microscopy (SEM, JEOL JSM-7500F, JEOL Ltd., Tokyo, Japan). Detailed characterization results are presented in Section 3.1.

2.3. QCM Sensor Fabrication and Stability Assessment

The QCM sensor is composed of gold electrodes (diameter 6.0 mm) and an AT-cut quartz crystal (base frequency 5 MHz). The quartz crystal was cleansed in a sequential manner with acetone, isopropyl alcohol, and deionized water before MOF deposition. The crystal was subsequently treated with an ultraviolet ozone apparatus (Novascan PSD-UV) for a duration of 10 min to eliminate surface organic impurities. The sensing layer is formed by uniformly dropping a stable solution of MOF material in ethanol (concentration 0.01 mg/mL) onto the electrode surface. This procedure is repeated multiple times to form a dense coating. The sensing layer is prepared using the drop-casting method. Following deposition, samples are dried at 50 °C for 2 h, followed by treatment at room temperature under medium vacuum conditions (10–3 mbar) for 4 h to completely remove residual solvents, ensuring the structural integrity of the sensing layer and maximizing the retention of functional sites.
The cross-sectional structure of the sensing interface was depicted in Figure 1C, where MOF particles were uniformly distributed on the gold electrode surface. This configuration enhances the mechanical linkage between the quartz crystal and the sensor layer, facilitating precise monitoring of frequency fluctuations caused by mass alterations. The results of the continuity and morphology of the MOF coating using a surface profilometer (Zeta Optical Profiler) are illustrated in Figure A1. The Z-height profile scan indicates the development of a uniformly dense polycrystalline layer on the QCM electrode area, with a thickness of approximately 500 nm.
To evaluate the mechanical stability of the MOF coating on the QCM surface, we tested the MIL-125-NH2 thin film throughout the entire experimental process. Baseline frequency measurements were taken before and after each analysis cycle to ensure drift was less than 0.3 Hz/hour, indicating minimal mass loss or structural reconstruction. The thin film’s stability can be attributed to the following: (1) the nanoscale size of MIL-125-NH2 particles (80–120 nm, as detailed in Section 3.1), which enhances adhesion by increasing the contact area; (2) an optimized multi-step drop-casting protocol, allowing the preparation of more uniform and mechanically superior coatings; and (3) a moderate oscillation frequency (5 MHz), which generates lower shear forces than high-frequency QCM systems.

2.4. VOC Sensing Measurements and Experimental Setup

Figure 1B shows the setup for the QCM sensing measurement experiment, including an integrated gas delivery system, a VOC generation device, a sensing chamber, and data acquisition components. This setup enables precise control of analyte concentration, fluid dynamics, and environmental factors, while also supporting real-time monitoring of mass-related frequency shifts.
The analytes used in this study are a group of homologous alcohol compounds: methanol (≥99.9%, anhydrous), ethanol (≥99.8%, anhydrous), 1-pentanol (≥99%), 1-hexanol (≥98%), and 1-decanol (≥98%), all purchased from Sigma-Aldrich and not further purified. Table 2 summarizes the most important physical and chemical properties of these substances.
A commercial QCM detection system (QCM200, Stanford Research Systems, Sunnyvale, CA, USA) and a homemade gas flow control apparatus were utilized to perform sensing measurements. The sensor was kept at a constant ambient temperature of 25.0 °C to ensure experimental stability and consistency. Nitrogen gas with a purity of 99.999% was utilized as the carrier gas and reference atmosphere in a dynamic vapor generation system with an MKS Instruments mass flow controller. The total flow rate was 100 mL/min. Analyte vapors were generated. The concentration gradients of each alcohol analyte were assessed at varying concentrations, ranging from 5% to 100% of its maximum test concentration (the upper limit is dictated by the QCM response capability and vapor pressure).
As illustrated in Figure 1D, the standardized measurement protocol consists of the subsequent steps: (i) Baseline stabilization: The sensor is pretreated under a nitrogen flow until the frequency drift is reduced to less than 0.1 Hz/min. (ii) Analyte exposure: The sensor is exposed to the target VOC at a controlled concentration, with the exposure duration adjusted according to its response kinetics (ranging from 5 min for methanol to 60 min for 1-decanol). (iii) Recovery phase: The system is purged with purified nitrogen for a minimum of 30 min to facilitate desorption and the return to baseline conditions.

2.5. Data Analysis Methodology

QCM frequency data were collected in real time at a sampling rate of 1 Hz using the manufacturer’s software. Prior to analysis, raw data were minimally preprocessed via baseline correction and Savitzky–Golay filtering (window width 11 points, polynomial order 2) to reduce noise. To standardize comparisons across conditions, the normalized frequency offset in parts per million (ppm) was used as the response variable:
Δ f ( t ) = f ( t ) f 0 f 0 × 10 6 ,
where f ( t ) and f 0 denote the instantaneous and baseline frequencies, respectively. This normalization removes dependence on the fundamental frequency and yields a dimensionless response.
Characteristic parameters extracted from the Δ f –time curves include the following:
  • Δ f max : peak normalized frequency shift, defined as the maximum Δ f upon VOC exposure;
  • AUC (ppm·s): area under the curve, representing the integral of the response over time;
  • t 10 , t 50 , t 90 : rise times to reach 10%, 50%, and 90% of Δ f max , respectively.
To provide a mechanistic understanding of the multi-phase adsorption process observed in the QCM response profiles, we implemented an enhanced peak model that explicitly accounts for both transient and equilibrium components:
δ f ( t ) = a + b 1 e t / τ a + c 1 e t / τ r e t / τ s n ,
where a is the baseline offset, b the adsorption amplitude, c the transient spike amplitude, τ a , τ r , and τ s the time constants for adsorption, spike rise, and spike decay, respectively, and n a dimensionless shape parameter. Nonlinear least-squares fitting used the Levenberg–Marquardt algorithm; fitting quality was assessed by the coefficient of determination ( R 2 ) and root mean square error (RMSE). Statistical correlations among parameters were evaluated by linear regression and Pearson correlation tests, with significance set at p < 0.05 .

3. Results and Discussion

3.1. Characterization of MIL-125-NH2

The structures of the MIL-125-NH
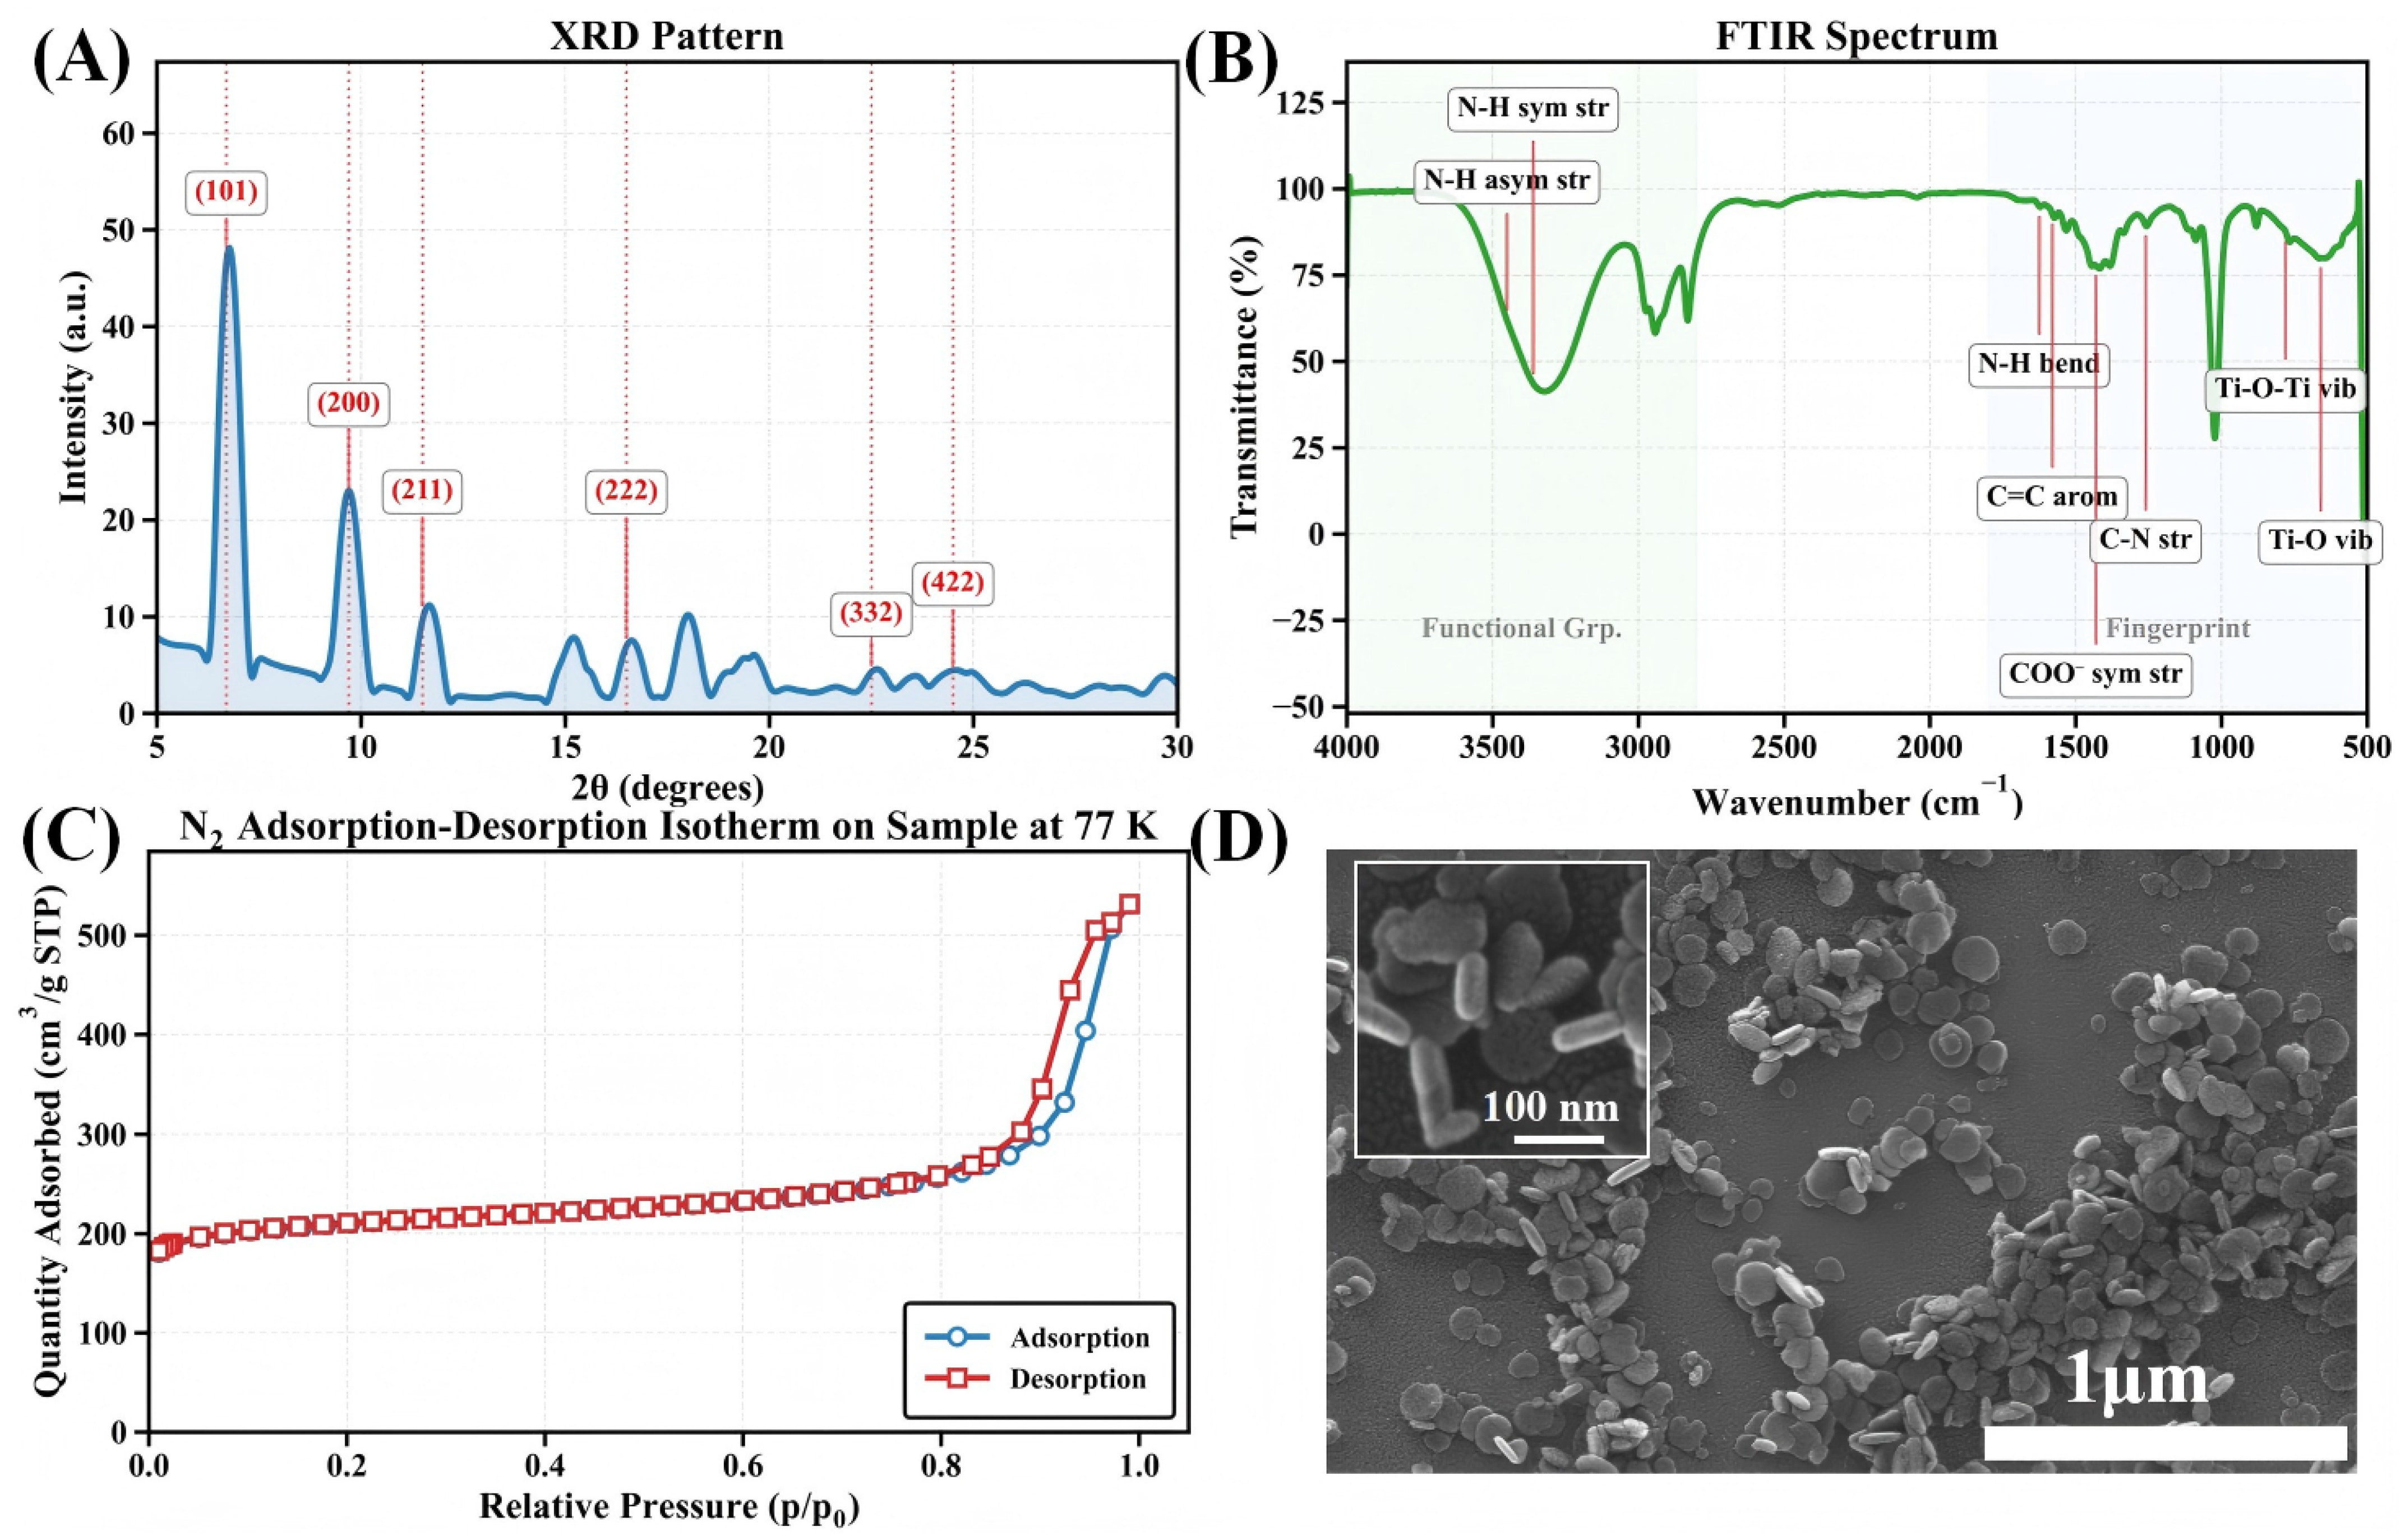
2 samples were confirmed by a series of complementary characterization techniques. Powder X-ray diffraction (PXRD) patterns (Figure 2A) exhibit the characteristic peaks of the tetragonal phase (space group I4/mmm), with the primary reflection at 2 θ = 6 . 7 ° (101), and additional peaks at 9 . 7 ° (200), 11 . 5 ° (211), and 16 . 5 ° (222), indicating high phase purity and crystallinity. Fourier-transform infrared spectroscopy (FTIR) (Figure 2B) further corroborated the framework structure, showing N–H stretching at 3400–3300 c m 1 , N–H bending at ∼1625 c m 1 , and characteristic aromatic C=C, C–N, C–O, and Ti–O vibrational bands, thus confirming retention of organic ligands and formation of Ti–O clusters.
Nitrogen adsorption–desorption isotherms at 77 K (Figure 2C) reveal a pronounced microporosity with a Brunauer–Emmett–Teller (BET) specific surface area of 678 m 2 /g. The isotherm displays combined Type I/IV features: micropore filling at low relative pressures and capillary condensation hysteresis at higher pressures, suggesting secondary mesoporosity (e.g., inter-crystalline voids or defects) alongside dominant micropores. In 
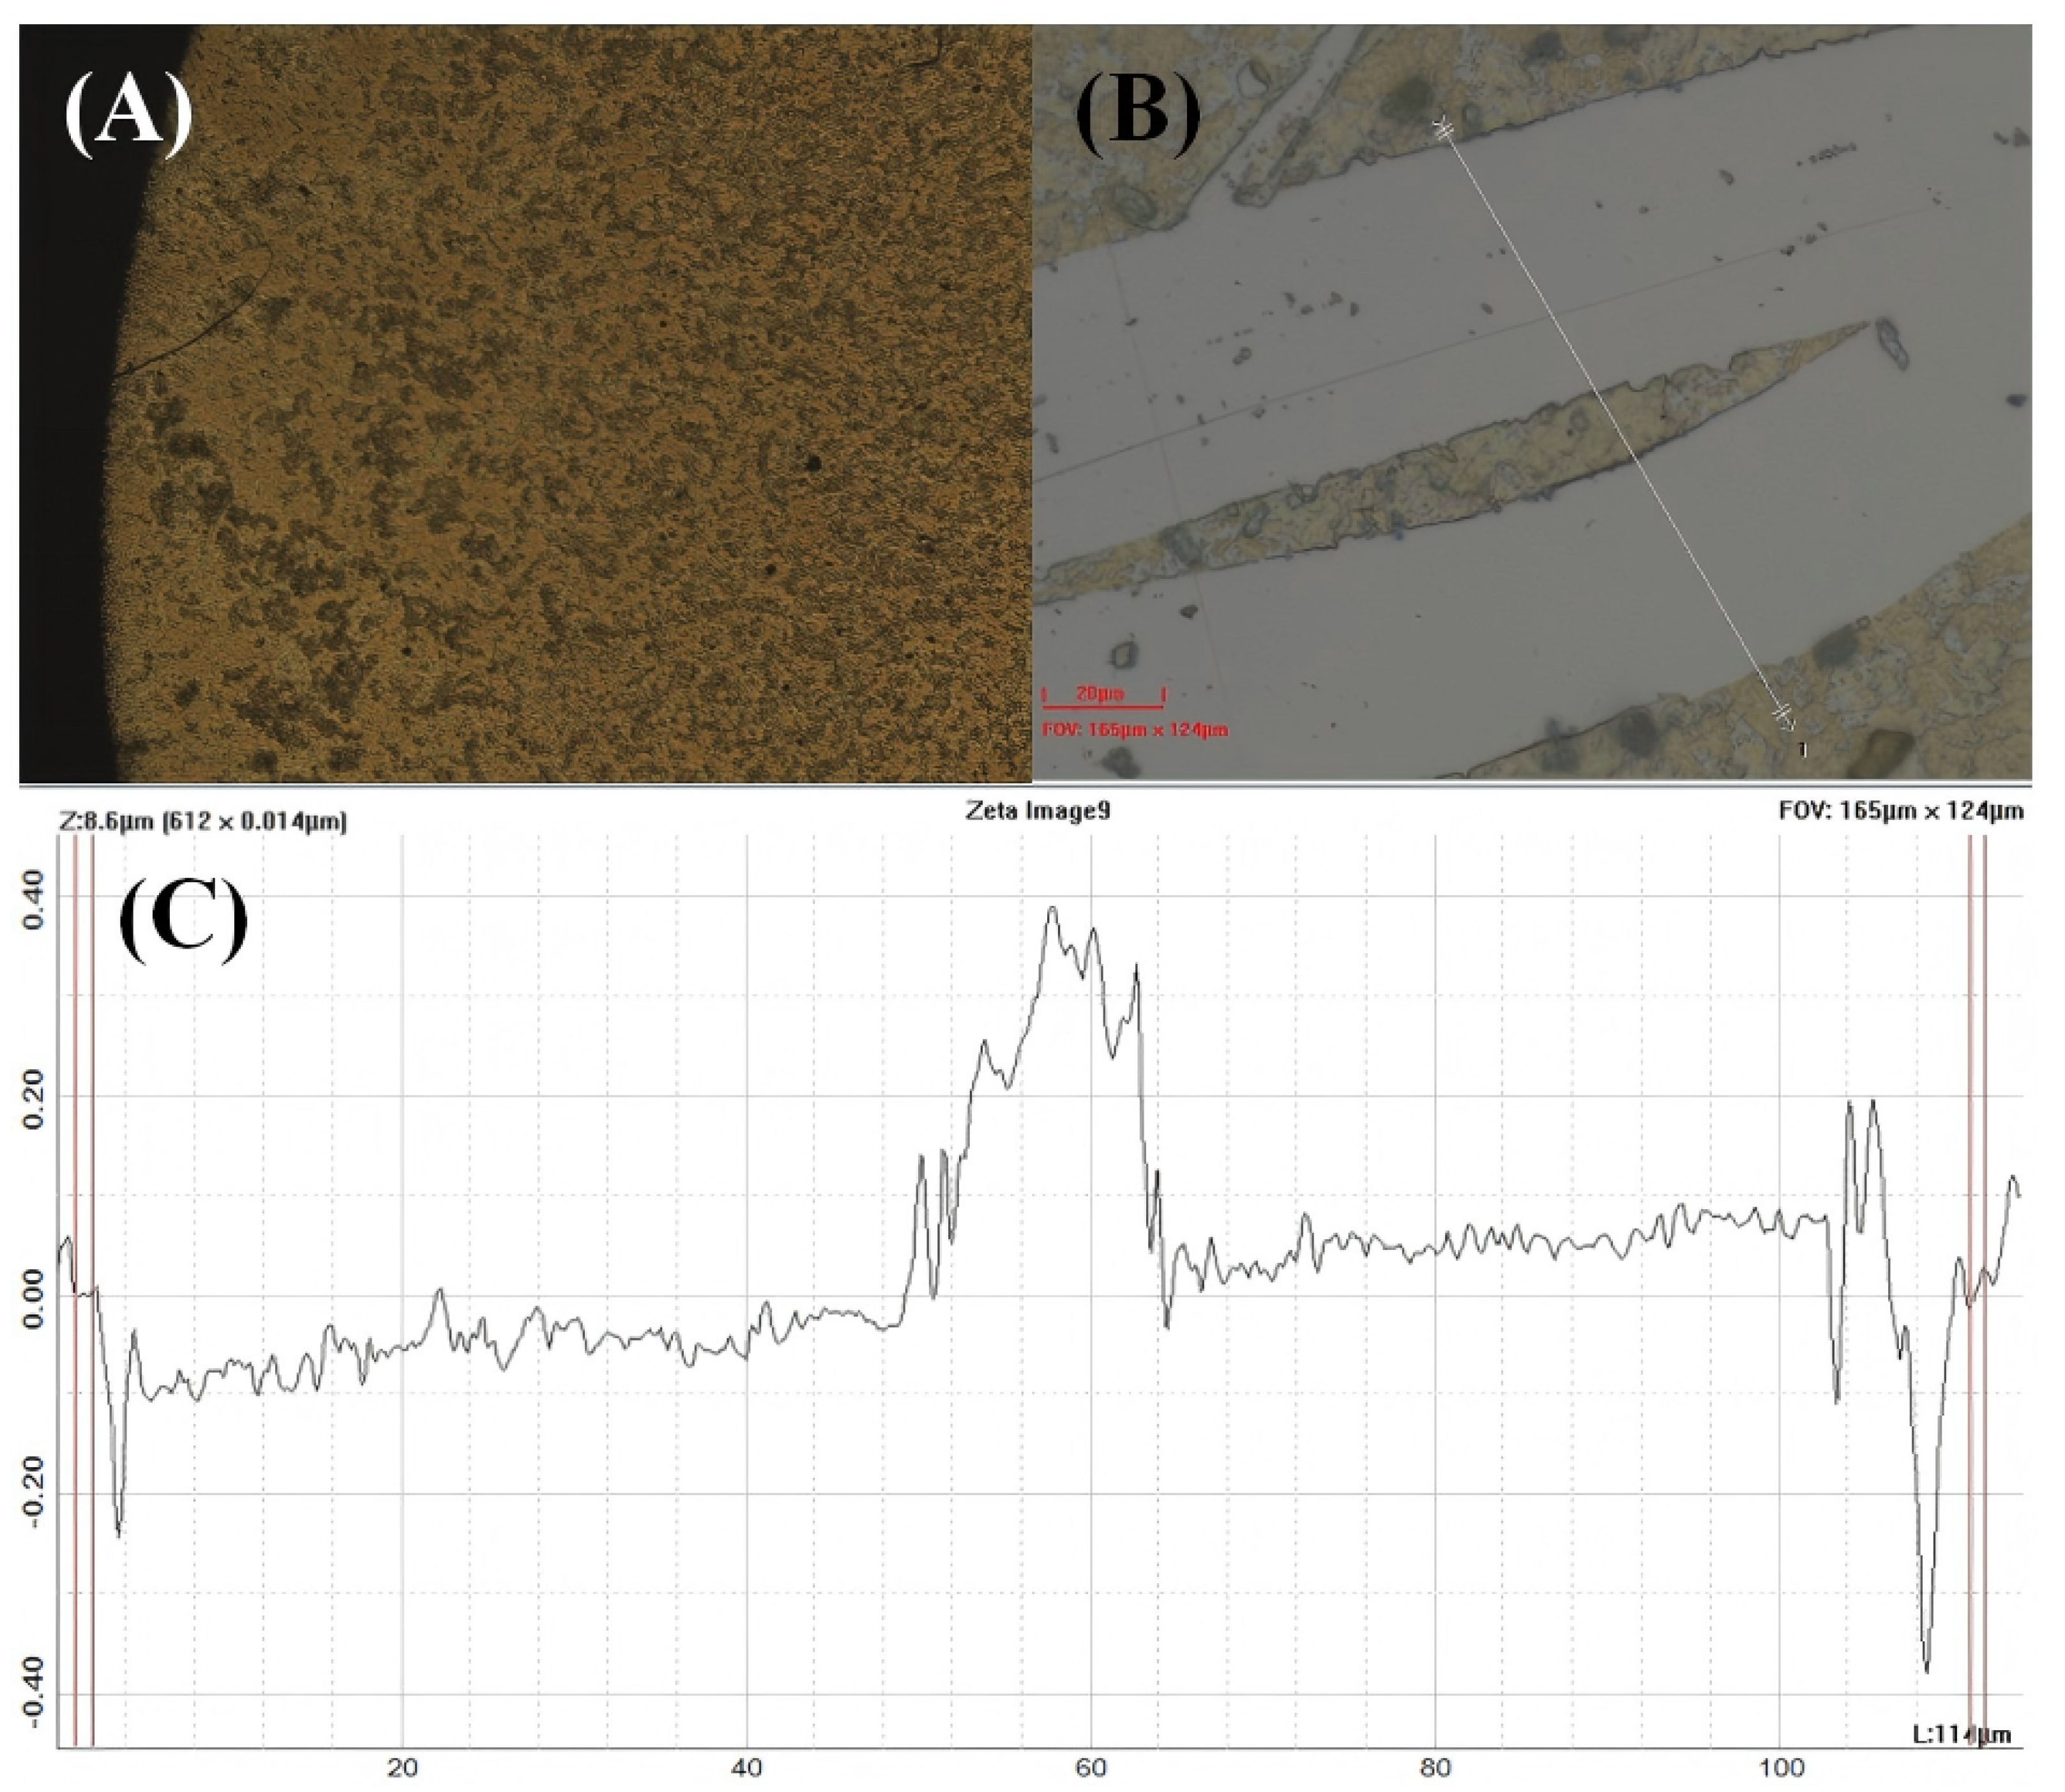
Figure 2D, Scanning electron microscopy (SEM) shows disc-shaped microcrystals with a uniform size distribution of 80–120 nm, consistent with reported morphology. Overall, MIL-125-NH2 demonstrates high crystallinity, well-defined functional groups, and excellent porosity and topographic homogeneity, providing a robust structural basis for its use as a QCM sensor coating.

3.2. Characteristic Response Profiles and Model Fitting

The MIL-125-NH2-functionalized QCM sensor demonstrates unique molecular size-dependent adsorption kinetics for alcohol homologs. 
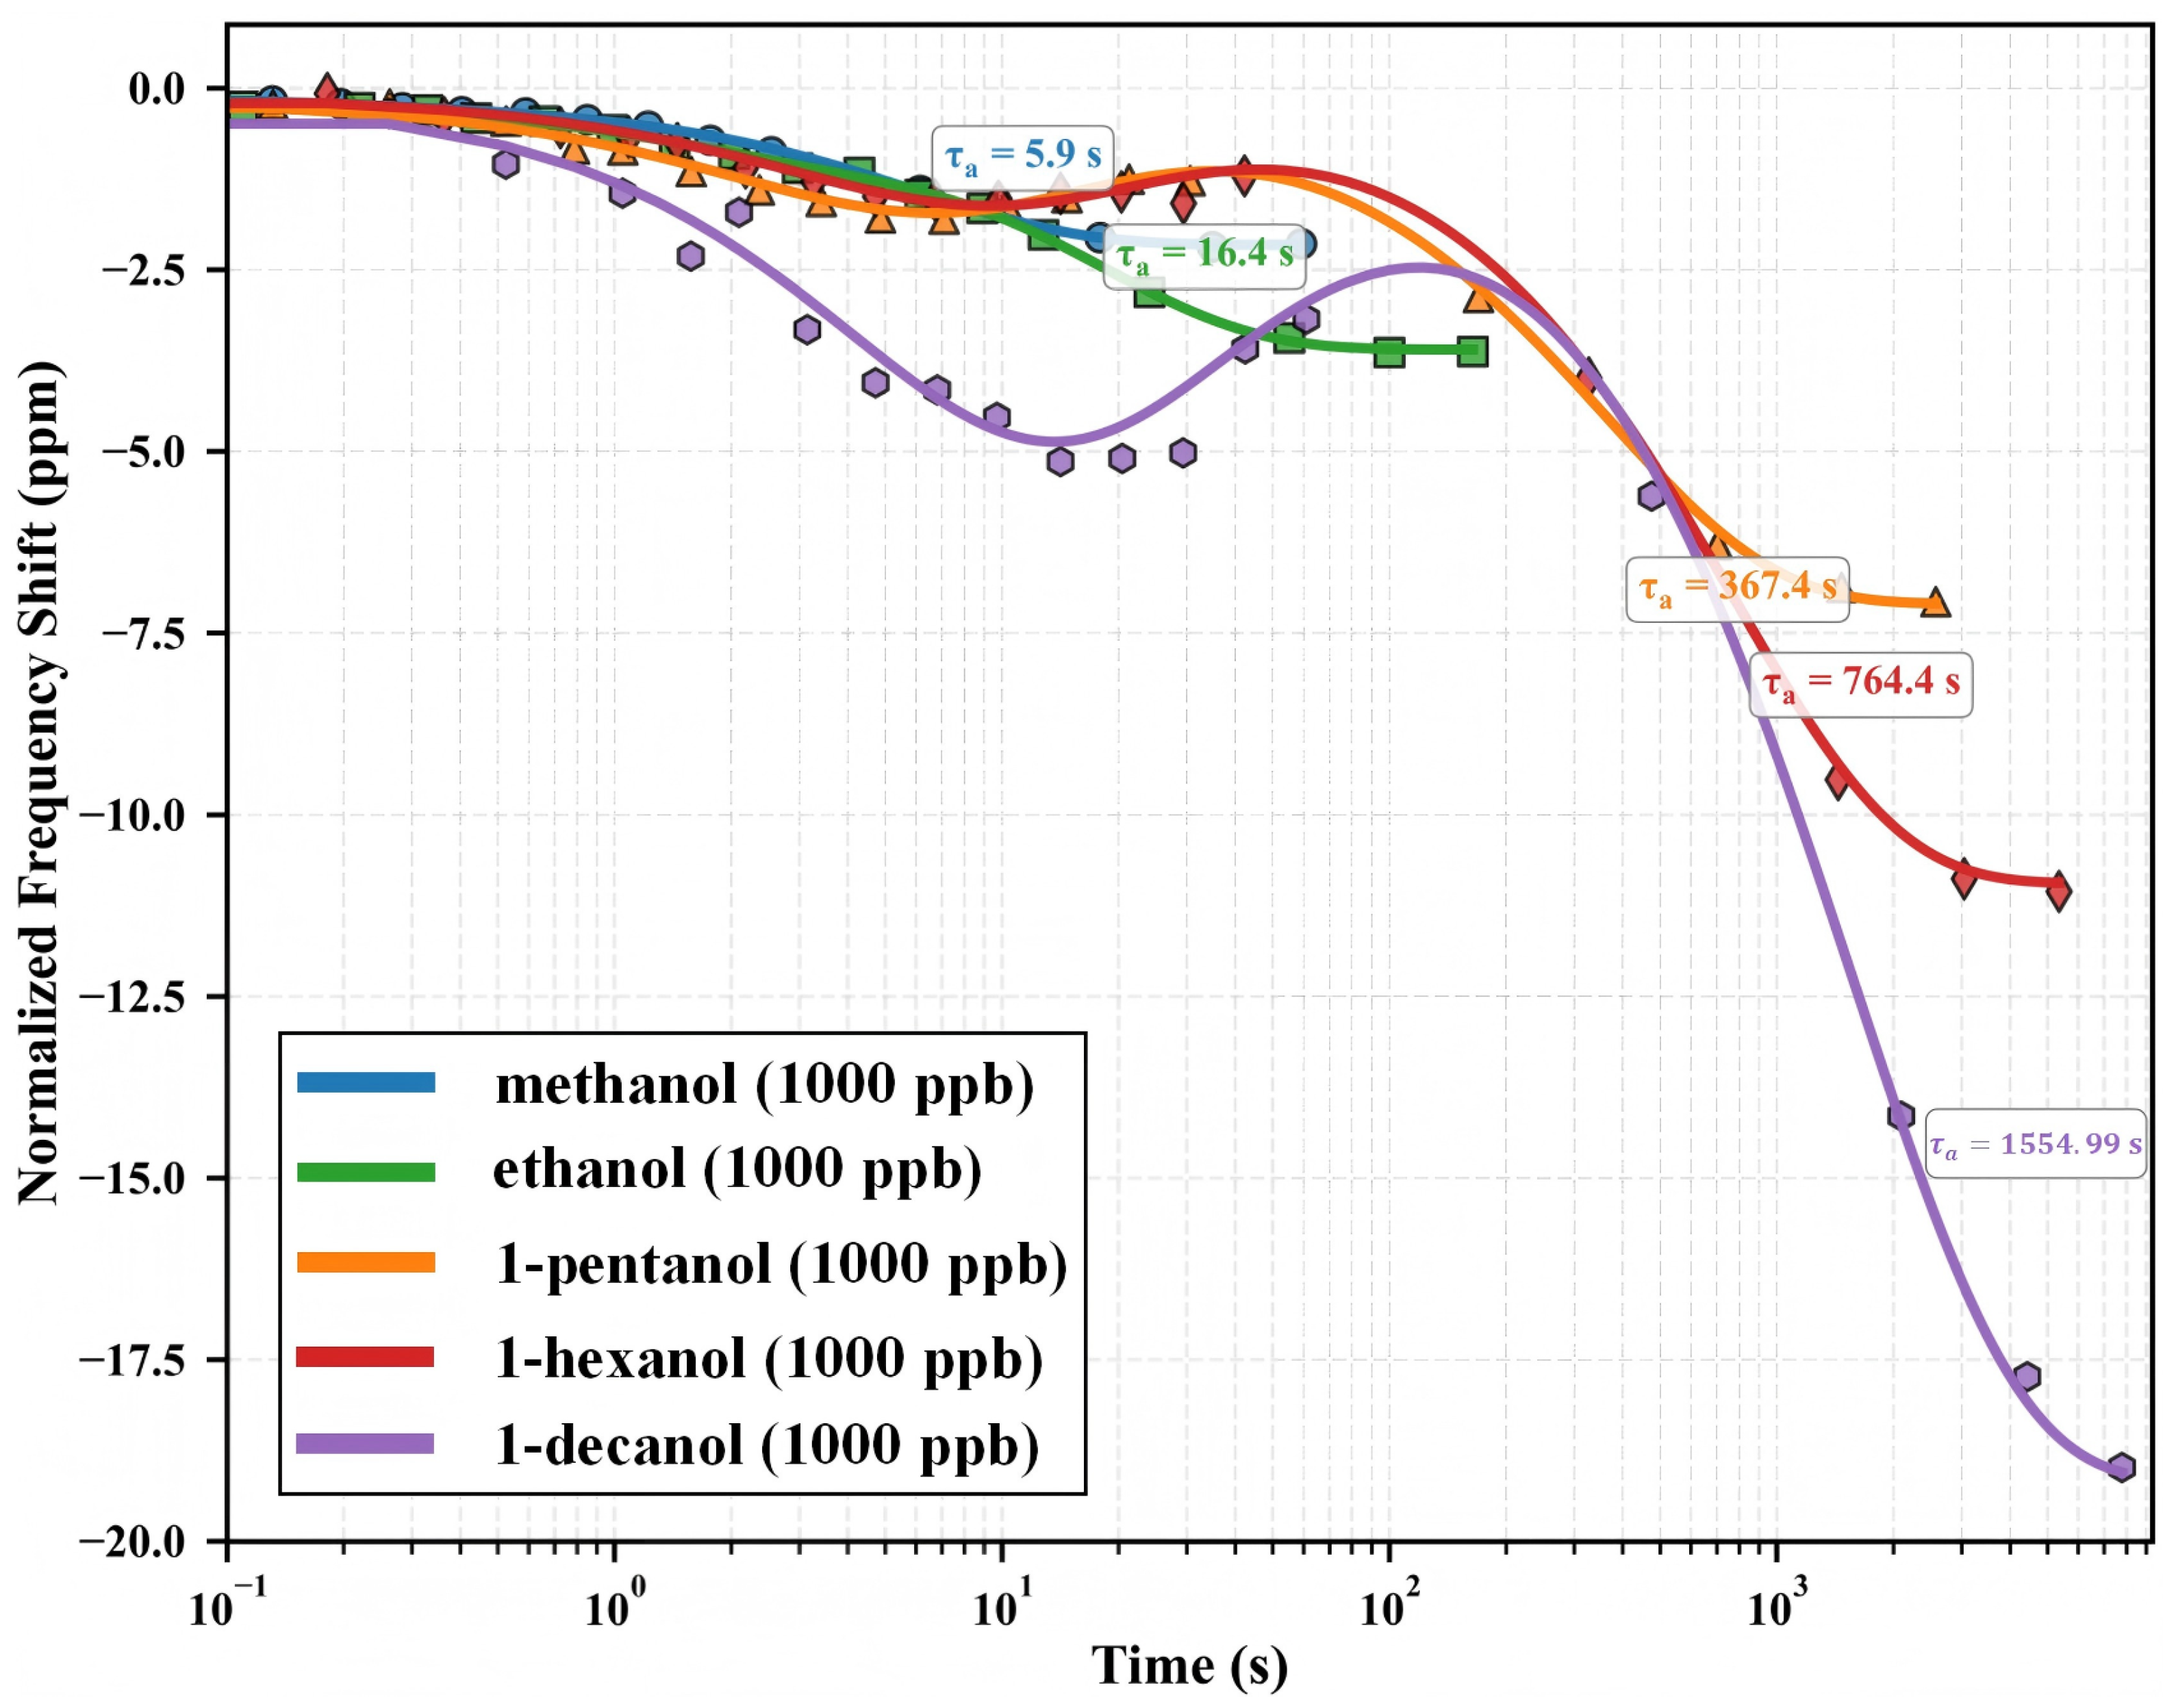
Figure 3 shows adsorption profiles as normalized frequency shifts versus logarithmic time. Each curve represents an individual adsorption experiment at an analogous concentration (1000 ppb). The logarithmic time representation allows for complete viewing of adsorption processes across many timeframes ( 10 1 10 3 s). Adsorption begins at the rightmost data point for each homolog and moves leftward over time until equilibrium is reached. This picture emphasizes two key observations: (1) equilibrium frequency shifts rise systematically with molecular weight, and (2) equilibration periods grow drastically with increasing molecular dimensions.
The adsorption profiles show a basic disparity in behavior across the homologous series. Lower molecular weight alcohols (methanol, ethanol) with diameters (4.5–5.2 Å) comparable to the framework’s minimal pore aperture (5.0 Å) show rapid equilibration ( τ a = 5.9 16.4 s) and mild frequency shifts (–2.17 to –3.51 ppm). In contrast, higher homologs (1-pentanol, 1-hexanol, 1-decanol) with dimensions exceeding the framework windows demonstrate dramatically extended equilibration times ( τ a = 367.4 1554.99 s) coupled with substantially enhanced frequency shifts (–7.21 to –19.56 ppm). This counterintuitive relationship—larger molecules generating stronger responses despite severe diffusion limitations—provides the first experimental evidence for the ‘size-selectivity paradox’ explored in detail in Section 3.7.
The modified adsorption model accurately captures complex dynamics ( R 2 > 0.995 , RMSE < 0.08 ppm) for all molecular species. Model parameter analysis shows that the ratio of adsorption amplitude to time constant ( b / τ a ) declines with molecular size, indicating a balance between thermodynamic driving forces and kinetic limits. The 263-fold rise in τ a from methanol to 1-decanol demonstrates MIL-125-NH2’s excellent molecular discrimination capabilities in the temporal domain, confirming time-resolved detection as a potent complementary technique to classic equilibrium-based approaches.

3.3. Concentration-Dependent Response Characteristics

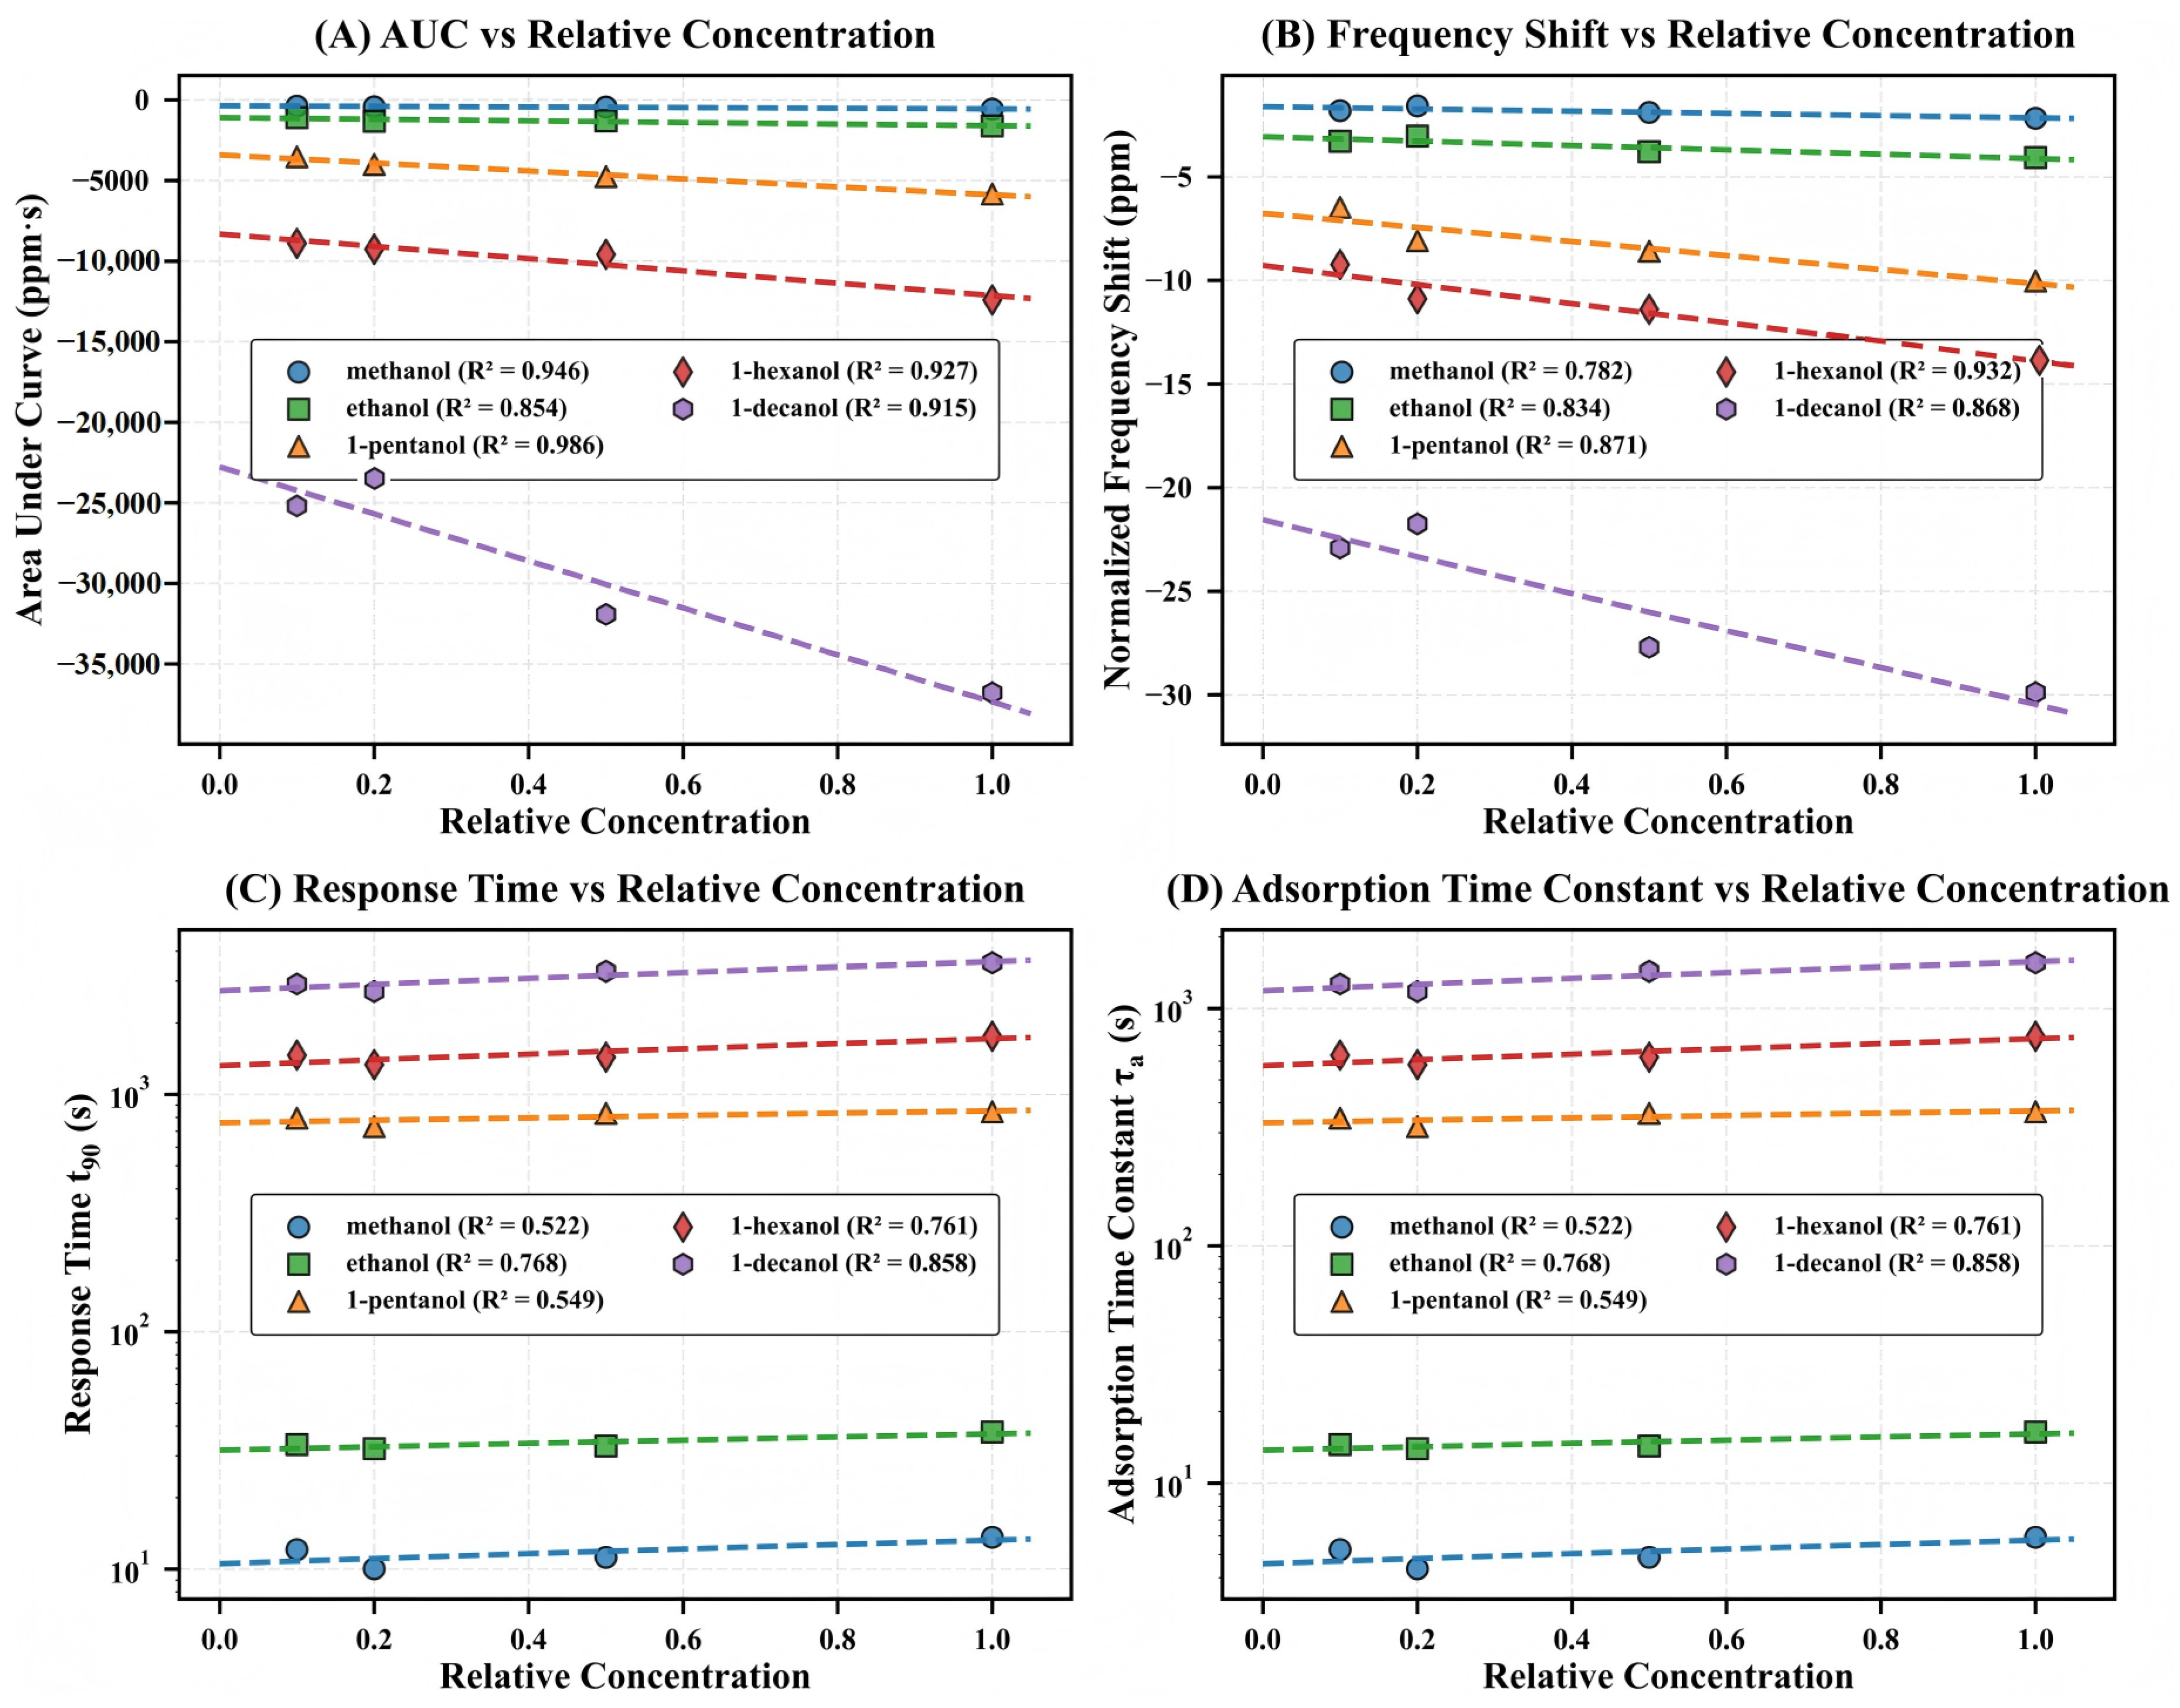
To establish a quantitative correspondence between the concentration of analytes and the response of QCM, this study systematically evaluated alcohol homologs across multiple concentration gradients, analyzing four critical sensing parameters, as shown in Figure 4. The amplitude parameters (AUC and Δ f , Figure 4A,B) exhibit exceptional linearity with concentration ( R 2 = 0.782 0.986 ) and systematic enhancement with molecular weight. AUC values for methanol and 1-decanol increase by approximately 37-fold at maximum concentration, from approximately –1000 ppm·s to –37,000 ppm·s. This increase is significantly greater than the 4.9-fold ratio of their molecular weights. This disproportionate amplification offers quantitative evidence that molecular recognition factors, in addition to simple mass loading, substantially influence the sensing response.
In striking contrast, the kinetic parameters ( t 90 and τ a , Figure 4C,D) segregate into two distinct domains—small alcohols (10–40 s range) versus large alcohols (300–2000 s range)—with minimal overlap. These parameters show more modest concentration dependence ( R 2 = 0.522 0.858 ) and span more than two orders of magnitude on a logarithmic scale, indicating that molecular transport through the microporous framework is governed primarily by structural compatibility rather than concentration gradients.
The contrasting behavior of amplitude versus kinetic parameters reveals the fundamental sensing mechanism of the MIL-125-NH2 system. The systematically increasing slopes in Figure 4A,B quantitatively demonstrate that larger molecules generate proportionally stronger responses despite their diffusion limitations—the key phenomenological signature of the size-selectivity paradox. AUC sensitivity is approximately 37-fold higher in 1-decanol than in methanol, although it necessitates a 263-fold longer equilibration time. This is compelling evidence that the kinetic penalties of larger molecules are substantially outweighed by the enhanced thermodynamic driving forces.
These calibration relationships simultaneously offer theoretical explanations for the molecular recognition properties of the MIL-125-NH2-QCM system and establish a robust analytical foundation. In practical sensing applications, the amplitude parameters provide exceptional linearity and superior concentration sensitivity, while the dramatic temporal differentiation observed in the kinetic parameters offers a complementary dimension for molecular discrimination based on diffusion dynamics.
To obtain the detection limit (LOD) for each alcohol homolog, the value of LOD was derived from the standard 3 σ / slope method and the concentration-dependent calibration curve depicted in Figure 4B. The analysis results indicate a distinct negative correlation between molecular weight and LOD, with values decreasing in the following order: methanol (0.19 ppm) > ethanol (0.11 ppm) > 1-pentanol (0.054 ppm) > 1-hexanol (0.042 ppm) > 1-decanol (0.026 ppm). This quantifiable evidence that larger molecules exhibit significantly enhanced detection sensitivity due to strengthened host–guest interactions, despite their significantly slower diffusion kinetics, is the result of a distinct trend of decreasing LOD values with increasing molecular weight. The thermodynamic advantage of stronger adsorption effectively transcends the diffusion kinetic limitations of larger homologs within the MIL-125-NH2 framework, as evidenced by the approximately sevenfold increase in LOD values from methanol to 1-decanol.

3.4. Structure–Property Relationships: Molecular Weight and Sensing Response

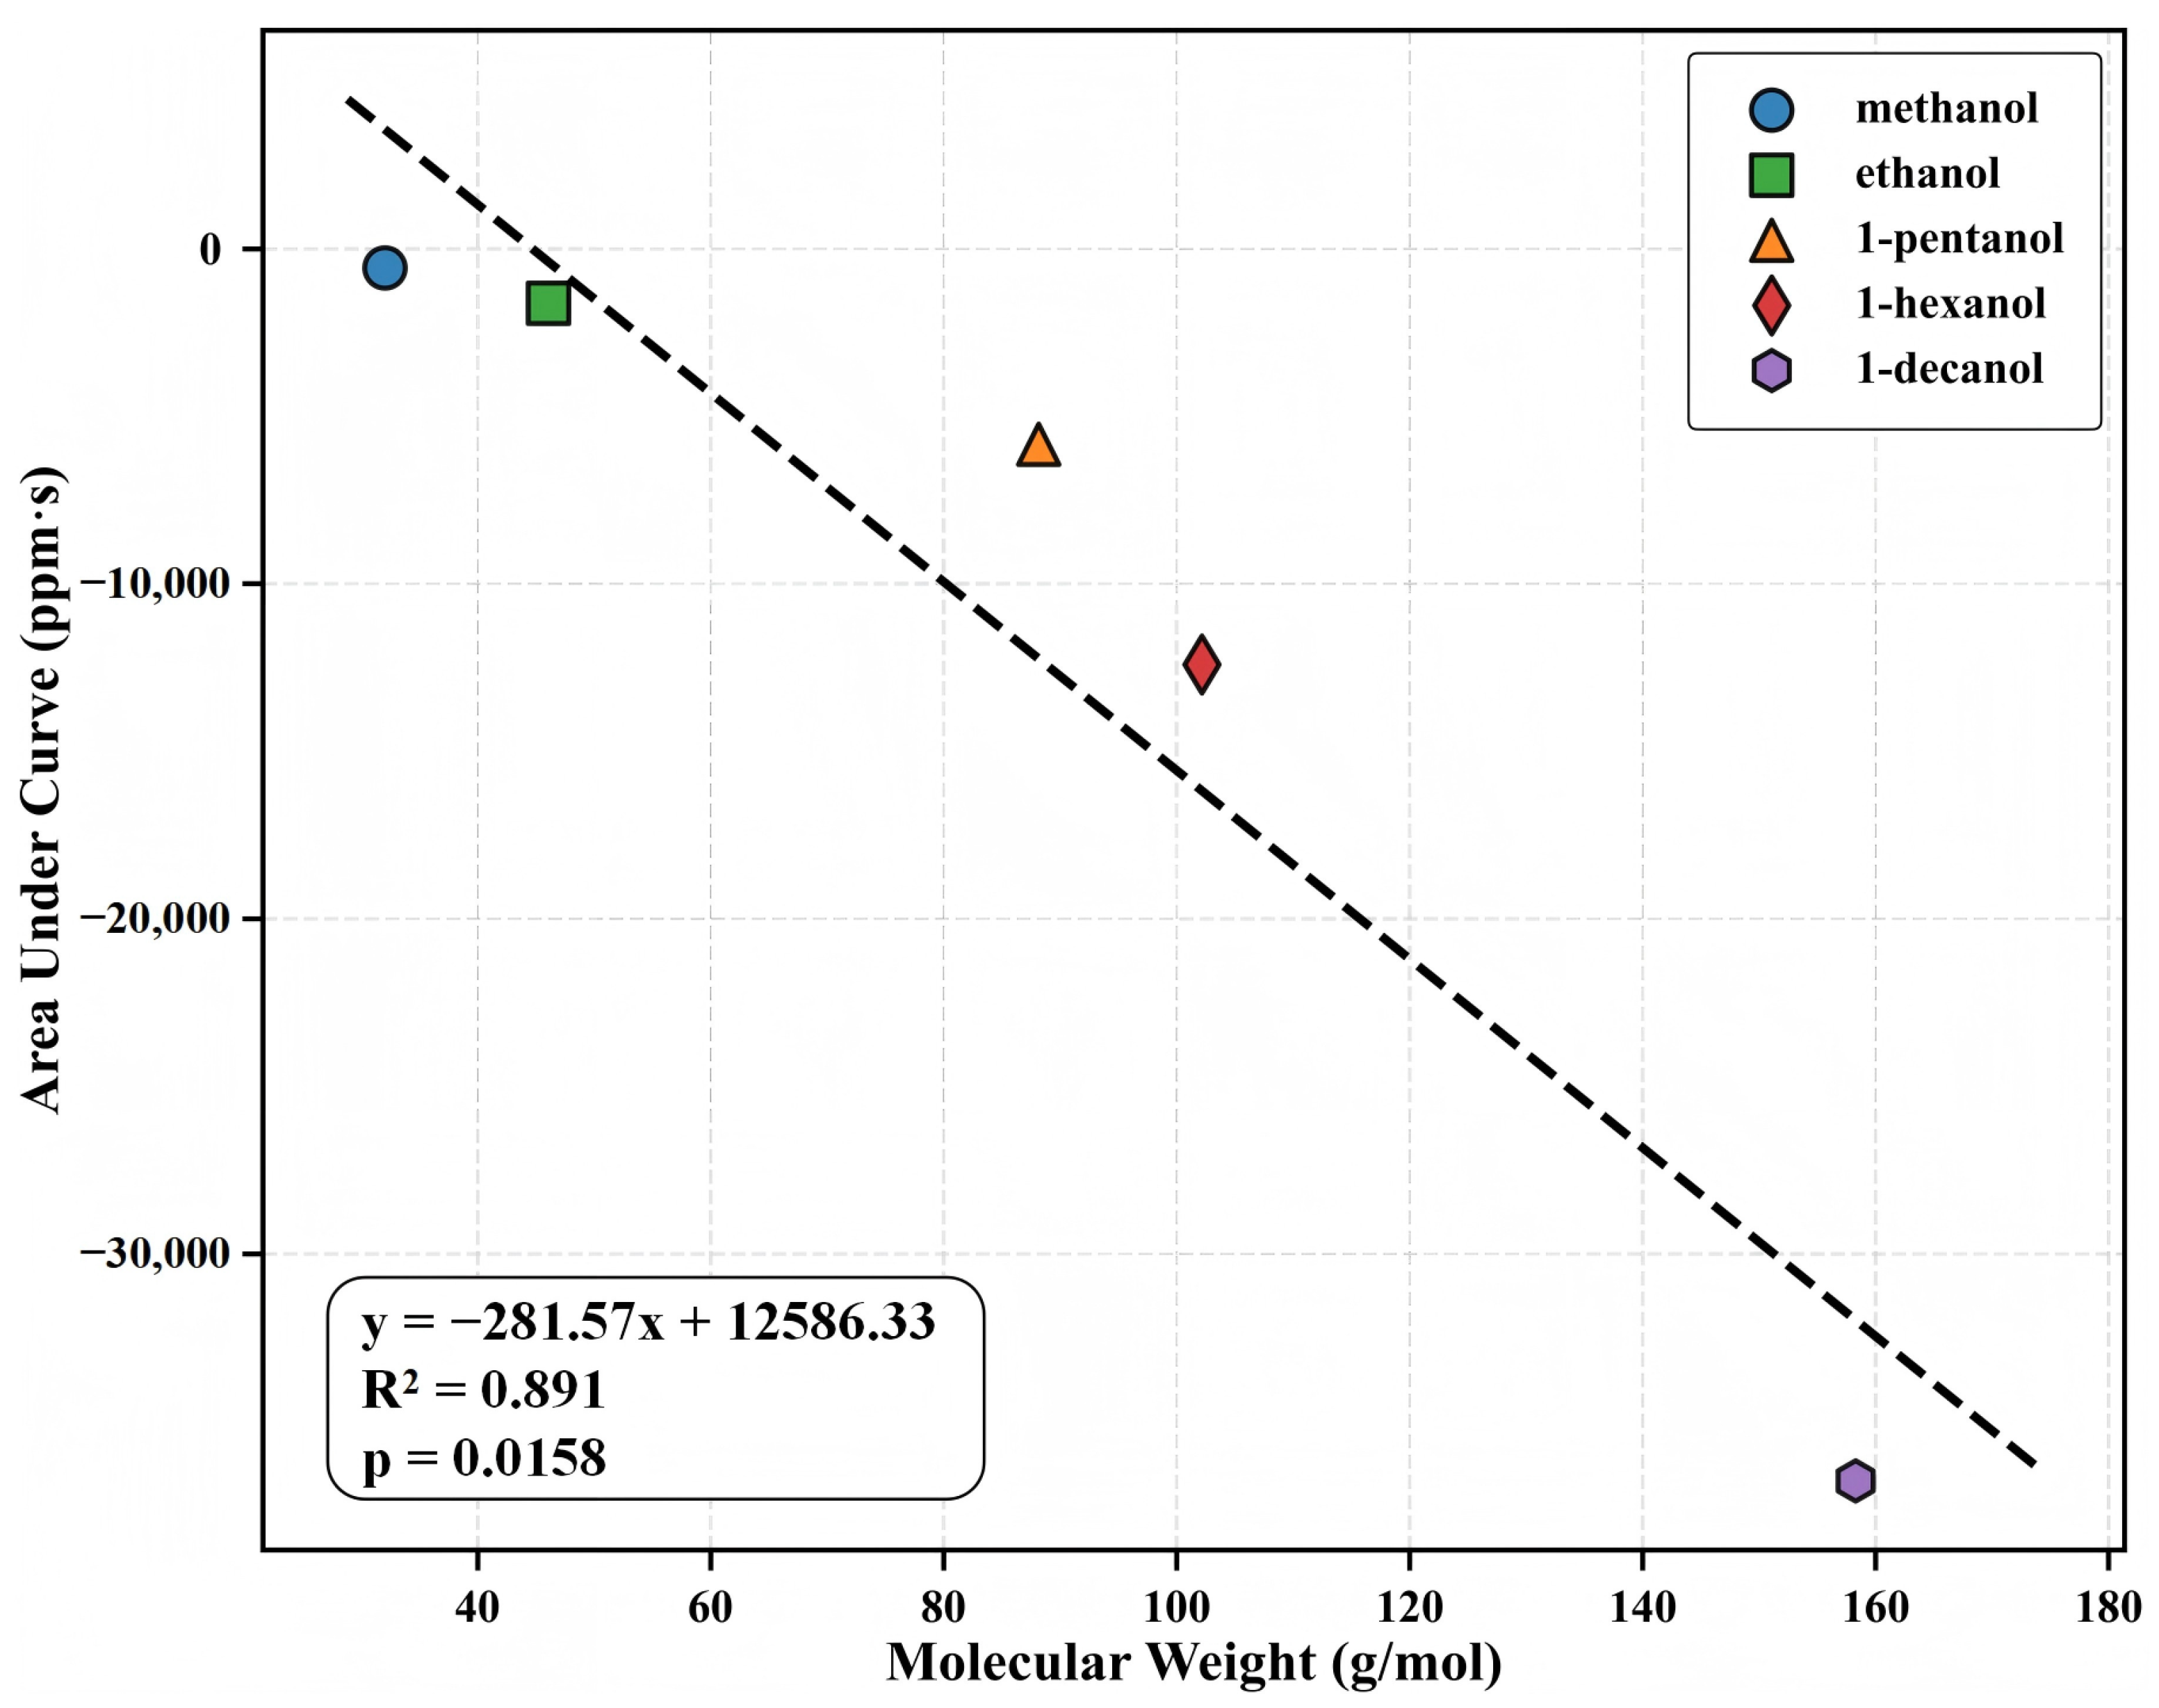
To understand the relationship between the molecular structure of the analyte and the QCM response behavior, we analyzed the relationship between the molecular weight and the integral response amplitude (AUC) for five alcohol homologs at maximum test concentration (Figure 5). Linear regression revealed a significant positive correlation ( R 2 = 0.891 , p = 0.0158 ), indicating that the higher the molecular weight, the stronger the mass response. At a concentration of 500 ppb, the AUC values for methanol, ethanol, 1-pentanol, 1-hexanol, and 1-decanol were 14.2, 28.7, 113.6, 166.4, and 199.5 ppm·s, respectively, indicating a nearly linear relationship with carbon chain length. The normalized frequency shift ( Δ f ) also shows a similar pattern, suggesting that molecular mass has a significant influence on response intensity.
Despite changes in analyte physicochemical characteristics (e.g., polarity, vapor pressure, diffusion rate), the QCM response consistently correlates with molecular weight, demonstrating a combination of mass loading and MOF pores’ adsorption capacity. This structure-response quantitative relationship provides a reliable sensing basis for MIL-125-NH2-based QCM sensors and a straightforward modeling technique for applications such as quantitative detection of off-specification items and faster homolog screening. Furthermore, the link between molecular weight and AUC can function as a unidimensional predictor in multivariate linear modeling and classification analyses, in conjunction with kinetic parameters (e.g., τ a , t 90 ), thus improving recognition accuracy and modeling adaptability in complex mixtures.

3.5. Molecular Dimensions and Adsorption Kinetics

Following our analysis of the concentration-response characteristics, we now examine the direct relationship between molecular structure and adsorption kinetics. This relationship is of fundamental importance for understanding molecular transport in microporous materials and for developing structure-based prediction models for sensor applications. 
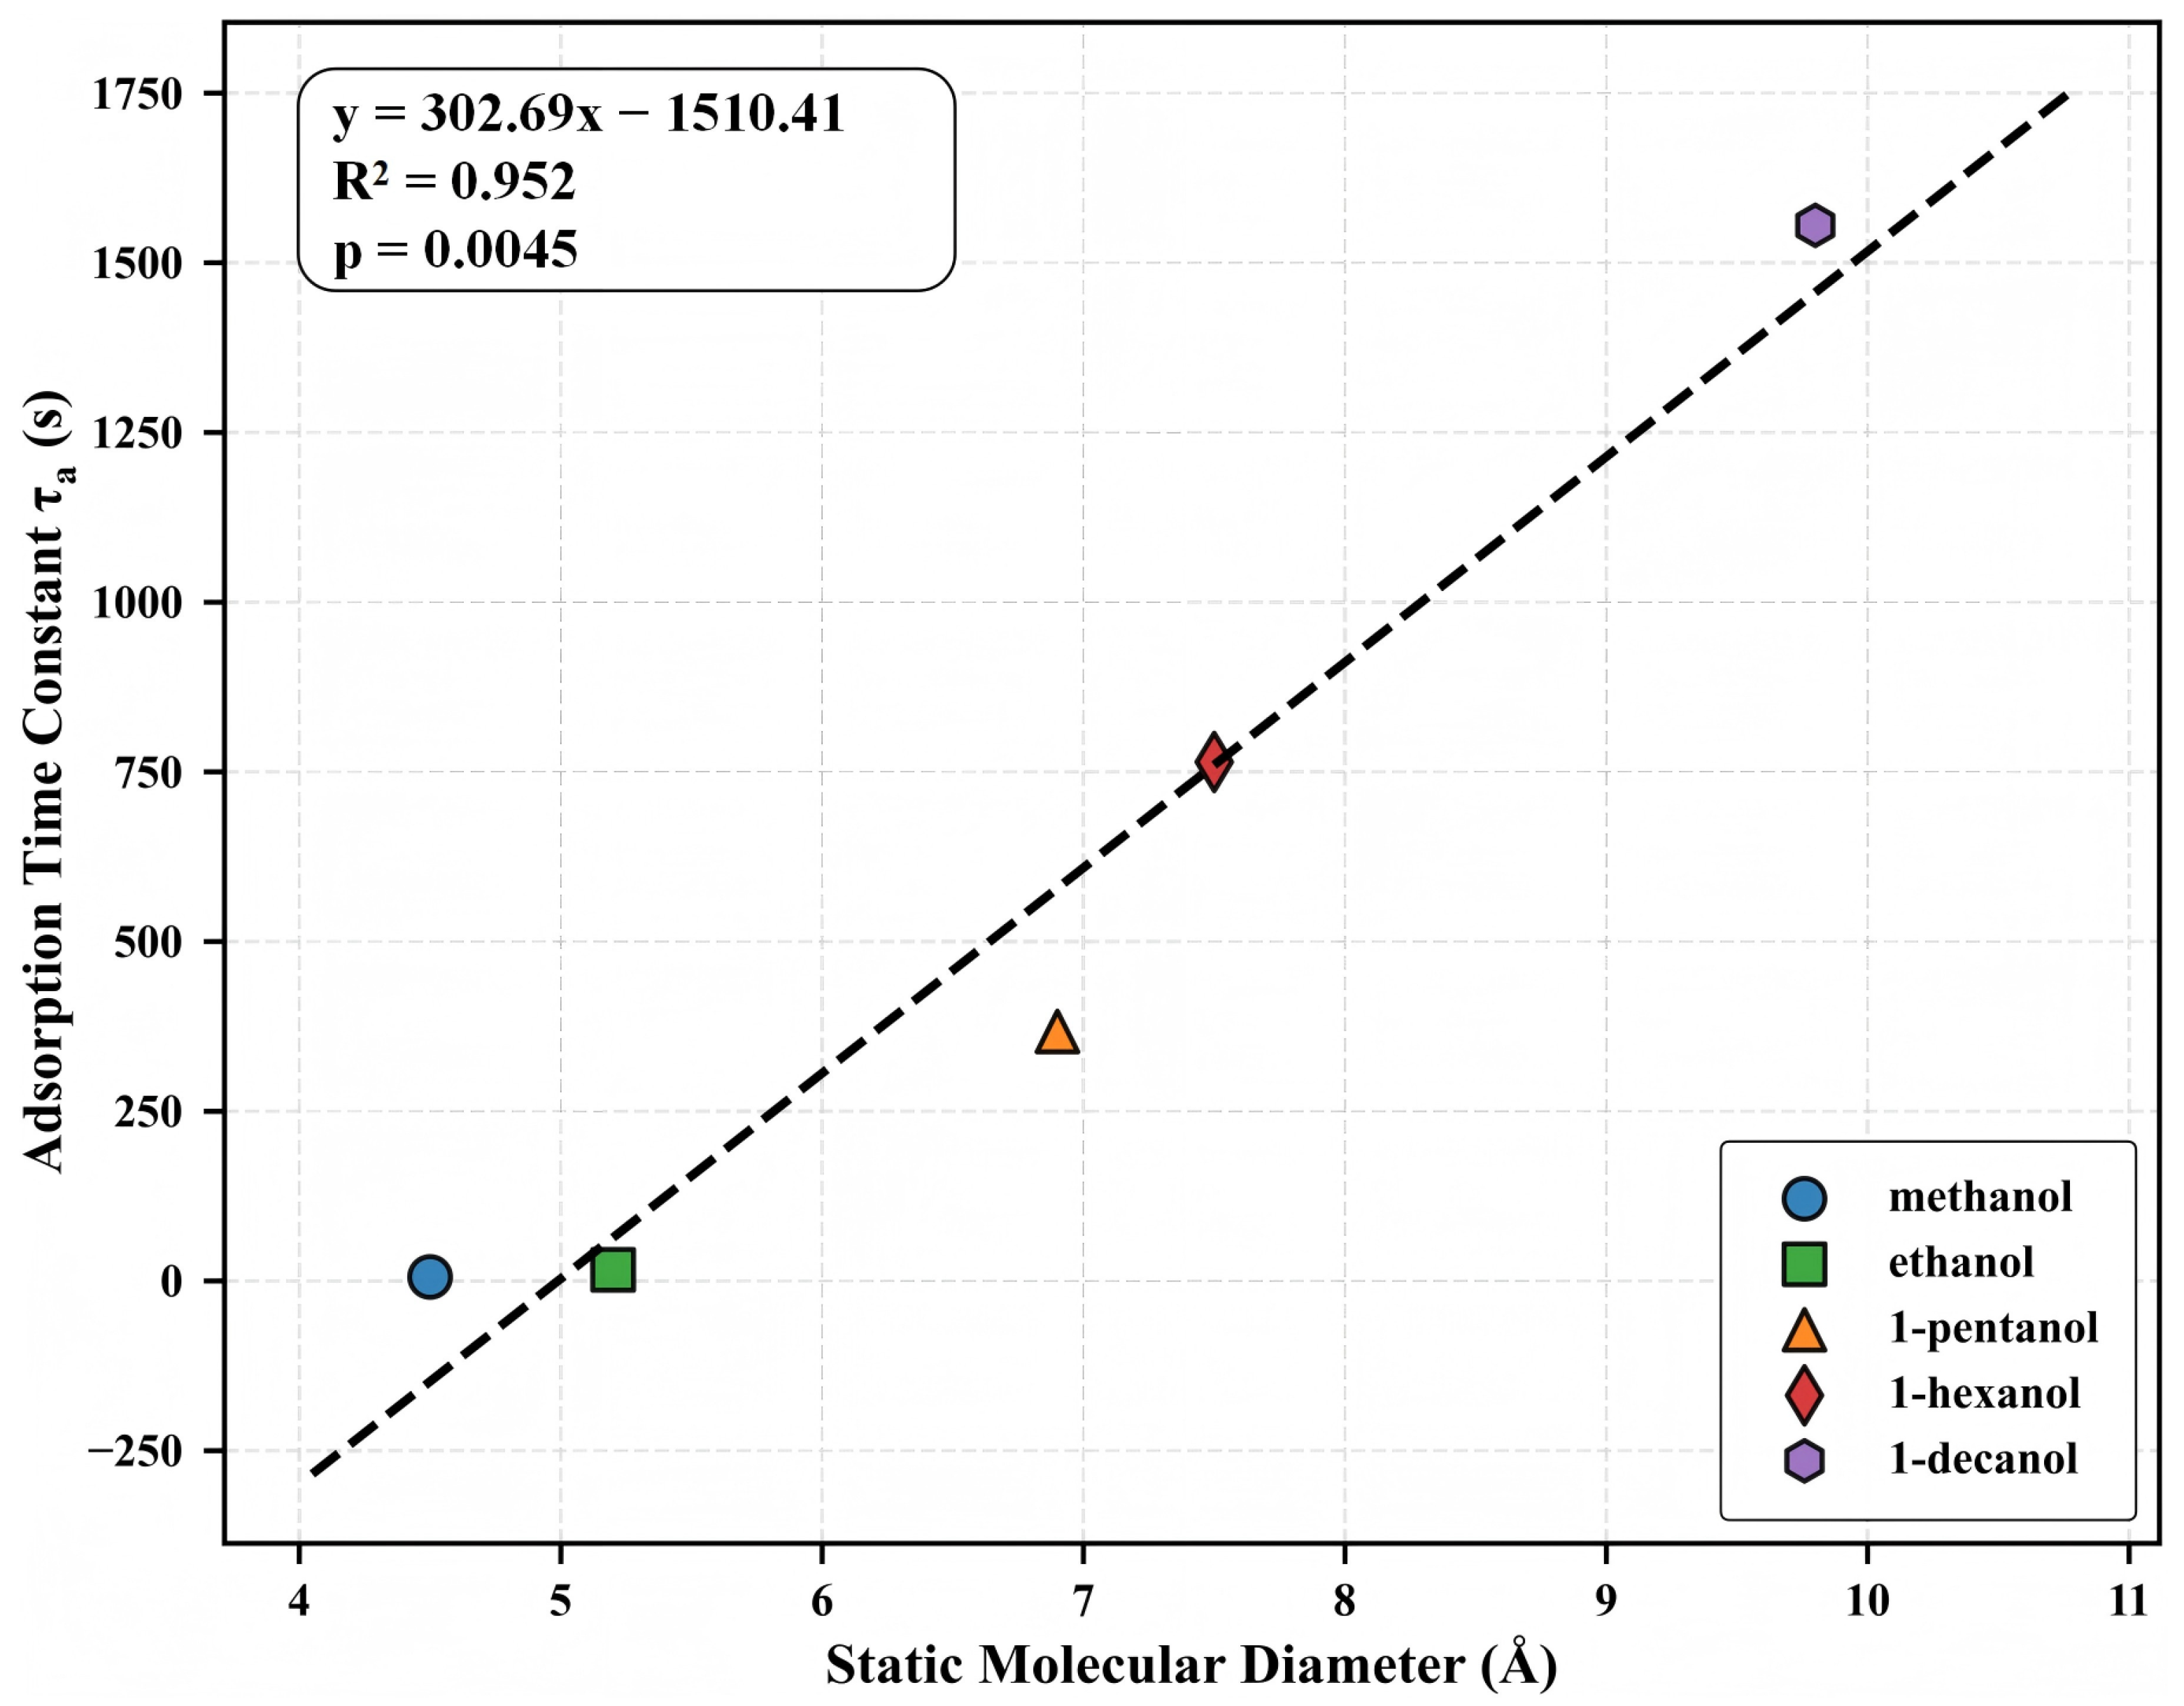
Figure 6 shows the relationship between molecular diameter and adsorption time constant ( τ a ) for the five alcohol homologs. The linear regression analysis shows a statistically significant correlation ( R 2 = 0.952 , p = 0.0045 ), with τ a increasing systematically from methanol (4.5 Å, 5.93 s) to 1-decanol (9.8 Å, 1554.99 s). This 262-fold increase in τ a with only a 2.2-fold increase in the nominal diameter demonstrates the exceptional sensitivity of the adsorption kinetics to molecular dimensions.
The strong linear correlation between diameter and τ a has profound mechanistic implications. The MIL-125-NH2 framework, with window apertures of 5.0–7.0 Å, creates a transition condition from Fickian to activated diffusion across our homologous series. Smaller alcohols (methanol, ethanol) with diameters 5.2 Å experience minimal diffusion barriers, while larger molecules encounter progressively greater activation energies for transport. The observed linear τ a –diameter relationship corresponds to an exponential relationship between diffusion coefficient and molecular cross-sectional area, as expected from activated diffusion models where τ a 1 / D eff and D eff exp ( E a / R T ) , with E a scaling approximately with cross-sectional area.
Although static molecular diameters are employed as the structural parameter in our research, it is crucial to acknowledge that the conformational flexibility of the primary alcohols may influence their transport behavior. Structures that permit sequential transit through microporous channels may be adopted by longer-chain alcohols, potentially preventing the complete exclusion of molecules with nominal diameters that exceed the apertures of the framework. The structure–kinetics correlation’s accuracy ( R 2 > 0.95 ) provides a quantitative foundation for estimating adsorption dynamics, as determined by the dimensions of the molecule. This link not only substantiates theoretical theories of limited diffusion but also offers temporal response patterns as a robust dimension for molecular discrimination in sensing applications.

3.6. Homologous Series Trends

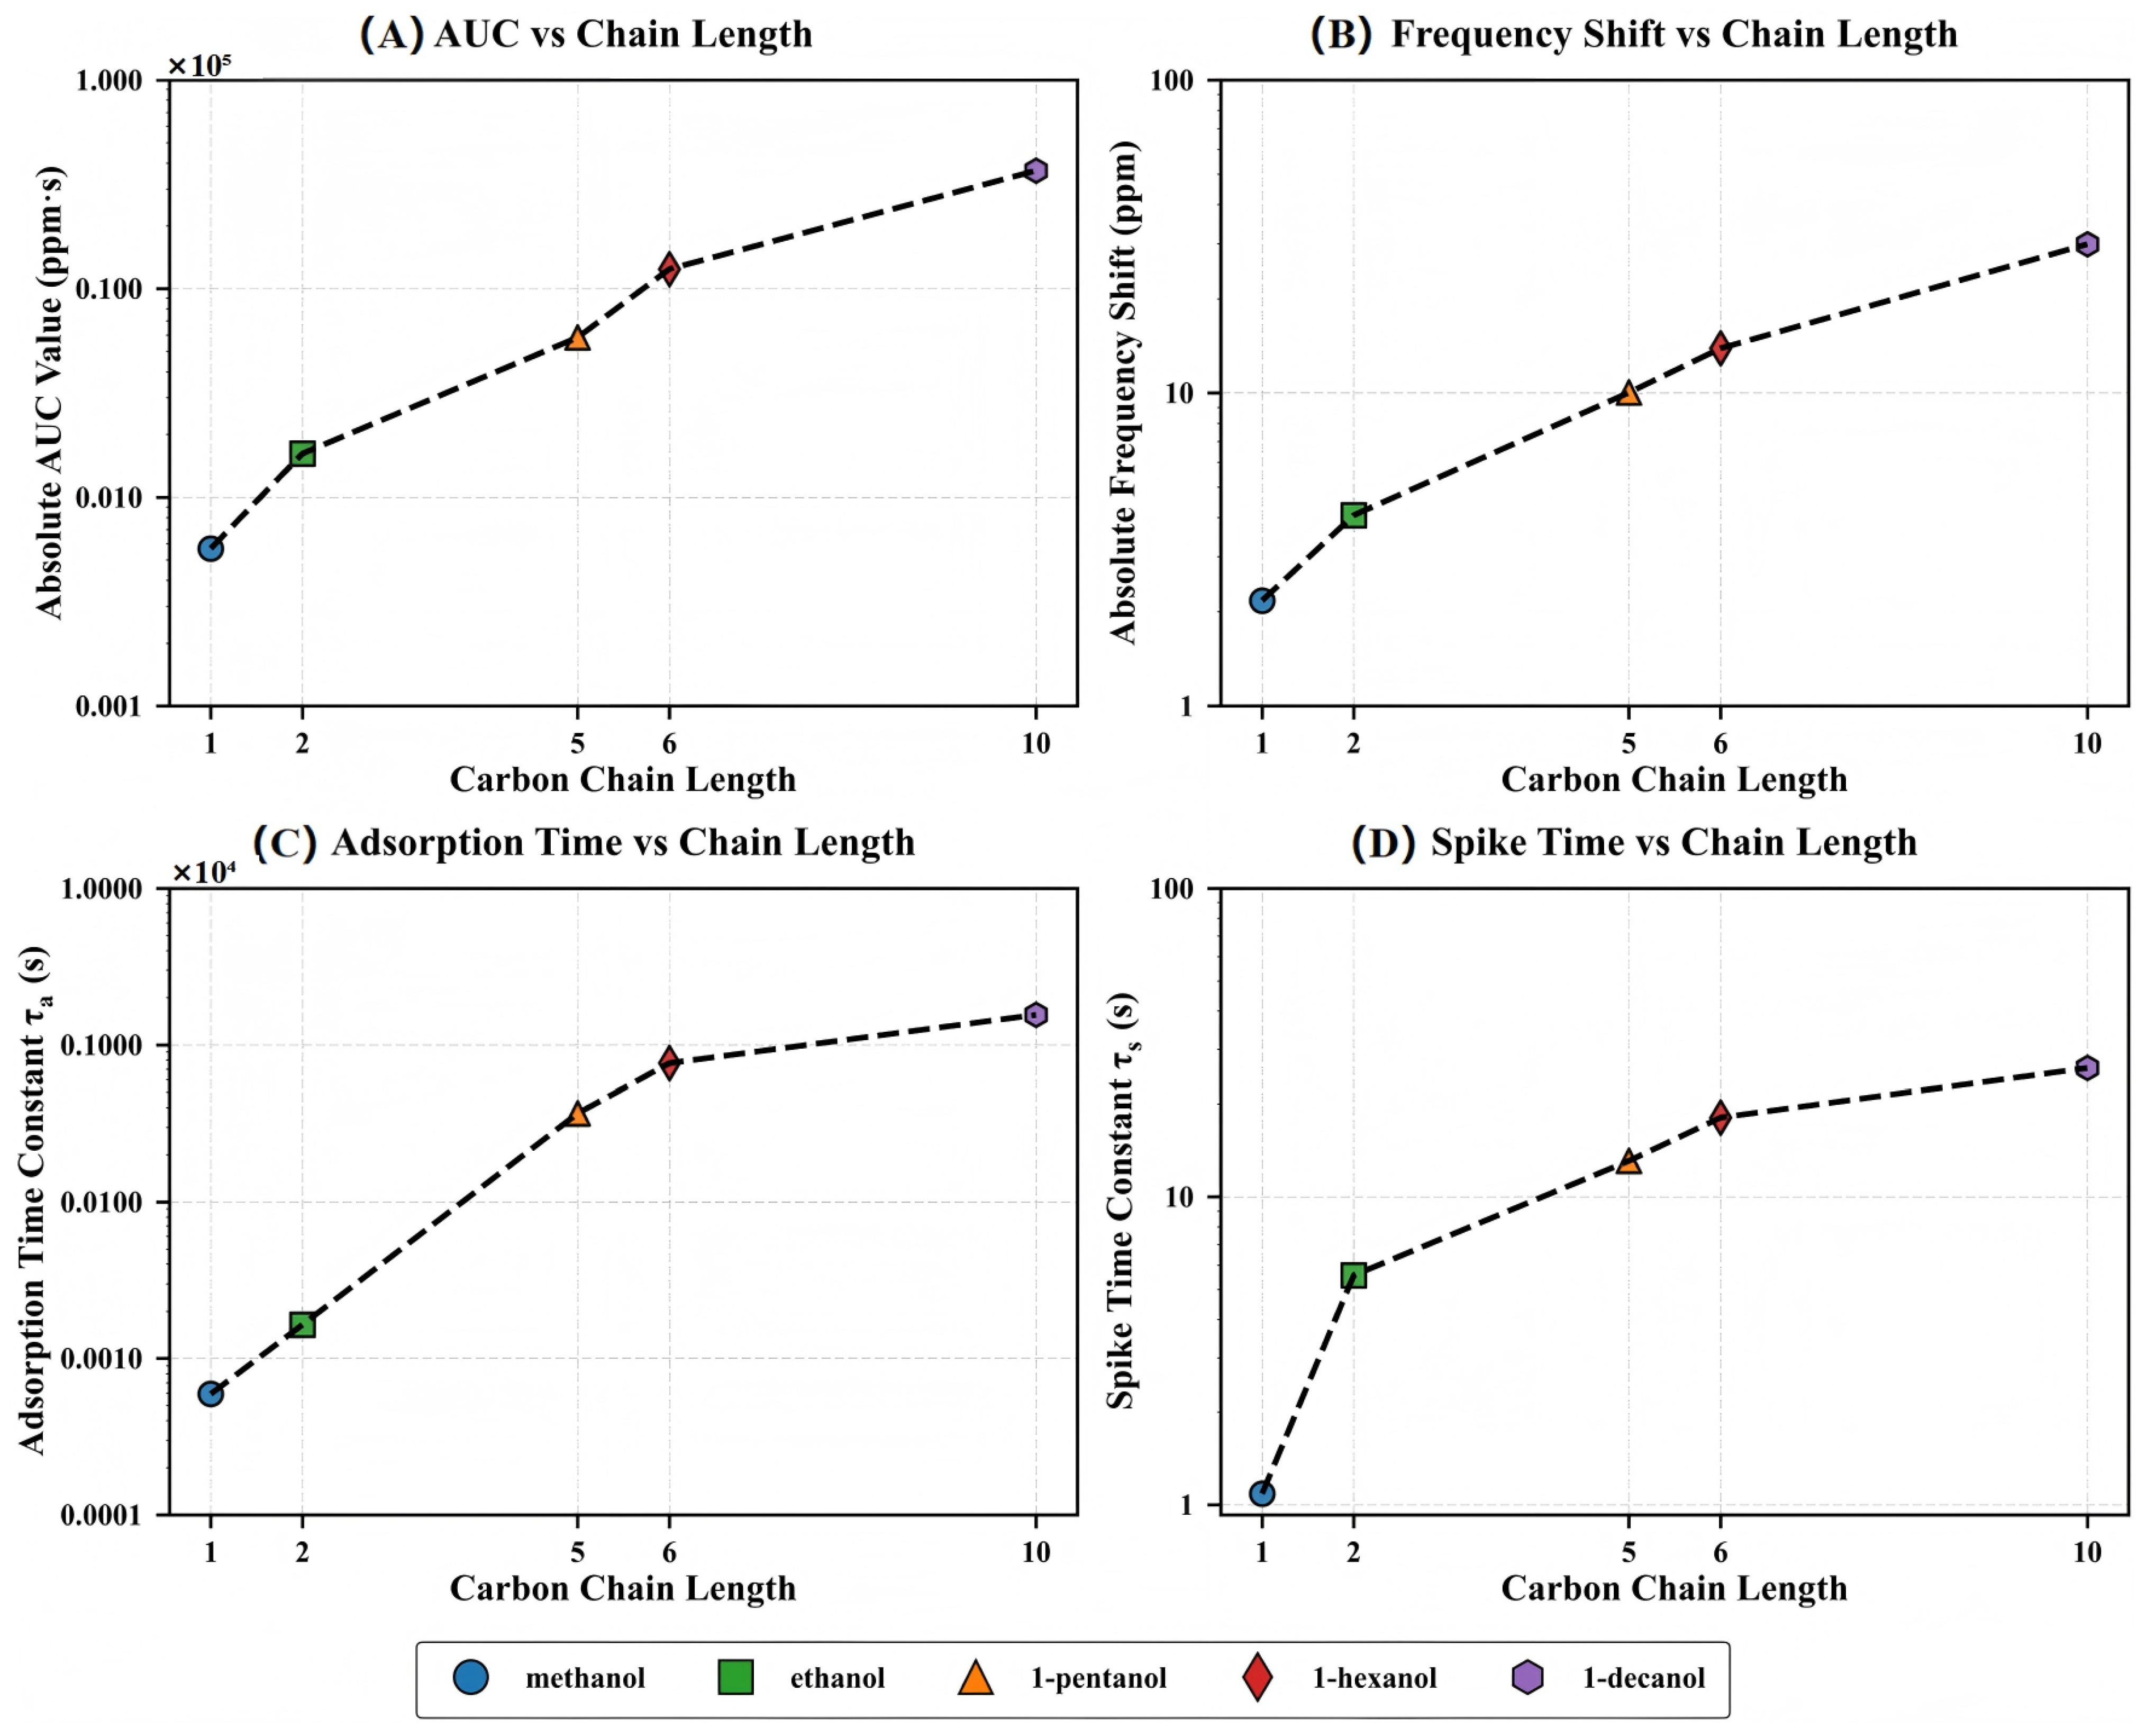
After clarifying the role of molecular dimensions in regulating the adsorption kinetic process, we introduce the carbon chain length as a unifying dimension and examine its relationship with several sensing response parameters. As shown in Figure 7, the four key indices, including the integrated response amplitude (AUC), normalized frequency shift ( Δ f ), adsorption time constant ( τ a ), and spike decay time constant ( τ s ), show a consistent and systematic growth trend with increasing carbon chain length, indicating that this MOF–QCM system shows clear structural sensitivity in the molecular recognition process.
The response amplitude parameters (AUC and Δ f ) exhibit approximate exponential growth with carbon chain length, while the kinetic parameters ( τ a and τ s ) show nonlinear increases, reflecting significant hysteresis in molecular diffusion rates with structural evolution. This high consistency across different response parameters provides solid experimental support for establishing a structure–function mapping model of the MOF–QCM system.
The exponential relationship indicates that the effect of each added methylene (–CH2–) unit in the carbon chain on response amplitude and adsorption rate is cumulatively amplified rather than linearly superimposed. This pattern strengthens the ability of the MOF–QCM system to recognize molecular structure changes at the mechanistic level and further validates the ’size-selectivity paradox’, where larger molecules show stronger responses despite violating traditional size-sieving assumptions.

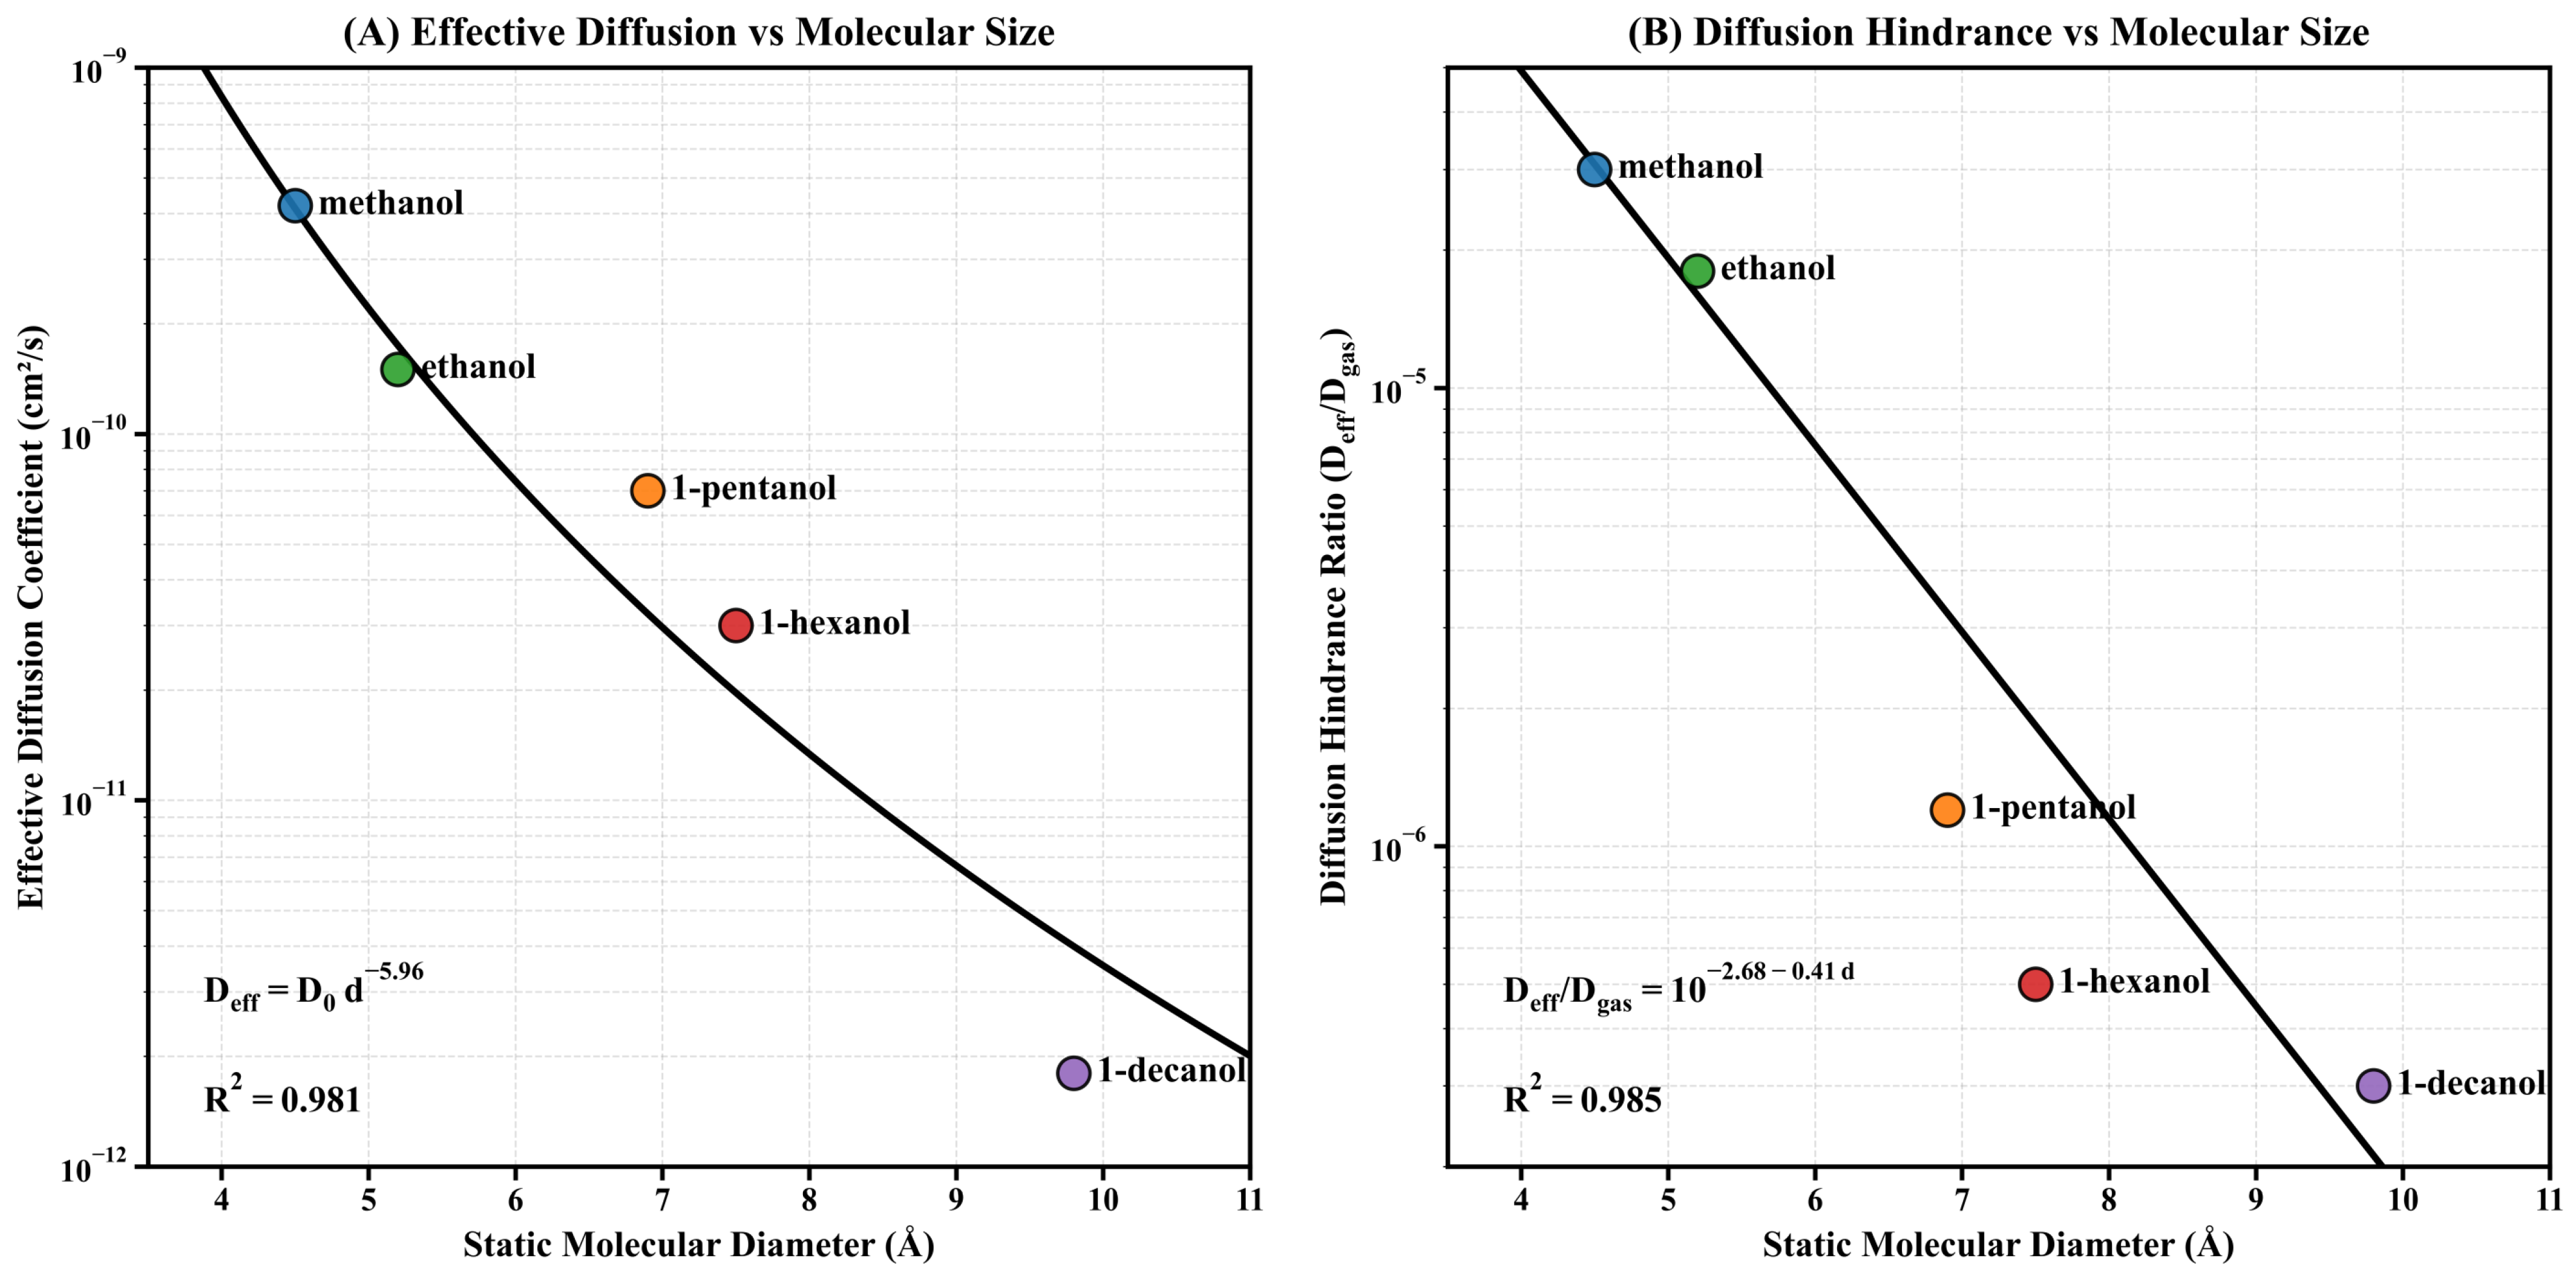
3.7. Effective Diffusion Analysis

To quantitatively analyze the molecular transport process in the MIL-125-NH2 system, we investigated the relationship between molecular size and diffusion parameters in a series of homologous alcohols. Using experimentally determined adsorption time constants, the effective diffusion coefficient was derived using the equation D eff = L 2 / τ a (where L 500 nm represents the thickness of the metal–organic framework (MOF) thin film), thereby establishing a quantitative structure–transport relationship in microporous materials.
As shown in Figure 8A, the effective diffusion coefficient exhibits a significant power-law decay with increasing molecular diameter. This relationship is given by D eff = D 0 d 5.96 , with R 2 = 0.981 . This relationship spans over two orders of magnitude: from 4.2 × 10 10 c m 2 /s for methanol to 1.6 × 10 12 c m 2 /s for 1-decanol. The exponent ( 5.96 ) is significantly higher than the values predicted by the classical hindered diffusion model (typically 1 to 3 ), indicating that as molecular size increases and exceeds the framework characteristic pore diameter, the diffusion mechanism transitions from hindered diffusion to activated diffusion.
The Arrhenius equation D eff = D 0 exp ( E a / R T ) explains the transition to activated diffusion. E a is the activation energy barrier for molecules to penetrate restrictive pores. For microporous systems where molecular size is comparable to pore size, theoretical models indicate that activation energy is approximately proportional to the square of the molecular cross-sectional area. At constant temperature, this quadratic energy consumption relationship manifests as a power-law relationship between D eff and molecular diameter, with the exponent significantly larger than the value predicted by classical models.
To quantitatively assess the influence of the restriction effect relative to unobstructed transport, we studied the diffusion hindrance ratio ( D eff / D gas ), where D gas denotes the gas-phase diffusion coefficient per molecule. As shown in Figure 8B, this normalized parameter exhibits a logarithmic linear relationship with molecular diameter: D eff / D gas = 10 2.68 0.41 d , with R 2 = 0.985 . This systematic trend indicates that the relative diffusion coefficient decreases by approximately one order of magnitude for every 2.4 Å increase in molecular diameter—a remarkably consistent scaling relationship spanning four orders of magnitude, from methanol (~ 10 3 ) to 1-decanol (~ 10 7 ).
The diffusion hindrance analysis quantitatively confirms the ‘dual-effect paradox’ in MOF-based sensing: larger molecules exhibit higher equilibrium responses due to stronger host–guest interactions, but their diffusion rates are significantly reduced. The inverse relationship between sensitivity and response kinetics presents major problems for the design of microporous sensing interfaces. The high precision of both correlations ( R 2 > 0.98 ) enables reliable prediction of transport parameters based solely on molecular size, thereby simplifying the computational screening of potential analyte-framework combinations without the need for extensive experimental characterization.

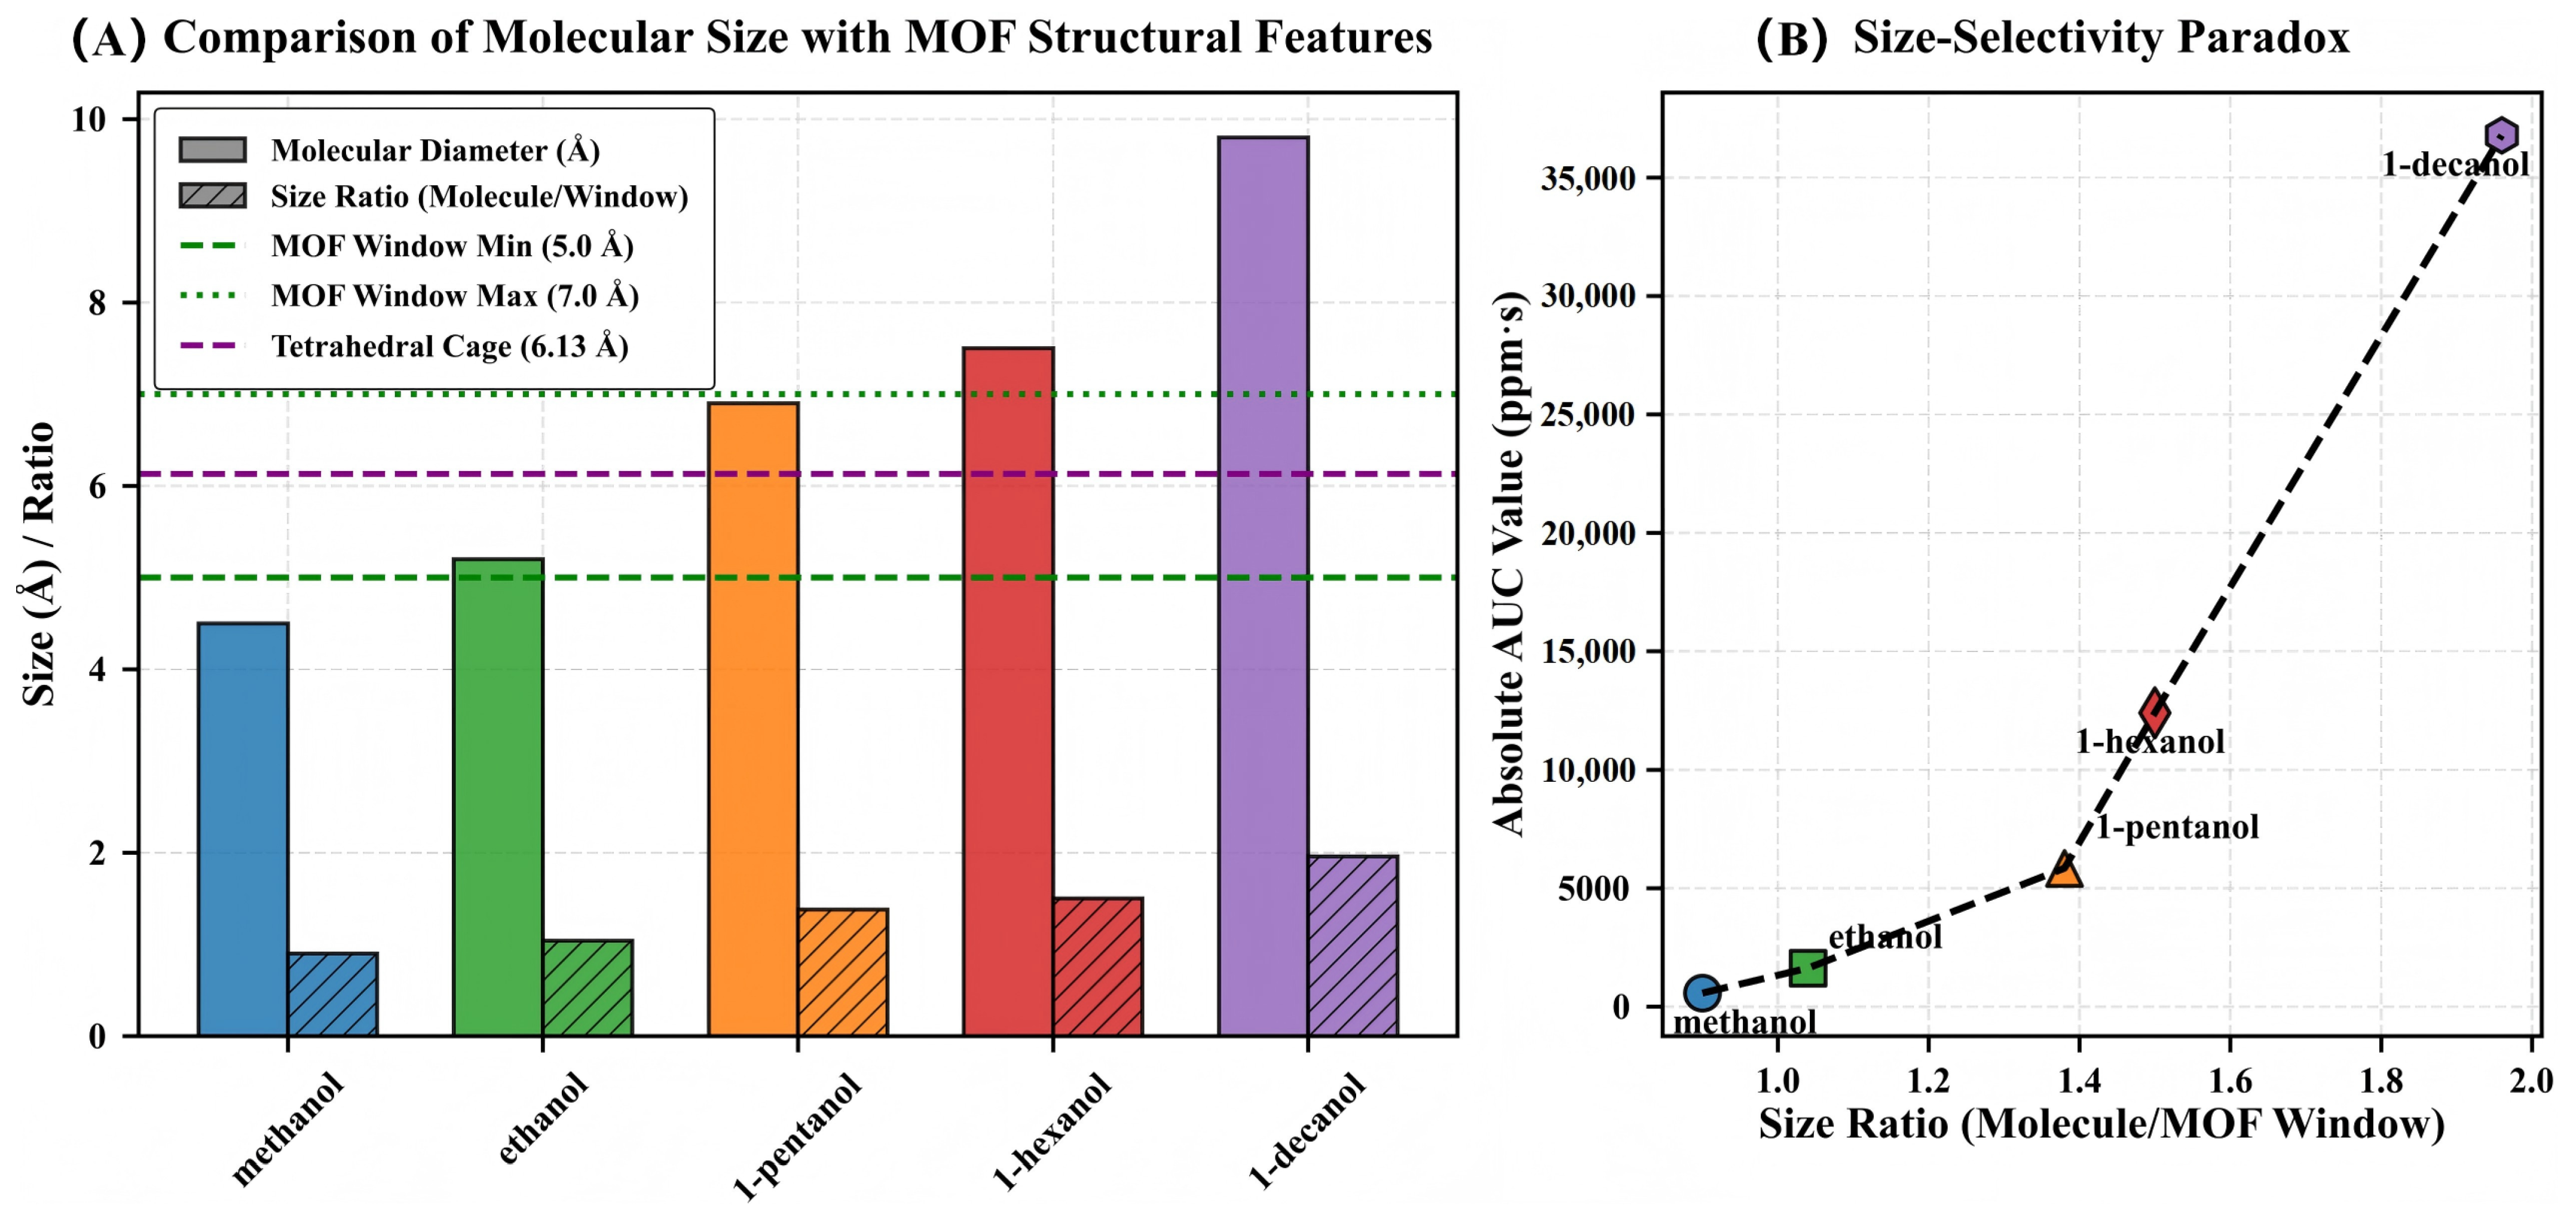
3.8. The Size-Selectivity Paradox

During a systematic study of the MOF-QCM sensing interface, we observed a response behavior that significantly deviates from classical molecular sieving theory. As shown in Figure 9A, the minimum pore window size of MIL-125-NH2 is 5.0 Å, significantly smaller than the molecular diameters of 1-pentanol (6.9 Å), 1-hexanol (7.5 Å), and 1-decanol (9.8 Å). According to the traditional model, this should result in a decrease in response. However, Figure 9B shows that the response integrals (AUC) of the five alcohols increase monotonically with molecular size, with 1-decanol reaching approximately 36,000 ppm·s, while methanol is only 650 ppm·s, a difference exceeding 55-fold, and the results exhibit good reproducibility. This trend indicates that the response mechanism of the MOF-QCM system transcends geometric sieving, forming a ‘size selectivity paradox’.
The causes of this paradox can be explained by multiple synergistic mechanisms. First, linear alcohol molecules have high conformational flexibility [17], enabling them to reduce their cross-sectional area through carbon chain twisting and pass through narrow channels in a ‘worm-like’ manner. Second, MIL-125-NH2 exhibits framework tunability, enabling external molecular interactions to induce lattice “breathing,” linker rotation, and local coordination distortion, temporarily expanding pore diameters by 0.3–1 Å [18] and alleviating diffusion barriers caused by size mismatch.
Third, longer carbon chain molecules can form stronger non-covalent interactions in pores or on surfaces, with adsorption enthalpy systematically increasing with molecular mass [19]. Taking 1-decanol as an example, its extended methylene chain structure enhances van der Waals, induced dipole, and CH– π interactions with MOFs, resulting in higher adsorption capacity and retention time, as evidenced by the increase in the AUC approximation index. Additionally, under diffusion-limited conditions, the contribution of adsorption on the outer surface cannot be ignored. MIL-125-NH2 crystals are disk-shaped, with a thickness of 10–20 nm and a diameter of 80–120 nm. Approximated as cylinders, their surface area to volume ratio (S/V) ranges from 1.3 × 10 8 to 2.5 × 10 8 m 1 , significantly higher than that of spherical particles of the same volume. This high S/V structure effectively enhances the adsorption contribution of grain boundaries, defects, and surface sites, particularly favoring the amplification of responses to large molecules [20,21].
Although the diffusion time constant τ a increases significantly with molecular size (approximately 262-fold from methanol to 1-decanol), the enhanced adsorption, conformational adaptation, and surface adsorption collectively offset the diffusion resistance, ultimately forming a nonlinear response pattern characterized by ‘slow diffusion–enhanced adsorption’. These results indicate that traditional size exclusion mechanisms exhibit significant limitations in MOF-QCM systems and require reinterpretation through a multi-factor coupled model involving conformational regulation, structural response, and surface/interface adsorption. This provides theoretical support for elucidating the recognition mechanisms of microporous materials and optimizing device performance.

3.9. Multi-Dimensional Mapping Framework

Based on the above, we present a multidimensional theoretical framework to explain the recognition at MOF sensor interfaces. This framework comprises four interrelated dimensions: structure, thermodynamics, kinetics, and function. The structural dimension deals with the geometric relationship between molecule size and MOF pores, such as pore size, channel geometry, and adaptability of molecular conformation, all of which influence whether molecules can enter or leave the framework. The thermodynamic dimension refers to non-covalent interactions between molecules and the framework, such as dispersion forces, hydrogen bonds, and π interactions. These elements combine to influence adsorption strength and binding stability. The kinetic dimension reflects the efficiency with which molecules diffuse within the framework, as well as time-dependent fluctuations in responses. Diffusion barriers, the flexibility of the scaffold, and the mass transfer behavior at the interfaces are important factors here. The functional dimension is the result of the interactions between the first three dimensions and correlates with experimentally quantifiable variables such as the response amplitude, the response time, and the area under the curve (AUC).
The dimensions are interdependent and influence each other to determine the final sensing result. For example, increasing the molecule size improves the diffusion resistance (structural and kinetic dimensions) while strengthening the adsorption contacts (thermodynamic dimension), resulting in slower response rates but higher signal intensity (functional dimension). The “size selection paradox” described in this experiment accurately reflects the nonlinear equilibrium between these variables. Unlike attempts to characterize complex behavior using a single variable, this method breaks down the sensor responses into several interacting physical processes. This technique not only deepens our understanding of the fundamental principles governing sensor phenomena, but also provides useful analytical tools for the development and selection of high-performance MOF sensors in the future.
This multidimensional paradigm effectively explains the seemingly contradicting experimental findings in our investigation. For example, the structural dimension explains the linear relationship between molecular diameter and adsorption time constant ( τ a ) found in Section 3.5, but the thermodynamic dimension accounts for the increasing response amplitude with molecular weight described in Section 3.6. The relationship between kinetic and thermodynamic dimensions explains why 1-decanol has a 55-fold larger AUC response than methanol, despite having a 262-fold higher τ a . This integrative perspective converts apparent discrepancies in experimental data into a coherent mechanistic understanding that might inform future sensor design.

4. Conclusions

By thoroughly elucidating the complex structure–response coupling mechanism that emerges when alcohol homologs interact with MOF on a QCM sensor system, this study reveals a quantitative correlation that challenges traditional molecular sieve theory. The exponential relationship between molecular mass and response amplitude highlights the compensatory relationship between molecular mass and molecular size. The linear correlation between molecular diameter and adsorption time constant ( τ a = 302.69 d 1510.41 , R 2 = 0.952 ) and the power-law decay of effective diffusion coefficients ( D eff d 5.96 , R 2 = 0.981 ) provide strong evidence for the activation diffusion mechanism. Considering coexisting factors, a multidimensional mechanism model incorporating molecular conformational flexibility, skeletal structural reactivity, cumulative non-covalent interactions, and multi-domain adsorption pathways resolves the ‘size selection paradox’—where larger molecules exhibit stronger responses despite significant diffusion limitations. This study thus fundamentally transforms our understanding of size-dependent adsorption on microporous sensor surfaces and transforms a seemingly contradictory phenomenon into an opportunity to enhance molecular resolution through strategic adjustments to the structure–performance relationship.

Author Contributions

Conceptualization, W.G. and X.M.; Methodology, W.G. and W.X.; Validation, W.G. and X.M.; Formal analysis, W.G. and W.X.; Investigation, W.G.; Resources, X.M.; Writing—original draft, W.G.; Writing—review & editing, X.M.; Supervision, X.M.; Project administration, X.M. All authors have read and agreed to the published version of the manuscript.

Funding

This work was financially supported by the National Natural Science Foundation of China (22272018, U24A20499, 22088102), Liaoning Binhai Laboratory (LBLD-2024-05), the National Key R&D Program of China (2022YFA0911904), the Fundamental Research Funds for the Central Universities of China (DUT23LAB611, DUT24RC(3)095) and the State Key Laboratory of Fine Chemicals, Dalian University of Technology (KF2401). The authors acknowledged the assistance of DUT Instrumental Analysis Center.

Institutional Review Board Statement

Not applicable.

Informed Consent Statement

Not applicable.

Data Availability Statement

The data presented in this study are available on request from the corresponding author.

Conflicts of Interest

The authors declare no conflicts of interest.

Abbreviations

The following abbreviations are used in this manuscript:
MOFMetal-Organic Framework
QCMQuartz Crystal Microbalance
VOCVolatile Organic Compound
AUCArea Under Curve
PXRDPowder X-Ray Diffraction
FTIRFourier-Transform Infrared Spectroscopy
SEMScanning Electron Microscopy
RMSERoot-Mean-Square Error

Appendix A

Figure A1. Surface profilometry analysis of the MIL-125-NH2 coating on QCM substrate. The Zeta optical profiler measurement reveals (A) uniform coating morphology across the sensor surface, (B) Optical image of the surface step profile, and (C) height profile showing a consistent film thickness of approximately 500 nm. Field of view: 165 μm × 124 μm, Z–Range: 8.6 μm, Step Size: 0.014 μm. The relatively uniform height distribution confirms the homogeneity of the drop-cast MOF layer essential for reproducible sensing performance.
Chemosensors 13 00269 g0a1

References

  1. Rath, R.J.; Farajikhah, S.; Oveissi, F.; Dehghani, F.; Naficy, S. Chemiresistive sensor arrays for gas/volatile organic compounds monitoring: A review. Adv. Eng. Mater. 2023, 25, 2200830. [Google Scholar] [CrossRef]
  2. Mazzatenta, A.; Pokorski, M.; Di Giulio, C. Volatile organic compounds (VOCs) in exhaled breath as a marker of hypoxia in multiple chemical sensitivity. Physiol. Rep. 2021, 9, e15034. [Google Scholar] [CrossRef] [PubMed]
  3. He, J.; Xu, J.; Yin, J.; Li, N.; Bu, X.H. Recent advances in luminescent metal-organic frameworks for chemical sensors. Sci. China Mater 2019, 62, 1655–1678. [Google Scholar] [CrossRef]
  4. Torad, N.L.; Zhang, S.; Amer, W.A.; Ayad, M.M.; Kim, M.; Kim, J.; Ding, B.; Zhang, X.; Kimura, T.; Yamauchi, Y. Advanced nanoporous material–based QCM devices: A new horizon of interfacial mass sensing technology. Adv. Mater. Interfaces 2019, 6, 1900849. [Google Scholar] [CrossRef]
  5. Vashist, S.K.; Vashist, P. Recent advances in quartz crystal microbalance-based sensors. J. Sensors 2011, 2011, 571405. [Google Scholar] [CrossRef]
  6. Wales, D.J.; Grand, J.; Ting, V.P.; Burke, R.D.; Edler, K.J.; Bowen, C.R.; Mintova, S.; Burrows, A.D. Gas sensing using porous materials for automotive applications. Chem. Soc. Rev. 2015, 44, 4290–4321. [Google Scholar] [CrossRef] [PubMed]
  7. Knebel, A.; Caro, J. Metal–organic frameworks and covalent organic frameworks as disruptive membrane materials for energy-efficient gas separation. Nat. Nanotechnol. 2022, 17, 911–923. [Google Scholar] [CrossRef] [PubMed]
  8. Zhao, X.; Wang, Y.; Li, D.S.; Bu, X.; Feng, P. Metal–organic frameworks for separation. Adv. Mater. 2018, 30, 1705189. [Google Scholar] [CrossRef] [PubMed]
  9. Carraro, F.; Velásquez-Hernández, M.d.J.; Linares Moreau, M.; Astria, E.; Sumby, C.; Doonan, C.; Falcaro, P. MOFs and biomacromolecules for Biomedical Applications. In Metal-Organic Frameworks in Biomedical and Environmental Field; Springer: Berlin/Heidelberg, Germany, 2021; pp. 379–432. [Google Scholar]
  10. Luo, X.; Li, W.; Yuan, L.; Xie, G.; Su, Y. Self-powered infrared detector enabled by interfacial anchoring and thermal reinforcement. Nano Trends 2024, 8, 100061. [Google Scholar] [CrossRef]
  11. Kertik, A.; Wee, L.H.; Sentosun, K.; Navarro, J.A.; Bals, S.; Martens, J.A.; Vankelecom, I.F. High-performance CO2-selective hybrid membranes by exploiting MOF-breathing effects. ACS Appl. Mater. Interfaces 2019, 12, 2952–2961. [Google Scholar] [CrossRef] [PubMed]
  12. Peng, H.H.; Shi, W.J.; Ma, J.Q.; Zhang, Y.X.; Hou, L.; Wang, Y.Y. One Ni-MOF with gate-opening behavior for unprecedented separation of C2H2 from C2 hydrocarbons. Sep. Purif. Technol. 2024, 335, 126191. [Google Scholar] [CrossRef]
  13. Cai, H.; Huang, Y.L.; Li, D. Biological metal–organic frameworks: Structures, host–guest chemistry and bio-applications. Coord. Chem. Rev. 2019, 378, 207–221. [Google Scholar] [CrossRef]
  14. Okur, S.; Hashem, T.; Bogdanova, E.; Hodapp, P.; Heinke, L.; Bräse, S.; Wöll, C. Optimized detection of volatile organic compounds utilizing durable and selective arrays of tailored UiO-66-X SURMOF sensors. ACS Sensors 2024, 9, 622–630. [Google Scholar] [CrossRef] [PubMed]
  15. Haghighi, E.; Zeinali, S. Nanoporous MIL-101 (Cr) as a sensing layer coated on a quartz crystal microbalance (QCM) nanosensor to detect volatile organic compounds (VOCs). RSC Adv. 2019, 9, 24460–24470. [Google Scholar] [CrossRef] [PubMed]
  16. Vilela, S.M.F.; Salcedo-Abraira, P.; Colinet, I.; Salles, F.; De Koning, M.C.; Joosen, M.J.A.; Serre, C.; Horcajada, P. Nanometric MIL-125-NH2 Metal–Organic Framework as a Potential Nerve Agent Antidote Carrier. Nanomaterials 2017, 7, 321. [Google Scholar] [CrossRef] [PubMed]
  17. Maity, T.; Sarkar, S.; Kundu, S.; Panda, S.; Sarkar, A.; Hammad, R.; Mandal, K.; Ghosh, S.; Mondal, J.; Haldar, R. Steering diffusion selectivity of chemical isomers within aligned nanochannels of metal-organic framework thin film. Nat. Commun. 2024, 15, 9636. [Google Scholar] [CrossRef] [PubMed]
  18. Alhamami, M.; Doan, H.; Cheng, C.H. A review on breathing behaviors of metal-organic-frameworks (MOFs) for gas adsorption. Materials 2014, 7, 3198–3250. [Google Scholar] [CrossRef] [PubMed]
  19. Madero-Castro, R.M.; Vicent-Luna, J.M.; Peng, X.; Calero, S. Adsorption of linear alcohols in amorphous activated carbons: Implications for energy storage applications. ACS Sustain. Chem. Eng. 2022, 10, 6509–6520. [Google Scholar] [CrossRef]
  20. Guo, F.; Yang, M.; Li, R.X.; He, Z.Z.; Wang, Y.; Sun, W.Y. Nanosheet-engineered NH2-MIL-125 with highly active facets for enhanced solar CO2 reduction. ACS Catal. 2022, 12, 9486–9493. [Google Scholar] [CrossRef]
  21. Sun, Y.; Yan, J.; Wu, M.; Jiang, J.; Liu, Y. NH2-MIL-125 Nanosheets Prepared via Crystallization Kinetics Modulation for Ultrathin Membrane Fabrication. Chem Bio Eng. 2024, 1, 855–862. [Google Scholar] [CrossRef] [PubMed]
Figure 1. Schematic illustration of MIL-125-NH2-based QCM sensing system for alcohol detection. (A) Structure of MIL-125-NH2 and molecular size comparison of various alcohols with the pore apertures, highlighting size-selective adsorption. The framework’s tetrahedral (6.13 Å) and octahedral (12.5 Å) cages are interconnected through apertures ranging from 5.0 to 7.0 Å [16], creating a hierarchical porous architecture that interacts differentially with alcohol molecules of varying dimensions. (B) Experimental setup including gas flow control, vapor generation, QCM chamber, and data acquisition. The integrated system enables precise control of analyte concentration, temperature, and flow conditions while providing real-time monitoring of mass-induced frequency shifts. (C) Cross-section of the QCM sensor showing MOF crystallites coated on the quartz crystal surface. (D) Standard QCM sensing cycle illustrating baseline stabilization, exposure (adsorption), and recovery phases.
Chemosensors 13 00269 g001
Figure 2. Comprehensive characterization of MIL-125-NH2: (A) Powder X-ray diffraction pattern showing primary crystallographic reflections with Miller indices labeled; (B) FTIR spectrum highlighting key functional group vibrations; (C) Nitrogen adsorption–desorption isotherm measured at 77 K demonstrating microporous character with high surface area; (D) SEM image revealing disc-like crystallite morphology.
Chemosensors 13 00269 g002
Figure 3. Adsorption profiles of primary alcohol homologs on MIL-125-NH2 QCM sensors at 1000 ppb, represented as normalized frequency shift versus logarithmic time. Each curve (differentiated by color) depicts an independent adsorption process initiating at the rightmost point (t ≈ 0.1 s) and progressing leftward as equilibrium is approached. Experimental data (symbols) show excellent agreement with the enhanced adsorption model (solid lines, R 2 > 0.995 ). The systematic progression of adsorption time constants ( τ a ) with molecular size is clearly evident: methanol (5.9 s), ethanol (16.4 s), 1-pentanol (367.4 s), 1-hexanol (764.4 s), and 1-decanol (1554.99 s). Concurrently, equilibrium frequency shifts increase from –2.17 ppm (methanol) to –19.56 ppm (1-decanol), demonstrating enhanced mass loading despite increasing diffusion limitations.
Chemosensors 13 00269 g003
Figure 4. Concentration-dependent calibration curves for the five alcohol homologs. (A) Area under curve (AUC) versus relative concentration, showing strong negative linear correlations with molecular-weight-dependent sensitivity gradients ( R 2 values: methanol 0.946, ethanol 0.854, 1-pentanol 0.986, 1-hexanol 0.927, 1-decanol 0.915). (B) Normalized frequency shift ( Δ f ) versus relative concentration, demonstrating similar molecular-weight-dependent enhancement ( R 2 values: methanol 0.782, ethanol 0.834, 1-pentanol 0.871, 1-hexanol 0.932, 1-decanol 0.868). (C) Response time ( t 90 ) versus relative concentration on logarithmic scale, revealing distinct kinetic domains for small versus large alcohols ( R 2 values: methanol 0.522, ethanol 0.768, 1-pentanol 0.549, 1-hexanol 0.761, 1-decanol 0.858). (D) Adsorption time constant ( τ a ) versus relative concentration, displaying identical grouping patterns and similar concentration dependencies as t 90 . Dashed lines indicate linear regression fits.
Chemosensors 13 00269 g004
Figure 5. Relationship between molecular weight and integrated response (AUC) for the five alcohol homologs at their highest test concentrations. The strong correlation ( R 2 = 0.891 ) demonstrates the systematic enhancement of sensing response with increasing molecular weight. AUC values are expressed in ppm·s.
Chemosensors 13 00269 g005
Figure 6. Relationship between static molecular diameter and adsorption time constant ( τ a ) for the five alcohol homologs. Linear regression analysis yields τ a = 302.69 d 1510.41 ( R 2 = 0.952 , p = 0.0045 ), where d represents molecular diameter in Å and τ a is expressed in seconds.
Chemosensors 13 00269 g006
Figure 7. Homologous series trends showing the effect of carbon chain length on various QCM response parameters: (A) Absolute AUC value (ppm·s), (B) absolute frequency shift (ppm), (C) adsorption time constant (s), and (D) spike time constant (s). All parameters show systematic trends with increasing molecular size, with response magnitudes and time constants displaying approximately exponential relationships with chain length. Note the logarithmic scale on the y-axes, highlighting the wide range of values across the homologous series.
Chemosensors 13 00269 g007
Figure 8. Effective diffusion analysis for alcohol homologs in MIL-125-NH2. (A) Effective diffusion coefficient ( D eff ) versus molecular diameter, demonstrating a power-law relationship D eff = D 0 d 5.96 with exceptional correlation ( R 2 = 0.981 ). The values span from 4.2 × 10 10 c m 2 /s for methanol to 1.6 × 10 12 c m 2 /s for 1-decanol, decreasing by more than two orders of magnitude. (B) Diffusion hindrance ratio ( D eff / D gas ) versus molecular diameter, following a log-linear relationship D eff / D gas = 10 2.68 0.41 d with R 2 = 0.985 , indicating approximately one order of magnitude reduction in relative diffusivity for each 2.4 Å increase in molecular diameter.
Chemosensors 13 00269 g008
Figure 9. Visualization of the size-selectivity paradox in MIL-125-NH2. (A) Comparison of molecular diameters with framework structural features. Solid bars represent molecular diameters; hatched bars show size ratios relative to the minimum window aperture (5.0 Å). Horizontal lines indicate critical framework dimensions: minimum window (5.0 Å, green dashed), maximum window (7.0 Å, green dotted), and tetrahedral cage (6.13 Å, purple dashed). (B) Relationship between size ratio (molecular diameter/minimum window) and absolute AUC response. Despite size ratios exceeding 1.0 (indicating molecular dimensions larger than the framework aperture), sensing response increases exponentially with molecular size.
Chemosensors 13 00269 g009
Table 1. Comparison of MOF-based QCM sensors for VOC detection.
MOF TypeTarget VOCsSensitivity (Hz·pp m 1 )Response Time (s)LOD (ppm)Reference
UiO-66-NH2H2O, MeOH, EtOH, IPA,0.0007–0.0169<60∼10Okur et al.,
SURMOFn-Hex, Tol, p-Xylene 2024 [14]
MIL-101 (Cr)MeOH, EtOH, IPA,up to 2.793<1201.6–3.1Haghighi et al.,
Acetone, DCM, Pyridine(pyridine) 2019 [15]
MIL-125-NH2MeOH, EtOH, 1-Pentanol, 1-Hexanol, 1-Decanol0.06–0.4355–15500.026–0.19This work
Table 2. Physicochemical properties of the primary alcohol homologs employed in this study.
AnalyteMolecular Weight (g/mol)Carbon Chain LengthStatic Diameter (Å)Vapor Pressure at 25 °C (kPa)Dipole Moment (D)
Methanol32.0414.513.021.70
Ethanol46.0725.25.951.69
1-Pentanol88.1556.90.251.70
1-Hexanol102.1767.50.091.55
1-Decanol158.28109.80.00091.50
Disclaimer/Publisher’s Note: The statements, opinions and data contained in all publications are solely those of the individual author(s) and contributor(s) and not of MDPI and/or the editor(s). MDPI and/or the editor(s) disclaim responsibility for any injury to people or property resulting from any ideas, methods, instructions or products referred to in the content.

