Article

The Construction of Carbazole-Based Metal–Organic Frameworks as Fluorescent Probes for Picric Acid Detection

State Key Laboratory of Fine Chemicals, Dalian University of Technology, Dalian 116024, China
*
Author to whom correspondence should be addressed.
Chemosensors 2025, 13(3), 105; https://doi.org/10.3390/chemosensors13030105
Submission received: 7 February 2025 / Revised: 7 March 2025 / Accepted: 11 March 2025 / Published: 13 March 2025

Abstract

:
Nitroaromatic-explosives (NEs) not only threaten global security but are also recognized as a highly toxic pollutant. Metal–organic framework Zn-Ms (Zn-M1, Zn-M2) were synthesized in this study via the coordination-driven self-assembly of Zn ions and a carbazole-based ligand L containing an aldehyde group. They inherited the excellent fluorescence performance of ligand L and could work as a fluorescent sensor for detecting picric acid (PA) at low concentrations. Zn-Ms showed an emission at 450 nm and exhibited a higher fluorescence quenching efficiency toward PA than other related NEs. The results suggest that the fluorescent response might be attributed to the inner filter effect (IFE); Förster resonance energy transfer (FRET); and possibly, photo-induced electron transfer (PET). In addition, the critical role of the aldehyde group as a recognition site was corroborated using a post-modification strategy.

Graphical Abstract

1. Introduction

Nitroaromatic explosives (NEs), such as 2, 4, 6-trinitrophenol (picric acid, PA), 4-nitrotoluene (4-NT), and nitrobenzene (NB), which are aromatic compounds with nitro groups (-NO2), not only threaten global security but are also recognized as highly toxic pollutants. When released into the environment, they cause serious contamination of soil and water, and further harm human health. For instance, PA, an explosive with a potency comparable with that of TNT, is associated with various health issues, including respiratory damage, nausea, skin irritation, and allergic reactions. Moreover, picric acid is widely used in dyes, pharmaceuticals, chemical laboratories, and fireworks, making it a serious hazard to human health and safety [1,2,3,4,5,6]. Consequently, the development of sensitive methods for detecting such compounds is highly desired. Among various methods, fluorescence probing is thought to be the most effective tool for the detection of NEs owing to its high sensitivity and specificity, rapid response, and easy visualization during detection [7,8,9,10].
Metal–organic frameworks (MOFs) represent a promising platform for the design of functional materials by integrating highly versatile organic synthetic methodologies and well-established strategies for the synthesis of crystalline organic–inorganic hybrid solids. They have been studied for various applications, such as gas adsorption, separation, catalysis, energy storage, sensing, and drug delivery [11,12,13,14,15,16,17,18,19,20]. In the past decade, luminescent metal–organic frameworks (LMOFs) have attracted significant attention as luminescent sensors due to their unique properties, such as emission tunability, high permanent porosity, and the possibility of constructing LMOFs with selective responsiveness to specific analytes [21,22,23,24]. Besides the introduction of photosensitive functional groups as building blocks [25], the key issue of designing sensitive MOF probes also includes the formation of host-guest interactions with the targets by tuning the multiple weak interactions of MOFs, such as hydrogen bonding, pi-stacking, and the hydrophilic/lipophilic interactions, toward the targets [26,27,28,29,30,31].
To obtain luminescent MOFs for the selective and sensitive detection of nitroaromatic compounds, herein, metal–organic frameworks Zn-Ms containing carbazole-based ligands with aldehyde groups were synthesized through coordination-driven self-assembly. The preferred carbazole ligand and its derivatives are a kind of important electron-rich dye compound with a large steric rigid plane. Their excellent photoelectric properties allow carbazole-based probes to be successfully used for detecting electron acceptors including picric acid [32,33]. The aldehyde group is introduced as a potential hydrogen bonding site to improve the interaction with its targets [34]. The good fluorescence of MOFs makes them useful as a fluorescent sensor for detecting picric acid (PA) in low concentrations. Zn-Ms showed a strong emission at 450 nm and exhibited a higher fluorescence quenching efficiency toward PA than other related NEs. The results suggest that the inner filter effect (IFE); Förster resonance energy transfer (FRET); and, possibly, photo-induced electron transfer (PET) play important roles in Zn-Ms identifying PA. In addition, the critical role of the aldehyde group as a recognition site was corroborated using a post-modification strategy [35].

2. Materials and Methods

2.1. Starting Materials, Synthetic Procedures, and Measurements

All materials, equipment, and measurements required in this work are mentioned in the Supporting Information.

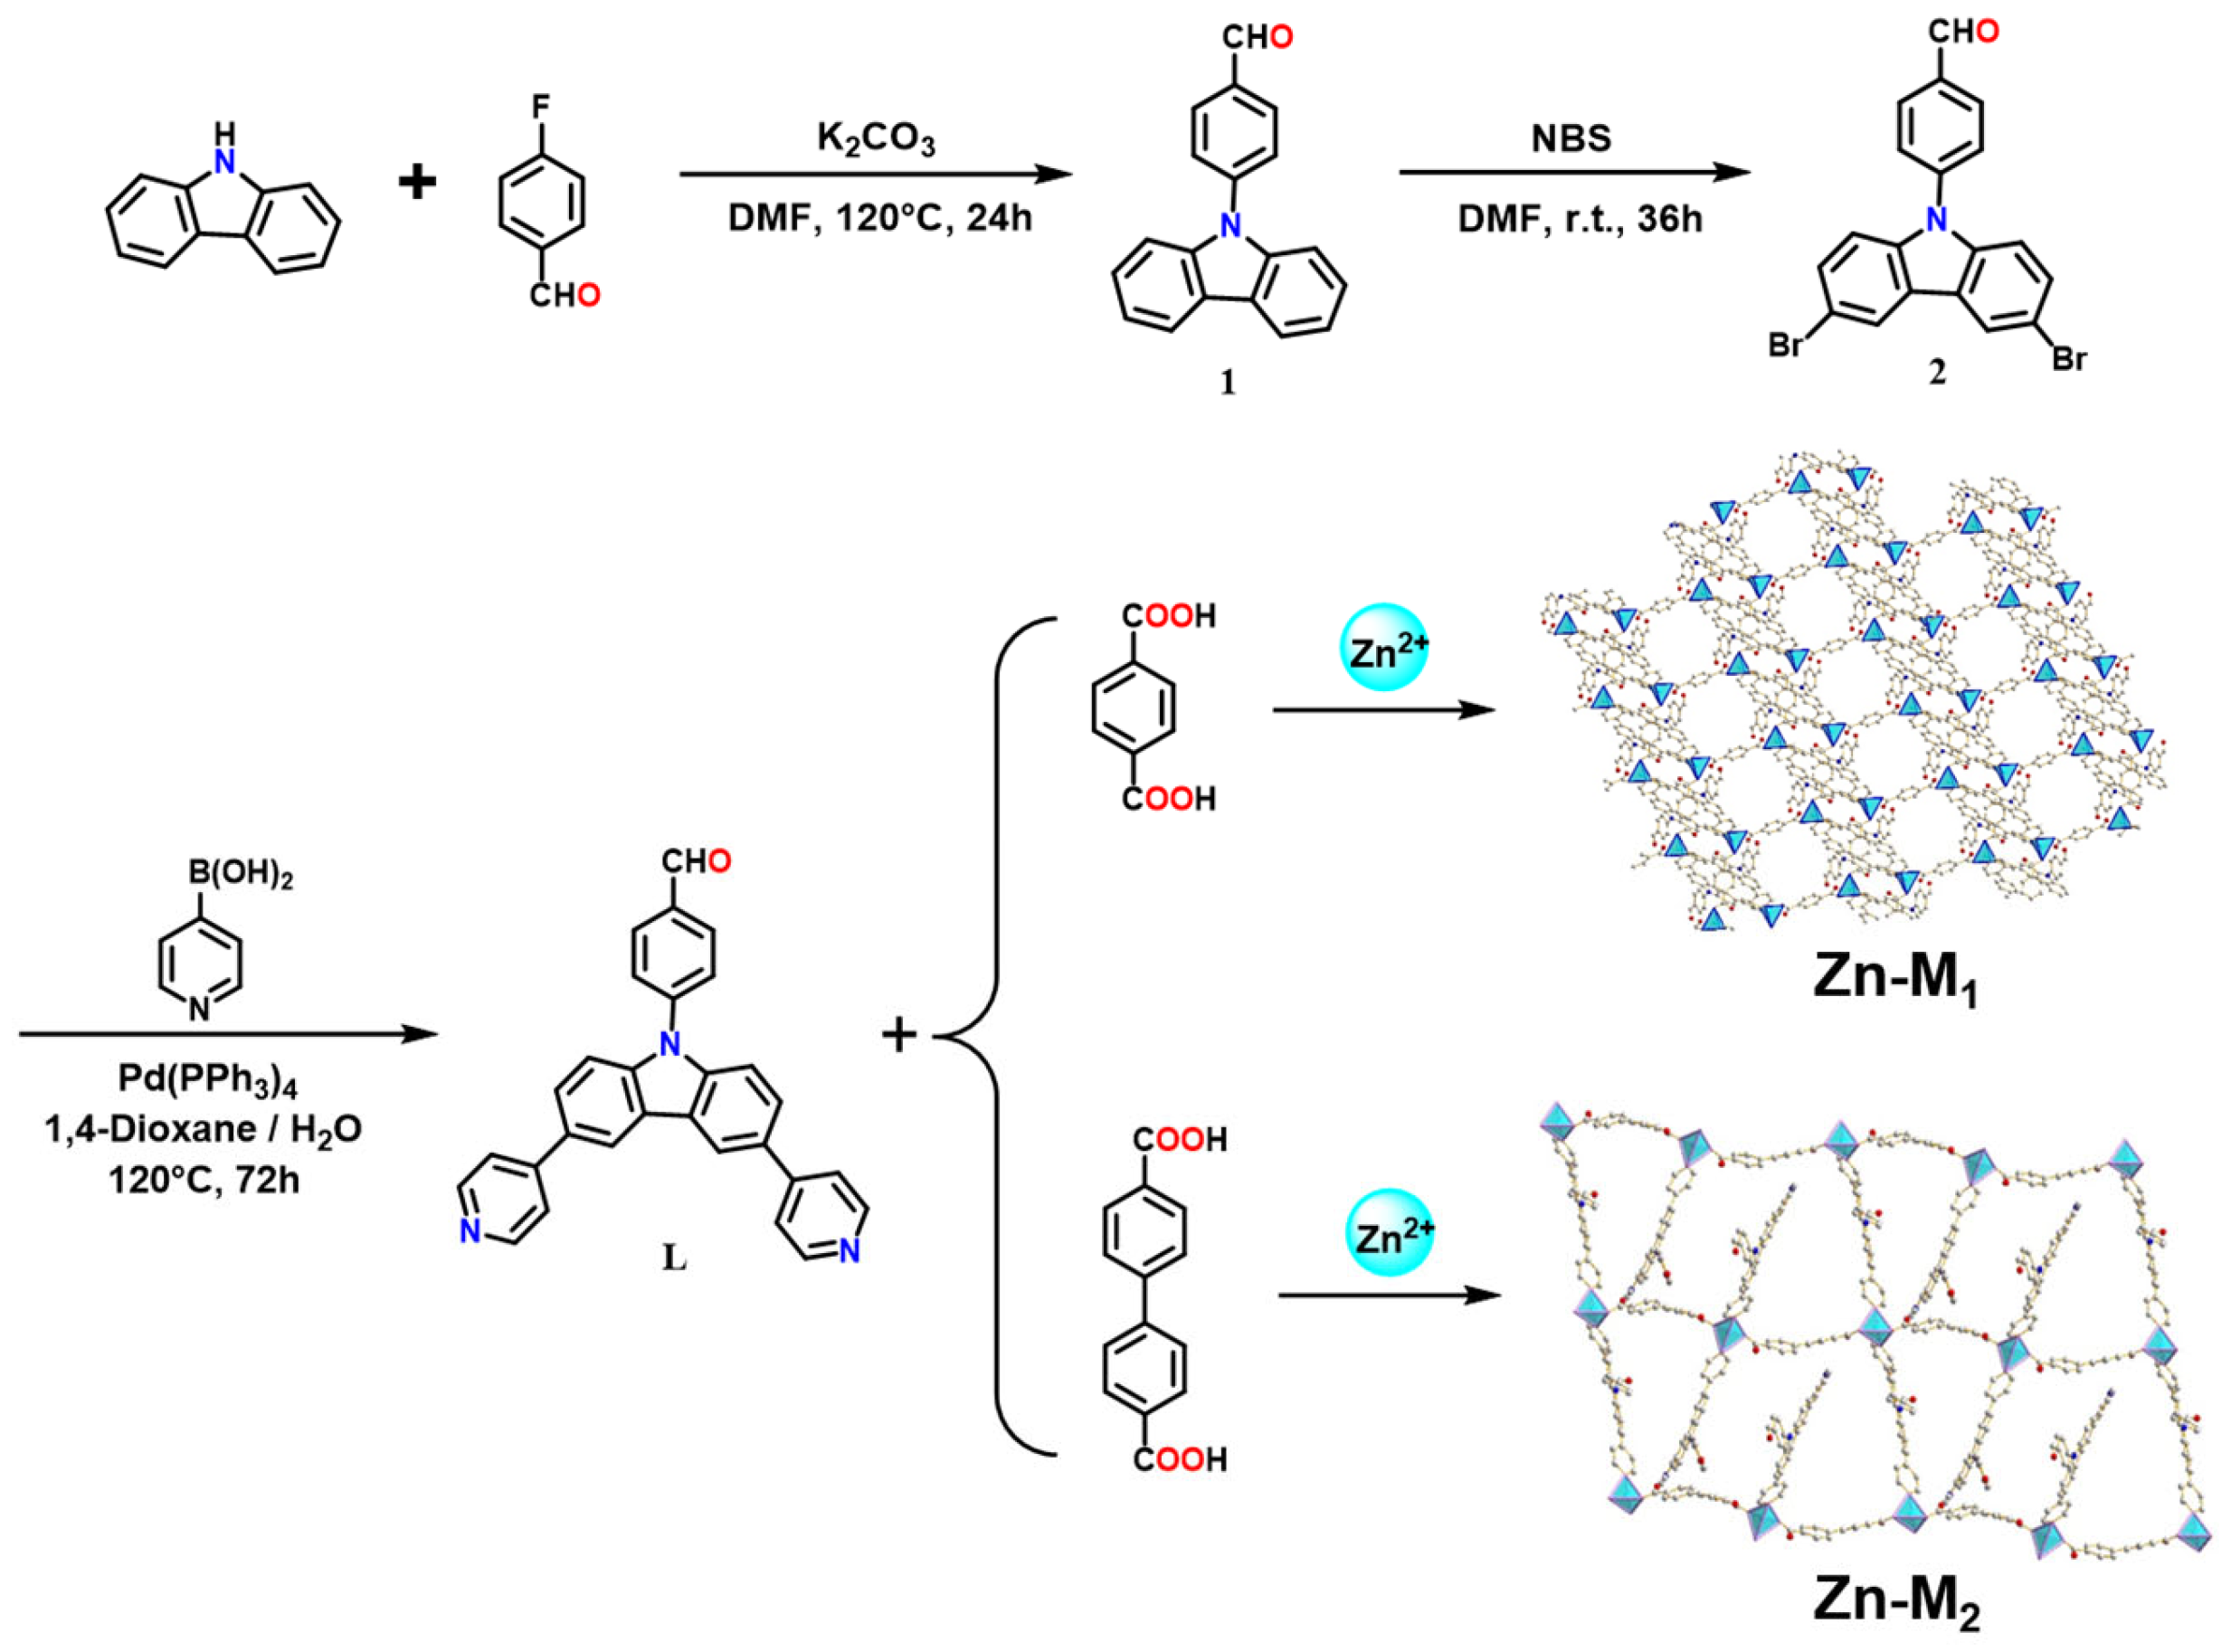
2.1.1. Synthesis of 4-(9H-Carbazol-9-yl) Benzaldehyde (1)

A mixture of 4-fluorobenzaldehyde (5.0 mL, 46.6 mmol), carbazole (6.27 g, 37.5 mmol), potassium carbonate (14.6 g, 105 mmol) and 140 mL of DMF was heated in an oil bath at 120 °C under an argon atmosphere for 19 h. Upon completion of the reaction, the reaction mixture was allowed to cool to ambient temperature, followed by solvent evaporation under reduced pressure. The resulting residue was then treated with ethyl acetate (300 mL) and subjected to sequential aqueous extraction with distilled water (8 × 250 mL) and saturated brine solution (2 × 250 mL). The organic phase was subsequently dried over anhydrous Na2SO4, filtered, and concentrated in vacuo. The obtained pale yellow oil was further purified via silica gel column chromatography (PE:DCM = 3:1), yielding the desired product as a white crystalline solid: (4.4 g, yield: 43.43%) 1H NMR (400 MHz, DMSO-d6) δ 10.13 (s, 1H, -CHO), 8.27 (d, J = 7.72 Hz, 2H), 8.21 (d, J = 8.44 Hz, 2H), 7.91 (d, J = 8.44 Hz, 2H), 7.53 (d, J = 8.32 Hz, 2H), 7.47 (m, 2H), 7.34 (t, J = 7.72, 2H) (Figure S1).

2.1.2. Synthesis of 4-(3,6-Dibromo-9H-Carbazol-9-yl) Benzaldehyde (2)

4-(9H-carbazol-9-yl) benzaldehyde (5.7 g, 21 mmol) was added to DMF (80 mL) in an ice-water bath while stirring. NBS (11 g, 62 mmol) was dissolved in 20 mL of DMF. Then, the solution was mixed using a constant pressure dropping funnel and stirred at room temperature away from light for 36 h. The resulting mixture was poured into 500 mL of ice water, filtered under reduced pressure and washed with water three times. The precipitate was recrystallized from a mixture of toluene and hexane to afford 4-(3,6-dibromo-9H-carbazol-9-yl) benzaldehyde as a white solid: (7.62 g, yield: 84.6%) 1H NMR (400 MHz, CDCl3) δ 10.15 (s, 1H), 8.61 (d, J = 4.2 Hz, 2H), 8.21 (d, J = 8.1 Hz, 2H), 7.90 (d, J = 8.3 Hz, 2H), 7.63 (dd, J = 8.9, 2.1 Hz, 2H), 7.47 (d, J = 8.6Hz, 2H) (Figure S2).

2.1.3. Synthesis of 4-(3,6-Dipyridyl-9H-Carbazol-9-yl) Benzaldehyde (L)

4-(3,6-Dibromo-9H-carbazol-9-yl) benzaldehyde (399 mg, 0.93 mmol) and pyridin-4-ylboronic acid (275 mg, 2.23 mmol) were dissolved in 30 mL of 1,4-dioxane and 10 mL of 2 mol/L K2CO3 solution. The reaction mixture was thoroughly degassed via argon purging for 20 min prior to the addition of Pd(PPh₃)₄ (50.8 mg, 0.04 mmol). The catalytic system was then maintained under reflux conditions for 72 h. Upon completion, the reaction was cooled to ambient temperature and quenched with deionized water (20 mL). The aqueous layer was extracted with dichloromethane (3 × 30 mL), and the combined organic extracts were dried over an anhydrous sodium sulfate. After solvent removal under reduced pressure, the crude product was subjected to column chromatographic purification (DCM: EA = 3:1, v/v) as the eluent, affording compound L as a pure product: (223 mg, yield: 56.4%) 1H NMR (400 MHz, DMSO-d6) δ 10.17 (s, 1H), 8.99 (s, 2H), 8.68 (d, J = 6.3 Hz, 4H), 8.26 (d, J = 8.7 Hz, 2H), 7.99 (d, J = 8.4 Hz, 4H), 7.89 (d, J = 5.8 Hz, 4H), 7.66(d, J = 9.0 Hz, 2H) (Figure S3, Scheme 1).

2.2. Synthesis of Zn-M1 and Zn-M2

Zn-M1 was synthesized via the one-pot solvothermal method. Zn(NO3)2·6H2O (14.9 mg, 0.05 mmol), L (10.6 mg, 0.025 mmol), PTA (terephthalic acid, 8.3 mg, 0.05 mmol), DMF (3.0 mL) and water (1.0 mL) were added to a 8 mL stainless steel Teflon-lined reactor. The mixture was then heated at 100 °C for 48 h. After natural cooling to room temperature, pale-yellow crystals were obtained, washed three times with methanol, and then dried overnight at 80 °C (yield: 78%, based on Zn2+).
The synthesis of Zn-M2 followed the same procedure as described above, with PTA replaced by BPA ([1,1′-Biphenyl]-4,4′-dicarboxylic acid) (yield: 56%, based on Zn2+).

2.3. Synthesis of Zn-M1-PSM

Zn-M1 (10 mg) was dispersed in a 5 mL methanol solution of cyclohexylamine (28 mg) via sonication for 2 min. The mixture was stirred at 70 °C for 24 h. After cooling to room temperature, the mixture was washed with methanol until the supernatant became colorless. The product was then vacuum-dried overnight.

2.4. Zn-Ms Responses to Different NEs

Caution: Since NEs are highly explosive, all of the analytes were treated with caution in small amounts.

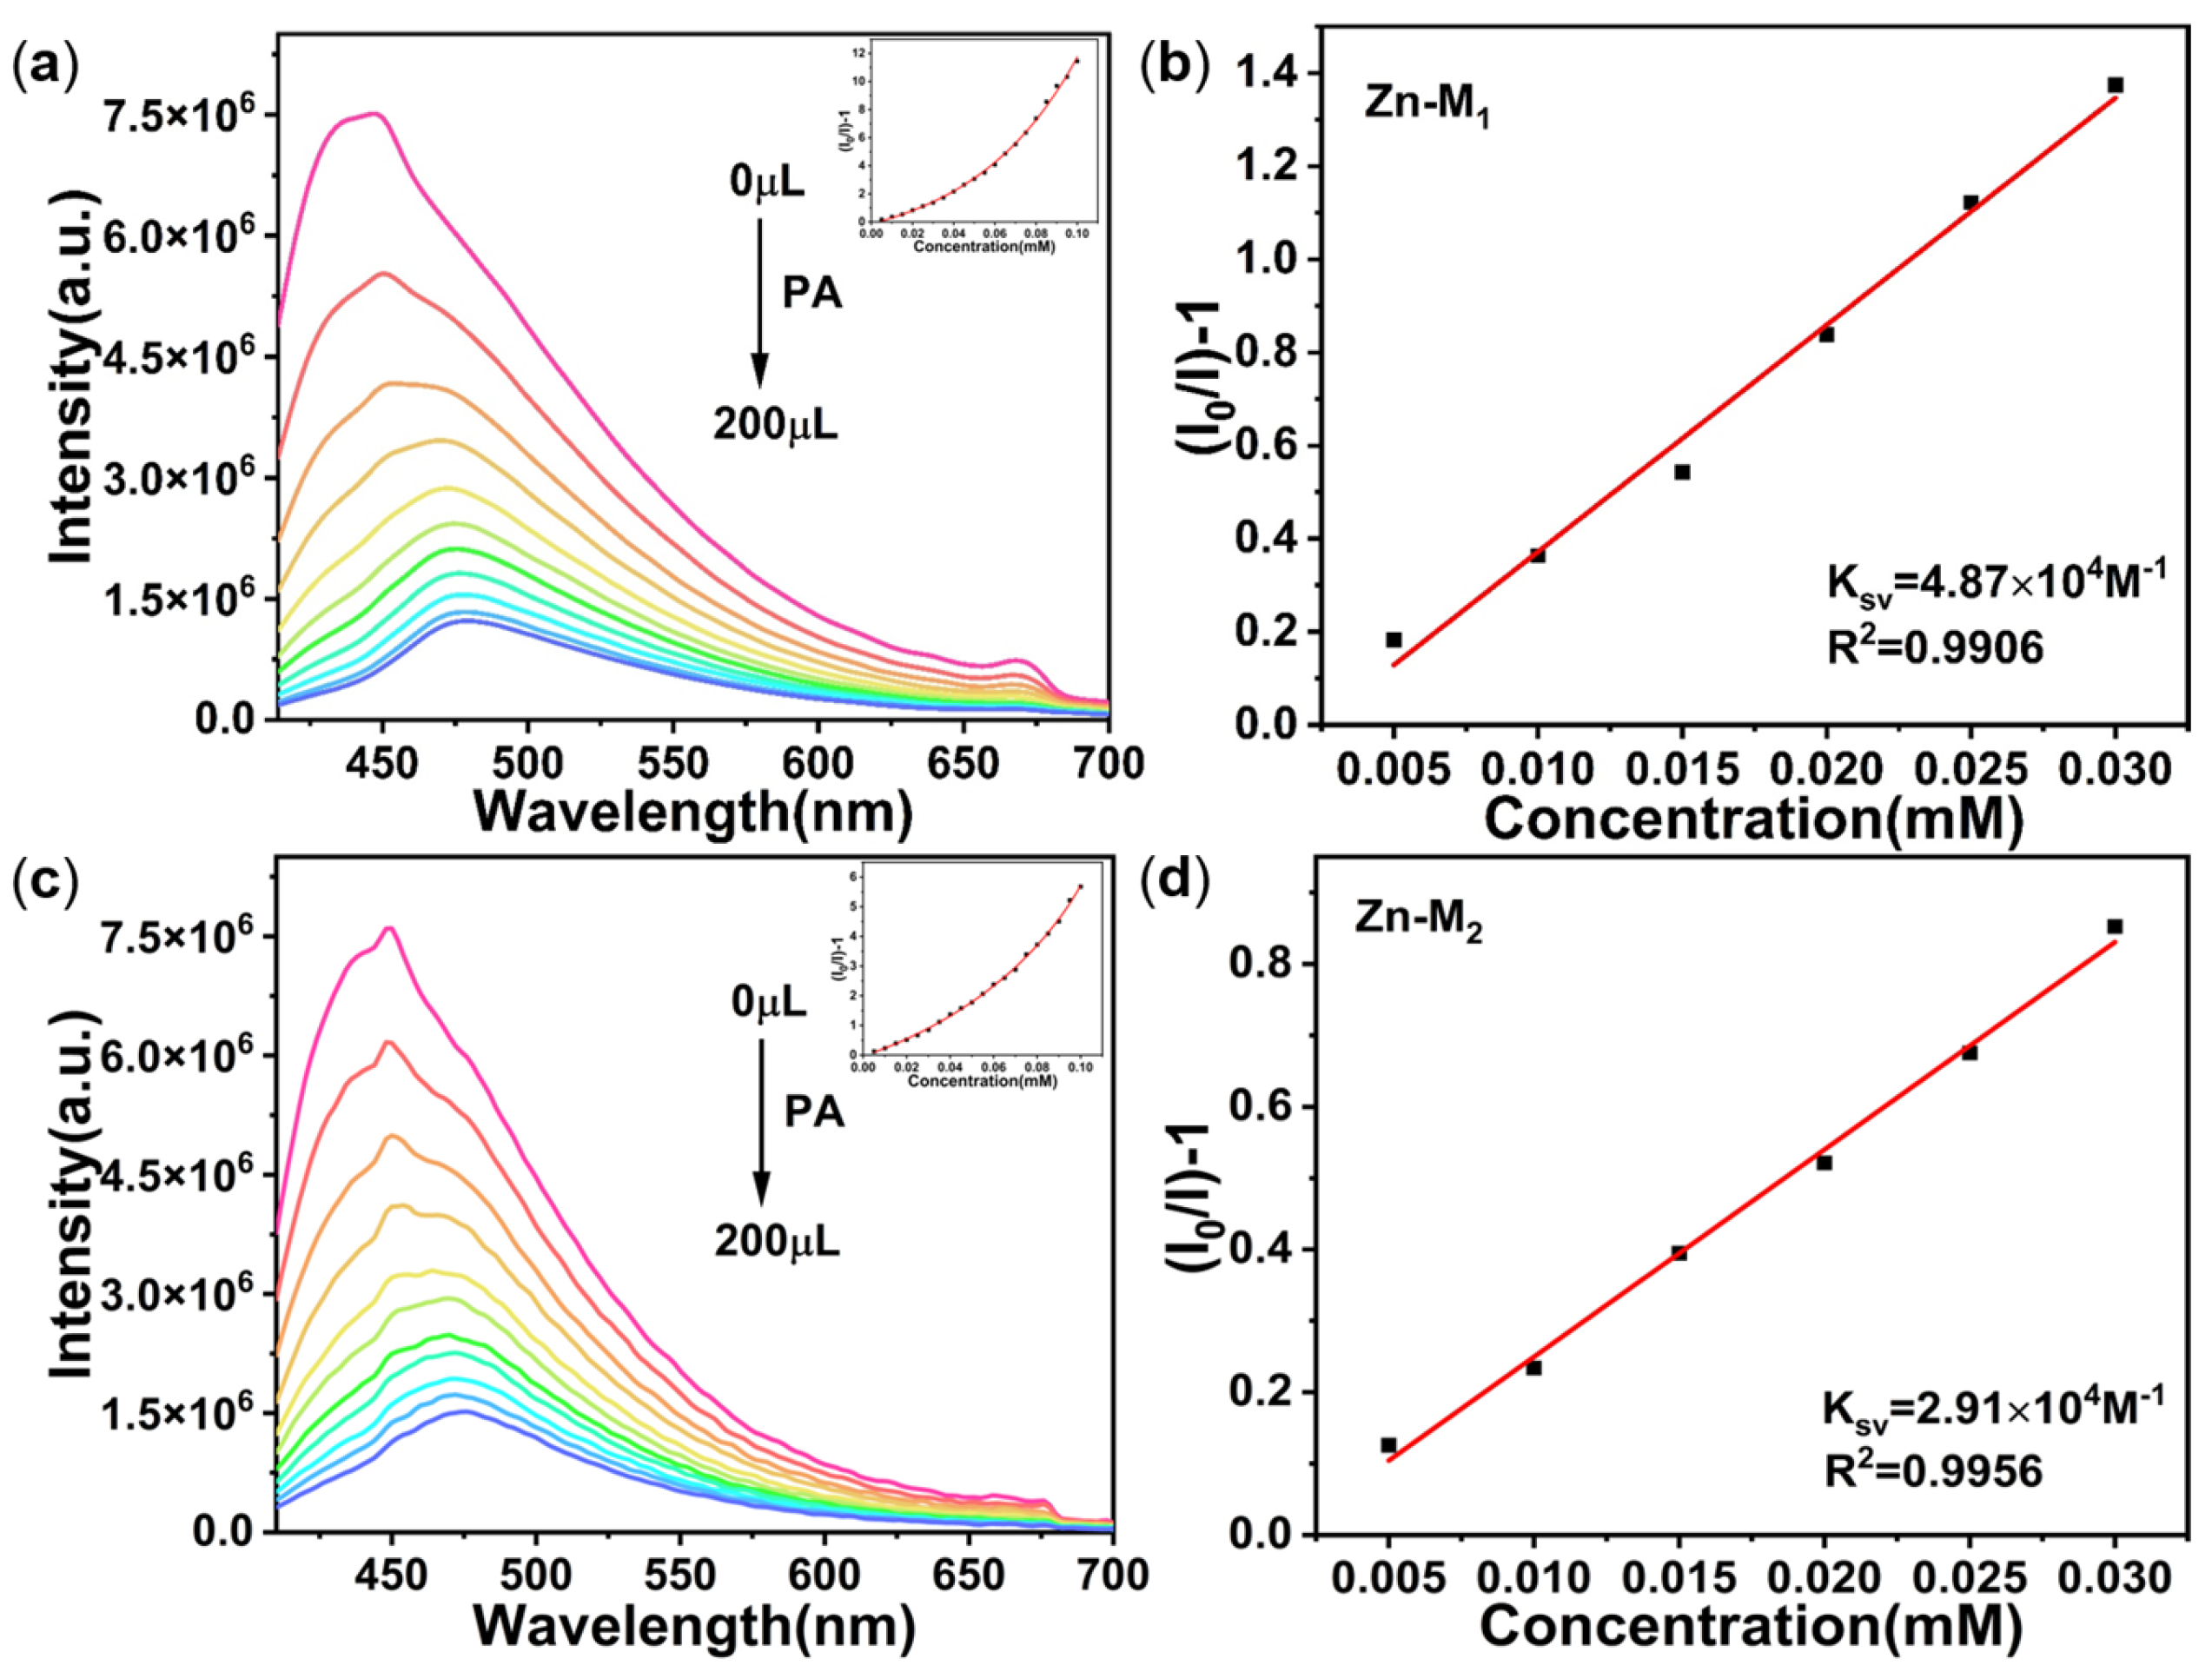
2.4.1. Fluorescence Turn-Off Sensing of PA

The standard suspension was prepared by adding 2 mg of finely ground sample of Zn-Ms in 2 mL of DMF ([C] = 1 mg/mL) and treated via the ultrasonication for about 30 min. The NEs (picric acid (PA), 3-nitrophenol (3-NP), 4-nitrophenol (4-NP), 2,4-dinitrotoluene (2,4-DNT), 2nitrotoluene (2-NT), 4-nitrotoluene (4-NT) and 1,3-dinitrobezene (1,3-DNB)) were prepared as a 1 mM solution in DMF.
For the luminescent titration experiments, 2 mL of a suspension (1 mg/mL) of Zn-Ms was added to a cuvette, with the gradual addition of aliquots of the NE DMF solutions (20 μL per drop). Then, the luminescence spectra of the suspensions were recorded.
The Ksv values were calculated using (I/I0) − 1 = Ksv [C], where I0 and I are the fluorescence intensities of Zn-Ms in DMF before and after the addition of analytes and C represents the concentration of analytes. The LOD was calculated as LOD = 3σ/Ksv (where σ is the standard deviation of ten measured I0 values of the blank solution). After each cycle, Zn-Ms was washed with ethanol and activated at 80 °C for 6 h for recovery.

2.4.2. Selective Detection Experiment

A DMF solution with 1 mM of PA was prepared as the test solution, and DMF solutions with 5 mM of other analytes (2-NT, 4-NT, 1,3-DNB, 2,4-DNT, Co2+, NO3−, F, and CAP (chloramphenicol)) were used as interfering substances. Each time during titration, 20 μL × 2 of the analyte solution was added to 2 mL of the 1 mg/mL Zn-Ms DMF suspension, and then, 20 μL of PA was added to 2 mL of the 1 mg/mL Zn-Ms DMF suspension. The fluorescence emission of Zn-Ms was monitored during the titration process.

3. Crystallography

Single-crystal intensity data were collected on a Bruker D8-Venture diffractometer with graphite-monochromated Mo-Kα radiation (λ = 0.71073 Å) using the SMART and SAINT programs. The structures were determined by direct methods and refined through full-matrix least-squares calculations on F² using the SHELXTL-2018 software package. During the refinement process, anisotropic displacement parameters were applied to all non-hydrogen atoms. Hydrogen atoms were fixed geometrically at calculated distances and allowed to ride on the parent of the non-hydrogen atoms.
Crystal Data of Zn-M1: C40H30N4O6Zn, space group P-1, yellow block, M = 728.07 g·mol−1, a = 10.416 (1) Å, b = 10.823 (1) Å, c = 16.247 (1) Å, α = 99.173 (2) °, β = 95.920 (2) °, γ = 101.741 (2) °, V = 1752.9 (2) Å3, Z = 2, Dcalcd = 1.379 g·cm−3, F(000) = 752.0, μ = 0.754 mm−1, T = 150 K, Rint = 0.1524, R1 [I > 2 s (I)] = 0.0511, wR2 (all data) = 0.1497, GOOF = 1.034. CCDC No. 2417374.
Crystal Data of Zn-M2: C121H87N11O13Zn2, space group P-1, yellow block, M = 2033.80 g·mol−1, a = 15.544 (4) Å, b = 12.535 (3) Å, c = 26.186 (7) Å, α = 89.978 (5) °, β = 104.430 (5) °, γ = 89.977 (6) °, V = 4941 (2) Å3, Z = 2, Dcalcd = 1.367 g·cm−3, F(000) = 2108.0, μ = 0.559 mm−1, T = 163 K, Rint = 0.2021, R1 [I > 2 s (I)] = 0.0703, wR2 (all data) = 0.1687, GOOF = 1.002.CCDC No. 2417381.

4. Results and Discussion

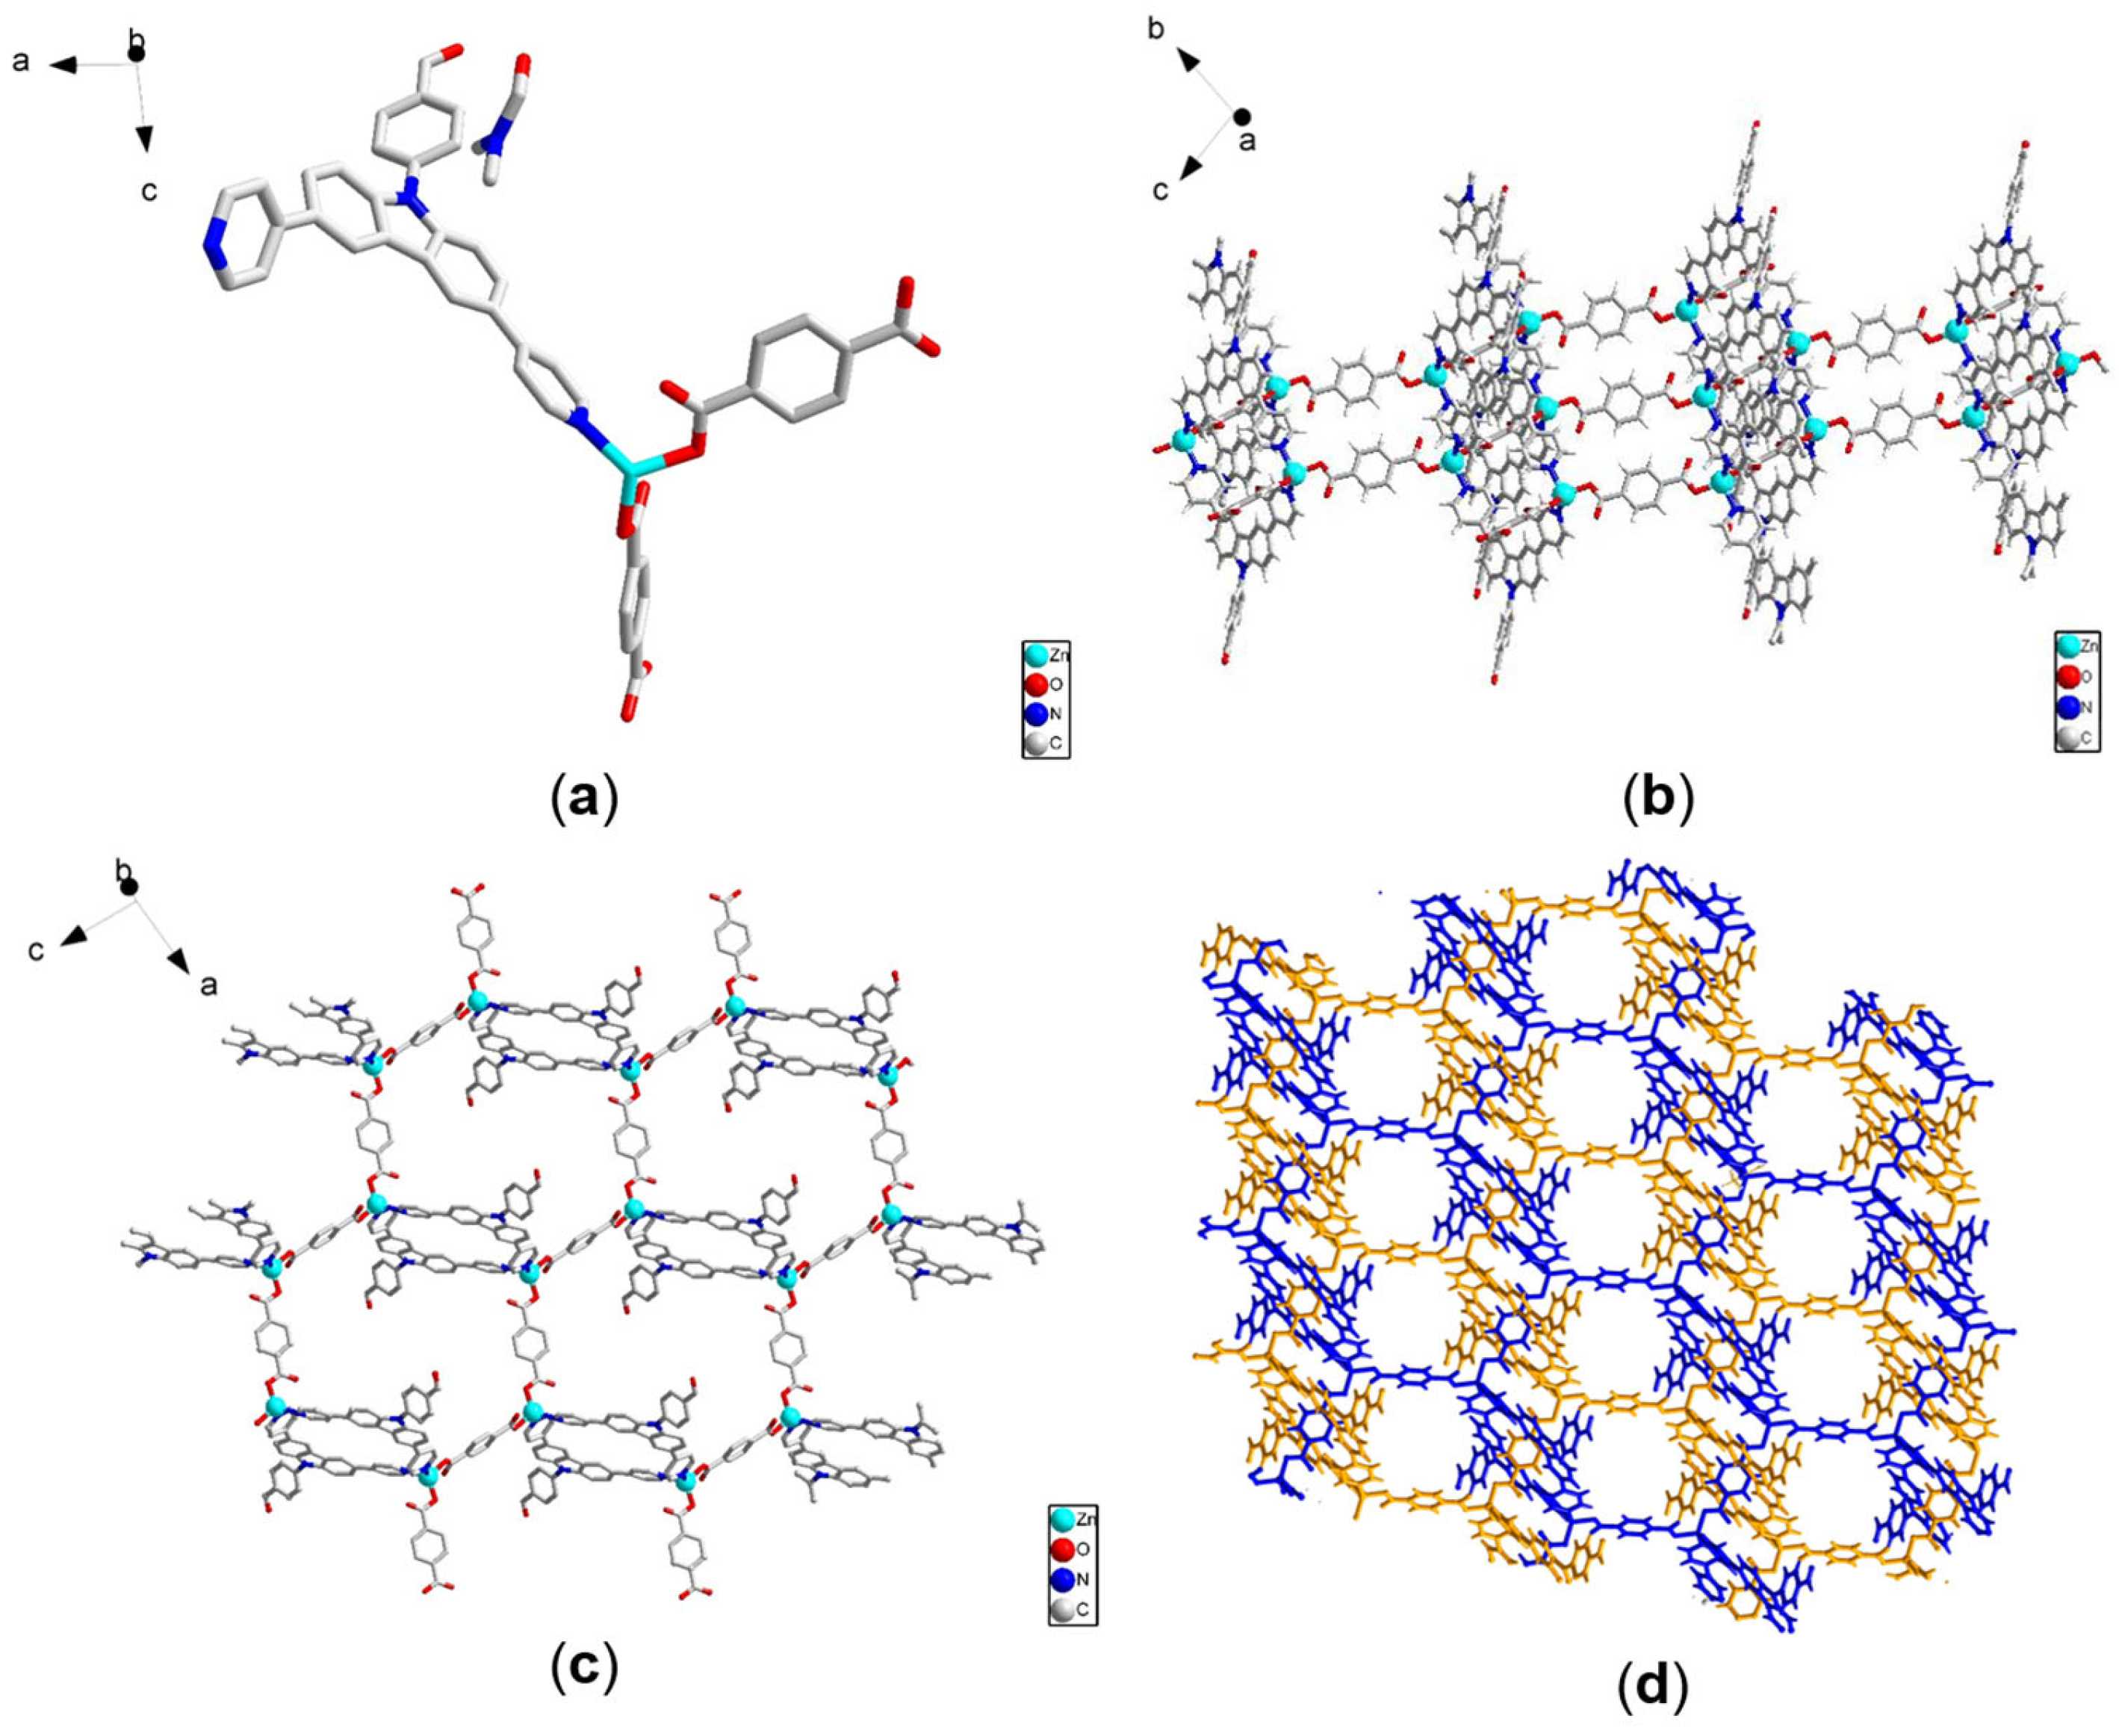
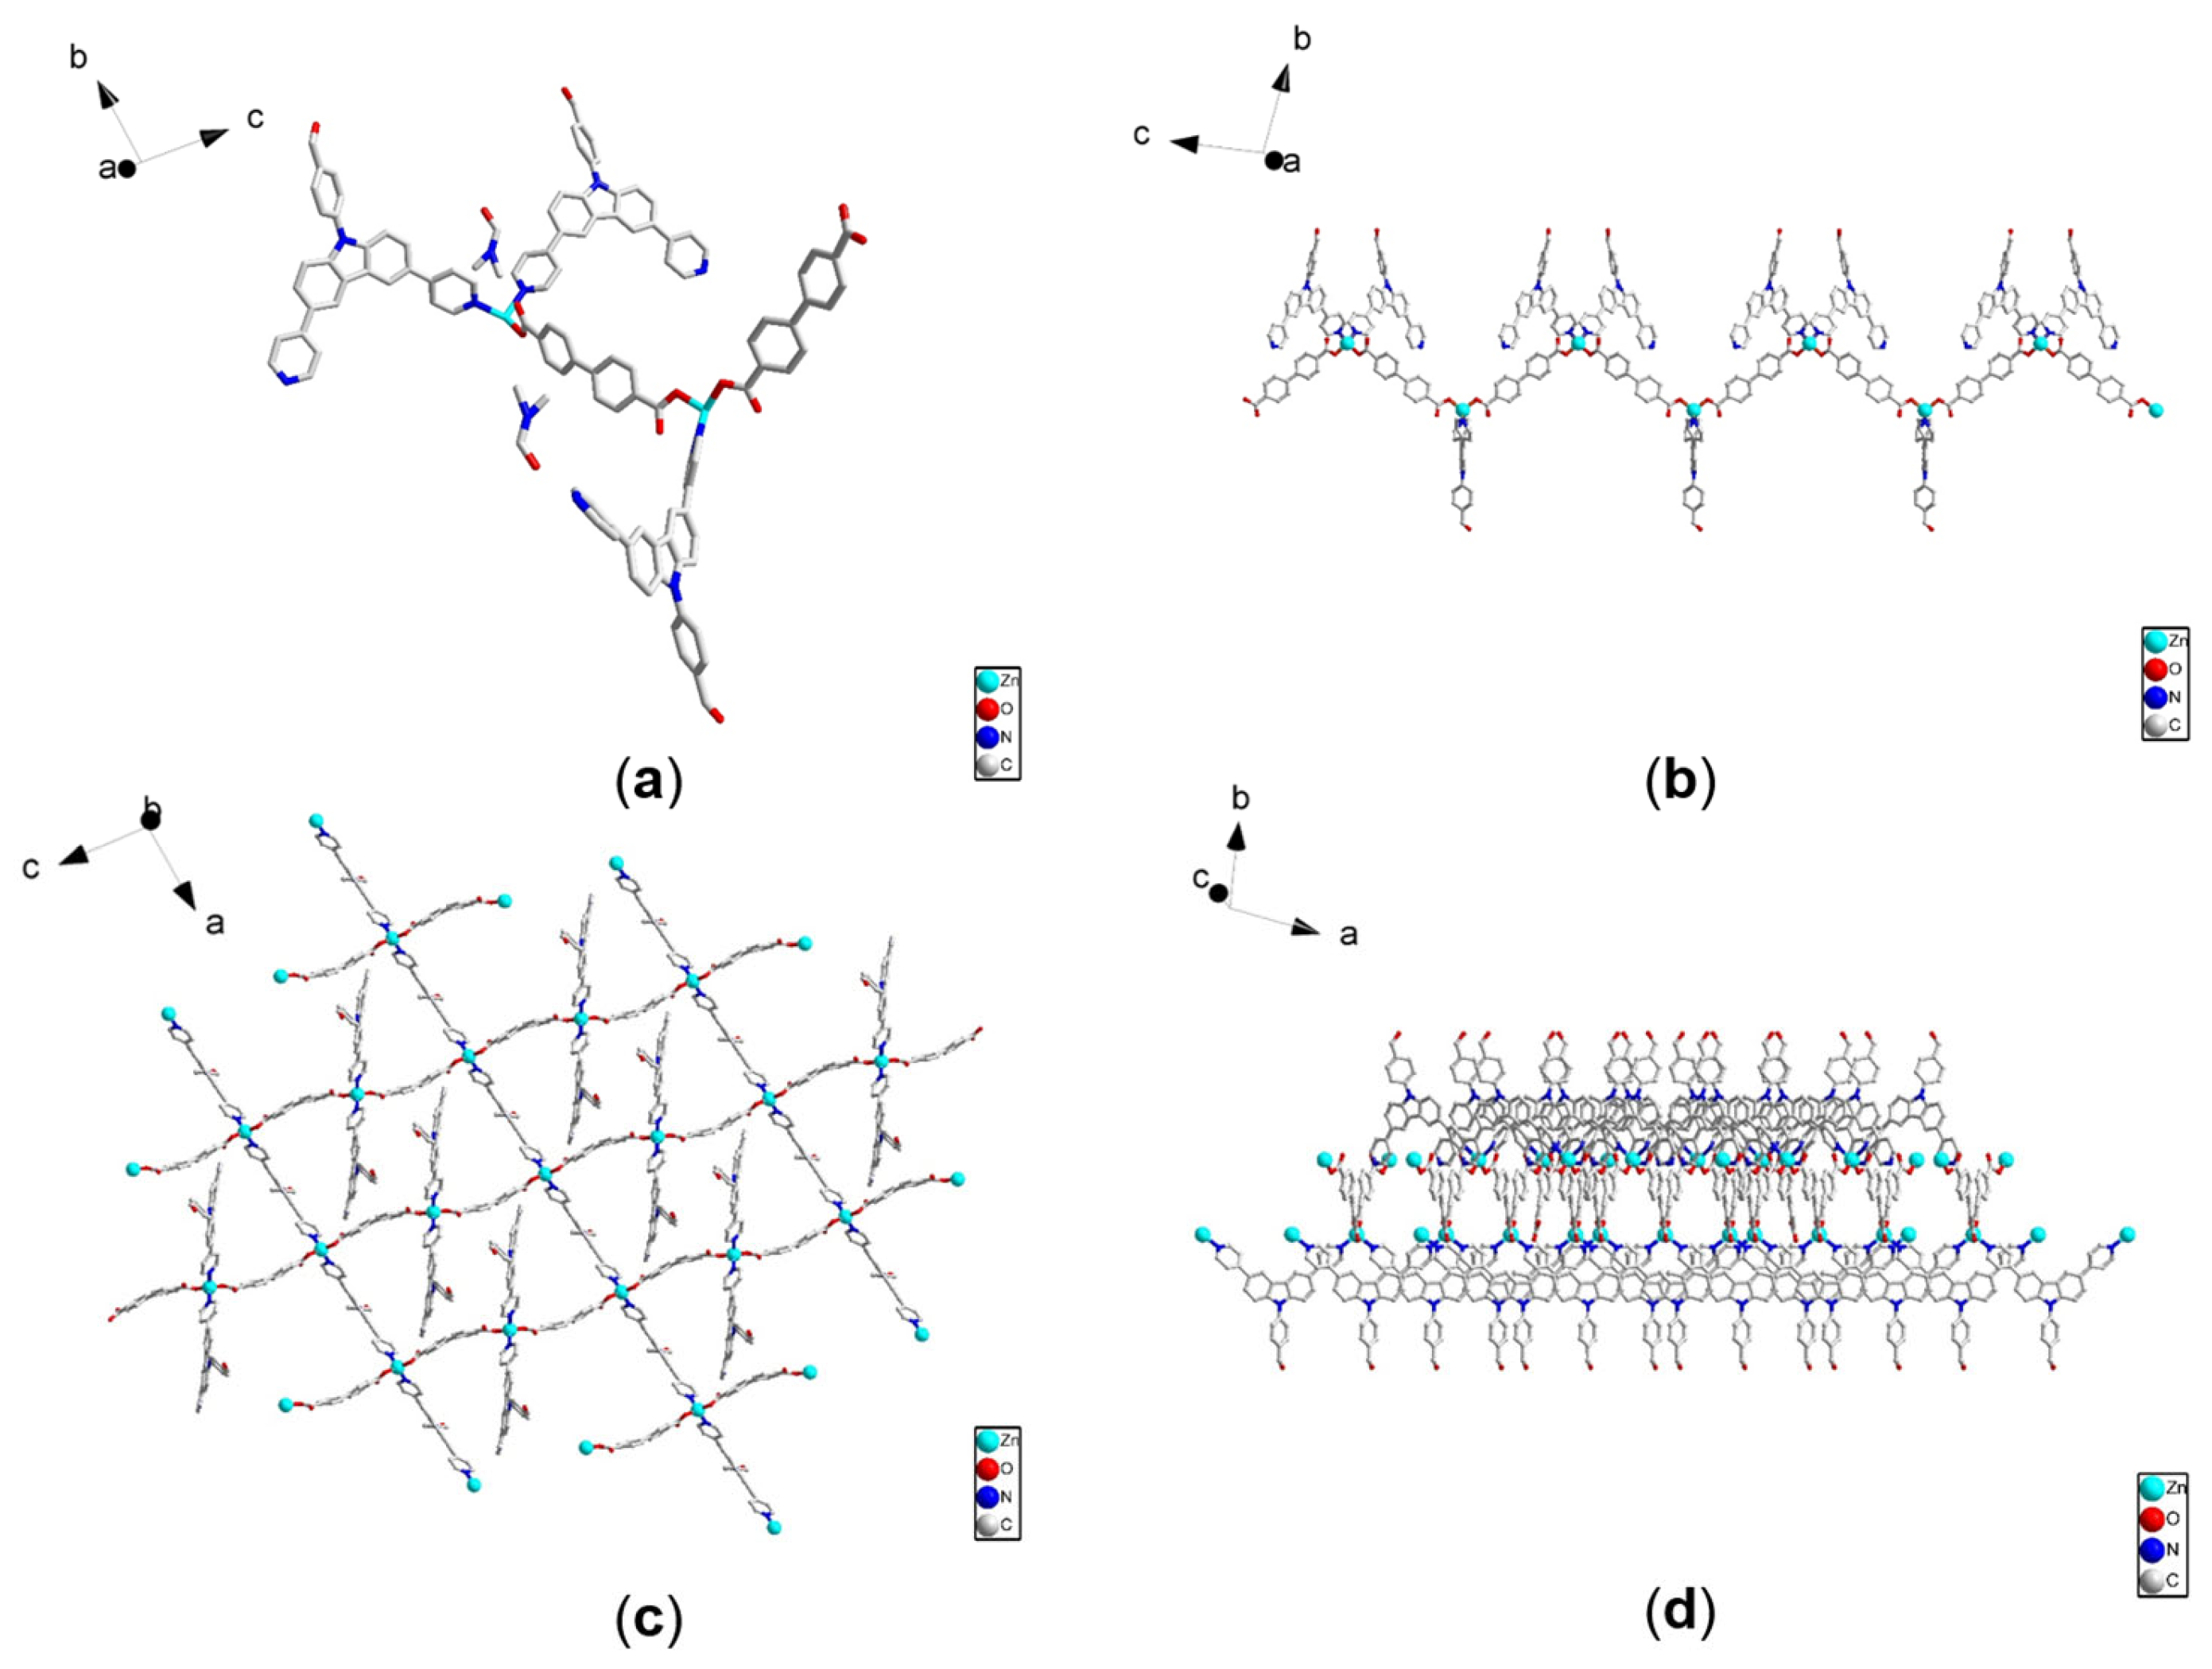
4.1. Structure of Two MOFs

Zn-M1 and Zn-M2 were prepared through the coordination self-assembly of Zn2+ ions, the ligand L, and dicarboxylic acid ligands PTA or BPA, respectively. Zn2+ was chosen as the node to avoid the quenching of fluorescent emissions, ligand L was added for its carbazole moiety, and the aldehyde groups were incorporated to achieve a fluorescent response ability. Additionally, the dicarboxylic acid ligands were introduced to balance the positive charge of the MOFs, preventing occupancy of the channel by counter ions.
X-ray single crystal analysis of Zn-M1 revealed that it crystallized in a triclinic crystal system with the space group P-1. Figure 1a showed that the asymmetric unit of the Zn-M1 structure contained one Zn2+, one ligand L, two half-occupied PTA ligands, and one DMF solvent molecule (Figure 1a). Each zinc ion was tetrahedrally coordinated with two carboxylate O atoms from two PTAs and two pyridyl N atoms from two L ligands. The two L ligands adopted a bis-monodentate coordination mode to link two Zn2+ centers (Figure 1b), forming a “2 + 2” quadrilateral ring with the size of ca. 10.8 Å (Zn…Zn distance) × 14.5 Å (C…C distance between the central carbazole moieties). Each ring building block was linked with the neighboring PTAs to form a two-dimensional layer. The laminar structure consisted of many hexagonal orifices that possessed six Zn2+, four Ls in two rings, and four PTAs. The diameter of the hexagonal orifice was approximately 24.0 Å (Figure 1c). The benzene ring attached to the carbazole nitrogen atom had a torsion angle of about 46.749° with a rigid plane, and the two aldehyde groups in each ring were fully exposed outside on each side of the layer.
Interestingly, Zn-M1 was not a normal layered structure, but a two-fold interweaved structure. For each zinc atom, the benzene rings from one of the coordinated PTA ligands passed right through the quadrilateral hole in another layer structure and the other PTA ligand crossed through the hexagonal orifice in another layer structure. Every quadrilateral hole of the “2 + 2” ring was crossed by the benzene ring from the PTA ligand. Thus, the two identical layers interweaved with each other. Owing to interpenetration, the original hexagonal orifice was split into four parts: two small orifices and two medium orifices (Figure 1d). Such an interwoven structure enhanced the local density of the aldehyde-carbazole units, which would be beneficial for the sensitivity of chemosensor material toward its targets. From the SEM image, Zn-M1 was observed to have a parallelogram-like structure (Figure S4a).
X-ray single crystal analysis of Zn-M2 showed that it also crystallized in a triclinic crystal system with the space group P-1. The asymmetric unit of the Zn-M2 structure contained two Zn2+, three L ligands, two BPA ligands, and two DMF solvent molecules (Figure 2a). In the whole framework, the Zn2+ center was also tetrahedrally coordinated by two carboxylate O atoms from two BPAs and two pyridyl N atoms from two ligands L. The structure of Zn-M2 composed of 2D framework crossed by two perpendicular chain: each Zn2+ was linked with two BTA ligands to form a 1D chain (Figure 2b), and regarding the chain as a sub-construction unit for wireless extension, the two-dimensional laminar structure was seen: half of the Zn2+ ions in the chain were linked with the bis-monodentate coordinated ligand L to form a 2D layer (Figure 2c). This layer structure had parallelogram-like orifices with a size of 26.0 Å × 15.5 Å. While only one half of the pyridine N atoms of the other ligand L are involved in coordination with the other half of the Zn2+ center, the remaining pyridine part hangs above the 2D layer (Figure 2d). The SEM image revealed that Zn-M2 possesses a rectangular configuration (Figure S4b).

4.2. PXRD, TGA, and FT-IR Characterization of Two MOFs
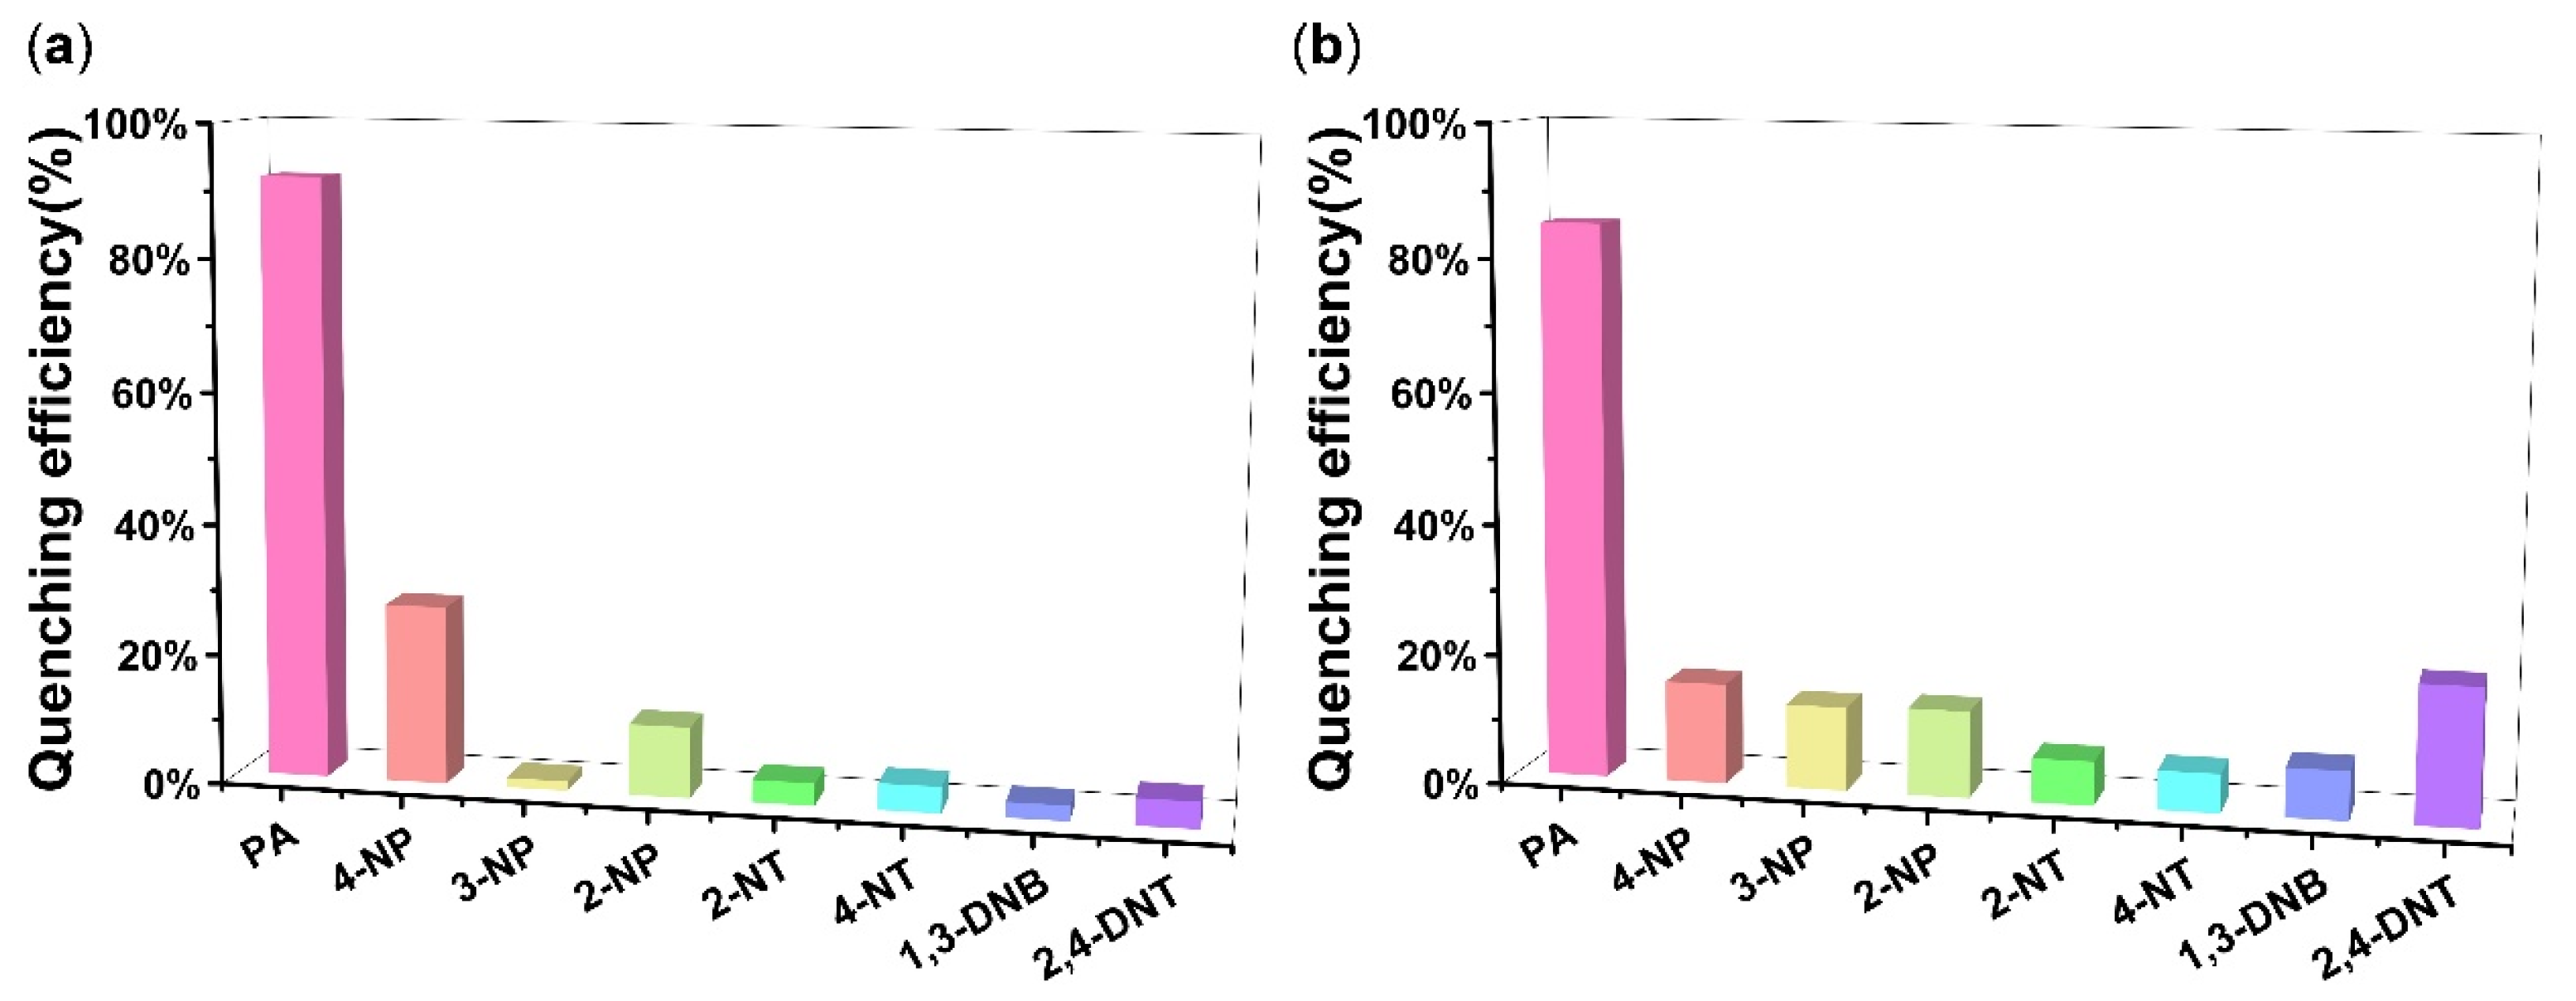
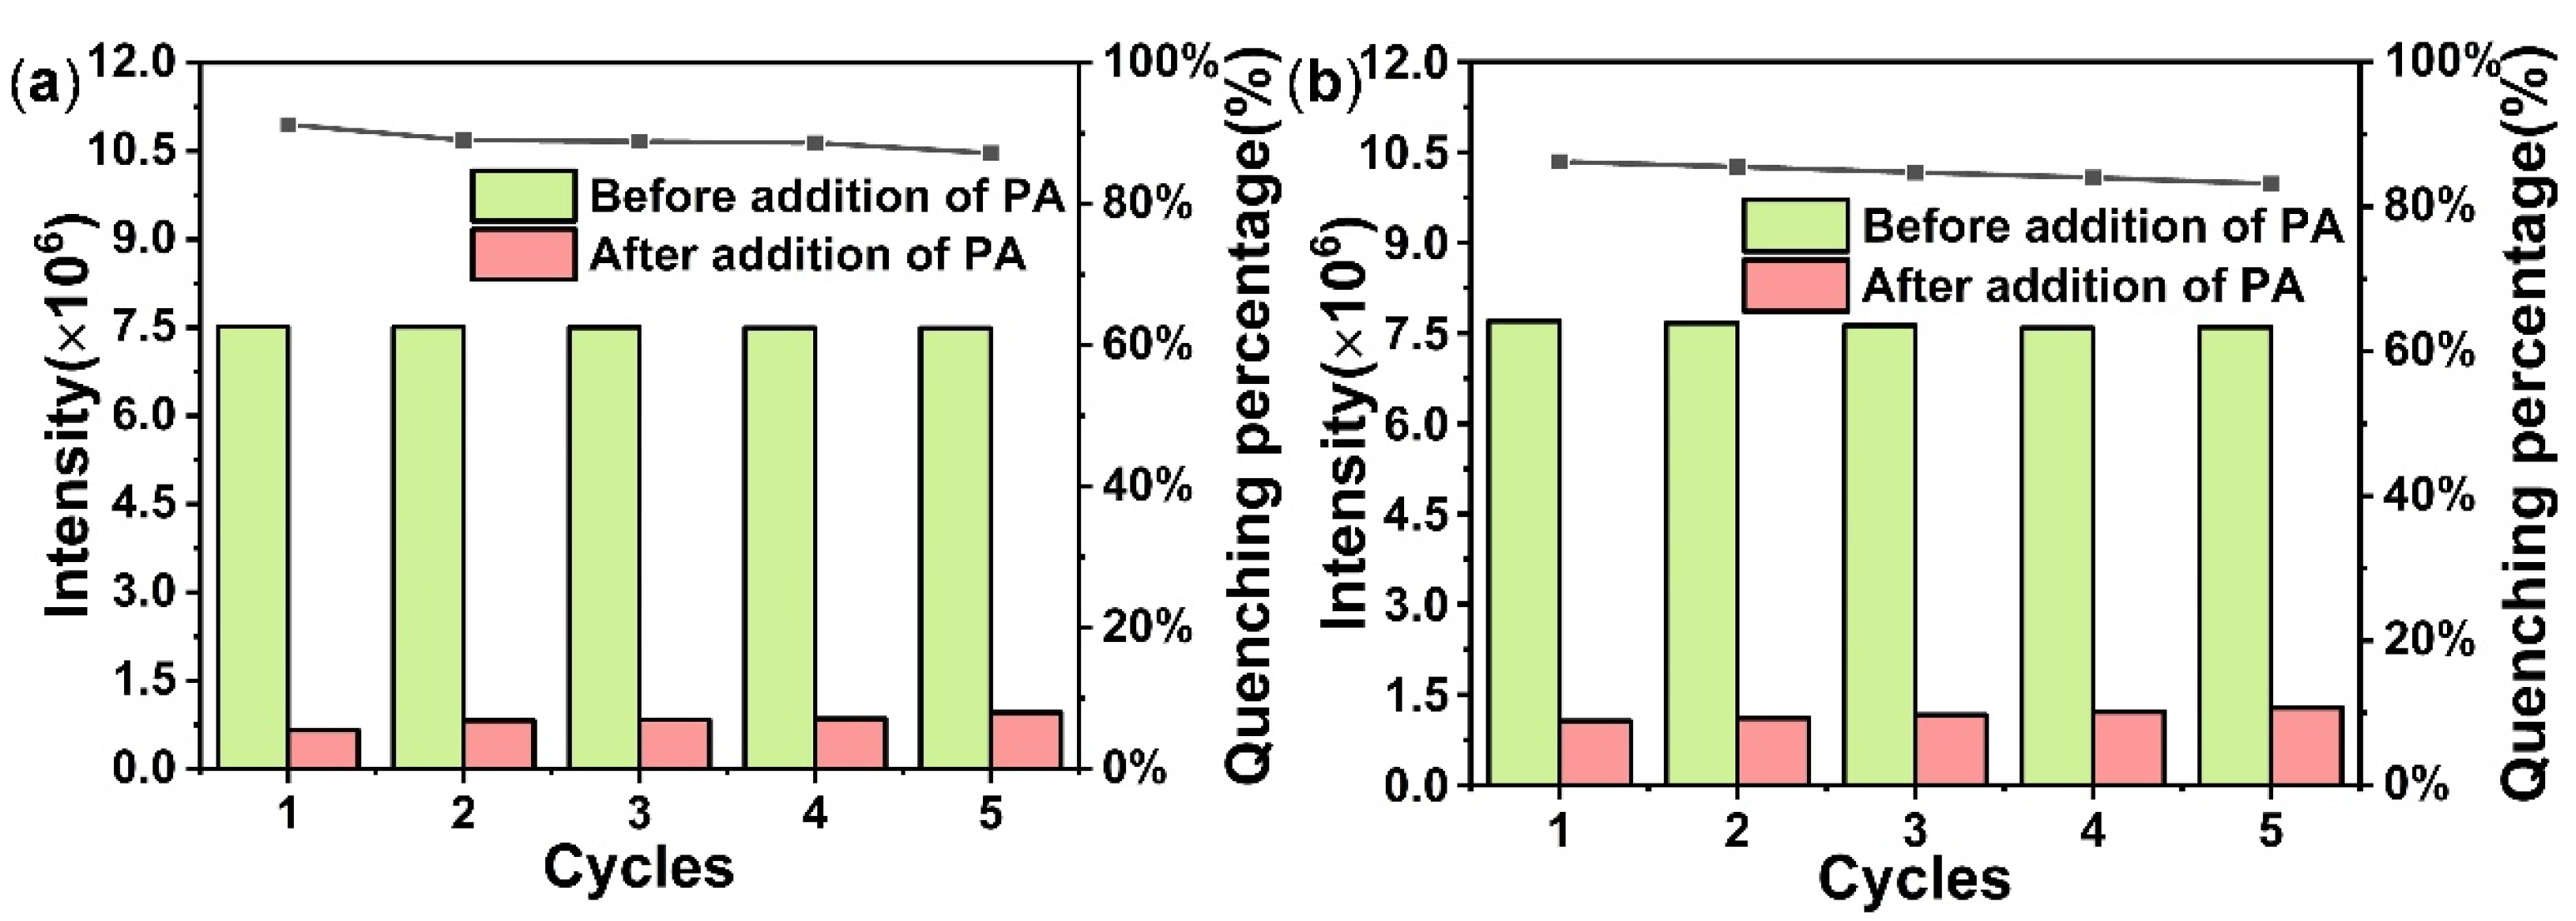
The simulated PXRD pattern was calculated from the single-crystal data collected at a temperature of 150 K. The phase purity of the two MOF materials was confirmed via an X-ray powder diffraction (PXRD) analysis (Figure 3a,c).
The TGA analysis for Zn-M1 showed that no significant mass loss was observed up to 500 °C. Upon further heating, its skeleton began to collapse and the decomposition product zinc oxide began to appear (Figure 3b and Figure S7). For Zn-M2, weight loss of about 9.3% occurred below 250 °C, attributed to the loss of solvents in the orifice, but became stable up to 400 °C (Figure 3d).
The infrared absorption peaks of the ligands PTA and BPA at around 3100 cm−1 and 1678 cm−1 corresponded to the stretching vibration peaks of the O-H and C=O bonds, respectively, of the carboxylic acid functional groups in the molecular structure. Compared with ligands PTA and BPA, Zn-Ms did not show infrared absorption peaks in the vicinity of the two bands, suggesting that the carboxylic acid lost its protons and the carboxylic acid moiety was completely delocalized, leading to the disappearance of the carbonyl functional group when PTA and BPA were coordinated with Zn2+. Stretching vibrational peaks of the aldehyde group could be seen at about 1701 cm−1, which indicates that both Zn-M1 and Zn-M2 maintained their aldehyde groups, even at high temperatures (Figure S5).
The post-modified MOF Zn-M1-PSM was obtained following the reaction of Zn-M1 and cyclohexylamine. The PXRD patterns of Zn-M1-PSM showed that it maintained its crystallinity, but showed some difference from Zn-M1 (Figure S6b), possibly due to the changes in the framework caused by the addition of new groups. On the IR spectrum of Zn-M1-PSM, the appearance of a peak at 1670 cm−1 corresponding to the imine bond, along with the weakening of the aldehyde stretching vibration peak at 1701 cm−1, confirmed the success of the covalent post-synthetic modification on the aldehyde groups (Figure S6a).

4.3. NEs Detection

The UV-vis and fluorescence spectra of two MOFs are shown in Figure 4. As shown in Figure S9, Zn-M1 and Zn-M2 have the same emission peaks at around 450 nm in different solvents when excited at a wavelength of 390 nm (λex = 390 nm). Additionally, the chromaticity diagram from CIE distinctly illustrates a variation in color (Figure S8). Zn-Ms possessed the strongest fluorescence emission in DMF, while a few degrees of fluorescence quenching occurred in EtOH and H2O (Figures S9 and S31). Therefore, the fluorescence tests were subsequently all conducted using DMF as the solvent.
Among these NEs, PA exhibited substantial quenching efficiency. Its addition (200 μL) decreased the luminescence intensity of the Zn-M1 suspension by 92% when monitoring emissions at 450 nm. Furthermore, the addition of PA resulted in an 85% reduction in the fluorescence intensity of the Zn-M2 suspension. (Figure 5). These data unambiguously indicate that Zn-Ms possesses the remarkably high selectivity towards PA among the NEs.
To elucidate the sensing performance of Zn-Ms in a DMF suspension toward PA, systematic fluorescence titration experiments were conducted (Figure 6a,c and Figures S10–S23). The fluorescence emission spectra revealed a significant quenching effect upon incremental addition of PA under 390 nm excitation. As depicted in Figure 6a, the Stern–Volmer plot exhibited nonlinear behavior across the entire concentration range. Nevertheless, a linear correlation was established in the lower concentration regime, yielding a Stern–Volmer constant (Ksv) of 4.87 × 10⁴ M⁻¹ with a correlation coefficient (R2) of 0.9906 (the accuracy was validated by using Uv-vis spectroscopy quantitative method, Figure S39). Based on the titration data within this linear range, the limit of detection (LOD) for Zn-M1 was determined to be 8.17 × 10⁻⁷ M (below the national standard), demonstrating its exceptional sensitivity as a potential PA sensor (Figure 6b). As for Zn-M2, it also had a decrease with a LOD of 1.35 × 10⁻⁶ M when adding PA (Figure 6d and Figure S41). Zn-M1 exhibited more sensitive response ability toward PA compared with Zn-M2, possibly due to its interwoven structure feature. The limit of PA is clearly stated as 0.5 mg/L (2.21 × 10⁻⁶ M) in China’s national drinking water health standards (GB 5749-2006) [36] and water quality standards for surface waters (GB 3838-2002) [37,38]. The LODs of Zn-M1 (8.17 × 10⁻⁷) and Zn-M2 (1.35 × 10⁻⁶) are lower than 2.21 × 10⁻⁶ M. With the continuous addition of PA, the maximum emission wavelength of Zn-Ms showed a slight red shift, which might be due to the presence of a weak interaction between Zn-Ms and PA. Their detection performances were superior to those of several reported MOF-based fluorescence sensors for PA detection (the sensors reported in Table S1 might not be comprehensive enough to cover all existing sensors in this field).
Zooming in on PA, further research was conducted to assess detection performance and selectivity. In the interference experiments, the fluorescence intensity of Zn-Ms remained almost unchanged or decreased only slightly after the addition of high concentrations of interfering substances, whereas a significant fluorescence quenching occurred immediately after the addition of low concentrations of PA to Zn-Ms (Figures S24–S27). When the interfering substance was PA, the fluorescence intensity of Zn-M1 was quenched by more than 56% after four interference titrations (Figure S24). The use of the other four NEs as interferents did not significantly affect the detection of PA. Moreover, Zn-Ms also exhibited the ability to against cations, anions and antibiotics. These results demonstrate that Zn-Ms exhibited remarkable selectivity toward PA detection, maintaining excellent sensing performance even in the presence of competing nitroaromatic compounds, which substantiates their potential for practical applications in complex matrices.
The practical applicability of Zn-Ms as a sensing material was further evaluated through recyclability studies. To assess their regeneration capability, five consecutive detection-regeneration cycles were performed for PA sensing. Following each fluorescence titration measurement, the material was recovered through centrifugation and thoroughly washed with fresh DMF. As depicted in Figure 7, the fluorescence intensity and quenching percentages remained consistent throughout the cycling experiments. Furthermore, the PXRD pattern of the regenerated material after five cycles (Figure S28) maintained excellent consistency with that of the pristine sample, confirming the structural integrity of Zn-Ms. These findings demonstrate the remarkable recyclability and sustained detection performance of Zn-Ms, highlighting its potential for practical sensing applications.

4.4. Luminescence Quenching Mechanism

Based on the established literature regarding the fluorescence quenching mechanisms in MOFs and coordination polymers, four predominant factors have been identified: (i) structural framework decomposition, (ii) inner filter effect (IFE), (iii) Förster resonance energy transfer (FRET), and (iv) photoinduced electron transfer (PET). A systematic investigation was therefore conducted to elucidate the relative contributions of these potential mechanisms to the observed fluorescence quenching behavior in Zn-Ms.
The structural stability of Zn-Ms was confirmed via PXRD analysis, which revealed that the crystalline framework remained intact after 24 h of immersion in PA-containing solutions, effectively ruling out structural degradation as the quenching mechanism (Figure S28).
The UV-Vis spectra of eight NEs were investigated (Figure S37). The overlap of the UV absorption spectra of PA and the excitation spectra of Zn-Ms indicates that the fluorescence quenching of Zn-Ms by PA could be attributed, in part, to competitive absorption of the excitation light, suggesting the potential occurrence of the IFE, as illustrated in Figure 8b,d.
To gain deeper insights into the exceptional selectivity and sensitivity of Zn-Ms toward PA, fluorescence lifetime measurements were performed on Zn-Ms DMF suspensions both in the presence and absence of PA. This analysis was conducted to elucidate the specific interactions between PA and Zn-Ms that drive fluorescence quenching through potential mechanistic pathways. As illustrated in Figures S33–S36, the fluorescence lifetimes of Zn-Ms at 450 nm decreased (Zn-M1: from 3.67 ns to 3.49 ns, Zn-M2: from 3.60 ns to 3.16 ns) with the addition of 200 μL of PA (1 mM). The SV curves were linear at low concentration but became nonlinear at high concentration. The slight decay in the fluorescence lifetimes and the changes in the SV curve suggested that both dynamic quenching and static quenching processes might have occurred [39,40]. The UV-Vis spectra of eight NEs in DMF were collected, and PA had a wide absorption band centered at 370 nm and exhibits a much stronger absorption ability than the other compounds in the wavelength range of 325–475 nm. The overlap between the UV absorption spectra of PA and the emission spectrum of Zn-Ms suggests that the luminescence quenching was partly from FRET (Figure 8a,c). Additionally, given that PA had a powerful electron acceptance ability and the carbazole moiety was an efficient electron donor, photoinduced electron transfer could occur during luminescent quenching.
Besides the mechanism mentioned above, the interactions between the sensing materials and analyte also had an effect on the luminescence sensing response. As seen in the single crystal structure, for both Zn-M1 and Zn-M2, the aldehyde groups were exposed on the outside of the pores. Hydrogen bond interactions likely formed with the -OH of PA. Zn-M1-PSM was then prepared to show the function of aldehyde in the MOF sensor through the masking of the aldehyde group using a post-synthetical Schiff base reaction with cyclohexylamine (Figure S6). The equal addition of 200 μL of PA (1 mM) only quenched 75% of the fluorescent intensity of Zn-M1-PSM. Compared with the degree of fluorescence quenching for Zn-M1 and Zn-M1-PSM, it may be reasonably inferred that the aldehyde groups mainly serve as recognition sites toward PA (Figure S38).
Based on the aforementioned results, the high selectivity and sensitivity of Zn-Ms for PA detection could be attributed to the synergistic effects of FRET (and potentially PET) as well as the IFE. Additionally, the aldehyde groups might act as the recognition sites for the interaction between MOFs and PA.

5. Conclusions

In summary, we succeeded in constructing two fluorescent MOF materials, Zn-M1 and Zn-M2, based on 4-(3,6-Dipyridyl-9H-carbazol-9-yl) benzaldehyde ligands, with bright and stable luminescent emissions in suspension. They are capable of specifically identifying PA at low concentrations, especially Zn-M1, which has a lower limit of detection (LOD) of 8.17 × 10⁻⁷ M. According to the investigation on the mechanism of fluorescence quenching, we postulated that the effect of IFE, FRET, and possibly PET made Zn-Ms display the highly selectivity and sensitivity for PA sensing. Additionally, the decrease in sensitivity of post-synthesis modified Zn-M1-PSM toward PA suggests that the aldehyde group might act as the recognition site.

Supplementary Materials

The following supporting information can be downloaded at: https://www.mdpi.com/article/10.3390/chemosensors13030105/s1, Figure S1: 1H NMR spectrum of 4-(9H-Carbazol-9-yl) benzaldehyde in DMSO-d6; Figure S2: 1H NMR spectrum of 4-(3,6-Dibromo-9H-carbazol-9-yl) benzaldehyde in CDCl3; Figure S3: 1H NMR spectrum of 4-(3,6-Dipyridyl-9H-carbazol-9-yl) benzaldehyde in DMSO-d6; Figure S4: SEM images of (a) Zn-M1, (b) Zn-M2; Figure S5: FT-IR spectra of PTA, BPA, L, Zn-M1, and Zn-M2; Figure S6: (a) FT-IR spectra and (b) PXRD patterns of Zn-M1 and Zn-M1-PSM; Figure S7: PXRD patterns of (a) Zn-M1 and (b) Zn-M2 after TGA test; Figure S8: The corresponding coordinates of L, Zn-M, and Zn-M2 fluorescence spectra in CIE 1931 diagram; Figure S9: Fluorescence emission spectra of (a) Zn-M1 and (b) Zn-M2 in different solvents (1 mg/mL Zn-Ms DMF suspension); Figure S10: Fluorescence quenching curves of Zn-M1 during titration of 1,3-DNB (1 mg/mL Zn-Ms DMF suspension); Figure S11: Fluorescence quenching curves of Zn-M1 during titration of 2,4-DNT (1 mg/mL Zn-Ms DMF suspension); Figure S12: Fluorescence quenching curves of Zn-M1 during titration of 2-NP (1 mg/mL Zn-Ms DMF suspension); Figure S13: Fluorescence quenching curves of Zn-M1 during titration of 2-NT (1 mg/mL Zn-Ms DMF suspension); Figure S14: Fluorescence quenching curves of Zn-M1 during titration of 3-NP (1 mg/mL Zn-Ms DMF suspension); Figure S15: Fluorescence quenching curves of Zn-M1 during titration of 4-NP (1 mg/mL Zn-Ms DMF suspension); Figure S16: Fluorescence quenching curves of Zn-M1 during titration of 4-NT (1 mg/mL Zn-Ms DMF suspension); Figure S17: Fluorescence quenching curves of Zn-M2 during titration of 1,3-DNB (1 mg/mL Zn-Ms DMF suspension); Figure S18: Fluorescence quenching curves of Zn-M2 during titration of 2,4-DNT (1 mg/mL Zn-Ms DMF suspension); Figure S19: Fluorescence quenching curves of Zn-M2 during titration of 2-NP (1 mg/mL Zn-Ms DMF suspension); Figure S20: Fluorescence quenching curves of Zn-M2 during titration of 2-NT (1 mg/mL Zn-Ms DMF suspension); Figure S21: Fluorescence quenching curves of Zn-M2 during titration of 3-NP (1 mg/mL Zn-Ms DMF suspension); Figure S22: Fluorescence quenching curves of Zn-M2 during titration of 4-NP (1 mg/mL Zn-Ms DMF suspension); Figure S23: Fluorescence quenching curves of Zn-M2 during titration of 4-NT (1 mg/mL Zn-Ms DMF suspension); Figure S24: Quenching curves of Zn-M1 for selective detection of PA when the interfering substances were (a) 2-NT, (b) 4-NT, (c) 1,3-DNB, and (d) 2,4-DNT (1 mg/mL Zn-Ms DMF suspension); Figure S25: Quenching curves of Zn-M1 for selective detection of PA when the interfering substances were (a) Co2+, (b) F, (c) NO3, and (d) CAP (chloramphenicol) (1 mg/mL Zn-Ms DMF suspension); Figure S26: Quenching curves of Zn-M2 for selective detection of PA when the interfering substances were (a) 2-NT, (b) 4-NT, (c) 1,3-DNB, and (d) 2,4-DNT (1 mg/mL Zn-Ms DMF suspension); Figure S27: Quenching curves of Zn-M2 for selective detection of PA when the interfering substances were (a) Co2+, (b) F, (c) NO3, and (d) CAP (chloramphenicol) (1 mg/mL Zn-Ms DMF suspension); Figure S28: PXRD patterns of (a) Zn-M1 and (b) Zn-M2 before and after fluorescence detections; Figure S29: The inter- and intra-day variation PXRD patterns of (a) Zn-M1 (b) Zn-M2; Figure S30: The inter- and intra-day variation fluorescence intensity graph of Zn-Ms in DMF; Figure S31: Quenching efficiency of (a) Zn-M1 and (b) Zn-M2 against nitro-explosives in H2O; Figure S32: The fluorescence change diagram of (a) Zn-M1 and (b) Zn-M2 (1 mg/mL, 1mM different interferents’ suspension in H2O); Figure S33: The luminescence lifetime of Zn-M1 before the addition of PA; Figure S34: The luminescence lifetime of Zn-M1 after the addition of PA; Figure S35: The luminescence lifetime of Zn-M2 before the addition of PA; Figure S36: The luminescence lifetime of Zn-M2 after the addition of PA; Figure S37: UV-Vis absorption spectra of eight nitro-explosives; Figure S38: Fluorescence quenching curves of Zn-M1-PSM during titration of PA (1 mg/mL Zn-Ms DMF suspension); Figure S39: (a) UV absorption spectra of PA after concentration change, and (b) the UV standard curve of PA; Figure S40: A schematic illustrating the expected interaction between the PA and aldehyde groups on the MOF; Figure S41: Photographs of Zn-Ms solutions (a) and (b) under ambient without (left) and with (right) PA, (c) and (d) under UV light without (left) and with (right) PA; Table S1: Comparison of limit of detection (LOD) and the quenching strength (Ksv) of PA between Zn-Ms and several examples of other reported MOFs. References [41,42,43,44,45,46,47] are cited in the supplementary materials.

Author Contributions

Conceptualization, Y.J. and C.H.; methodology, Y.J., X.W. and C.H.; validation, Y.J., X.W. and C.H.; formal analysis, Y.J., H.L. and C.H.; investigation, Y.J. and X.W.; data curation, Y.J. and X.W.; writing—original draft preparation, Y.J.; writing—review and editing, Y.J. and C.H.; supervision, C.H. All authors have read and agreed to the published version of the manuscript.

Funding

This research received no external funding.

Institutional Review Board Statement

Not applicable.

Informed Consent Statement

Not applicable.

Data Availability Statement

Data are contained within the article and Supplementary Materials.

Conflicts of Interest

The authors declare no conflicts of interest.

References

  1. Guo, L.J.; Yang, Z.; Li, Y.S.; Zu, B.Y.; Dou, X.C. Sensitive, real-time and anti-interfering detection of nitro-explosive vapors realized by ZnO/rGO core/shell micro-Schottky junction. Sens. Actuators B Chem. 2017, 239, 286–294. [Google Scholar] [CrossRef]
  2. Liu, Y.; Li, J.G.; Wang, G.F.; Zu, B.Y.; Dou, X.C. One-Step Instantaneous Detection of Multiple Military and Improvised Explosives Facilitated by Colorimetric Reagent Design. Anal. Chem. 2020, 92, 13980–13988. [Google Scholar] [CrossRef]
  3. Giannoukos, S.; Brkic, B.; Taylor, S.; Marshall, A.; Verbeck, G.F. Chemical Sniffing Instrumentation for Security Applications. Chem. Rev. 2016, 116, 8146–8172. [Google Scholar] [CrossRef]
  4. Goel, N.; Kumar, N. A stable nonanuclear Tb(III), cluster for selective sensing of picric acid. Inorg. Chim. Acta. 2017, 463, 14–19. [Google Scholar] [CrossRef]
  5. Nagarkar, S.S.; Joarder, B.; Chaudhari, A.K.; Mukherjee, S.; Ghosh, S.K. Highly Selective Detection of Nitro Explosives by a Luminescent Metal-Organic Framework. Angew. Chem. Int. Ed. 2013, 52, 2881–2885. [Google Scholar] [CrossRef]
  6. Li, A.; Li, L.; Lin, Z.; Song, L.; Wang, Z.H.; Chen, Q.; Yang, T.; Zhou, X.H.; Xiao, H.P.; Yin, X.J. Guest-induced reversible structural transitions and concomitant on/off luminescence switching of an Eu(III) metal-organic framework and its application in detecting picric acid. New J. Chem. 2015, 39, 2289–2295. [Google Scholar] [CrossRef]
  7. Desai, V.; Panchal, M.; Dey, S.; Panjwani, F.; Jain, V.K. Recent Advancements for the Recognization of Nitroaromatic Explosives Using Calixarene Based Fluorescent Probes. J. Fluoresc. 2022, 32, 67–79. [Google Scholar] [CrossRef] [PubMed]
  8. Parmar, B.; Rachuri, Y.; Bisht, K.K.; Laiya, R.; Suresh, E. Mechanochemical and Conventional Synthesis of Zn(II)/Cd(II) Luminescent Coordination Polymers: Dual Sensing Probe for Selective Detection of Chromate Anions and TNP in Aqueous Phase. Inorg. Chem. 2017, 56, 2627–2638. [Google Scholar] [CrossRef]
  9. Li, M.; Ma, J.; Wang, J.; Wei, X.; Lu, W. Conjugated Microporous Polymer-Based Fluorescent Probe for Selective Detection of Nitro-explosives and Metal Nitrates. ACS Appl. Mater. Interfaces 2025, 17, 4033–4043. [Google Scholar] [CrossRef]
  10. Tripathi, N.; Kumar, R.; Singh, P.; Kumar, S. Ratiometric fluorescence “Turn On” probe for fast and selective detection of TNT in solution, solid and vapour. Sens. Actuators B Chem. 2017, 246, 1001–1010. [Google Scholar] [CrossRef]
  11. He, W.; Lv, D.; Guan, Y.; Yu, S. Post-synthesis modification of metal–organic frameworks: Synthesis, characteristics, and applications. J. Mater. Chem. A 2023, 11, 24519–24550. [Google Scholar] [CrossRef]
  12. Lee, J.; Farha, O.K.; Roberts, J.; Scheidt, K.A.; Nguyen, S.T.; Hupp, J.T. Metal–organic framework materials as catalysts. Chem. Soc. Rev. 2009, 31, 1450–1459. [Google Scholar] [CrossRef]
  13. Wang, Y.H.; Fin, H.; Ma, Q.; Mo, K.; Mao, H.Z.; Feldhoff, A.; Cao, X.Z.; Li, Y.S.; Pan, F.S.; Jiang, Z.Y. A MOF Glass Membrane for Gas Separation. Angew. Chem. Int. Ed. 2020, 59, 4365–4369. [Google Scholar] [CrossRef]
  14. Qian, Q.H.; Asinger, P.A.; Lee, M.J.; Han, G.; Rodriguez, K.M.; Lin, S.; Benedetti, F.M.; Wu, A.X.; Chi, W.S.; Smith, Z.P. MOF-Based Membranes for Gas Separations. Chem. Rev. 2020, 120, 8161–8266. [Google Scholar] [CrossRef]
  15. Sun, Y.W.; Yan, J.H.; Gao, Y.L.; Ji, T.T.; Chen, S.X.; Wang, C.; Lu, P.; Li, Y.S.; Liu, Y. Fabrication of Highly Oriented Ultrathin Zirconium Metal-Organic Framework Membrane from Nanosheets towards Unprecedented Gas Separation. Angew. Chem. Int. Ed. 2023, 62, e202216697. [Google Scholar]
  16. Li, S.; Han, W.Y.; An, Q.F.; Yong, K.T.; Yin, M.J. Defect Engineering of MOF-Based Membrane for Gas Separation. Adv. Funct. Mater. 2023, 33, 2303447. [Google Scholar] [CrossRef]
  17. Wang, C.; An, B.; Lin, W.B. Metal-Organic Frameworks in Solid-Gas Phase Catalysis. ACS Catal. 2019, 9, 130–146. [Google Scholar] [CrossRef]
  18. Sepehrmansourie, H.; Alamgholiloo, H.; Pesyan, N.N.; Zolfigol, M.A. A MOF-on-MOF strategy to construct double Z-scheme heterojunction for high-performance photocatalytic degradation. Appl. Catal. B Environ. Energy 2023, 321, 122082. [Google Scholar] [CrossRef]
  19. Ren, J.C.; Huang, Y.L.; Zhu, H.; Zhang, B.H.; Zhu, H.K.; Shen, S.H.; Tan, G.Q.; Wu, F.; He, H.; Lan, S.; et al. Recent progress on MOF-derived carbon materials for energy storage. Carbon Energy 2020, 2, 176–202. [Google Scholar] [CrossRef]
  20. Lázaro, I.A.; Wells, C.; Forgan, R.S. Multivariate Modulation of the Zr MOF UiO-66 for Defect-Controlled Combination Anticancer Drug Delivery. Angew. Chem. Int. Ed. 2020, 59, 5211–5217. [Google Scholar] [CrossRef]
  21. Cui, Y.; Yue, Y.; Qian, G.; Chen, B. Luminescent Functional Metal–Organic Frameworks. Chem. Rev. 2012, 112, 1126–1162. [Google Scholar] [CrossRef] [PubMed]
  22. Zhang, Y.; Yuan, S.; Day, G.; Wang, X.; Yang, X.; Zhou, H. Luminescent sensors based on metal-organic frameworks. Coord. Chem. Rev. 2018, 354, 28–45. [Google Scholar] [CrossRef]
  23. Cheng, T.; Hu, J.; Zhou, C.; Wang, Y.; Zhang, M. Luminescent metal-organic frameworks for nitro explosives detection. Sci. China Chem. 2016, 59, 929–947. [Google Scholar] [CrossRef]
  24. Asad, M.; Anwar, M.I.; Miao, B.; Abbas, A.; Majeed, S.; Mir, I.A.; Rabbani, M.S.; Hussain, S.; Xu, S.; Al-Tahan, M.A.; et al. Recent advances in luminescent metal-organic frameworks (L-MOFs) as sustainable materials for sensing of potentially toxic environmental ubiquitous explosive contaminants. Sustain. Mater. Technol. 2024, 42, e01155. [Google Scholar] [CrossRef]
  25. Cong, C.; Ma, H. Photonic Metal-Organic Frameworks. Adv. Opt. Mater. 2021, 9, 2100733. [Google Scholar] [CrossRef]
  26. Peng, D.; Lin, W.; Pan, H.; Zhi, X.; Zhou, Q.; Yi, L.; Wang, F.; Ren, G.; Pan, Q. Fluorescence detection of Al3+ and mechanism exploration based on La-MOF. J. Solid State Chem. 2024, 339, 124946. [Google Scholar] [CrossRef]
  27. Li, J.; Chen, S.; Yan, R.; Young, D.J.; Mi, Y.; Hu, F. Fabrication of ultrathin 2D MOF nanosheets for folic acid detection. Chin. J. Anal. Chem. 2023, 51, 100251. [Google Scholar] [CrossRef]
  28. Liu, X.; Liu, W.; Kou, Y.; Yang, X.; Ju, Z.; Liu, W. Multifunctional lanthanide MOF luminescent sensor built by structural designing and energy level regulation of a ligand. Inorg. Chem. Front. 2022, 9, 4065–4074. [Google Scholar] [CrossRef]
  29. Sun, B.; Tao, T.; Liu, L.; Ding, R.; Mao, Y. Electron Transfer Facilitated by π–π Stacking during the Nitrobenzene Recognition Process of an MOF Sensor. J. Phys. Chem. C. 2021, 125, 22, 12433–12440. [Google Scholar] [CrossRef]
  30. Liu, L.; Ding, R.; Mao, Y.; Sun, B. Theoretical investigations on the nitro-explosive sensing process of a MOF sensor: Roles of hydrogen bond and π-π stacking. Chem. Phys. Lett. 2022, 793, 139393. [Google Scholar] [CrossRef]
  31. Chongdar, S.; Mondal, U.; Chakraborty, T.; Banerjee, P.; Bhaumik, A. A Ni-MOF as Fluorescent/Electrochemical Dual Probe for Ultrasensitive Detection of Picric Acid from Aqueous Media. ACS Appl. Mater. Interfaces 2023, 15, 14575–14586. [Google Scholar] [CrossRef]
  32. Feng, T.; Li, X.; Wu, J.; He, C.; Duan, C. Cavity-directed nitroaromatics sensing within a carbazole-based luminescent supramolecular M2L3 cage. Chin. Chem. Lett. 2020, 31, 95–98. [Google Scholar] [CrossRef]
  33. Chen, Q.; Cheng, J.; Wang, J.; Li, L.; Liu, Z.; Zhou, X.; You, Y.; Huang, W. A fluorescent Eu(III) MOF for highly selective and sensitive sensing of picric acid. Sci. China Chem. 2019, 62, 205–211. [Google Scholar] [CrossRef]
  34. Chen, L.; Yuan, Z.; Zhang, H.; Ye, Y.; Yang, Y.; Xiang, F.; Cai, K.; Xiang, S.; Chen, B.; Zhang, Z. A Flexible Hydrogen-Bonded Organic Framework Constructed from a Tetrabenzaldehyde with a Carbazole N−H Binding Site for the Highly Selective Recognition and Separation of Acetone. Angew. Chem. Int. Ed. 2022, 61, e202213959. [Google Scholar] [CrossRef]
  35. Xi, F.; Liu, H.; Yang, N.; Gao, E. Aldehyde-Tagged Zirconium Metal–Organic Frameworks: A Versatile Platform for Postsynthetic Modification. Inorg. Chem. 2016, 55, 4701–4703. [Google Scholar] [CrossRef]
  36. GB 5749-2006; Standards for Drinking Water Quality. National Standard of the People’s Republic of China: Beijing, China, 2006. Available online: https://www.dgav.pt/wp-content/uploads/2022/06/China-GB-5749-2006_Standards-for-Drinking-Water-Quality.pdf (accessed on 7 February 2025).
  37. GB 3838-2002; Environmental Quality Standard for Surface Water. National Standard of the People’s Republic of China: Beijing, China, 2002. Available online: https://english.mee.gov.cn/Resources/standards/water_environment/quality_standard/200710/t20071024_111792.shtml (accessed on 7 February 2025).
  38. Geng, T.; Ye, S.; Wang, Y.; Zhu, H.; Wang, X.; Liu, X. Conjugated microporous polymers-based fluorescein for fluorescence detection of 2,4,6-trinitrophenol. Talanta 2017, 165, 282–288. [Google Scholar] [CrossRef]
  39. Coutinho, A.; Prieto, M. Ribonuclease T1 and alcohol dehydrogenase fluorescence quenching by acrylamide: A laboratory experiment for undergraduate students. J. Chem. Educ. 1993, 70, 425. [Google Scholar] [CrossRef]
  40. Huang, R.; Yu, Z.; Li, Z.; Lin, X.; Hou, J.; Hu, Z.; Zou, J. Photoluminescent metal-organic frameworks and their composites: Fundamentals, applications, and outlooks. Coord. Chem. Rev. 2025, 526, 216358. [Google Scholar] [CrossRef]
  41. Xing, S.; Bing, Q.; Qi, H.; Liu, J.; Bai, T.; Li, G.; Shi, Z.; Feng, S.; Xu, R. Rational Design and Functionalization of a Zinc Metal–Organic Framework for Highly Selective Detection of 2,4,6-Trinitrophenol. ACS Appl. Mater. Interfaces 2017, 9, 23828–23835. [Google Scholar] [CrossRef]
  42. Razavi, S.A.A.; Morsali, A.; Piroozzadeh, M. A Dihydrotetrazine-Functionalized Metal–Organic Framework as a Highly Selective Luminescent Host–Guest Sensor for Detection of 2,4,6-Trinitrophenol. Inorg. Chem. 2022, 61, 7820–7834. [Google Scholar] [CrossRef]
  43. Gao, T.; Ma, Z.; Ren, Y.; Wang, Z.; Zhang, M.; Chen, X.; Wang, J. Highly sensitive fluorescent sensing and photocatalytic degradation performance of two-dimensional Tb-organic network. J. Rare Earths 2024, 42, 303–313. [Google Scholar] [CrossRef]
  44. Zhang, X.; Yan, Y.; Chen, F.; Bai, G.; Xu, H.; Xu, S. A Fluorescent Titanium-based Metal-Organic Framework Sensor for Nitro-aromatics Detection. Z. Anorg. Allg. Chem. 2021, 647, 759–763. [Google Scholar] [CrossRef]
  45. Liu, W.; Huang, X.; Chen, C.; Xu, C.; Ma, J.; Yang, L.; Wang, W.; Dou, W.; Liu, W. Function-Oriented: The Construction of Lanthanide MOF Luminescent Sensors Containing Dual-Function Urea Hydrogen-Bond Sites for Efficient Detection of Picric Acid. Chem. Eur. J. 2019, 25, 1090–1097. [Google Scholar] [CrossRef] [PubMed]
  46. Wang, X.; Lei, M.; Zhang, T.; Zhang, Q.; Zhang, R.; Yang, M. A water-stable multi-responsive luminescent Zn-MOF sensor for detecting TNP, NZF and Cr2O72− in aqueous media. Dalton Trans. 2021, 50, 3816–3824. [Google Scholar] [CrossRef]
  47. Zhao, Y.; Wang, C.; Li, J.; Li, Q.; Guo, Q.; Ru, J.; Ma, C.; Han, Y. A Eu(iii) metal–organic framework based on anthracenyl and alkynyl conjugation as a fluorescence probe for the selective monitoring of Fe3+ and TNP. RSC Adv. 2022, 12, 26945–26952. [Google Scholar] [CrossRef]
Scheme 1. A schematic diagram of the synthesis of L and Zn-Ms.
Chemosensors 13 00105 sch001
Figure 1. Crystal structure of Zn-M1: (a) the asymmetric unit (the two half-occupied PTA ligands were completed for clarity) (b) viewed along the a-axis and (c) the 2D framework viewed along b-axis (d) a 2D interpenetrated schematic.
Chemosensors 13 00105 g001
Figure 2. Crystal structure of Zn-M2 (a) the asymmetric unit (b) the BPA linked chain viewed along the a-axis, (c) the 2D framework viewed along the b-axis, and (d) the structure viewed along c-axis.
Chemosensors 13 00105 g002
Figure 3. PXRD patterns and TGA curves of Zn-M1 (a,b) and Zn-M2 (c,d).
Chemosensors 13 00105 g003
Figure 4. (a) UV–vis absorption and (b) fluorescence emission spectra of Zn-Ms in DMF.
Chemosensors 13 00105 g004
Figure 5. Quenching efficiency of (a) Zn-M1 and (b) Zn-M2 against NEs in DMF.
Chemosensors 13 00105 g005
Figure 6. Fluorescence quenching curves of (a) Zn-M1 and (c) Zn-M2 during titration of PA (the inline graphs show the SV curves). SV scatter plots and fitted Ksv values for (b) Zn-M1 and (d) Zn-M2 at low concentration of PA (1 mg/mL Zn-Ms DMF suspension).
Chemosensors 13 00105 g006
Figure 7. Five cycles test of (a) Zn-M1 and (b) Zn-M2 suspension (1 mg/mL) treated with PA (1 mM).
Chemosensors 13 00105 g007
Figure 8. UV-vis absorption spectra of PA and (a) fluorescence emission spectra (b) fluorescence excitation spectra of Zn-M1. UV-vis absorption spectra of PA and (c) fluorescence emission spectra (d) fluorescence excitation spectra of Zn-M2.
Chemosensors 13 00105 g008
Disclaimer/Publisher’s Note: The statements, opinions and data contained in all publications are solely those of the individual author(s) and contributor(s) and not of MDPI and/or the editor(s). MDPI and/or the editor(s) disclaim responsibility for any injury to people or property resulting from any ideas, methods, instructions or products referred to in the content.

