Article

¹H-NMR Spectroscopy and Chemometric Fingerprinting for the Authentication of Organic Extra Virgin Olive Oils

by
Silvana M. Azcarate
1,
Maria P. Segura-Borrego
2,
Rocío Ríos-Reina
2,* and
Raquel M. Callejón
2
1
Instituto de Ciencias de la Tierra y Ambientales de la Pampa, Facultad Ciencias Exactas y Naturales, Universidad Nacional de La Pampa, Santa Rosa L6300DUG, Argentina
2
Área de Nutrición y Bromatología, Facultad de Farmacia, Universidad de Sevilla, 41012 Sevilla, Spain
*
Author to whom correspondence should be addressed.
Chemosensors 2025, 13(5), 162; https://doi.org/10.3390/chemosensors13050162
Submission received: 12 March 2025 / Revised: 15 April 2025 / Accepted: 23 April 2025 / Published: 1 May 2025
(This article belongs to the Special Issue Chemometrics for Food, Environmental and Biological Analysis)

Abstract

:
The authentication of organic extra virgin olive oils (OEVOOs) is crucial for quality control and fraud prevention. This study applies proton-nuclear magnetic resonance (1H-NMR) spectroscopy combined with chemometric analysis as a non-destructive, untargeted approach to differentiate EVOOs based on cultivation method (organic vs. conventional) and variety (Hojiblanca vs. Picual). Principal component analysis (PCA) and partial least squares-discriminant analysis (PLS-DA) demonstrated well-defined sample differentiation, while the variable importance in projection (VIP) selection and Tukey’s test identified key spectral regions responsible for classification. The results showed that sterols and lipid-related compounds played a major role in distinguishing organic from conventional oils, whereas fatty acids and phenolic compounds were more relevant for cultivar differentiation. These findings align with known metabolic differences, where Picual oils generally exhibit higher polyphenol content, and a distinct fatty acid composition compared to Hojiblanca. The agreement between chemometric classification models and statistical tests supports the potential of 1H-NMR for OEVOO authentication. This method provides a comprehensive and reproducible metabolic fingerprint, enabling differentiation based on both agronomic practices and genetic factors. These findings suggest that 1H-NMR spectroscopy, coupled with multivariate analysis, could be a valuable tool for quality control and fraud detection in the olive oil industry.

1. Introduction

Olive oil is a product of great importance for Spain and has great international prestige, being one of the most exported products according to the data published in the Balanza Comercial Agroalimentaria 2023 (last published) of the Ministry of Economy, Trade and Enterprise [1]. Considering its importance, not only for Spain, but also for the European Union (EU), olive oil has several European regulations to protect both producers and consumers. Thus, the definitions of the different types of olive oil (OO) are established, and the most interesting due to its quality is the extra virgin olive oil (EVOO), which is defined as that oil obtained from the fruit of the olive tree exclusively by mechanical methods or other physical processes and containing a maximum free acidity in oleic acid of 0.8% [2,3]. In addition, these products must fulfill a series of organoleptic and physicochemical parameters to be considered in their corresponding categories, for example, acidity, peroxide value, and fatty acid composition [4].
Due to the growing consumer demand for high-quality products, both domestic and international markets have become increasingly stringent in their quality requirements. In response, the olive oil industry has, in recent years, embraced technological advancements aimed at enhancing product quality. As a result, quality and certification have become essential differentiators. Consequently, numerous producers and researchers have invested significant effort into producing and understanding how to achieve high-quality olive oils, despite the challenges posed by variable and often uncontrollable environmental, agronomic, and technological factors [5,6,7,8,9,10,11,12,13], especially affected by olive variety/cultivar and ripening stage [10,14,15,16].
By the end of 2023, the agricultural area dedicated to organic plant production in Spain reached 2,991,881 hectares, a 12% increase from the previous year, making up 12.51% of the total agricultural area [17]. Organic production combines environmental practices, biodiversity, resource conservation, and animal welfare, while meeting consumer demand for natural products. It provides both organic products for consumers and public goods like environmental protection and rural development [18,19]. Increased consumer demand for organic products, viewed as healthier and more environmentally friendly, has driven this shift, reducing chemical fertilizer use and greenhouse gas emissions [20,21]. Among organic products, organic extra virgin olive oil (OEVOO) is growing in market presence, with added value due to certification systems ensuring traceability. Studies comparing organic and conventional EVOOs are limited and often inconclusive due to uncontrolled variables. So, to obtain clear answers, more detailed studies with controlled conditions, that is, using samples obtained under the same conditions of climate, soil, variety, ripeness state, etc., are needed. At present, it is challenging to distinguish between OEVOOs and conventional EVOOs, as there are no established physicochemical or compositional markers that clearly differentiate them.
Over the past few decades, various analytical studies have been conducted comparing organic and conventional foods in terms of their chemical composition, sensory quality, and food safety aspects [22,23]. Traditional methods are based on determining the levels of several specific components or individual markers such as macronutrients (proteins, sugars, lipids), minerals, or minor components (vitamins, polyphenols, and other bioactive substances). These methods have proven to be useful, but they have limited potential for assessing food quality as well as for reliably determining the food production system [24,25]. This fact makes it necessary to search for differential markers of quality and authenticity of OEVOOs, and thus avoid possible fraud. Moreover, the benefits in organic products translate into higher prices in the market [26], so they can be susceptible to fraud in such a way that products with organic labeling are introduced into the market when they are not.
Consequently, there is a growing need for the development of rapid, cost-effective, and robust analytical techniques that can differentiate between OEVOO and conventional EVOO. Among the most promising approaches are non-targeted, non-destructive spectroscopic techniques such as nuclear magnetic resonance (NMR), infrared (IR), and Raman spectroscopy, especially when combined with multivariate statistical analysis (chemometrics). These methods have been successfully used to classify olive oils by quality grade or geographical origin [27,28,29,30,31,32,33,34]. However, applications specifically focused on differentiating OEVOOs from conventional EVOOs remain scarce and have largely relied on targeted analytical techniques like chromatography [35].
NMR spectroscopy, particularly ¹H-NMR, is a robust and versatile technique that has shown great potential for food analysis due to its ability to provide detailed molecular information from complex matrices without requiring extensive sample preparation [36]. Its applications include food authentication and classification, as well as quality control [37]. The advantages of NMR are that they are non-destructive analyses and can be used without the need to separate or purify the sample, allowing it to analyze multicomponent systems such as food. In comparison to other spectroscopies, NMR provides an in-depth understanding of the molecular composition, identifying and quantifying many various components simultaneously. Thus, it also allows quantitative analysis since there is proportionality between the number of nuclei causing the signal and the area of the signal. Also, combining NMR with statistical analysis provides greater applications for food classification and nutritional studies [38,39,40,41], 1H-NMR measurements being the most used, probably due to its high sensitivity and short relaxation times. Thus, compared to other vibrational spectroscopic techniques such as near-infrared (NIR) or Fourier-transform infrared (FTIR) spectroscopy, which are commonly applied in olive oil analysis due to their rapidity and low cost, 1H-NMR offers significant advantages in terms of resolution, reproducibility, and the ability to extract structural information [42]. While NIR and FTIR spectra are based on functional group vibrations and typically require calibration models for component quantification, 1H-NMR provides absolute quantitative and structural data without the need for external standards. This allows for the simultaneous detection and quantification of a wide range of compounds, including minor metabolites that are relevant for authentication purposes.
Although NMR instrumentation is less widespread in routine food quality laboratories, its capacity to deliver reproducible, detailed, and multiplexed chemical profiles makes it a powerful and complementary technique for the comprehensive characterization of extra virgin olive oils. Specifically, 1H-NMR has been gaining importance in the characterization of olive oils. Thus, it can be used to detect the authenticity and quality of olive oil, as well as providing information on its geographical origin, variety, aging, and adulteration [28,29,30,31]. Using 1H-NMR spectroscopy, information on fatty acids, phenols, sterols, and other minor components present in olive oil can be obtained [43,44]. Despite its growing application in olive oil analysis, to date, 1H-NMR has not been employed for the authentication of organic cultivation in extra virgin olive oil, representing an unexplored yet promising approach in this field [45].
In this context, the aim of this work was to assess the potential of the ¹H-NMR profile combined with different chemometric tools to characterize and differentiate extra virgin olive oils (EVOOs) according to two key variables: the production system (organic vs. conventional) and the olive variety. Although the experimental design employed is not entirely novel, the strength of this study lies in the evaluation of variables that have not been extensively investigated under controlled conditions. By using samples obtained under identical agronomic and technological conditions—differing only in the type of cultivation—this work provides valuable insights into the specific impact of the production system and cultivar on the chemical profile of EVOOs. This approach sets a new benchmark for precision in olive oil characterization.

2. Materials and Methods

2.1. Sample Collection

A total of 26 EVOO samples were analyzed in this study: 13 organic EVOOs and 13 conventional EVOOs. All samples were obtained from Picual and Hojiblanca olive cultivars harvested in 2021 and 2022 at the experimental farm La Mina, part of the Institute for Agricultural and Fisheries Research and Training of Andalusia (IFAPA). This farm is located in the town of Cabra, in the foothills of the Subbética mountain ranges, and includes both organic and conventional cultivation. The farm is located at coordinates 37°29′36.4″ N, 4°25′45.8″ W, within a continental Mediterranean climate zone characterized by dry summers and mild winters. Rainfall occurs from autumn to spring, with a mean annual precipitation of 400 mm. The average annual temperature is 17 °C, ranging from 1.3 °C in winter to 43 °C in summer. Therefore, all samples were obtained under the same environmental and climatic conditions, with the only variable being the type of cultivation. Thus, the olive trees were subjected to two different cultivation methods—organic and conventional—and were randomly selected from among the most heavily loaded trees to ensure proper sampling. Olive harvesting was performed by randomly hand-picking healthy fruits (without any type of infection or physical damage) during different ripening stages. Immediately after harvest, the olives were processed using standard industrial-scale two-phase centrifugation at the certified oil mill located within the La Mina farm. The resulting EVOOs were collected, either filtered or left unfiltered (as indicated in Table 1), and stored in dark glass bottles at 4 °C until analysis.
In summary, the 26 samples included two olive varieties (Hojiblanca and Picual) obtained at different ripening stages (I, II, III), in two different seasons (1: 2021; 2: 2022) and by two different cultivation methods (organic and conventional). Although ripening stage and harvest year were not the main factors under study, they were intentionally included in the sampling design to reflect the natural variability observed in commercial EVOO production. These variables were evenly distributed across the experimental groups (varieties and cultivation methods) to prevent confounding effects and to ensure that the observed differences could be primarily attributed to the studied factors. Table 1 shows more information on the samples under study.
It should be highlighted that although the sample set was limited to a single geographical location, this decision was made to reduce environmental and agronomic variability and ensure full traceability of the certified EVOOs. This design enabled a controlled evaluation of the effects of cultivation mode and variety on the 1H-NMR fingerprint. Nonetheless, future studies should include a broader range of samples from multiple regions to assess the robustness and generalizability of the proposed methodology.

2.2. 1H-NMR Analysis

Duplicate measurements were performed at a 300 K temperature on a Bruker Avance NEO 400 MHz spectrometer (Bruker Biospin GmbH Rheinstetten, Karlsruhe, Germany) with a BBI inverse detection probe with gradient on the Z-axis. Samples were prepared by mixing in a 1.8 mL cryovial, 214 mL of oil with 972 mL of a deuterated chloroform containing 0.03% tetramethylsilane (TMS) as a reference (Merck KGaA, Darmstadf, Germany). The mixture was stirred for 10 s, and 0.6 mL of the mixture was transferred to a 5 mm diameter NMR tube (Deutero GmbH, Kastellaun, Germany). The tube with the sample was placed in an ultrasonic bath for 10 s.
Two measurements’ conditions were tested: the first one was a conventional 1H experiment with single pulse at 300 K: 90° pulse, relaxation delay of 4 s, spectral width of 8196 Hz, with 64 k points as the size of the FID, 16 scans, and 4 dummy scans; and the second one consisted of a 1H experiment with presaturation of the most intense signals of the lipids in the 1H spectrum, also at 300 K. For this purpose, a pulse program corresponding to a modified version of the Bruker 1D NOESY presat experiment noesygpps1d, in which no presaturation was performed during the mixing time, was used, with a mixing time of 10 ms, using a shaped pulse containing 20 frequency values for the presaturation. The rest of the parameters were the same as those used in the previous experiment, except the size of the FID (32 k points) and the number of scans (64). Finally, the second experiment was chosen because irradiating the strongest signals yielded a 1H spectrum with a better signal-to-noise ratio of the minority signals, allowing for the observation of the minority components of the oil, which could be useful for the differentiation sought. These spectra were processed automatically using the processing automation programs provided by TopSpin 2.1 (2013) for Bruker’s Olive Oil ProfilingTM, which include an extension of the FID by forward linear prediction to 64 k points, using 8 k coefficients, zero filling by addition of 192 k zeros, an exponential window function with an LB of 0.3, automatic phase correction of order 0, and automatic baseline adjustment.
The region of the selected NMR spectra ranged from 0 ppm to 10 ppm. TopSpin 2.1 (2013) and Amix-Viewer 3.7.7 (2006) from Bruker BioSpin GMBH (Rheinstetten, Germany) were used to perform the processing of the spectra.

2.3. Data Analysis and Software

Prior to data analysis, several preprocessing steps were applied to the spectra, including spectral alignment using Icoshift algorithm to correct for pH-induced chemical shift variations [46]. The aligned 1H-NMR dataset, which consists of 52 samples (i.e., 26 samples per duplicate) × 19,851 variables, was then preprocessed by group scaling followed by mean centering, applied by using the PLS_Toolbox 9.1 under Matlab environment (2019b). For that, the 1H-NMR spectra were segmented into 18 equal-width chemical shift intervals, and group scaling + mean centering was applied prior to multivariate analysis. This approach was selected to reduce the dominance of regions with high signal density and to ensure a balanced contribution of all spectral regions in multivariate analyses. Group scaling is particularly suited to 1H-NMR data due to its high variable resolution, and it allows for improved interpretability of chemometric models. The choice of 18 intervals was based on preliminary evaluations comparing different segmentation strategies (e.g., 15, 18, 20 bins), with 18 intervals providing optimal performance in classification and visualization as well as according to the previous knowledge of NMR chemical shifts of the main olive oil compounds [29,47,48,49]. The specific ranges of the 18 intervals are provided in Supplementary Table S1 and each spectrum shown in Figure S1, in the Supplementary Materials.
Although this study was mainly an untargeted approach, a preliminary assignment of the identified components in the 1H-NMR spectrum was achieved by using both Chenomx NMR Suite 7.0 (Chenomx, Edmonton, AB, Canada) and assignments reported in the literature [29,47,48,49]. Thus, the different signals were annotated according to the Metabolomics Standards Initiative (MSI) identification levels [50]. Most compounds were identified at level 2 (putative identification) based on spectral similarity to library data, whereas others were annotated at level 3 (putative compound classes) when only partial structural information was available. The inability to associate several regions of the NMR spectra with a single signal was caused by the overlap of multiple multiplets, which hindered precise identification. Alternatively, these regions could be attributed to the overall contribution of a class of compounds.
Finally, principal component analysis (PCA) was applied, and classification models were developed based on partial least-discriminant analysis (PLS-DA) with (a) the full spectra; and (b) the selected variables with importance in prediction (VIPs). To select the appropriate number of latent variables for each PLS-DA model, the minimum classification error rate calibration (CAL) and cross-validation (CV, venetian blind) were assessed. All these analyses were performed using PLS Toolbox 9.1 working under MATLAB environment (2019b, MathWorks Inc., Natick, MA, United States).
In addition, a two-way statistical analysis of variance (ANOVA), followed by a post hoc comparison test (Tukey’s test, p < 0.05) were performed with the variables selected as VIPs and samples grouped into different sets: organic (O) vs. conventional (C); Hojiblanca (H) vs. Picual (P); Hojiblanca Conventional (HC) vs. Hojiblanca Organic (HO); Picual Conventional (PC) vs. Picual Organic (PO); Hojiblanca Conventional (HC) vs. Picual Conventional (PC); and Hojiblanca Organic (HO) vs. Picual Organic (PO). The statistical model included cultivation method (organic vs. conventional) and variety (Hojiblanca vs. Picual) as independent factors, since these were the variables that showed the most pronounced influence on the 1H-NMR data based on the multivariate models. In contrast, ripening stage and harvest year were not included in the model, as they were not the focus of this study and were not balanced as experimental factors. These analyses were performed by the INFOSTAT software 2016 (FCA, Universidad Nacional de Córdoba, Córdoba, Argentina).

3. Results and Discussion

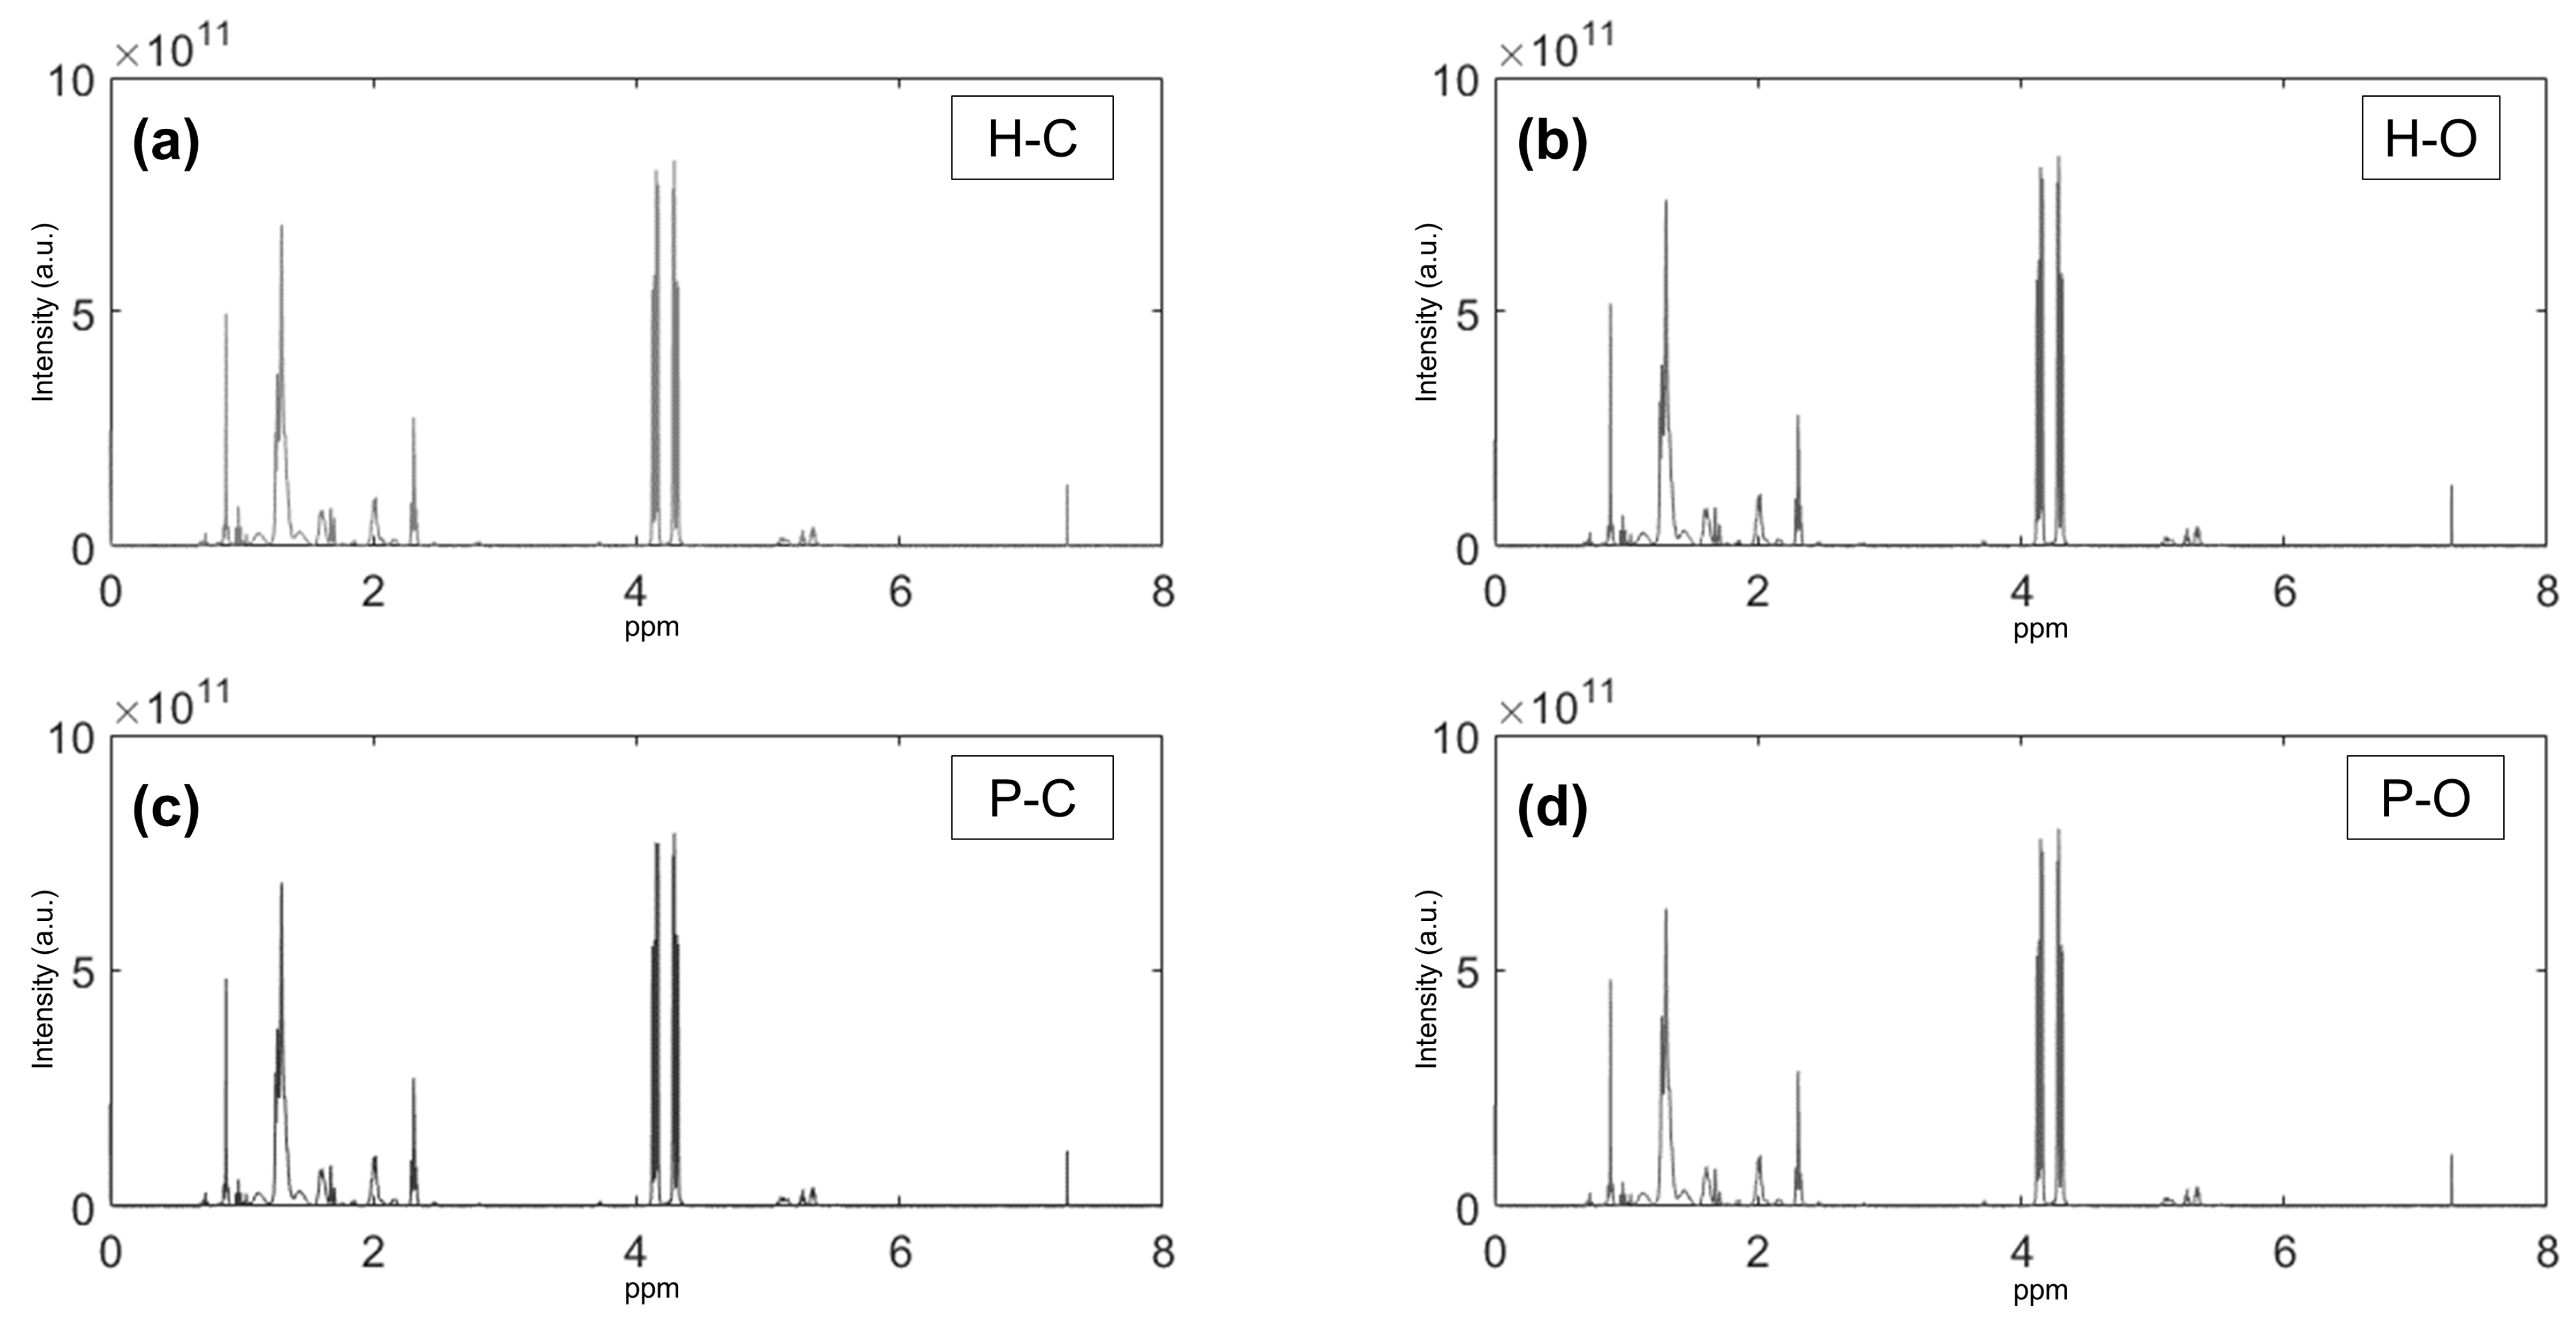
3.1. Visualization and Interpretation of 1H-NMR Spectra of Extra Virgin Olive Oils

Figure 1 showed the mean 1H-NMR spectra of the different EVOOs according to the olive variety (Hojiblanca—H and Picual—P) and the cultivation modality (conventional—C and organic—O). By simple visualization, it could be seen that the spectra seemed to be very similar.
The chemical shifts of 1H-NMR signals of the major and some minor compounds in EVOOs, as well as their assignments to protons of the different functional groups are gathered in Table 2.
As could be seen in the spectra (Figure 1), the highest signals in the spectra were presented around 4–4.4 ppm (also shown in interval #13, Figure S1 Supplementary Material), which corresponded to triacylglycerides, the major components of olive oil [41,47]. The second highest signal was shown around 0.8–1.4 ppm (also shown in intervals #4 and #5, Figure S1), and it is related to fatty acids, mainly saturated (palmitic, stearic) or oleic, linoleic and linolenic [47]. Moreover, there are minor components that are more difficult to observe in the spectra due to their lowest intensity, and which are more difficult to identify. Some of these minor signals have been identified as cycloartenol (around 0.3 ppm), phenolic compounds (around 5 ppm), terpenes (around 4.4–5 ppm), and dialdehyde of secoiridoids such as oleuropein, ligstroside, and oleocanthal identified in the spectral range of 7.3–9.7 ppm [47,48,49], which have been described as the major phenolic compounds in EVOOs [35].

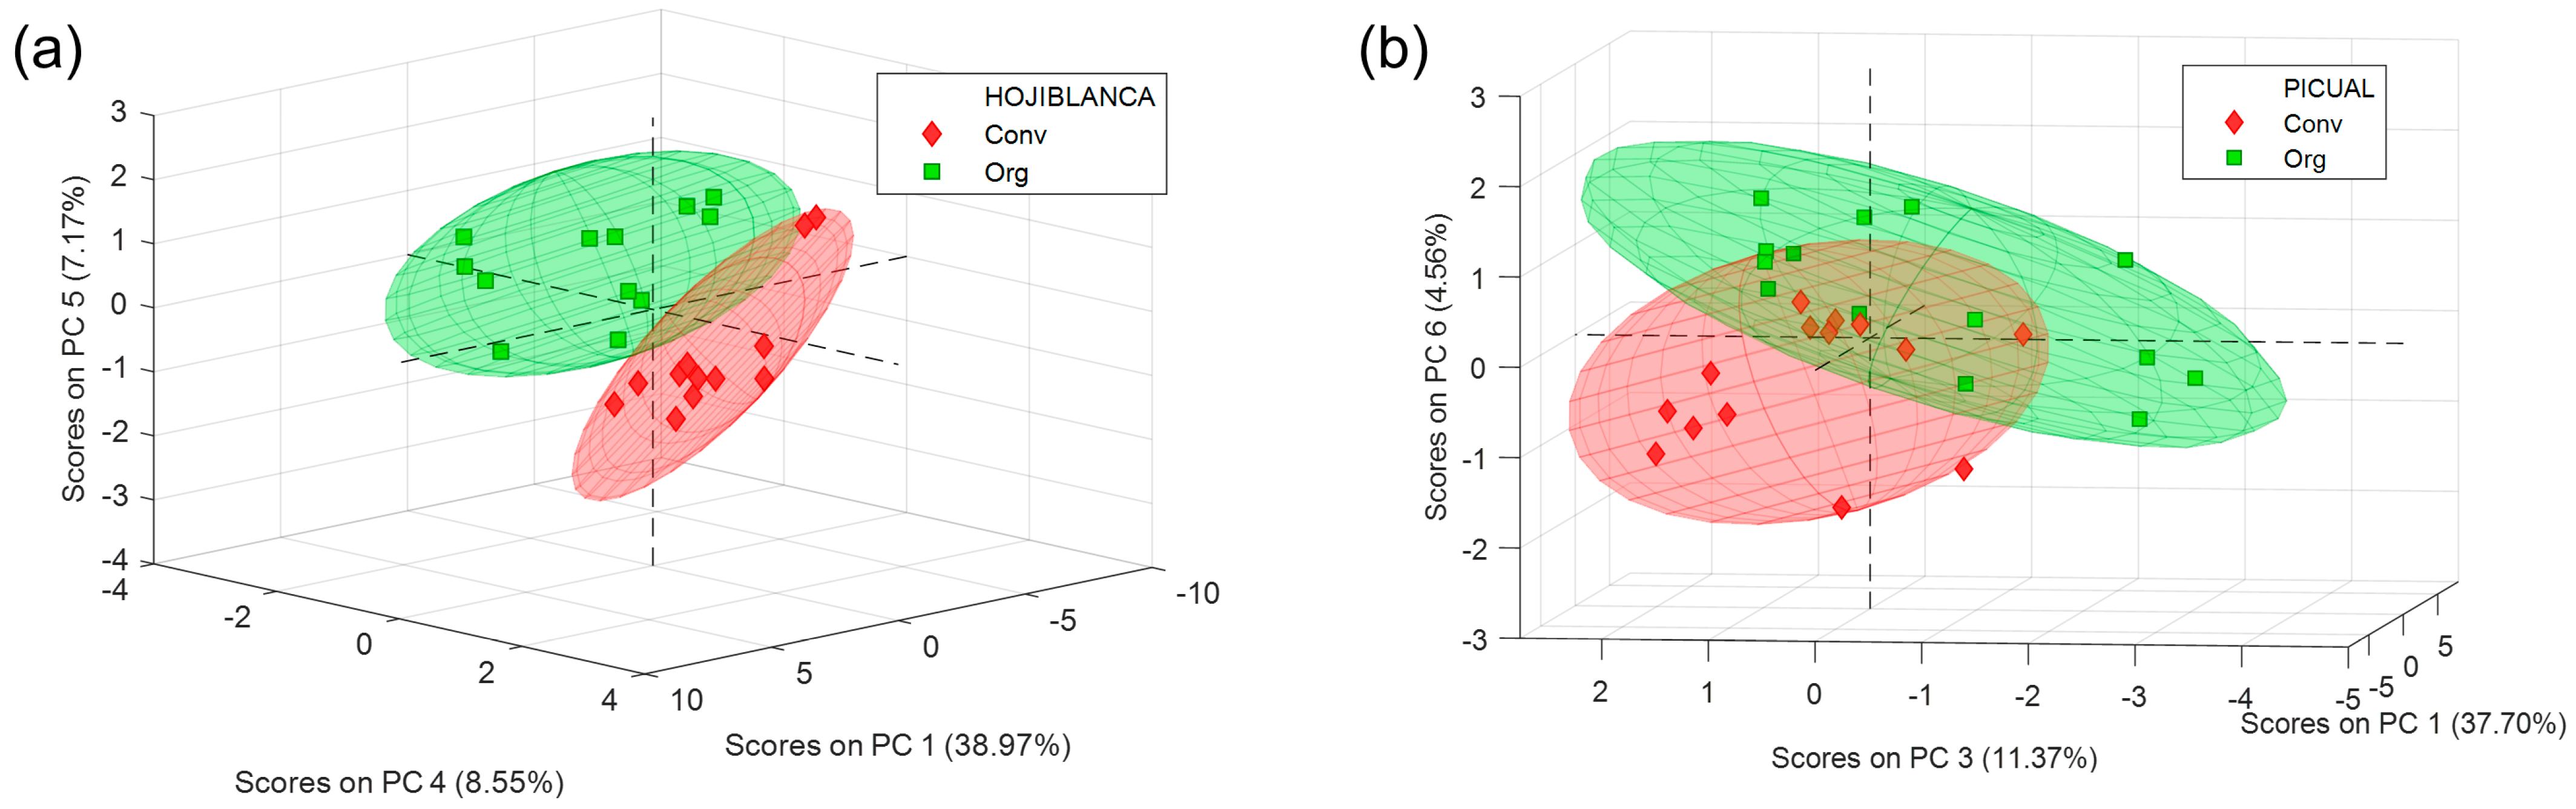
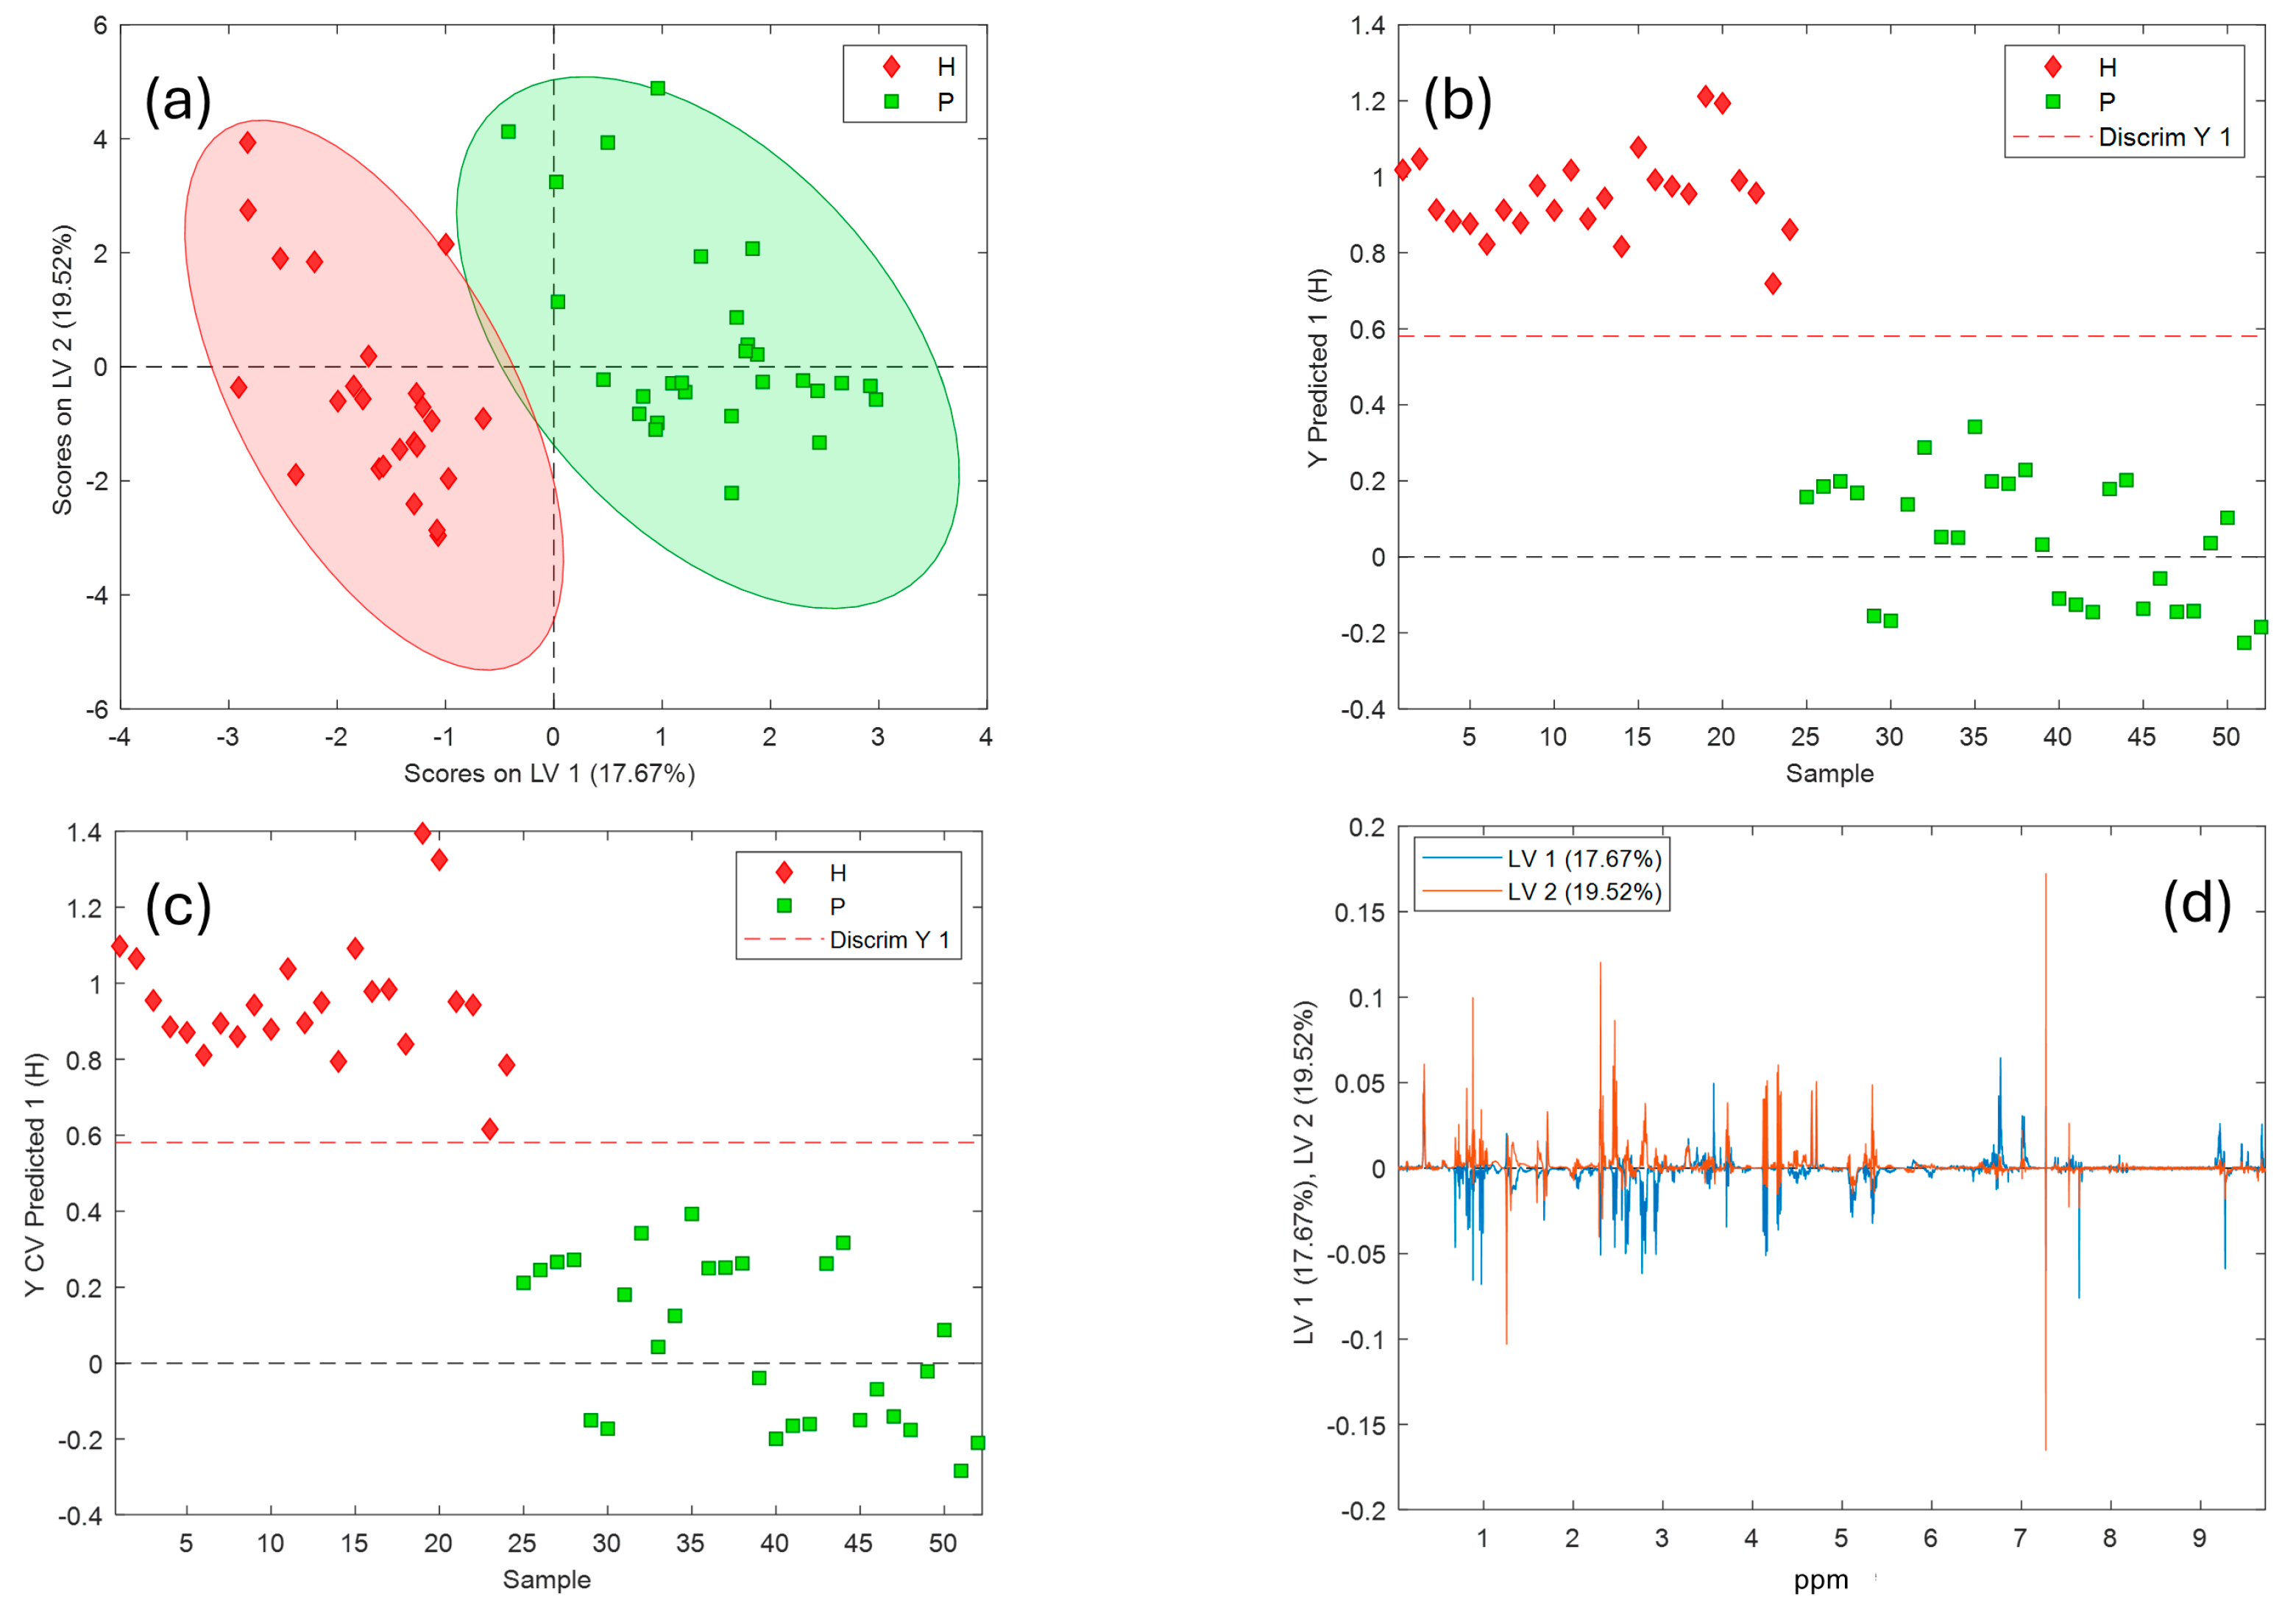
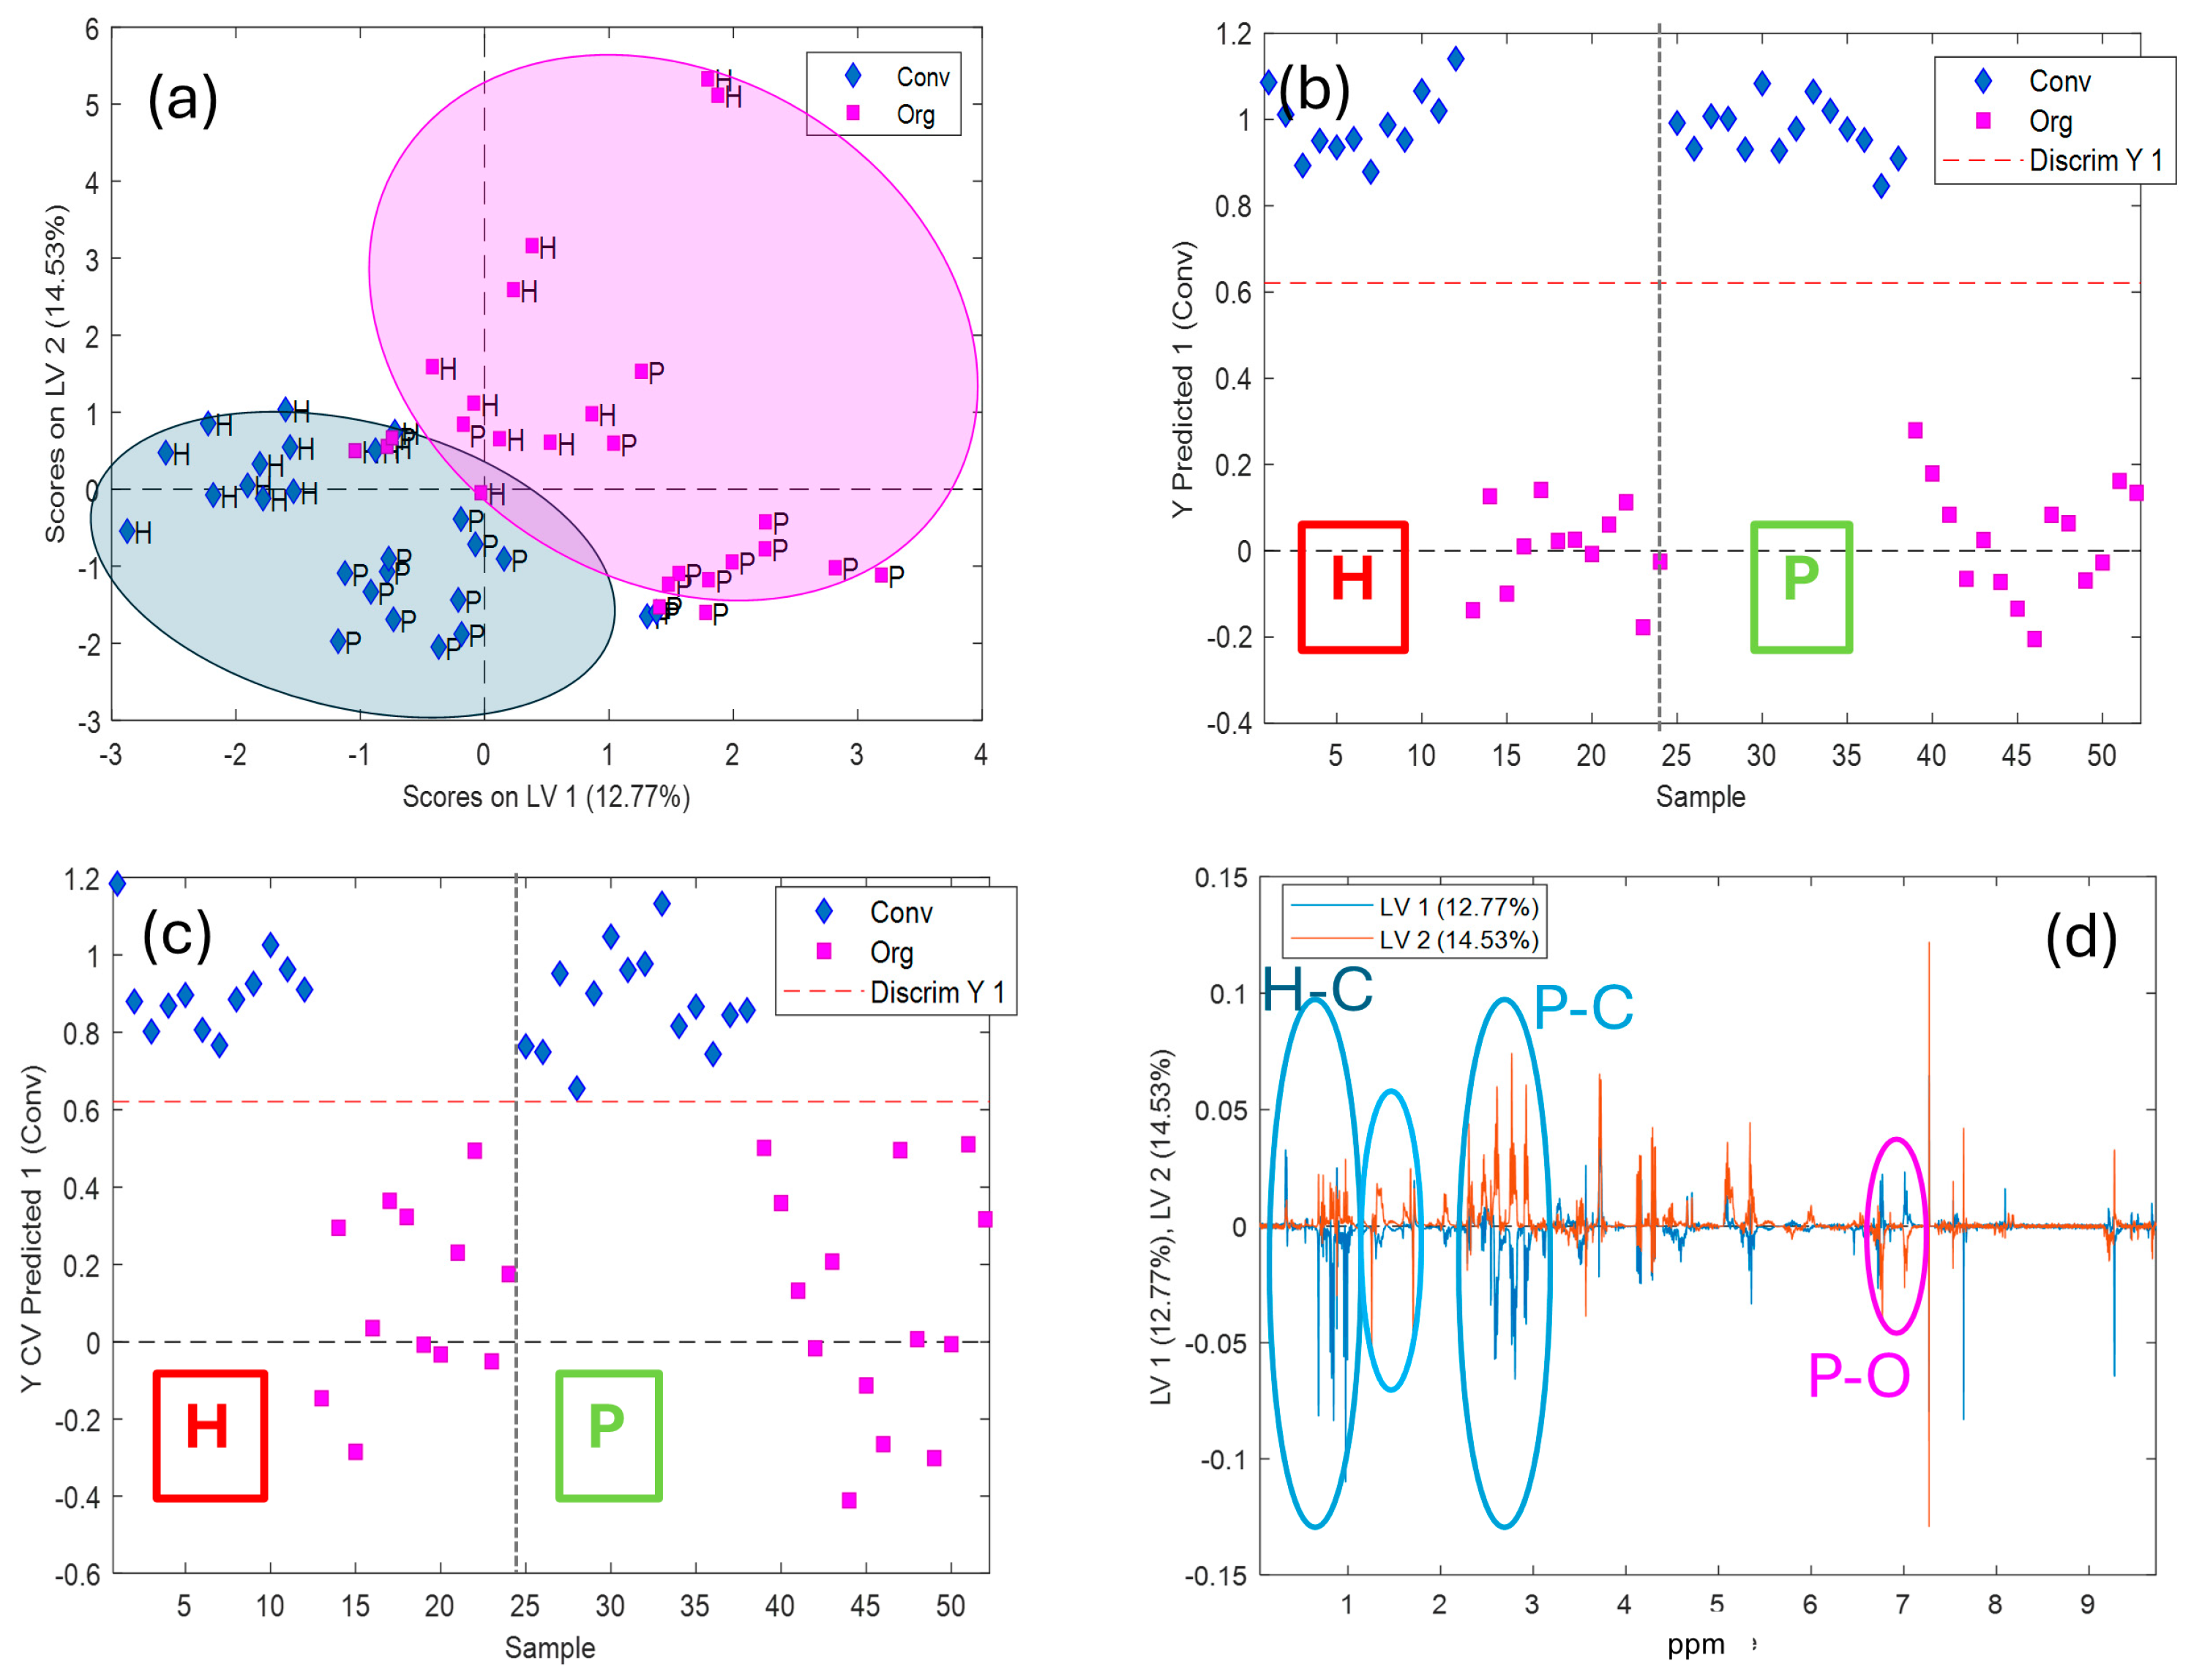
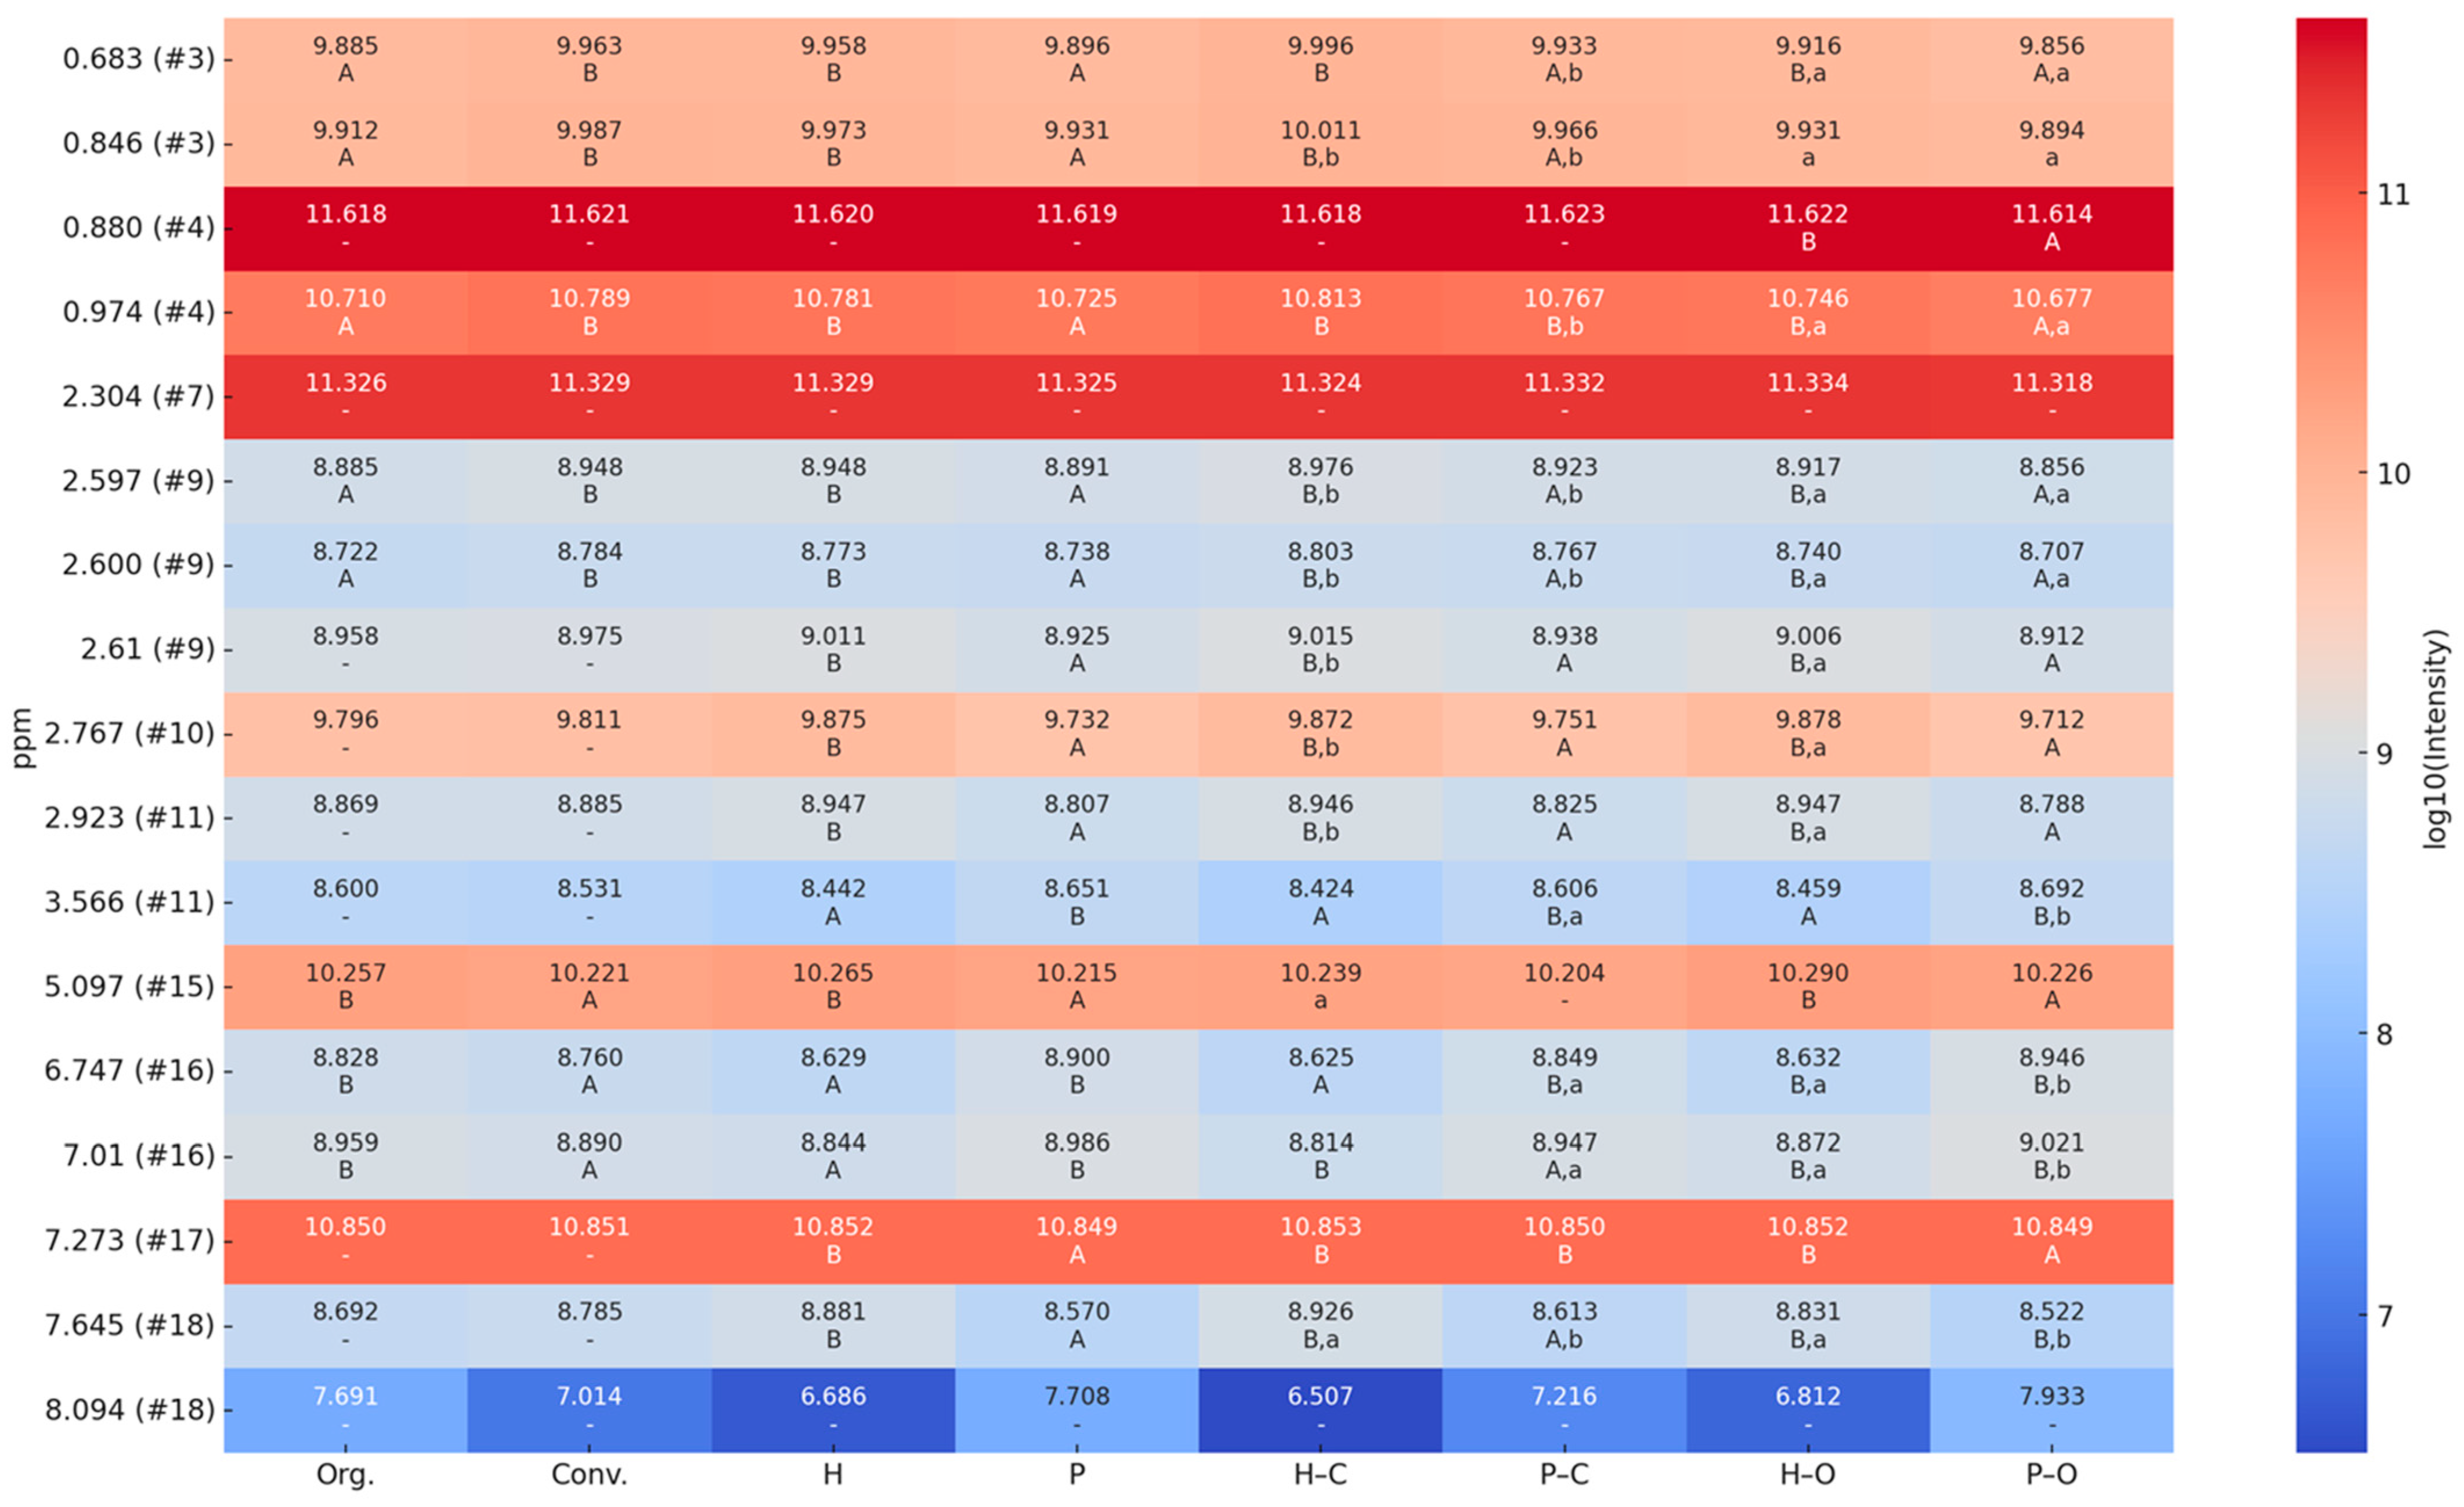
3.2. Differentiation and Classification of Extra Virgin Olive Oils According to the Variety, Cultivation Method, Rippening or Harvest Year

Despite a simple visualization of the spectra did not allow us to see any differences between varieties or modalities, when a PCA model is performed to the preprocessed 1H-NMR spectra (Figure 2), the first differentiation or grouping was shown in the scores plot according to the olive variety (Figure 2c). Thus, Hojiblanca samples were clearly differentiated from Picual samples by using the three first principal components (PCs), adding up to a total of 60.47% of explained variance. As for the differentiation of the cultivation modality (Figure 2a,b), this is most clearly seen when each variety is considered separately (scores and loadings plots shown in Figure 3 and Figure S3 Supplementary Material, respectively). The same applies to ripening stage and harvest year, which showed no clear grouping when all the samples are considered together in the PCA (Figure S2. Supplementary Material), confirming that these variables had a limited influence in this study compared to cultivar and cultivation method.
As the exploration of the 1H-NMR data seemed to show the possibility of differentiating all the classes, different PLS-DA models were achieved using the complete NMR dataset or subset datasets according to the variety, the cultivation modality, or the cultivation modality within each variety (Table 3). According to the results, satisfactory PLS-DA models for all the classification tasks were achieved, and around 100% of correct classification was obtained for calibration (CAL) and cross-validation (CV). No external validation was performed due to the limited sample size.
The PLS-DA plot of the variety differentiation (Hojiblanca-H and Picual-P) is shown in Figure 4. The first two latent variables (LV1 and LV2) scores, explaining 38% of the total variance, allow a good separation of the two varieties, independently of the cultivation modality. Specifically, as could be seen in Figure 4a, LV1 contributes mainly to the discrimination between olive oils from the Hojiblanca variety (in the left side of LV1) and the Picual variety (placed in the right side of LV1). By looking at the loadings plot (Figure 4d), the most discriminant regions correspond to intervals #3 (0.5–0.8 ppm) and from interval #7 to interval #10 (2.2–3.0 ppm), showing a high value in the Hojiblanca samples, and from interval #16 to interval #18 (5.7–9.7 ppm), with higher values in the Picual samples (i.e., higher values of phenolic compounds and compounds such as oleuropein).
Regarding the cultivation modality (conventional—Conv and organic—Org) classification (Figure 5), the most important variables on the PLS-DA model could be selected by looking at the loadings plots (Figure 5d). Thus, intervals #2, #12, #14, and #18, identified as cycloartenol, unknown terpenes and aldehydes of secoiridoids, seemed to be more related to organic samples, while the NMR signals of the intervals #3, #9, and #10, identified as sterol, beta-sitosterol or stigmasterol, and linolenic acid (Table 2) showed higher relevance in conventional samples.
To search for the most relevant variables for discrimination of EVOO according to the cultivation modality, the variables with importance in prediction (VIP) were selected from the PLS-DA model and then a new PLS-DA model was performed only with those selected variables. To perform it faster, the variables with VIP values higher than 4 were selected (listed in Table S2 Supplementary Materials). This procedure was rebuilt as many times as the classification results were not affected [51,52,53,54]. Thus, in this case, three PLS-DA models were performed, reducing the variables from 19851 to 69, maintaining the same classification results as with the total spectral range.
Then, ANOVA and Tukey’s tests were performed on the intensity of the selected resonances of the remaining 69 important variables, following the approach of D’Imperio et al. (2007) [27], to highlight the possible spectral differences according to the cultivation method and olive variety. These 69 variables were grouped according to the spectral region and their mean intensity was calculated prior ANOVA. The results are presented as a heatmap (Figure 6), showing log10-transformed mean intensity values along with the corresponding Tukey’s test groupings to facilitate interpretation.
The results obtained from the Tukey’s test, based on the mean intensity of the NMR spectral regions identified as VIPs in the PLS-DA analysis, are now presented as a heatmap (Figure 6), providing clearer evidence of differentiation between EVOO samples according to their production method (organic vs. conventional) and cultivar (Hojiblanca vs. Picual). Several spectral regions exhibited statistically significant differences between sample groups, highlighting the relevance of specific molecular components in the authentication of EVOOs. The presence of different letters (A, B, a, b) denotes statistically distinct clusters, reinforcing the effectiveness of the VIP-PLS-DA approach in selecting the most relevant discriminatory variables.
Thus, the signal at 0.683 ppm (s), tentatively assigned to β-sitosterol or stigmasterol, and at 0.974 ppm (d), attributed to saturated and unsaturated fatty acids (linolenic, oleic, and linoleic acids), showed significant higher mean intensities in conventional samples compared to organic ones. This suggests that agronomic practices influence the sterol and fatty acid profiles, likely due to differences in fertilization regimes and metabolic pathways associated with conventional cultivation. Specifically, sterol composition, including β-sitosterol and stigmasterol, is known to be significantly affected by agronomic factors such as growing area, cultivation practices, climate, variety, and ripening stage [55]. Similarly, Oliveras López (2005) [56] reported that fertilizer type and cultivation techniques can alter the proportion of saturated and unsaturated fatty acids in olive oil, reinforcing the idea that agricultural management plays a key role in determining oil composition.
Conversely, the region at 5.097 ppm (m), related to triacylglycerides, presented significant distinctions between conventional and organic EVOOs, with additional differentiation observed between Hojiblanca and Picual varieties. Since triacylglycerides influence the oxidative stability and sensory profile of EVOO, their differentiation is crucial for authentication purposes [57,58].
The region at 6.747 ppm (s + q), attributed to phenolic compounds, showed a marked difference between groups, with a tendency for higher intensities in organic EVOOs. In fact, it has been demonstrated that organic agriculture induces higher stress in plants due to the absence of synthetic pesticides and fertilizers, leading to increased production of defense compounds and phenolic metabolites [35]. Moreover, signals at 7.01 ppm (t + d), likely associated with aldehydes from secoiridoids, revealed significant variation and a higher intensity for organic samples. These compounds are the most complex and abundant polyphenols in the EVOO polar fraction, playing a key role in its organoleptic traits [15]. These results support that the phenolic profile was influenced by both genetic (variety) and environmental (cultivation method) factors, such as the amount of fertilizer, as was previously reported for other organic food [35,59,60]. Therefore, the specific regions related to sterols, phenolic compounds, and secoiridoid derivatives exhibited clear distinctions between organic and conventional EVOOs, which may be attributed to variations in fertilization, irrigation, and overall cultivation practices.
Regarding variety differentiation, the differences observed in specific lipidic, and phenolic regions align with known compositional variations between Hojiblanca and Picual cultivars. Thus, the aldehydic form of secoiridoids (7.53–9.72 ppm), including oleuropein and ligstroside derivatives, and oleocanthal, was more prominent in Picual oils. Picual EVOOs are typically richer in polyphenols [35,39,61], which may explain the observed distinctions in the secoiridoid aldehyde regions. In addition, the observed triacylglyceride variations could relate to different oxidative stabilities between organic and conventional oils.
Overall, the specific regions related to sterols, fatty acids, phenolic compounds, and secoiridoid derivatives showed clear distinctions between organic and conventional EVOOs, likely reflecting differences in fertilization, irrigation, and overall cultivation practices [35,62]. Similarly, the observed differences in lipidic and phenolic regions align with the known compositional variations between Hojiblanca and Picual cultivars. Picual oils, being typically richer in polyphenols, displayed higher intensity signals in secoiridoid aldehyde regions [63,64], whereas triacylglyceride variations suggest potential differences in oxidative stability between organic and conventional oils [35,65].
Furthermore, these results could provide further evidence that the differentiation is not solely dictated by the organic vs. conventional classification but is also cultivar dependent. Notably, some spectral regions, and therefore compounds, exhibit strong cultivar-based differentiation within the same production method, while others are more affected by organic/conventional practices regardless of cultivar.
The classification results obtained from the PLS-DA models applied to individual spectral intervals are shown in Table 4. Additional model performance metrics, including classification errors, RMSE values, and explained variance, are provided in Table S4 Supplementary Material, to support the robustness of the PLS-DA models presented in Table 4. These results provided further insight into the specific regions of the ¹H-NMR spectra that contribute most to the differentiation of EVOOs based on cultivation method (organic vs. conventional) and variety (Hojiblanca vs. Picual). The observed classification patterns agreed with the results obtained from the VIP-selected variables and Tukey’s test analysis, reinforcing the role of sterols, fatty acids, triacylglycerides, and phenolic compounds in defining the metabolic profile of EVOOs.
As shown in Table 4, the classification results indicate that despite all the selected intervals as VIPs, they had a strong influence in the differentiation of the EVOOs according to the cultivation and variety, specifically intervals #9 and #3 shown to play a major role in distinguishing organic and conventional EVOOs. Interval #9 (unidentified compound) achieved the highest classification accuracy for calibration (CAL), with 88.46% for conventional and 84.62% for organic samples, showing a similar trend in cross-validation (CV) (85.71% and 84.62%). This suggests that the metabolic signals in this region are strongly associated with agricultural practices, potentially influenced by fertilization and environmental conditions. Although the peaks present in the spectrum are not fully identified at this point, it is highly relevant to note that this area warrants further investigation. A more detailed study would help elucidate the compounds that may be present, as they could represent distinctive characteristics of the analyzed oils. Additionally, this finding indicates that this range may contain key information that has been scarcely explored in previous studies, particularly for this specific type of oil. It is likely that, due to the complexity or lack of systematic focus in this region, these peaks have not received the necessary attention in earlier research. Therefore, a deeper analysis of this area could provide a more accurate understanding of the compounds involved and their potential impact on the oil’s characteristics. Regarding interval #3 (β-sitosterol or stigmasterol), it also contributed significantly to differentiation, with 84.62% accuracy in CAL for both classes and slightly lower values in cross-validation (80.77% for conventional and 76.92% for organic). The role of sterols in metabolic pathways influenced by agronomic factors aligns with previous results showing differences in sterol content between organic and conventional oils. This agrees with the fact that the genetic component and agronomic factors have been shown to influence the sterol composition of virgin olive oils [55]. Moreover, these results are further supported by the Tukey’s test, where sterol-related regions were significantly different between cultivation methods, reinforcing their potential as untargeted spectral markers for organic EVOO authentication.
Regarding varietal classification, intervals #11 (polyunsaturated fatty acids (linoleic and linolenic acids) and #16 (phenolic compounds and secoiridoid aldehydes) exhibited the strongest discriminatory power. Interval #11 (linoleic and linolenic acids) displayed high classification accuracy for CAL, with 91.67% for Hojiblanca and 92.86% for Picual, maintaining strong performance in CV (85.71% for both varieties). These results confirm that fatty acid composition is highly cultivar dependent, aligning with prior knowledge that Picual oils generally exhibit higher unsaturated fatty acid content than Hojiblanca [66]. Similarly, interval #16 (phenolic compounds and secoiridoid aldehydes, including ligstroside derivatives) showed classification accuracies of 87.50 in CAL and 83.33% in CV for Hojiblanca and 92.86 in CAL and 89.29% in CV for Picual, reinforcing the idea that phenolic content, particularly secoiridoid derivatives, plays a key role in cultivar differentiation. This agreed with previous findings indicating that Picual olive oils tend to be richer in polyphenols than Hojiblanca olive oils [67]. Moreover, these results were consistent with Tukey’s test results, which also highlighted the higher intensity of secoiridoid aldehydes in Picual samples and the relevance of fatty acid profiles in distinguishing varieties. The agreement between chemometric classification models and statistical analysis strengthens the validity of these spectral regions as discriminatory markers for olive oil authentication.
Overall, the analysis of classification accuracy across spectral intervals reveals that different molecular components contribute to EVOO differentiation depending on the classification criterion. Sterols and unidentified lipid-related compounds (intervals #3 and #9) are particularly relevant for distinguishing organic from conventional oils, whereas fatty acids (interval #11) and phenolic compounds (interval #16), although they showed differentiation between cultivation methods, play a greater role in cultivar differentiation (Hojiblanca vs. Picual).
These results confirm that the application of 1H-NMR in oil studies, particularly by focusing on specific spectral ranges, allows for significant optimization in both analysis time and data processing. By narrowing the analysis to a defined range, the need to record the full spectrum is reduced, which can make the process more efficient.

4. Conclusions

This study demonstrates the potential of ¹H-NMR spectroscopy combined with chemometric analysis as a non-destructive and untargeted approach for distinguishing organic and conventional extra virgin olive oils (EVOOs) as well as the variety. The observed spectral differences in sterols, fatty acids, triacylglycerides, and phenolic compounds suggest that both agricultural practices and olive cultivar play a key role in EVOO composition.
The results from PCA exploration and PLS-DA classification models indicate that organic and conventional EVOOs, as well as different cultivars, exhibit distinct metabolic profiles. While the preliminary classification models achieved full separation, further validation is needed to confirm their predictive accuracy. These findings support the tentative use of ¹H-NMR-based metabolomics for EVOO authentication, highlighting its potential as a tool for traceability and quality control. Specifically, organic EVOOs exhibited higher levels of bioactive compounds, such as secoiridoid derivatives and phenolic compounds, which may result from environmental stress responses in organic farming. Conversely, conventional EVOOs showed higher sterol concentrations, potentially influenced by differences in metabolic regulation due to fertilization practices. Additionally, the study confirms that cultivar choice significantly impacts EVOO composition, with Picual oils displaying higher polyphenol content than Hojiblanca, reinforcing the role of genetic factors in metabolic differentiation. Overall, these findings suggest that ¹H-NMR spectroscopy, coupled with multivariate statistical analysis, could be a valuable approach for EVOO authentication. However, future studies should focus on expanding the sample set and performing external validation to strengthen the reliability of this classification methodology.
In addition, this approach would enable the use of more accessible NMR equipment, including portable devices, which are particularly suitable for in situ analysis and more cost-effective and practical studies. Its use for oil studies could revolutionize the way analyses are conducted, as it would allow for faster and more efficient decision making, without the delays associated with sample transportation or data processing in laboratories. Currently, the control of organic oils is primarily based on documentation rather than chemical analysis, highlighting the need for more advanced analytical techniques. These portable devices, being more compact and accessible, would also reduce the costs associated with analysis, while still providing relevant and accurate results due to the focus on specific spectral ranges. In summary, the approach of focusing on a specific spectral range not only optimizes the analysis process but also paves the way for the implementation of portable equipment and in situ analysis, offering a more practical and cost-effective option for the industry.

Supplementary Materials

The following supporting information can be downloaded at: https://www.mdpi.com/article/10.3390/chemosensors13050162/s1, Figure S1: Intervals created from the OEVOOs 1H-NMR spectra, divided into 18 regions based on the NMR chemical shifts of key compounds to facilitate data interpretation and multivariate analysis.; Figure S2: Score plots of the PCA model shown in Figure 2 obtained with the 1H-NMR data colored by: (a) harvest year (2021 vs. 2022); and (b) ripening stage (I, II, III).; Figure S3: PCA loading plots obtained from the 1H-NMR spectra of (a) Hojiblanca and (b) Picual EVOO samples, corresponding to the principal components (PCs) shown in the score plots of Figure 3; Table S1: Chemical shift ranges (ppm) of the 18 intervals used for 1H-NMR spectral group scaling prior to multivariate analysis.; Table S2: Selected variables with VIP scores > 4 from the PLS-DA model based on the full 1H-NMR spectral dataset.; Table S3: Mean values and standard deviation of the intensity (arbitrary units) of the selected 1H-NMR variables as VIPs for the differentiation of EVOOs according to the production method (organic vs. conventional), cultivar (Hojiblanca vs. Picual), and their interactions. Different letters in different columns indicate significant differences according to Tukey’s test (p < 0.05); Table S4: Performance metrics of the PLS-DA models built for each selected NMR interval used in classification in Table 4.

Author Contributions

Conceptualization, R.M.C. and S.M.A.; methodology, R.R.-R. and M.P.S.-B.; software, S.M.A.; validation, R.R.-R., S.M.A., and M.P.S.-B.; formal analysis, S.M.A. and R.R.-R.; investigation, S.M.A. and R.R.-R.; resources, R.M.C.; data curation, S.M.A.; writing—original draft preparation, S.M.A. and R.R.-R.; writing—review and editing, R.M.C. and M.P.S.-B.; supervision, R.M.C.; project administration and funding acquisition, R.M.C. All authors have read and agreed to the published version of the manuscript.

Funding

This research was funded by the European Regional Development Fund (FEDER) and the Junta de Andalucía, grant number US-1380836 within the FEDER Operational Program 2014–2020.

Institutional Review Board Statement

Not applicable.

Informed Consent Statement

Not applicable.

Data Availability Statement

The raw data supporting the conclusions of this article will be made available by the authors on request.

Acknowledgments

The authors would like to thank the European Regional Development Fund (FEDER) and the Junta de Andalucía, for funding the project with reference US-1380836 within the FEDER Operational Program 2014–2020 as well as for supporting Segura-Borrego’s postdoctoral contract. They would also like to thank the VI Plan Propio de Investigación y Transferencia of the University of Seville for supporting Ríos-Reina’s current contract (contract number USE-18644-Z).

Conflicts of Interest

The authors declare no conflicts of interest.

Abbreviations

The following abbreviations are used in this manuscript:
EVOOExtra virgin olive oil
OEVOOOrganic extra virgin olive oil
HHojiblanca
PPicual
CALCalibration
CVCross-validation
PCAPrincipal component analysis
PLS-DAPartial least-discriminant analysis

References

  1. Ministerio de Industria, Comercio y Turismo. Balanza Comercial Agroalimentaria 2022. Gobierno de España. 2022. Available online: https://comercio.gob.es/ImportacionExportacion/Informes_Estadisticas/Historico_Balanza/Balanza_Comercial_Agroalimentaria_2022.pdf (accessed on 1 January 2025).
  2. Regulation (EU) No 1308/2013 of the European Parliament and of the Council of 17 December 2013 establishing a common organization of the markets in agricultural products and repealing Council Regulations (EEC) No 922/72, (EEC) No 234/79, (EC) No 1037/2001 and (EC) No 1234/2007. Official Journal of the European Union, L 347, 20 December 2013, pp. 671–854. Available online: https://eur-lex.europa.eu/legal-content/EN/TXT/?uri=CELEX%3A32013R1308 (accessed on 28 January 2025).
  3. Commission Delegated Regulation (EU) 2022/2104 of 29 July 2022 supplementing Regulation (EU) No 1308/2013 of the European Parliament and of the Council as regards marketing standards for olive oil, and repealing Commission Regulation (EEC) No 2568/91 and Commission Implementing Regulation (EU) No 29/2012. Official Journal of the European Union, L 283, 4 November 2022, pp. 1–36. Available online: https://eur-lex.europa.eu/legal-content/EN/TXT/?uri=CELEX%3A32022R2104 (accessed on 15 January 2025).
  4. Commission Implementing Regulation (EU) 2022/2105 of 29 July 2022 laying down rules on conformity checks of marketing standards for olive oil and methods of analysis of the characteristics of olive oil. Official Journal of the European Union, L 283, 4 November 2022, pp. 37–73. Available online: https://eur-lex.europa.eu/legal-content/EN/TXT/?uri=CELEX%3A32022R2105 (accessed on 15 January 2025).
  5. Jiménez, B.; Callejón, R.; Sánchez-Ortiz, A.; Ortega, E.; Lorenzo, M.L.; Rivas, A. Agronomic parameters, quality indices, and sensory attributes of virgin olive oils from Hojiblanca and Picudo varieties from three successive crop years. Eur. J. Lipid Sci. Technol. 2014, 116, 1647–1653. [Google Scholar] [CrossRef]
  6. Patumi, M.; D’andria, R.; Marsilio, V.; Fontanazza, G.; Morelli, G.; Lanza, B. Olive and olive oil quality after intensive monocone olive growing (Olea europaea L.; cv. Kalamata) in different irrigation regimes. Food Chem. 2002, 77, 27–34. [Google Scholar] [CrossRef]
  7. Sánchez-Ortiz, A.; Pérez, A.G.; Sanz, C. Cultivar Differences on Nonesterified Polyunsaturated Fatty Acid as a Limiting Factor for the Biogenesis of Virgin Olive Oil Aroma. J. Agric. Food Chem. 2007, 55, 7869–7873. [Google Scholar] [CrossRef]
  8. Morales-Sillero, A.; García, J.M.; Torres-Ruiz, J.M.; Monteo, A.; Sánchez-Ortiz, A.; Fernández, J.E. Is the productive performance of olive trees under localized irrigation affected by leaving some roots in drying soil? Agric. Water Manag. 2013, 123, 79–92. [Google Scholar] [CrossRef]
  9. Jiménez, B.; Sánchez-Ortiz, A.; Rivas, A. Influence of the malaxation time and olive ripening stage on oil quality and phenolic compounds of virgin olive oils. Int. J. Food Sci. Technol. 2014, 49, 2521–2527. [Google Scholar] [CrossRef]
  10. Jiménez, B.; Sánchez-Ortiz, A.; Lorenzo, M.L.; Rivas, A. Effect of organic cultivation of Picual and Hojiblanca olive varieties on the quality of virgin olive oil at four ripening stages. Eur. J. Lipid Sci. Technol. 2014, 116, 1634–1646. [Google Scholar] [CrossRef]
  11. Bengana, M.; Bakhouche, A.; Lozano-Sánchez, J.; Amir, Y.; Youyou, A.; Segura-Carretero, A.; Fernández-Gutiérrez, A. Influence of olive ripeness on chemical properties and phenolic composition of Chemlal extra-virgin olive oil. Food Res. Int. 2013, 54, 1868–1875. [Google Scholar] [CrossRef]
  12. Sola-Guirado, R.R.; Castro-García, S.; Blanco-Roldán, G.L.; Jiménez-Jiménez, F.; Castillo-Ruiz, F.J.; Gil-Ribes, J.A. Traditional olive tree response to oil olive harvesting technologies. Biosyst. Eng. 2014, 118, 186–193. [Google Scholar] [CrossRef]
  13. Hermoso, M.; González, J.; Uceda, M.; García-Ortiz, A.; Morales, J.; Frías, L.; Fernández, A. Production of quality oil. In Obtained by the Two-Phase System; Ministry of Agriculture and Fisheries, Junta de Andalucía: Cordoba, Spain, 1996; ISBN 84-87564-17-8. [Google Scholar]
  14. Jiménez Herrera, B.; Rivas, A.; Sánchez-Ortiz, A.; Lorenzo Tovar, M.L.; Ubeda Muñoz, M.; Callejón, R.M.; Ortega Bernaldo De Quirós, E. Influencia del proceso de maduración del fruto en la calidad sensorial de aceites de oliva virgen de las variedades Picual, Hojiblanca y Picudo. Grasas Aceites 2012, 63, 1–154. [Google Scholar] [CrossRef]
  15. Jimenez, B.; Sánchez-Ortiz, A.; Lorenzo, M.L.; Rivas, A. Effect of agronomical practices on the nutritional quality of virgin olive oil at different ripening stages. J. Am. Oil Chem. Soc. 2015, 92, 1491–1501. [Google Scholar] [CrossRef]
  16. Jiménez, B.; Rivas, A.; Lorenzo, M.L.; Sánchez-Ortiz, A. Chemosensory characterization of virgin olive oils obtained from organic and conventional practices during fruit ripening. Flavour Fragr. J. 2017, 32, 294–304. [Google Scholar] [CrossRef]
  17. Ministerio de Agricultura, Pesca y Alimentación. Estadísticas 2022: Producción Ecológica. Gobierno de España. 2022. Available online: www.mapa.gob.es/eu/alimentacion/temas/produccion-eco/caracterizacion2022_defconnipo_tcm35-690262.pdf (accessed on 15 January 2025).
  18. Council Regulation (EC) No 834/2007 of 28 June 2007 on organic production and labelling of organic products and repealing Regulation (EEC) No 2092/91. Official Journal of the European Union, L 189, 20 July 2007, pp. 1–23. Available online: https://eur-lex.europa.eu/legal-content/EN/TXT/?uri=CELEX%3A32007R0834 (accessed on 20 January 2025).
  19. Commission Implementing Regulation (EU) 2021/1165 of 15 July 2021 authorizing certain products and substances for use in organic production and establishing their lists. Official Journal of the European Union, L 253, 16 July 2021, pp. 13–104. Available online: https://eur-lex.europa.eu/legal-content/EN/TXT/?uri=CELEX%3A32021R1165 (accessed on 18 January 2025).
  20. Domínguez-Gento, A.; Di Giorgi, R.; García-Martínez, M.D.; Raigón, M.D. Effects of Organic and Conventional Cultivation on Composition and Characterization of Two Citrus Varieties ‘Navelina’ Orange and ‘Clemenules’ Mandarin Fruits in a Long-Term Study. Horticulturae 2023, 9, 721. [Google Scholar] [CrossRef]
  21. Smith, L.G.; Kirk, G.J.; Jones, P.J.; Williams, A.G. The greenhouse gas impacts of converting food production in England and Wales to organic methods. Nat. Commun. 2019, 10, 4641. [Google Scholar] [CrossRef] [PubMed]
  22. Garcia, J.M.; Teixeira, P. Organic versus conventional food: A comparison regarding food safety. Food Rev. Int. 2017, 33, 424–446. [Google Scholar] [CrossRef]
  23. Lairon, D. Nutritional quality and safety of organic food. A review. Agron. Sustain. Dev. 2010, 30, 33–41. [Google Scholar] [CrossRef]
  24. Lairon, D.; Huber, M.S. Organic Farming, Prototype for Sustainable Agricultures; Bellon, S., Penvern, S., Eds.; Springer: Berlin/Heidelberg, Germany, 2014. [Google Scholar] [CrossRef]
  25. Bahar, B.; Schmidt, O.; Moloney, A.P.; Scrimgeour, C.M.; Begley, I.S.; Monahan, F.J. Seasonal variation in the C, N and S stable isotope composition of retail organic and conventional Irish beef. Food Chem. 2008, 106, 1299–1305. [Google Scholar] [CrossRef]
  26. Lösel, H.; Brockelt, J.; Gärber, F.; Teipel, J.; Kuballa, T.; Seifert, S.; Fischer, M. Comparative Analysis of LC-ESI-IM-qToF-MS and FT-NIR Spectroscopy Approaches for the Authentication of Organic and Conventional Eggs. Metabolites 2023, 13, 882. [Google Scholar] [CrossRef]
  27. D’Imperio, M.; Mannina, L.; Capitani, D.; Bidet, O.; Rossi, E.; Bucarelli, F.M.; Quaglia, G.B.; Segre, A. NMR and statistical study of olive oils from Lazio: A geographical, ecological and agronomic characterization. Food Chem. 2007, 105, 1256–1267. [Google Scholar] [CrossRef]
  28. Maestrello, V.; Solovyev, P.; Bontempo, L.; Mannina, L.; Camin, F. Nuclear magnetic resonance spectroscopy in extra virgin olive oil authentication. Compr. Rev. Food Sci. Food Saf. 2022, 21, 4056–4075. [Google Scholar] [CrossRef]
  29. Mannina, L.; Sobolev, A.P. High resolution NMR characterization of olive oils in terms of quality, authenticity and geographical origin. Magn. Reson. Chem. 2011, 49, 53–511. [Google Scholar] [CrossRef]
  30. Longobardi, F.; Ventrella, A.; Napoli, C.; Humpfer, E.; Schuetz, B.; Schaefer, H.; Kontominas, M.G.; Sacco, A. Classification of olive oils according to geographical origin by using 1H NMR fingerprinting combined with multivariate analysis. Food Chem. 2012, 130, 177–183. [Google Scholar] [CrossRef]
  31. Fragaki, G.; Spyros, A.; Siragakis, G.; Salivaras, E.; Dais, P. Detection of Extra Virgin Olive Oil Adulteration with Lampante Olive Oil and Refined Olive Oil Using Nuclear Magnetic Resonance Spectroscopy and Multivariate Statistical Analysis. J. Agric. Food Chem. 2005, 53, 2810–2816. [Google Scholar] [CrossRef]
  32. Ortiz-Romero, C.; Ríos-Reina, R.; García-González, D.L.; Cardador, M.J.; Callejón, R.M.; Arce, L. Comparing the potential of IR-spectroscopic techniques to gas chromatography coupled to ion mobility spectrometry for classifying virgin olive oil categories. Food Chem. X 2023, 19, 100738. [Google Scholar] [CrossRef] [PubMed]
  33. Philippidis, A.; Kontzedaki, R.; Orfanakis, E.; Fragkoulis, N.; Zoumi, A.; Germanaki, E.; Samartzis, P.C.; Velegrakis, M. Classification of Greek extra virgin olive oils by Raman spectroscopy in conjunction with sensory and cultivation characteristics, and multivariate analysis. JSFA Rep. 2023, 3, 486–493. [Google Scholar] [CrossRef]
  34. Ríos-Reina, R.; Salatti-Dorado, J.A.; Ortiz-Romero, C.; Cardador, M.J.; Arce, L.; Callejón, R.M. A comparative study of fluorescence and Raman spectroscopy for discrimination of virgin olive oil categories: Chemometric approaches and evaluation against other techniques. Food Control 2024, 158, 110250. [Google Scholar] [CrossRef]
  35. López-Yerena, A.; Lozano-Castellón, J.; Olmo-Cunillera, A.; Tresserra-Rimbau, A.; Quifer-Rada, P.; Jiménez, B.; Pérez, M.; Vallverdú-Queralt, A. Effects of Organic and Conventional Growing Systems on the Phenolic Profile of Extra-Virgin Olive Oil. Molecules 2019, 24, 1986. [Google Scholar] [CrossRef]
  36. Hatzakis, E. Nuclear Magnetic Resonance (NMR) Spectroscopy in Food Science: A Comprehensive Review. Compr. Rev. Food Sci. Food Saf. 2019, 18, 189–220. [Google Scholar] [CrossRef] [PubMed]
  37. Marcone, M.F.; Wang, S.; Albabish, W.; Somnarain, D.; Hill, A.; Nie, S. Diverse food-based applications of nuclear magnetic resonance (NMR) technology. Food Res. Int. 2013, 51, 729–747. [Google Scholar] [CrossRef]
  38. Guido, F.P.; Birgit, U.J.; Lankin, D.C. Quantitative 1H NMR:  Development and Potential of a Method for Natural Products Analysis. J. Nat. Prod. 2005, 68, 133–149. [Google Scholar] [CrossRef]
  39. Cao, R.; Liu, X.; Liu, X.; Zhai, X.; Cao, T.; Wang, A.; Qiu, J. Applications of nuclear magnetic resonance spectroscopy to the evaluation of complex food constituents. Food Chem. 2021, 342, 128258. [Google Scholar] [CrossRef]
  40. Belton, P.S.; Colquhoun, I.J.; Hills, B.P. Applications of NMR to Food Science. In Annual Reports on NMR Spectroscopy; Academic Press: Cambridge, MA, USA, 1993; Volume 26, pp. 1–53. [Google Scholar] [CrossRef]
  41. Sacco, A.; Brescia, M.A.; Liuzzi, V.; Reniero, F.; Guillou, C.; Ghelli, S.; van der Me, P. Characterization of Italian Olive Oils Based on Analytical and Nuclear Magnetic Resonance Determinations. JAOCS 2000, 77, 6. [Google Scholar] [CrossRef]
  42. Segura-Borrego, M.P.; Azcarate, S.M.; Amigo, J.M.; Morales, M.L.; Callejón, R.M.; Ríos-Reina, R. Analysis of Beverages. In Non-invasive and Non-Destructive Methods for Food Integrity; Jiménez-Carvelo, A.M., Arroyo-Cerezo, A., Cuadros-Rodríguez, L., Eds.; Springer: Cham, Switzerland, 2024. [Google Scholar] [CrossRef]
  43. Maggio, R.M.; Kaufman, T.S.; Del Carlo, M.; Cerretani, L.; Bendini, A.; Cichelli, A.; Compagnone, D. Monitoring of fatty acid composition in virgin olive oil by 1H NMR relaxometry: A comparison with gas chromatography. J. Agric. Food Chem 2009, 57, 1722–1730. [Google Scholar] [CrossRef]
  44. Paiva-Martins, T.; Pronto, N.M.M.; Santos, J.L.V. Phenolic compounds in olive oils by NMR. Magn. Reson. Chem. 2020, 58, 1007–1020. [Google Scholar]
  45. Ruiz-Aracama, A.; Goicoechea, E.; Guillén, M.D. Direct study of minor extra-virgin olive oil components without any sample modification. 1H NMR multisupression experiment: A powerful tool. Food Chem. 2017, 228, 301–314. [Google Scholar] [CrossRef]
  46. Pandey, A.K.; Buchholz, C.R.; Nathan Kochen, N.; Pomerantz, W.C.K.; Braun, A.R.; Sachs, J.N. pH Effects Can Dominate Chemical Shift Perturbations in 1H,15N-HSQC NMR Spectroscopy for Studies of Small Molecule/α-Synuclein Interactions. ACS Chem. Neurosci. 2023, 14, 800–808. [Google Scholar] [CrossRef] [PubMed]
  47. Mannina, L.; Segre, A. High resolution nuclear magnetic resonance: From chemical structure to food authenticity. Grasas Aceites 2002, 53, 22–33. [Google Scholar] [CrossRef]
  48. Alonso-Salces, R.M.; Gallo, B.; Collado, M.I.; Sasía-Arriba, A.; Viacava, G.E.; García-González, D.L.; Gallina Toschi, T.; Servili, M.; Berrueta, L.Á. 1H–NMR fingerprinting and supervised pattern recognition to evaluate the stability of virgin olive oil during storage. Food Control 2021, 123, 107831. [Google Scholar] [CrossRef]
  49. Sánchez-López, E. Construcción de Una Base de Datos de Aceites de Oliva Virgen Extra Andaluces Basada en Técnicas de IR, RMN, Raman e IRMS. Doctoral Thesis, Universidad de Córdoba, Córdoba, Spain, 2014. Available online: https://helvia.uco.es/xmlui/handle/10396/12375 (accessed on 15 February 2025).
  50. Sumner, L.W.; Amberg, A.; Barrett, D.; Beale, M.H.; Beger, R.; Daykin, C.A.; Fan, T.W.M.; Fiehn, O.; Goodacre, R.; Griffin, J.L.; et al. Proposed minimum reporting standards for chemical analysis. Metabolomics 2007, 3, 211–221. [Google Scholar] [CrossRef]
  51. Rubio-Sánchez, R.; Ríos-Reina, R.; Ubeda, C. Effect of chemotherapy on urinary volatile biomarkers for lung cancer by HS-SPME-GC-MS and chemometrics. Thorac. Cancer 2023, 14, 3522–3529. [Google Scholar] [CrossRef]
  52. Wagner, M.; Heredia, J.Z.; Segura-Borrego, M.P.; Morales, M.L.; Camiña, J.M.; Azcarate, S.M.; Callejón, R.M.; Ríos-Reina, R. Identification of potential volatile markers for characterizing Argentine wine vinegars based on their production process. Talanta Open 2024, 10, 100370. [Google Scholar] [CrossRef]
  53. Ubeda, C.; Cortejosa, D.; Morales, M.L.; Callejón, R.M.; Ríos-Reina, R. Determination of volatile compounds for the differentiation of PDO fortified wines with different ageing methods as a tool for controlling their authenticity. Food Res. Int. 2023, 173, 113320. [Google Scholar] [CrossRef]
  54. Rodríguez-Hernández, P.; Cardador, M.J.; Ríos-Reina, R.; Sánchez-Carvajal, J.M.; Galán-Relaño, Á.; Jurado-Martos, F.; Luque, I.; Arce, L.; Gómez-Laguna, J.; Rodríguez-Estévez, V. Detection of Mycobacterium tuberculosis complex field infections in cattle using fecal volatile organic compound analysis through gas chromatography-ion mobility spectrometry combined with chemometrics. Microbiol. Spectr. 2023, 11, e01743-23. [Google Scholar] [CrossRef]
  55. Kyçyk, O. Influencia del Componente Genético y Factores Agronómicos en la Composición de los Esteroles del Aceite de Oliva Virgen. Doctoral Thesis, Universidad de Jaén, Jaén, España, 2009. Available online: https://ruja.ujaen.es/jspui/bitstream/10953/721/1/9788484399988.pdf (accessed on 20 February 2025).
  56. Oliveras López, M.J. Calidad del Aceite de Oliva Virgen Extra: Antioxidantes y Función Biológica. Doctoral Thesis, Universidad de Granada, Granada, España, 2005. Available online: https://digibug.ugr.es/bitstream/handle/10481/746/15519387.pdf (accessed on 18 February 2025).
  57. Blasi, F.; Pollini, L.; Cossignani, L. Varietal Authentication of Extra Virgin Olive Oils by Triacylglycerols and Volatiles Analysis. Foods 2019, 8, 58. [Google Scholar] [CrossRef] [PubMed]
  58. Mateos, R.; Trujillo, M.; Pérez-Camino, M.C.; Moreda, W.; Cert, A. Relationships between Oxidative Stability, Triacylglycerol Composition, and Antioxidant Content in Olive Oil Matrices. J. Agric. Food Chem. 2005, 53, 5766–5771. [Google Scholar] [CrossRef] [PubMed]
  59. Hallmann, E.; Lipowski, J.; Marszalek, K.; Rembialkowska, E. The seasonal variation in bioactive compounds content in juice from organic and non-organic tomatoes. Plant Foods Hum. Nutr. 2013, 68, 171–176. [Google Scholar] [CrossRef] [PubMed]
  60. Gravel, V.; Blok, W.; Hallmann, E.; Carmona-Torres, C.; Wang, H.Y.; Van de Peppel, A.; Còndor Golec, A.F.; Dorais, M.; Van Meeterens, U.; Heuvelink, E.; et al. Differences in N uptake and fruit quality between organically and conventionally grown greenhouse tomatoes. Agron. Sustain. Dev. 2010, 30, 797–806. [Google Scholar] [CrossRef]
  61. Garcia, A.; Brenes, M.; Romero Barranco, C.; Garcia, P.; Garrido Fernández, A. Study of phenolic compounds in virgin olive oils of the Picual variety. Eur. Food Res. Technol. 2002, 215, 407–412. [Google Scholar] [CrossRef]
  62. Akcan, T. Comparative Study of Fatty Acid and Sterol Profiles in Olive Oils from Different Regions. Molecules 2024, 29, 1104. [Google Scholar] [CrossRef]
  63. El Riachy, M.; Moubarak, P.; Al Hawi, G.; Geha, M.; Mushantaf, W.; Estaphan, N.; Skaff, W. Phenolic and Fatty Acid Profiles of Virgin Olive Oils from Local and European Cultivars Grown in Lebanon. Plants 2023, 12, 2681. [Google Scholar] [CrossRef]
  64. Zanetic, M.; Spika, M.J.; Ozic, M.M.; Bubola, K.B. Comparative Study of Volatile Compounds and Sensory Profiles of Monovarietal Olive Oils from Four Dalmatian Cultivars. Plants 2021, 10, 1995. [Google Scholar] [CrossRef]
  65. Jimenez, B.; Sánchez-Ortiz, A.; Lorenzo, M.L.; Rivas, A. Effect of Organic Farming on Picual and Hojiblanca Olive Oil Quality. Eur. J. Lipid Sci. Technol 2014, 116, 1502–1512. [Google Scholar] [CrossRef]
  66. Rodrigues, N.; Casal, S.; Pinho, T.; Cruz, R.; Baptista, P.; Martín, H.; Asensio-S-Manzanera, M.C.; Peres, A.M.; Pereira, J.A. Olive oil characteristics of eleven cultivars produced in a high-density grove in Valladolid province (Spain). Eur. Food Res. Technol. 2021, 247, 3113–3122. [Google Scholar] [CrossRef]
  67. García, A.; Brenes, M.; García, P.; Romero, C.; Garrido, A. Phenolic content of commercial olive oils. Eur. Food Res. Technol. 2003, 216, 520–525. [Google Scholar] [CrossRef]
Figure 1. Mean 1H-NMR spectra of EVOO samples according to olive variety (Hojiblanca [H] and Picual [P]) and cultivation modality (conventional [C] and organic [O]). (a) Hojiblanca Conventional; (b) Hojiblanca Organic; (c) Picual Conventional; (d) Picual Organic.
Chemosensors 13 00162 g001
Figure 2. Scores plots (ac) and loadings plots (d) showing the contribution of each chemical shift variable (in ppm) to the first three principal component (PC1, PC2, and PC3) from the PCA model obtained with the total 1H-RMN spectral range, coloring the samples according to (a) variety-cultivation modality, (b) the cultivation modality, and (c) the variety.
Chemosensors 13 00162 g002
Figure 3. PCA scores plots obtained with the 1H-RMN spectra of (a) Hojiblanca and (b) Picual samples, coloring the scores according to the cultivation modality. Conv.: conventional cultivation; Org: organic cultivation. Loading plots showed in Figure S3 Supplementary Material.
Chemosensors 13 00162 g003
Figure 4. PLS-DA results obtained for varietal discrimination of EVOO samples (Hojiblanca [H] vs. Picual [P]) based on 1H-NMR spectral data. (a) Score plot for the first two latent variables (LV1 and LV2). (b) Predicted Y values for each sample (calibration). (c) Cross-validated predicted Y values, indicating model performance. (d) Loading plot showing the variables (chemical shifts in ppm) contributing to the separation along LV1 and LV2.
Chemosensors 13 00162 g004
Figure 5. PLS-DA results obtained for cultivation discrimination of EVOO samples (conventional [Conv] vs. organic [Org]) based on 1H-NMR spectral data. (a) Score plot for the first two latent variables (LV1 and LV2). (b) Predicted Y values for each sample (calibration). (c) Cross-validated predicted Y values, indicating model performance. (d) Loading plot showing the variables (chemical shifts in ppm) contributing to the separation along LV1 and LV2.
Chemosensors 13 00162 g005
Figure 6. Log10-transformed mean intensity values (arbitrary units) of selected 1H-NMR variables (VIPs) for EVOO differentiation by production method (conventional [Conv.] vs. organic [Org.]), cultivar (Hojiblanca [H] vs. Picual [P]), and their interactions (Hojiblanca-conventional [H-C], Picual-conventional [P-C], Hojiblanca-organic [H-O] and Picual-organic [P-O]). Different letters in columns indicate significant differences (Tukey’s test, p < 0.05): uppercase for Org/Conv, H/P, H-O/H-C, P-O/P-C; lowercase for H-O/H-C and P-O/P-C. Color scale: blue (low) to red (high). See Table S3 Supplementary Material, for detailed values correspond to this figure.
Chemosensors 13 00162 g006
Table 1. Samples under study. H: Hojiblanca; P: Picual; Org: organic; Conv: conventional; F: filtered; NF: non-filtered.
CodeVarietyCultivation ModalityStageFilteringSeason
HCI-1HConvIF1
HCII-1HConvIIF1
HCII-NF-1HConvIINF1
HCIII-1HConvIIIF1
HCI-2HConvIF2
HCII-2HConvIIF2
HOI-1HOrg IF1
HOII-1HOrg IIF1
HOII-NF-1HOrg IINF1
HOIII-1HOrg IIIF1
HOI-2HOrg IF2
HOII-2HOrg IIF2
PCE-50C-2PConv-F2
PCI-1PConvIF1
PCI-2PConvIF2
PCII-1PConvIIF1
PCII-2PConvIIF2
PCII-NF-1PConvIINF1
PCIII-1PConvIIIF1
POE-50C-2POrg -F2
POI-1POrg IF1
POI-2POrg IF2
POII-1POrg IIF1
POII-2POrg IIF2
POII-NF-1POrg IINF1
POIII-1POrg IIIF1
Table 2. Interpreted components of each 1H-NMR region.
IntervalInterval Range (ppm)Chemical Shift (ppm)MultiplicityInterpretation *
10–0.05020.00sInternal standard (TMS)
20.051–0.5000.15s
0.32–0.35dCycloartenol
30.501–0.8500.54sAlcohol, sterol
0.68sβ-Sitosterol or stigmasterol
0.70–0.836
40.851–1.2000.85–0.90tTerminal methyl protons (-CH3) of saturated fatty acids: oleic (ω-9) and linoleic (ω-6)
0.95–0.99tLinolenic (ω-3) acid.
51.201–1.4001.24–1.32tMethylene protons (-CH2-) from aliphatic chains of saturated fatty acids (palmitic, stearic) or oleic, linoleic and linolenic.
61.401–2.2001.401–1.63m
1.67sSqualene
1.71–2.20
72.201–2.4002.28–2.32d
2.32–2.36mAllylic protons (-CH2-CH=CH-) linked to unsaturated fatty acids.
82.401–2.5002.44–2.49
92.501–2.7002.53–2.68
102.701–2.9002.74–2.78d
2.78–2.95tBis-allylic protons (=CH-CH2-CH=) linked to polyunsaturated fatty acids (linoleic and linolenic acids).
112.901–3.6002.9–9.95t
3.00–3.59
123.601–4.0003.63–3.65dsn-1,2-diacylglycerides
3.68–3.98t
134.001–4.4004.10–4.20qHydrogens at the 1 and 3 position of glycerol (-CH2-O-CO-) linked to triacylglycerides
4.25–4.35d + d
144.401–5.0004.43–4.5d + d
4.57dTerpenes
4.59s
4.66s
4.71s
155.001–5.7005.0–5.20mTriacylglycerides
5.24–5.3mOlefinic protons (-CH=CH-) of unsaturated fatty acids
5.31–5.38m
5.47–5.60d + tPhenolic compounds
165.701–7.2006.70–6.80s + q
6.90–7.10t + dDialdehyde of ligstroside lacking a carboxymethyl group, aldehydic form of ligstroside
177.201–7.3357.27s
187.336–9.7217.53sAldehydic form of secoiridoid (oleuropein, ligstroside)
7.64s/d
9.12–9.31d + 5 + d + sDialdehyde of secoiridoids (oleuropein, ligstroside) lacking a carboxymethyl.
9.42–9.55q + d + d + dDialdehyde of secoiridoids (oleuropein, ligstroside) lacking a carboxymethyl group + aldehydic form of secoiridoids (oleuropein, ligstroside) + E-2-alkenals (E-2-hexenal).
9.61–9.72d + t + sAldehydic form of secoiridoids (oleuropein, ligstroside). Hexanaldehyde, oleocanthal.
Note: Signal multiplicity: s, singlet; d, doublet; t, triplet; q, quadruplet; m, multiplet. * Identification was made according to the literature [35,48,49], and being identified at level 2 (putative identification based on spectral match) and level 3 (annotation at compound class level) according to MSI guidelines [50].
Table 3. Classification results obtained with the total 1H-NMR spectra.
Classification TaskLVsActual ClassPredicted Class (CAL)Sensitivity (CAL)Specificity (CAL)Predicted Class (CV)Sensitivity (CV)Specificity (CV)
HPHP
Variety4Hojiblanca (H = HC + HO)240100%100%240100%100%
Picual (P = PC + PO)028100%100%028100%100%
Cultivation modality ConvOrgSensitivity (CAL)Specificity (CAL)ConvOrgSensitivity (CV)Specificity (CV)
9Conventional (Conv = HC + PC)260100%100%260100%100%
Organic (Org = HO + PO)026100%100%026100%100%
Cultivation modality of Hojiblanca EVOOs2 HCHOSensitivity (CAL)Specificity (CAL)HCHOSensitivity (CV)Specificity (CV)
HC120100%100%120100%100%
HO012100%100%012100%100%
Cultivation modality of Picual EVOOs6 PCPOSensitivity (CAL)Specificity (CAL)PCPOSensitivity (CV)Specificity (CV)
PC140100%100%141100%93%
PO014100%100%01393%100%
Note: LVs: latent variables. CAL: calibration. CV: cross-validation.
Table 4. Classification results, in terms of the percentage of correct classification for each class (Hojiblanca [H] vs. Picual [P] and Conventional [Conv] vs. Organic [Org]), obtained by the performance of a PLS-DA model with the variables included in the selected intervals (according to the VIPs).
Selected Variables from no. of Interval #Tentative ID% Correct classification
Predicted Class (CAL)Predicted Class (CV)Predicted Class (CAL)Predicted Class (CV)
HPHPConvOrgConvOrg
#3β-Sitosterol or stigmasterol83.3382.1483.3375.0084.6284.6280.7776.92
#4Saturated acids: oleic (ω-9), linoleic (ω-6), linolenic (ω-3)83.3353.5779.1753.5788.4665.3884.6265.38
#7Unsaturated fatty acids58.3367.8654.1764.2953.8553.8542.3153.85
#9Not identified100.0085.71100.0085.7188.4684.6288.4684.62
#10Polyunsaturated fatty acids (linoleic and linolenic acids)87.5089.2979.1789.2942.3165.3823.0857.69
#11Polyunsaturated fatty acids (linoleic and linolenic acids)91.6792.8691.6785.7176.9246.1573.0846.15
#15Triacylglycerides83.3389.2983.3385.7188.4646.1584.6234.62
#16Phenolic compounds and dialdehyde of ligstroside87.5092.8683.3389.2965.3865.3865.3853.85
#17Not identified45.8382.1445.8378.5784.6238.4673.0842.31
#18Oleuropein, ligstroside75.0082.1475.0082.1476.9265.3861.5457.69
Note: Higher percentages are highlighted in bold. ID: identification. H: Hojiblanca; P: Picual; Conv. conventional; Org: organic. CAL: calibration; CV: cross-validation.
Disclaimer/Publisher’s Note: The statements, opinions and data contained in all publications are solely those of the individual author(s) and contributor(s) and not of MDPI and/or the editor(s). MDPI and/or the editor(s) disclaim responsibility for any injury to people or property resulting from any ideas, methods, instructions or products referred to in the content.

