1. Introduction
Honey, produced by honey bees (
Apis mellifera L.), from floral nectar, is a widely recognized food and medicinal product. The physicochemical properties of honey serve as important indicators of its authenticity and freshness [
1]. It is a sweet product originating from both floral nectar and the exudates of insects that extract sap from plant tissues, or from secretions of living plant parts. These substances are combined with the bees’ secretions, stored in honeycombs, evaporated, and left to mature. The European Union categorizes honey into various types, including nectar and honeydew honey, as well as filtered, pressed, extracted, drained, comb, and chunk or cut comb honey [
2,
3].
Natural bee honey is a complex substance containing a wide range of compounds across multiple chemical categories, such as glucose, fructose, sucrose, water, organic acids, minerals, and amino acids. It also contains polyphenolic compounds, pigments, vitamins, essential oils, and other bioactive substances. The significance of honey has been well-documented in the scientific literature, with substantial evidence supporting its antioxidant, antibacterial, cough-preventive, fertility-enhancing, and wound-healing properties [
4,
5]. Over the decades, natural bee honey has been extensively studied; however, its nutritional diversity, prophylactic benefits, and biological activities continue to intrigue scientists. Consequently, methods for assessing honey’s quality are constantly being refined and improved to reduce analysis time, eliminate costly and hazardous reagents, minimize labor, and enhance precision [
6,
7]. Given honey’s high economic value and its relative scarcity, it is particularly vulnerable to adulteration, particularly in regions with inadequate regulatory oversight, such as Kosovo. With the increasing demand for trustworthy, high-quality honey, it is crucial to understand the physicochemical characteristics of this valuable product in order to ensure its authenticity and quality [
1,
8].
The quality and composition of honey are influenced by various ecological factors, including its geographical and floral origin, the season, environmental conditions, and beekeepers’ practices [
9]. Although it is challenging to obtain honey from a single plant species, referred to as mono-floral honey, beekeepers identify the primary nectar sources in their regions and strategically plan their harvests to keep the highest-quality varieties separate. As a result, the market offers various types of honey, such as chestnut honey, acacia honey, mountain honey, and meadow honey. Economically, beekeeping holds considerable value. In addition to honey, it provides protein-rich drone broods and pollen, as well as pollination services that enhance crop yields. A study by Sillman et al. [
10] tested the hypothesis that beekeeping could yield net-positive impacts if pollination services and protein-rich by-products are effectively utilized. Although honey is considered as food and medicine, honey preparations enriched with medicinal and aromatic herbs are very often prepared in traditional medicine. The reason for this is their exceptional functional properties, nutritional richness, and high antioxidant [
11]. Enrichment of honey is possible in two ways: (i) adding herbs [
12] or (ii) directly feeding bees syrups that are primarily sucrose enriched with fruit juices or plant extracts [
13]. Consumer demand for natural alternatives is growing, and therefore it is absolutely necessary to study the synergy of adding herbs in honey [
12,
13,
14], while the preference of the consumer would be a form as natural possible, such as honey enriched with coumarin from
Melilotus flowers [
14]. However, to confirm or refute the nutritional and/or functional indicators of the samples, it is necessary to carry out analyses that can be expensive and less environmentally acceptable as near-infrared spectroscopy cupelled with chemometrics [
15,
16].
In food analysis, near-infrared (NIR) spectroscopy has proven to be highly acceptable because it is an analytical technique that offers significant advantages over traditional food analysis methods [
17,
18]. In the range of 780–2500 nm, NIR radiation interacts with molecular vibrations, especially those involving hydrogen bonds (O-H, C-H, and N-H). These bonds are fundamental components of the main ingredients found in food, including water, fats/oils, carbohydrates, and proteins [
19]. In this way, by analyzing absorption spectra at certain wavelengths, precise information about the composition of the observed sample can be obtained. The key advantages of NIR spectroscopy are its non-destructive nature [
17], speed [
16,
18,
19,
20], the possibility of on-site analysis using portable devices [
16,
17,
21], and its cost-effectiveness and cost-effectiveness compared to standard chemical methods [
17,
18,
19,
20,
21]. Non-destructive means that the sample is minimally or not at all prepared for analysis. Therefore, due to the aforementioned advantages NIR spectroscopy was used in this work.
To our knowledge, this is the first study to analyze honeys from three countries of southern Europe (Kosovo, Albania, and North Macedonia) to which five aromatic plants have been added. The aim of this work is to examine the change in color, basic physicochemical parameters, and the antioxidant activity of honey when the previously mentioned additives (aromatic plants) are added to it. The changes were also monitored by NIR spectroscopy, and it was crucial to use chemometric tools that would provide insight into similarities/differences and potential changes.
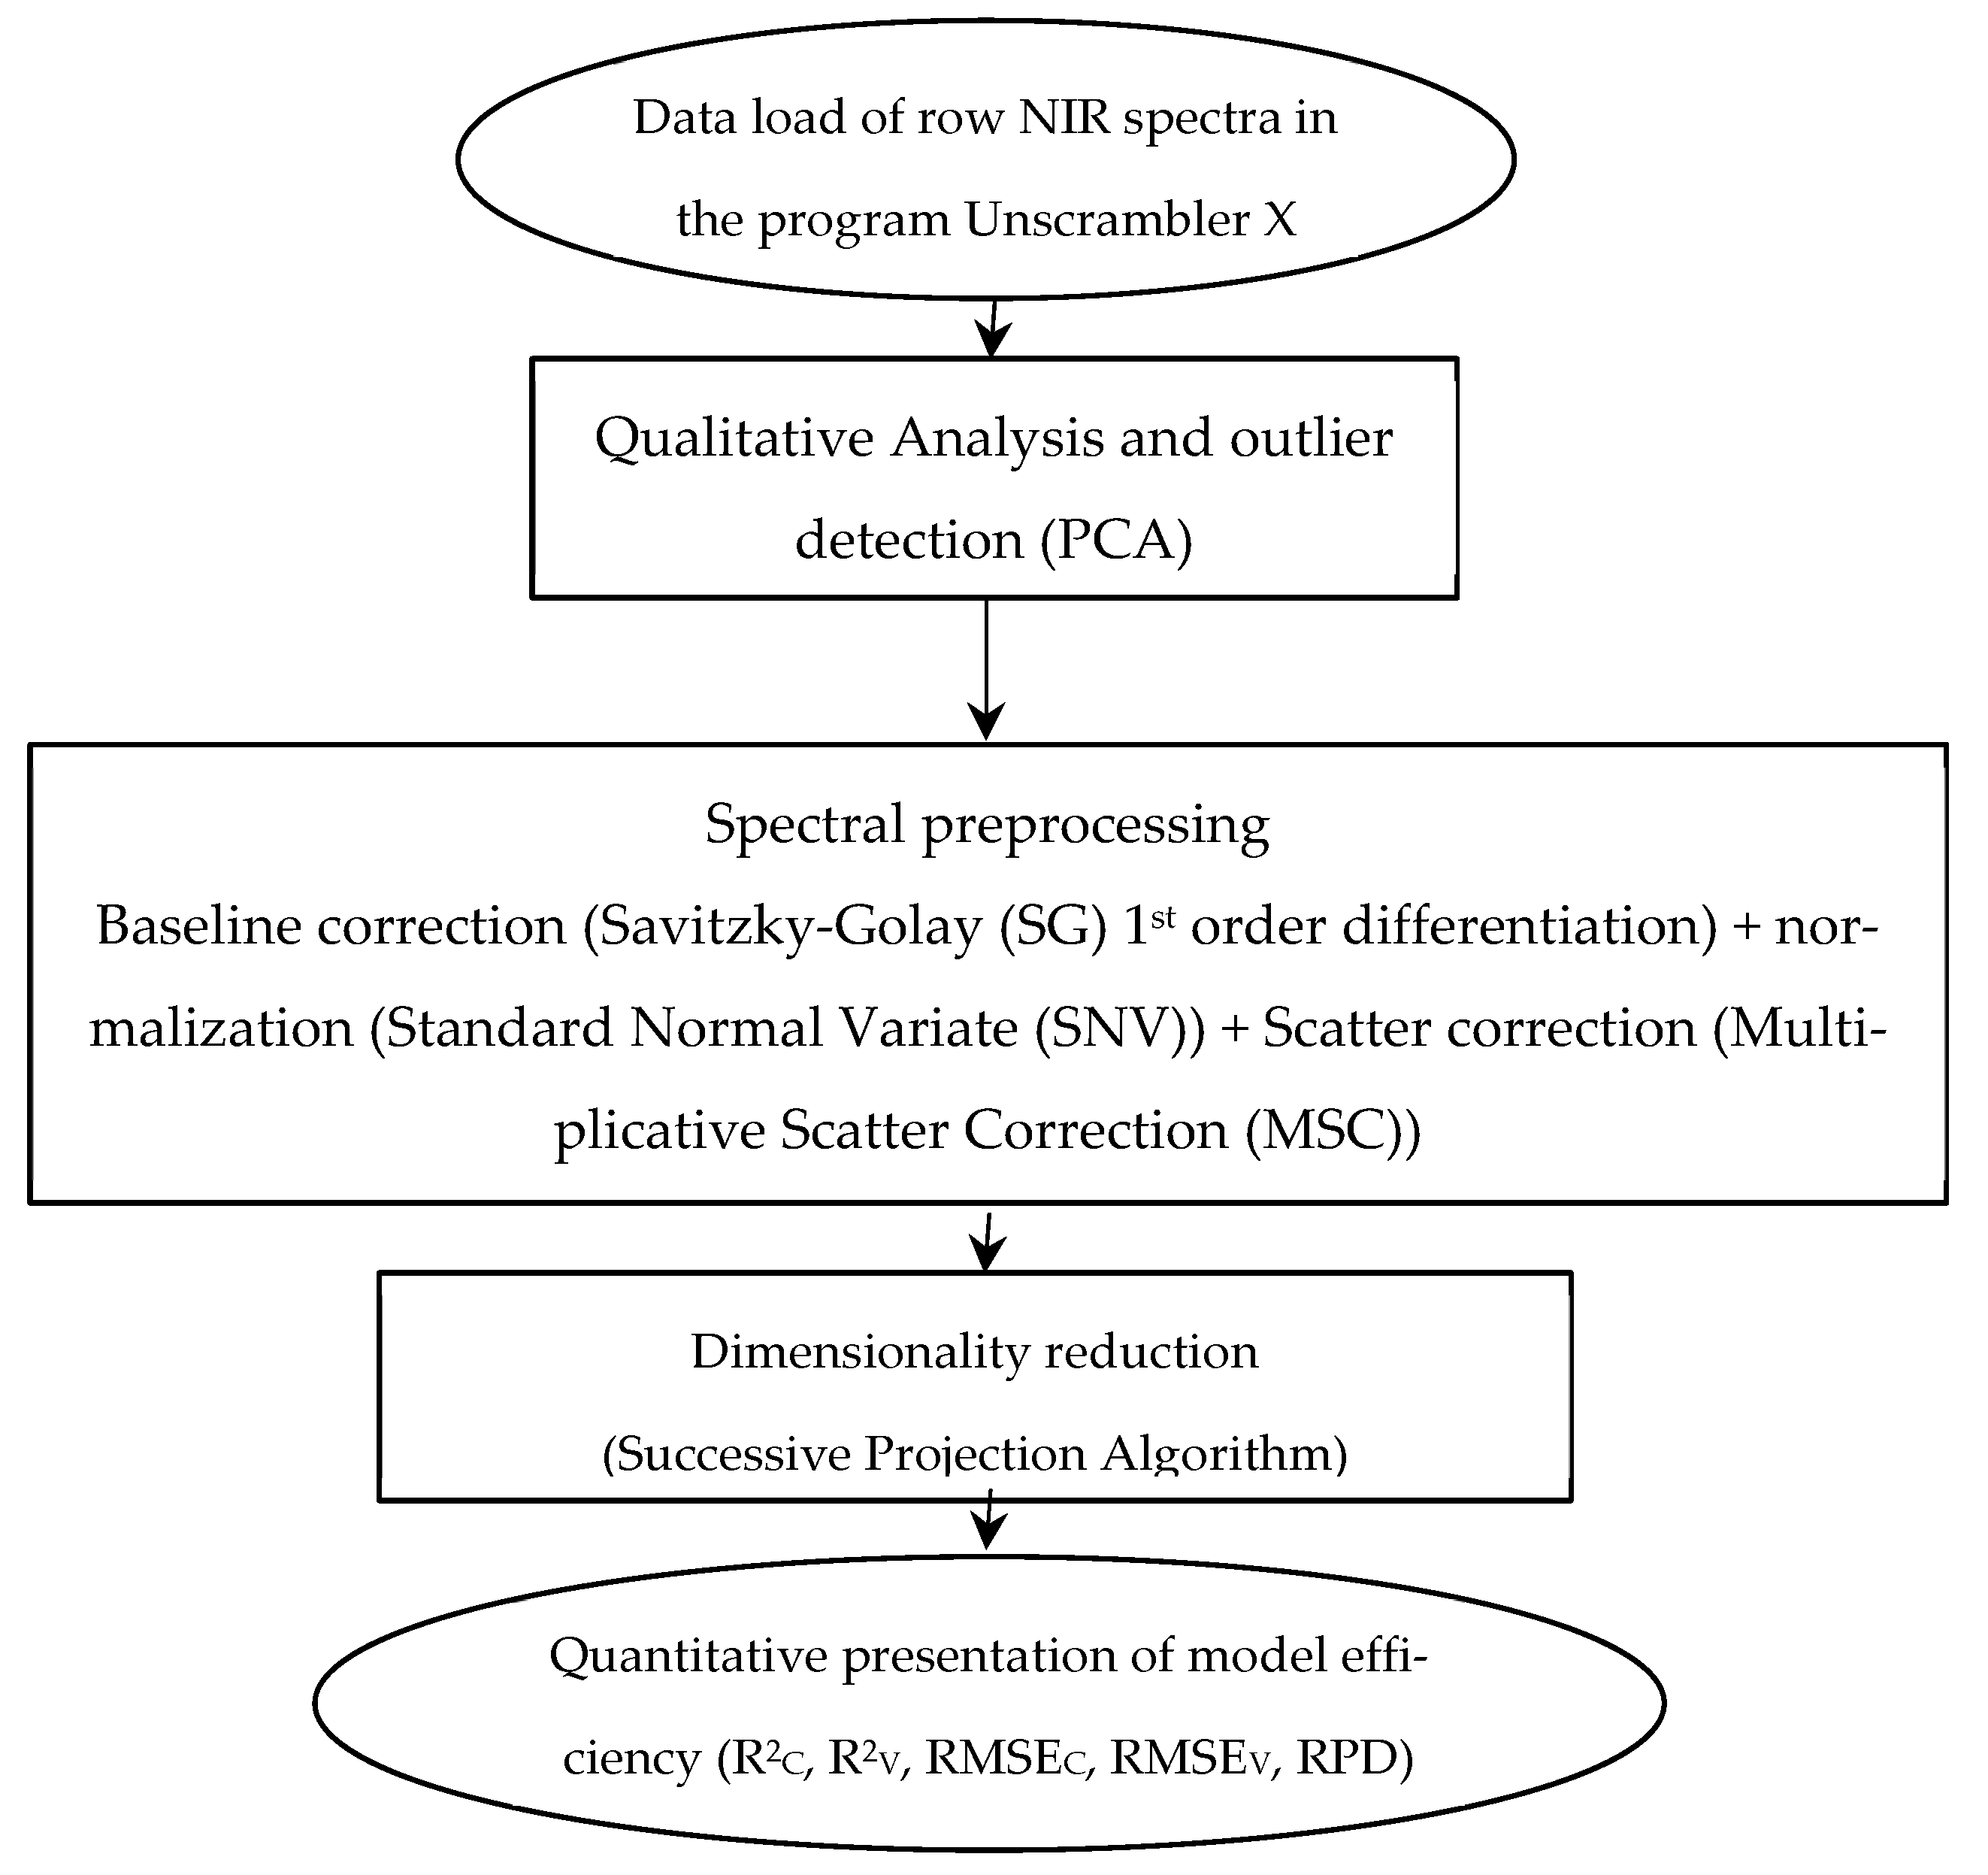
3. Results
The following results present a comprehensive physicochemical and colorimetric analysis of nine honey samples (H1–H9) with the addition of five aromatic plants in three different concentrations, originating from Kosovo, North Macedonia, and Albania. These samples were further evaluated for antioxidant activity using the DPPH method, both in pure form and after the addition of various aromatic plant extracts. The data allow for comparison among the samples based on origin and treatment, revealing important differences in composition and quality.
3.1. Physicochemical Properties, Color, and Antioxidant Activity of Honey Samples
The pH of honey is an important indicator of its acidity, which affects shelf life and microbial stability [
23,
36]. Kosovo’s honey samples ranged from 3.85 to 4.18. North Macedonian samples showed slightly higher values, especially H4 with 4.72, indicating a more neutral character. Albanian samples had a pH range of 3.7 to 4.1, with H9 being the most acidic. Overall, the samples exhibited typical honey acidity, beneficial for preventing microbial growth [
37].
Brix values, representing the sugar concentration in honey, are critical for assessing its maturity and quality. All samples showed high Brix values (82.9–84.5%), confirming high sugar content consistent with mature, unadulterated honey, and those values are slightly higher than the reference concentration levels for commercial honeys [
38]. Kosovo’s H2 and H3 had the highest Brix values (84.4% and 84.5%), suggesting a higher sugar concentration compared to other regions, although the adulterated honey samples with corn syrup show also higher Brix values [
39].
Conductivity reflects the presence of minerals and other conductive substances [
36,
39]. H1 from Kosovo had the highest conductivity (0.51 mS/cm), indicating richer mineral content. In contrast, Albanian honeys had the lowest values (0.16–0.21 mS/cm), pointing to possible floral origin differences or lower mineral content.
Free acidity as following quality marker showed for Kosovo’s H3 the highest acidity (31 meq/kg), which could suggest fermentation or floral source variability. North Macedonia’s honeys were less acidic (as low as 5 meq/kg), and Albanian samples showed moderate levels (6–12 meq/kg). All measurements are in the expected range of <50 milli-equivalents acid/1000 g [
25,
36,
40].
Moisture (%) or the water content in honey affects its viscosity and shelf life. The samples displayed a moisture range between 13.4% and 18.2%, all within acceptable limits. H4 from North Macedonia had the highest moisture content (18.2%), which could risk fermentation if not properly stored. Lower moisture in Kosovo’s H2 and H3 (13.4%) points to better preservation characteristics. Quality deterioration include high moisture content because it decreases the honey stability [
41].
The ash content is linked to mineral content and botanical origin. Kosovo’s H1 and H3 had relatively high ash contents (0.28% and 0.27%, respectively), while North Macedonian and Albanian samples were lower, especially H2 (0.01%), H6 (0.02%), and H8 (0.02%), indicating differing mineral profiles across regions [
38].
Color in honey is a key quality and marketing attribute, influenced by botanical source and processing. It was quantified using
L* (lightness),
a* (red-green axis),
b* (yellow-blue axis), Chroma (C), and Hue angle (h) and presented in
Table 3 for the control samples (H1–H9).
Most samples had
L* values of around 35–37, indicating medium color intensity. The lightest was H4 from North Macedonia (
L* = 37.54), while H9 from Albania was the darkest (
L* = 34.95). The
a* values (red-green) ranged from 1.03 (H1) to 1.55 (H8), showing slight reddish tones.
b* values (yellow-blue) varied more, with H4 showing the strongest yellow tone (3.19), suggesting a bright golden hue. This aligns with the typical color variation in honeys of different floral sources [
27]. Also, data were collected of the Chroma (C, color intensity) and Hue Angle (h, color type). Chroma was highest in H4 (3.36), confirming vivid color saturation while the hue angle ranged from 28.65° (H2) to 71.43° (H4), showing a progression from reddish to more yellowish hues. Samples from North Macedonia generally showed brighter and more saturated colors, indicating potential botanical and geographical influences.
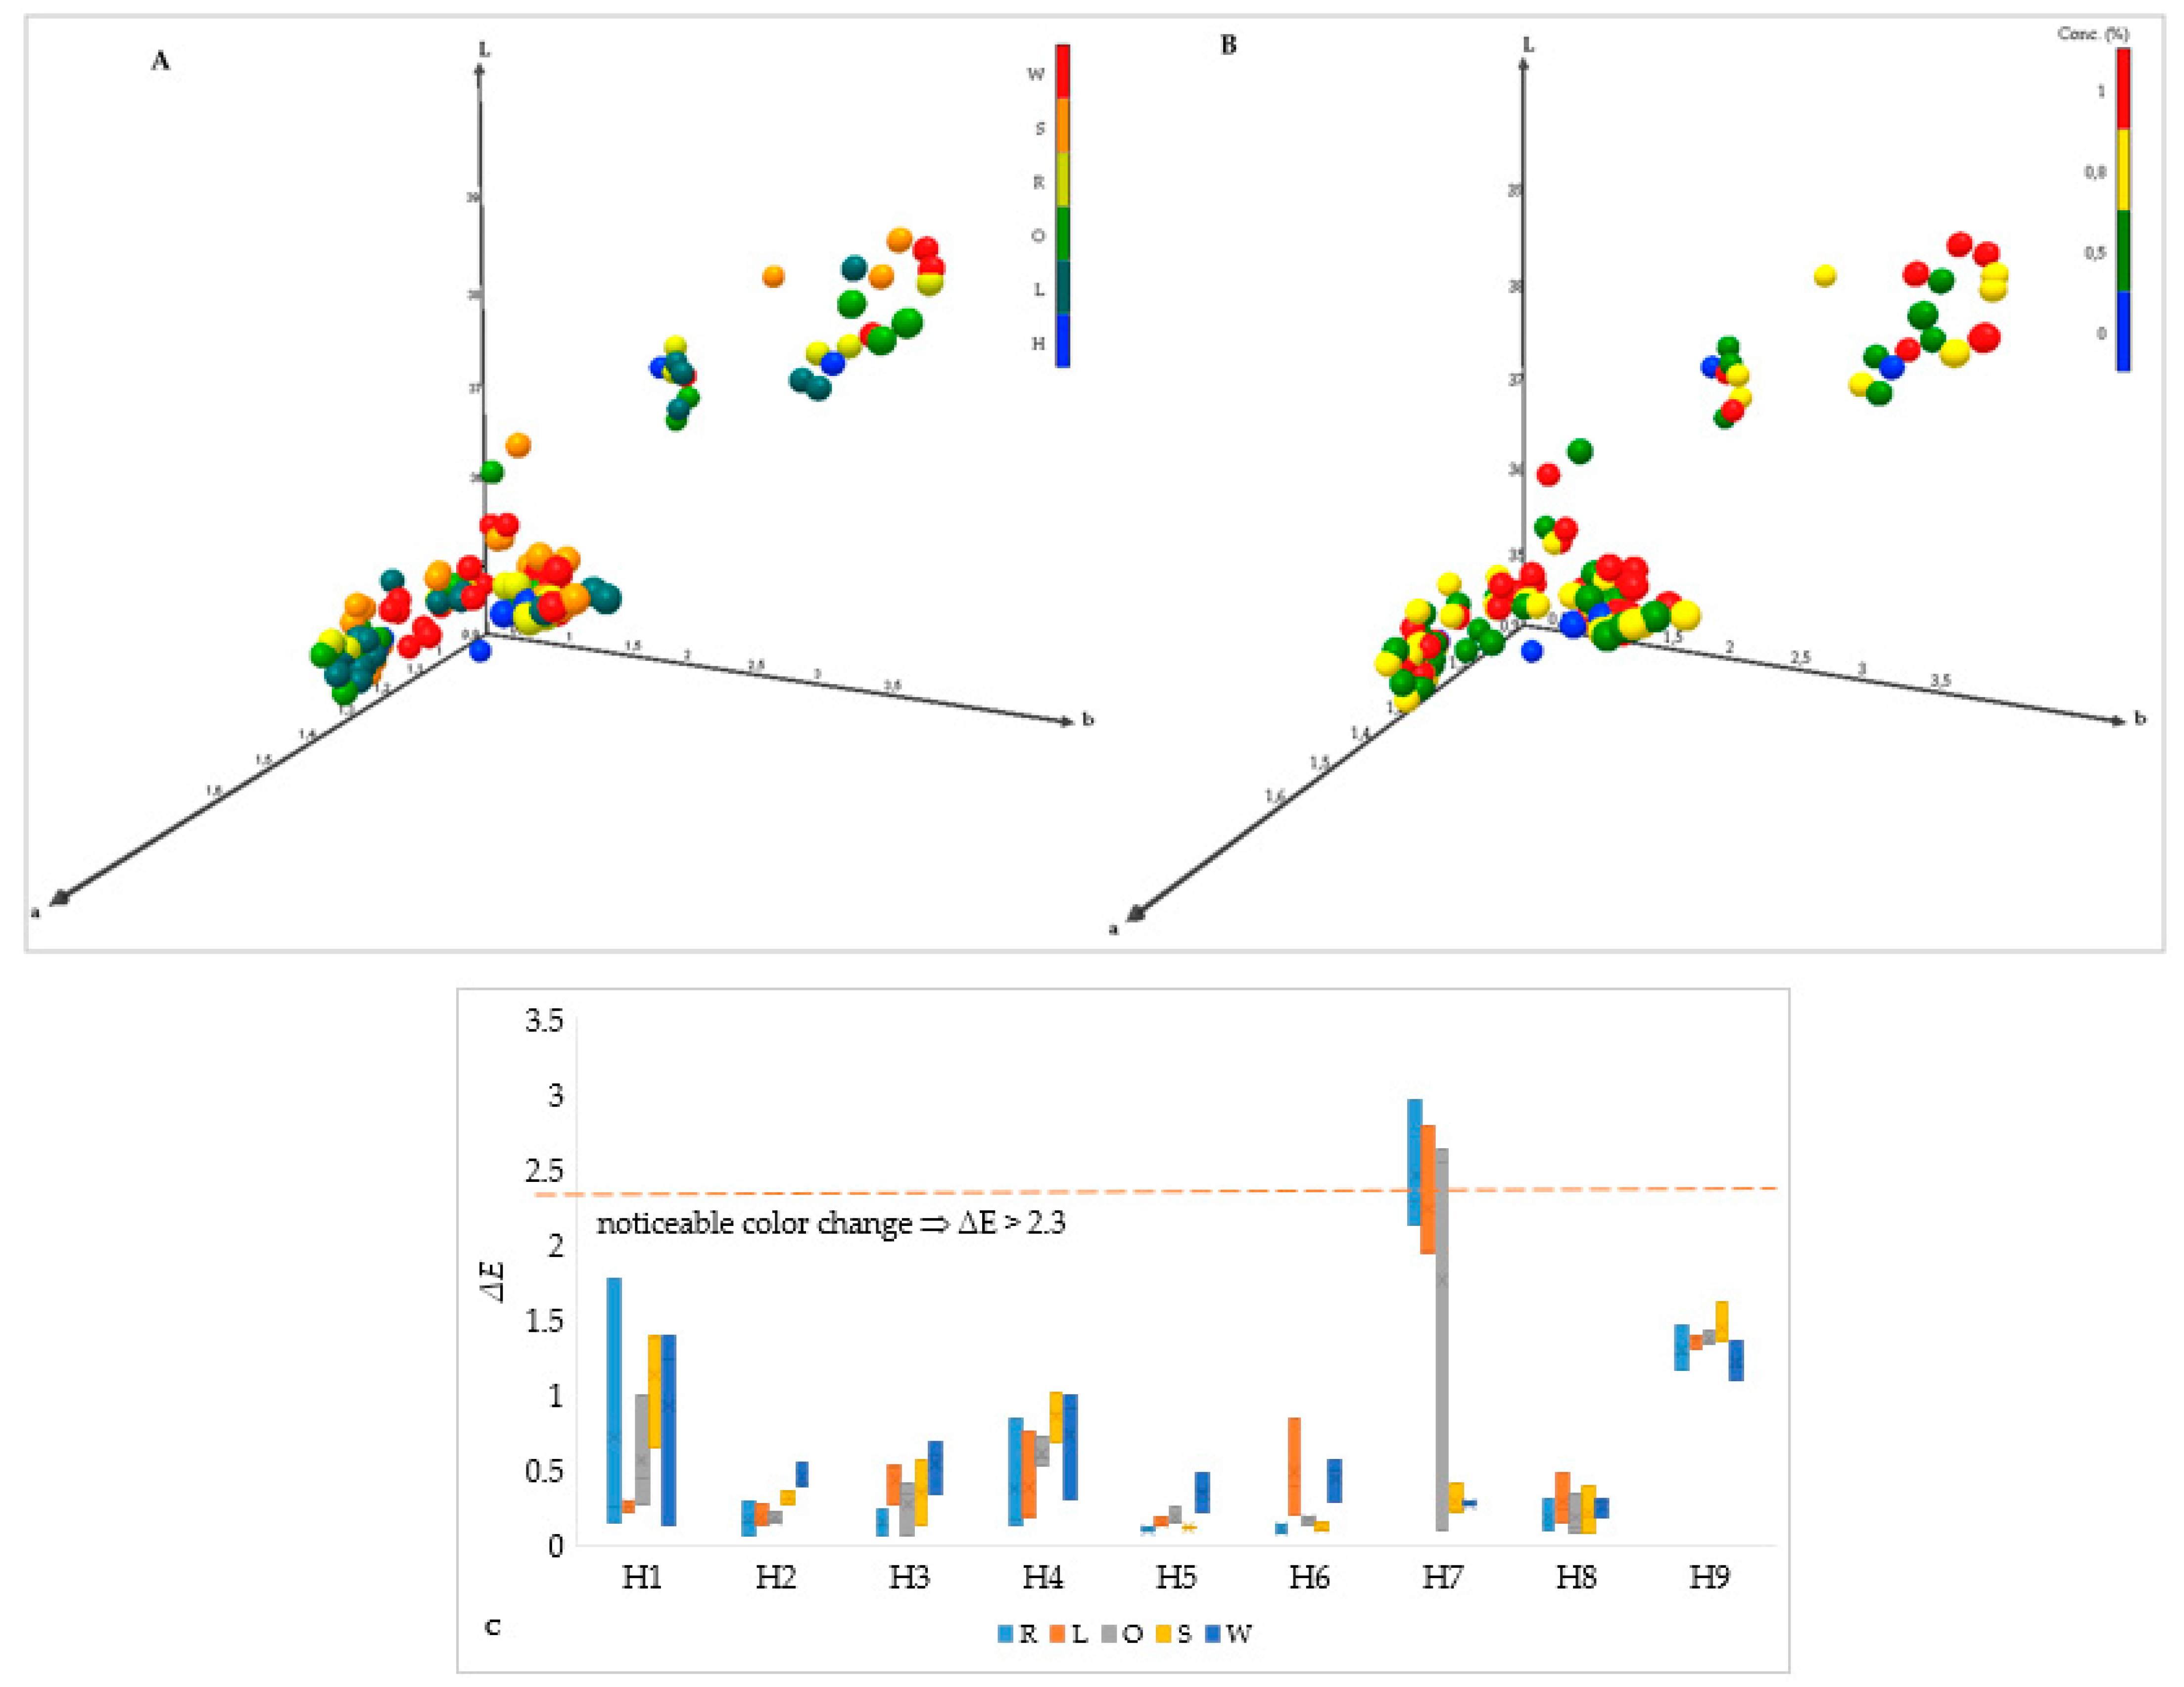
To present the grouping of samples with added aromatic plants around their control honey, the 3-D chart of all samples is presented (
Figure 2A,B) as well as the non-visibility in color change by adding aromatic plants in the honeys (
Figure 2C).
Figure 1 illustrates how the addition of aromatic plants (rosemary, lavender, oregano, sage, and white pine oil) and their concentrations (0%, 0.5%, 0.8%, and 1%) altered honey properties.
Figure 2C shows the Δ
E values, representing the color difference, which quantifies perceptible changes. Even at low concentrations, the addition of these extracts visibly changed the color profile of the honeys, confirming their influence on visual appeal and possibly antioxidant capacity; however, only one sample can see this with the naked eye (H7, where only added Sage and White pine oil have not significantly changed the color from the original honey sample).
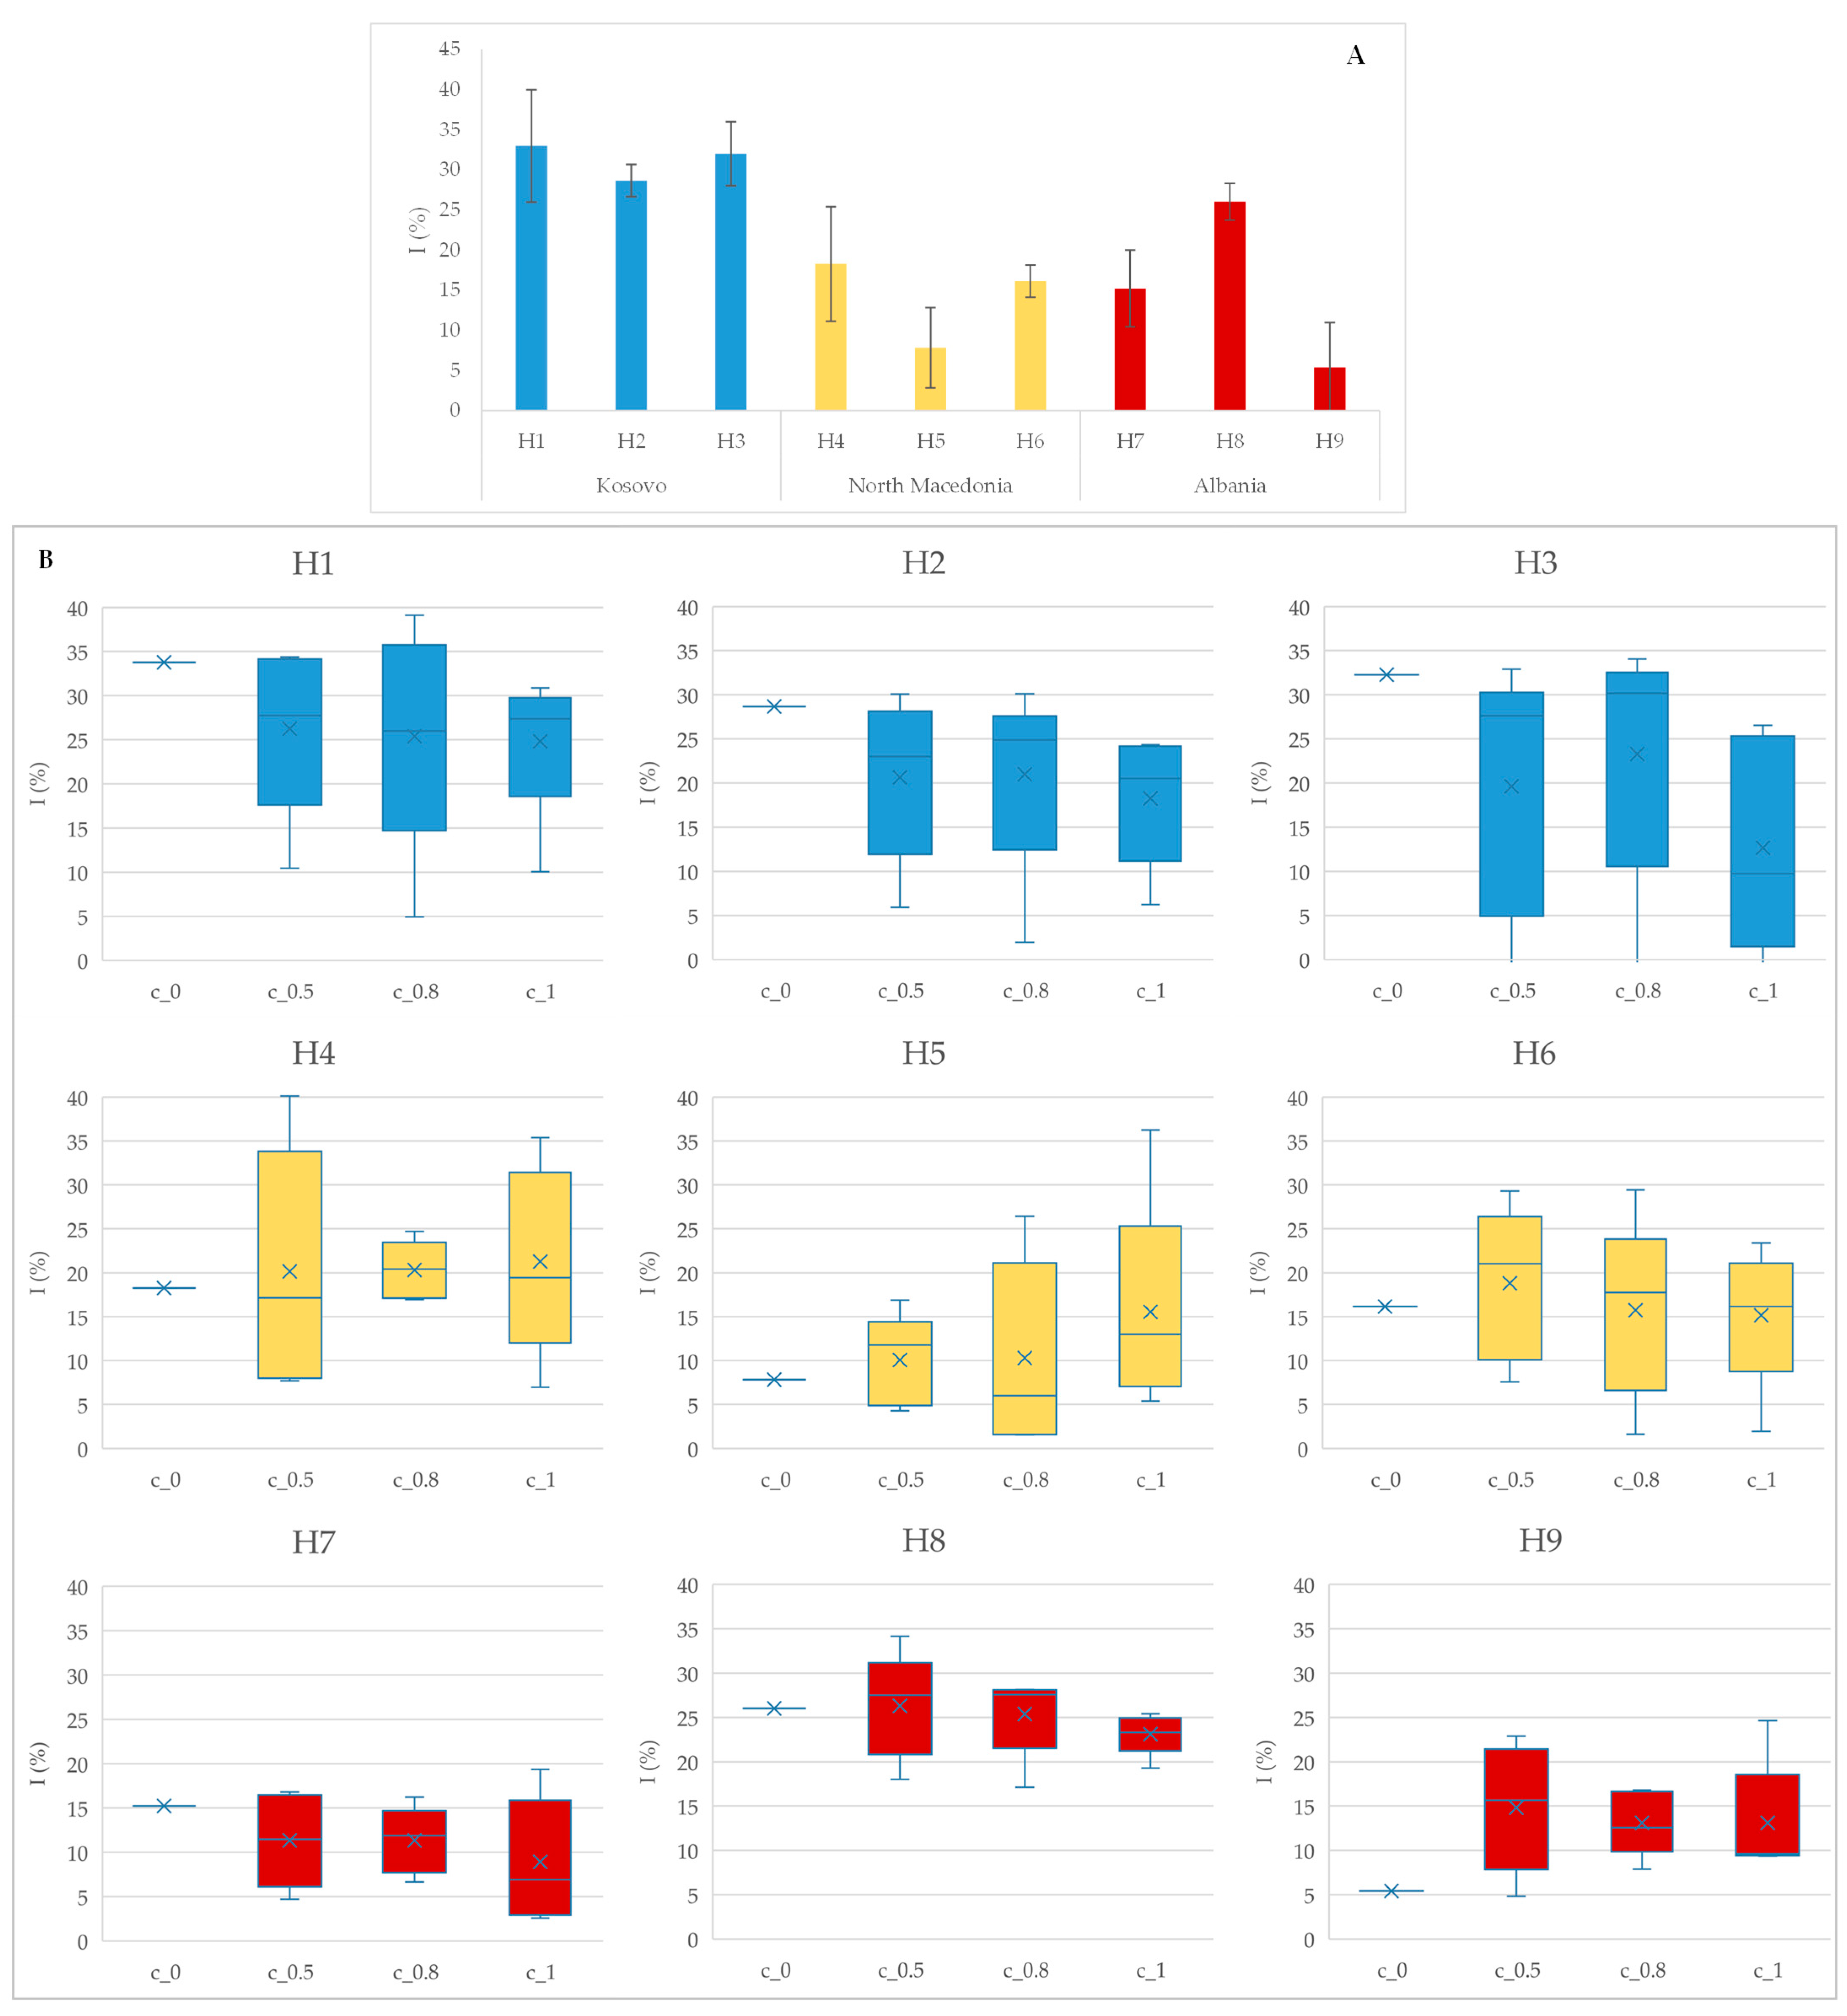
The DPPH assay results (
Figure 3) evaluate the antioxidant potential of the honey samples, both in pure form (A) and with plant extracts (B) added in the concentration 0.5%, 0.8%, and 1%, regardless which aromatic plant extract was added. Without additives, honey samples showed moderate inhibition effects, with variations reflecting their antioxidant potential related to added aromatic plants [
11]. The antioxidative activity increases proportionally with the increase in the added concentration of the aromatic plant. This trend demonstrates the effectiveness of rosemary, lavender, oregano, sage, and white pine oil in enhancing honey’s bioactivity. The increased DPPH inhibition at 1% concentration suggests potential for formulating functional honey products with health-promoting benefits [
42].
3.2. Physicochemical Color Parameters and Antioxidant Activity of Enriched Honey Samples
Data presented in
Table A1,
Table A2,
Table A3,
Table A4,
Table A5,
Table A6,
Table A7 and
Table A8 provide the physicochemical properties and antioxidant inhibition of honey samples enriched with various aromatic plants, as well as the color parameters. The tables present row honeys (H1–H9), with and without additives like rosemary, lavender, oregano, sage, and wild pine oil, each tested at three concentrations (0.5%, 0.8%, and 1%).
The pH values ranged from 3.63 (H6 + added 1% lavender) to 5.4 (H8 + 1%rosemary and 0.7% of sage). The °Brix values tends to vary with both plant type and concentration. Oregano shows a slight concentration-dependent increase in °Brix, potentially due to evaporation or sugar content interactions, and the highest value is detected in H4 with 0.8% oregano (85.6%) while the lowest value is in H6 with 1% lavender (80.8%).
The conductivity values ranged from 0.14 mS/cm (H9 + 1% lavender) to 0.51 mS/cm in H1 control, and are highest in unmodified honeys and decrease with plant additions, especially lavender and sage. Rosemary significantly increases acidity, especially at higher concentrations (highest in H3 with 0.8% rosemary, 38 meq/kg, while wild pine oil drastically lowers acidity across samples (lowest value: H8 with 1% wild pine oil: 3 meq/kg). Moisture increases notably with added rosemary (H3 with 0.8 and 1% rosemary: 18.6%) and lavender (≥16% for the majority of samples) at higher concentrations—likely due to hygroscopic behavior or water retention properties. Rosemary and lavender at 0.8–1% concentrations consistently led to increased ash content and slightly reduced moisture. In honey H1, the ash content increases notably with the addition of lavender from 0.24% to 0.31% as concentration rises from 0.5% to 1%. This coincides with stable acidity and reduced moisture, both promoting better preservation and possibly greater antioxidant retention [
36].
Antioxidant inhibition, often associated with the polyphenolic content and radical scavenging ability of honey [
31,
32], and in general, the addition of aromatic plants improved the antioxidant capacity of honey in several samples. While some samples such as H5 at 1% oregano show a high inhibition (36.23%), others, such as H2 at 0.8%, show significantly low values (1.96%), and the concentration of added plant displays inconsistent behavior. These discrepancies may be attributed to interactions between honey matrix components and oregano-derived compounds, which could have antagonistic effects under certain conditions [
32]. Oregano consistently impacted the antioxidant potential in a dual fashion. While at low concentrations (0.5%), it led to very low antioxidant inhibition values (e.g., H1 shows 10.45%), this was even lower at 0.8% (4.93%), and only slightly recovered at 1% (10.06%). This may suggest a non-linear interaction between oregano constituents and honey’s native antioxidants. Sage and wild pine oil displayed significant antioxidant effects at higher concentrations. For instance, in H4, wild pine oil at 0.5% yielded the highest inhibition (40.13%), while 1% oregano also resulted in high inhibition (35.37%), implying that the efficacy of plant additives is highly sample-dependent. Conversely, the inhibition was remarkably low or even negative in some cases, such as lavender at 0.5% in H3 (−3.68%) and rosemary at 1% (−0.76%), highlighting potential degradation or antagonistic effects of specific compound interactions.
These results emphasize that both the type and concentration of the additive profoundly affect antioxidant behavior.
Color parameters also offer insights into antioxidant properties. Samples with higher chroma (‘C’) and specific hue angles (‘h’) often correlate with enhanced bioactivity. For example, in H4 and H7, increased concentrations of sage and oregano led to higher chroma values and moderate hue angles.
3.3. Near-Infrared Spectra of Honey Samples
From the previously presented results, it is clear how complex the samples are and how the samples overlap, potentially grouping based on their physicochemical composition, color and antioxidant inhibition that is similar or different (in the observed data set). Since the excitation of molecules in the near-infrared region can be monitored by NIR spectroscopy [
17], these measurements were also performed and presented in
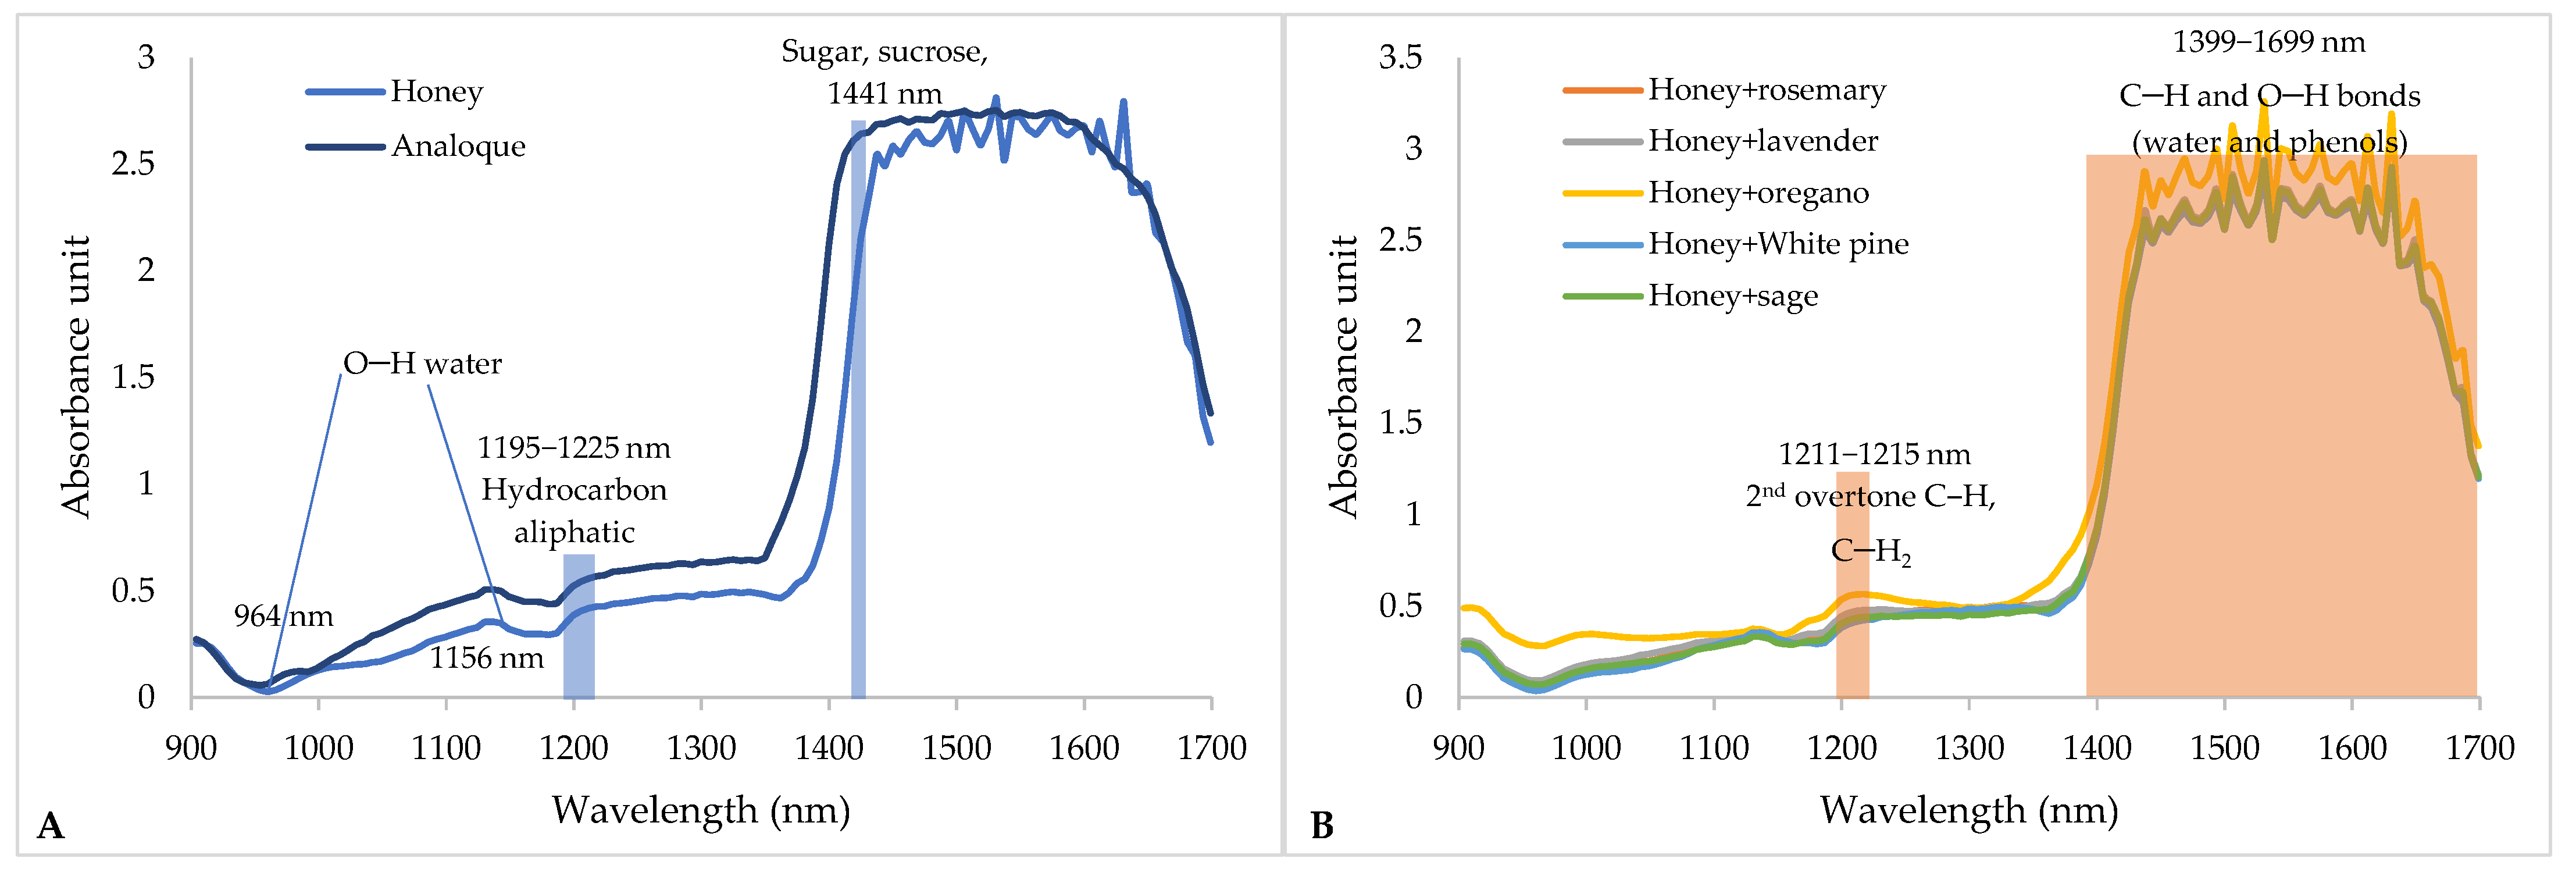
Figure 4.
NIR spectra of pure honey and analogs show a specific shape, but also noise that indicates the necessity of preprocessing the spectra before additional processing. Williams et al. [
43] and Beć et al. [
33] list NIR spectral wavelengths that are associated with sugars, water, total phenols and specific changes in O−H and C−H bonds. In the work of Gajdoš Kljusurić et al. [
44], the wavelength range of 1399–1699 nm was applied in the analysis of the phenolic profile of berry extracts. From all of the above, it is clear that it is necessary to apply chemometric tools that would enable a better understanding of the changes in the observed samples.
3.4. Chemometric Modeling
In order to extract meaningful information from complex chemical data, mathematical, statistical and computational methods, i.e., chemometrics, are applied. Since Botanical and Geographical Origins can also be determined for honey [
45], we wanted to check this possibility on our samples. Since our goal is a qualitative analysis in which, for example, we could distinguish between the type of honey and the added aromatic herbs, we applied principal component analysis (
Figure 4). Furthermore, in order to quantitatively relate the NIR spectrum and the collected data on physicochemical composition, color, and antioxidant activity, the Partial Least Square Regression method was applied.
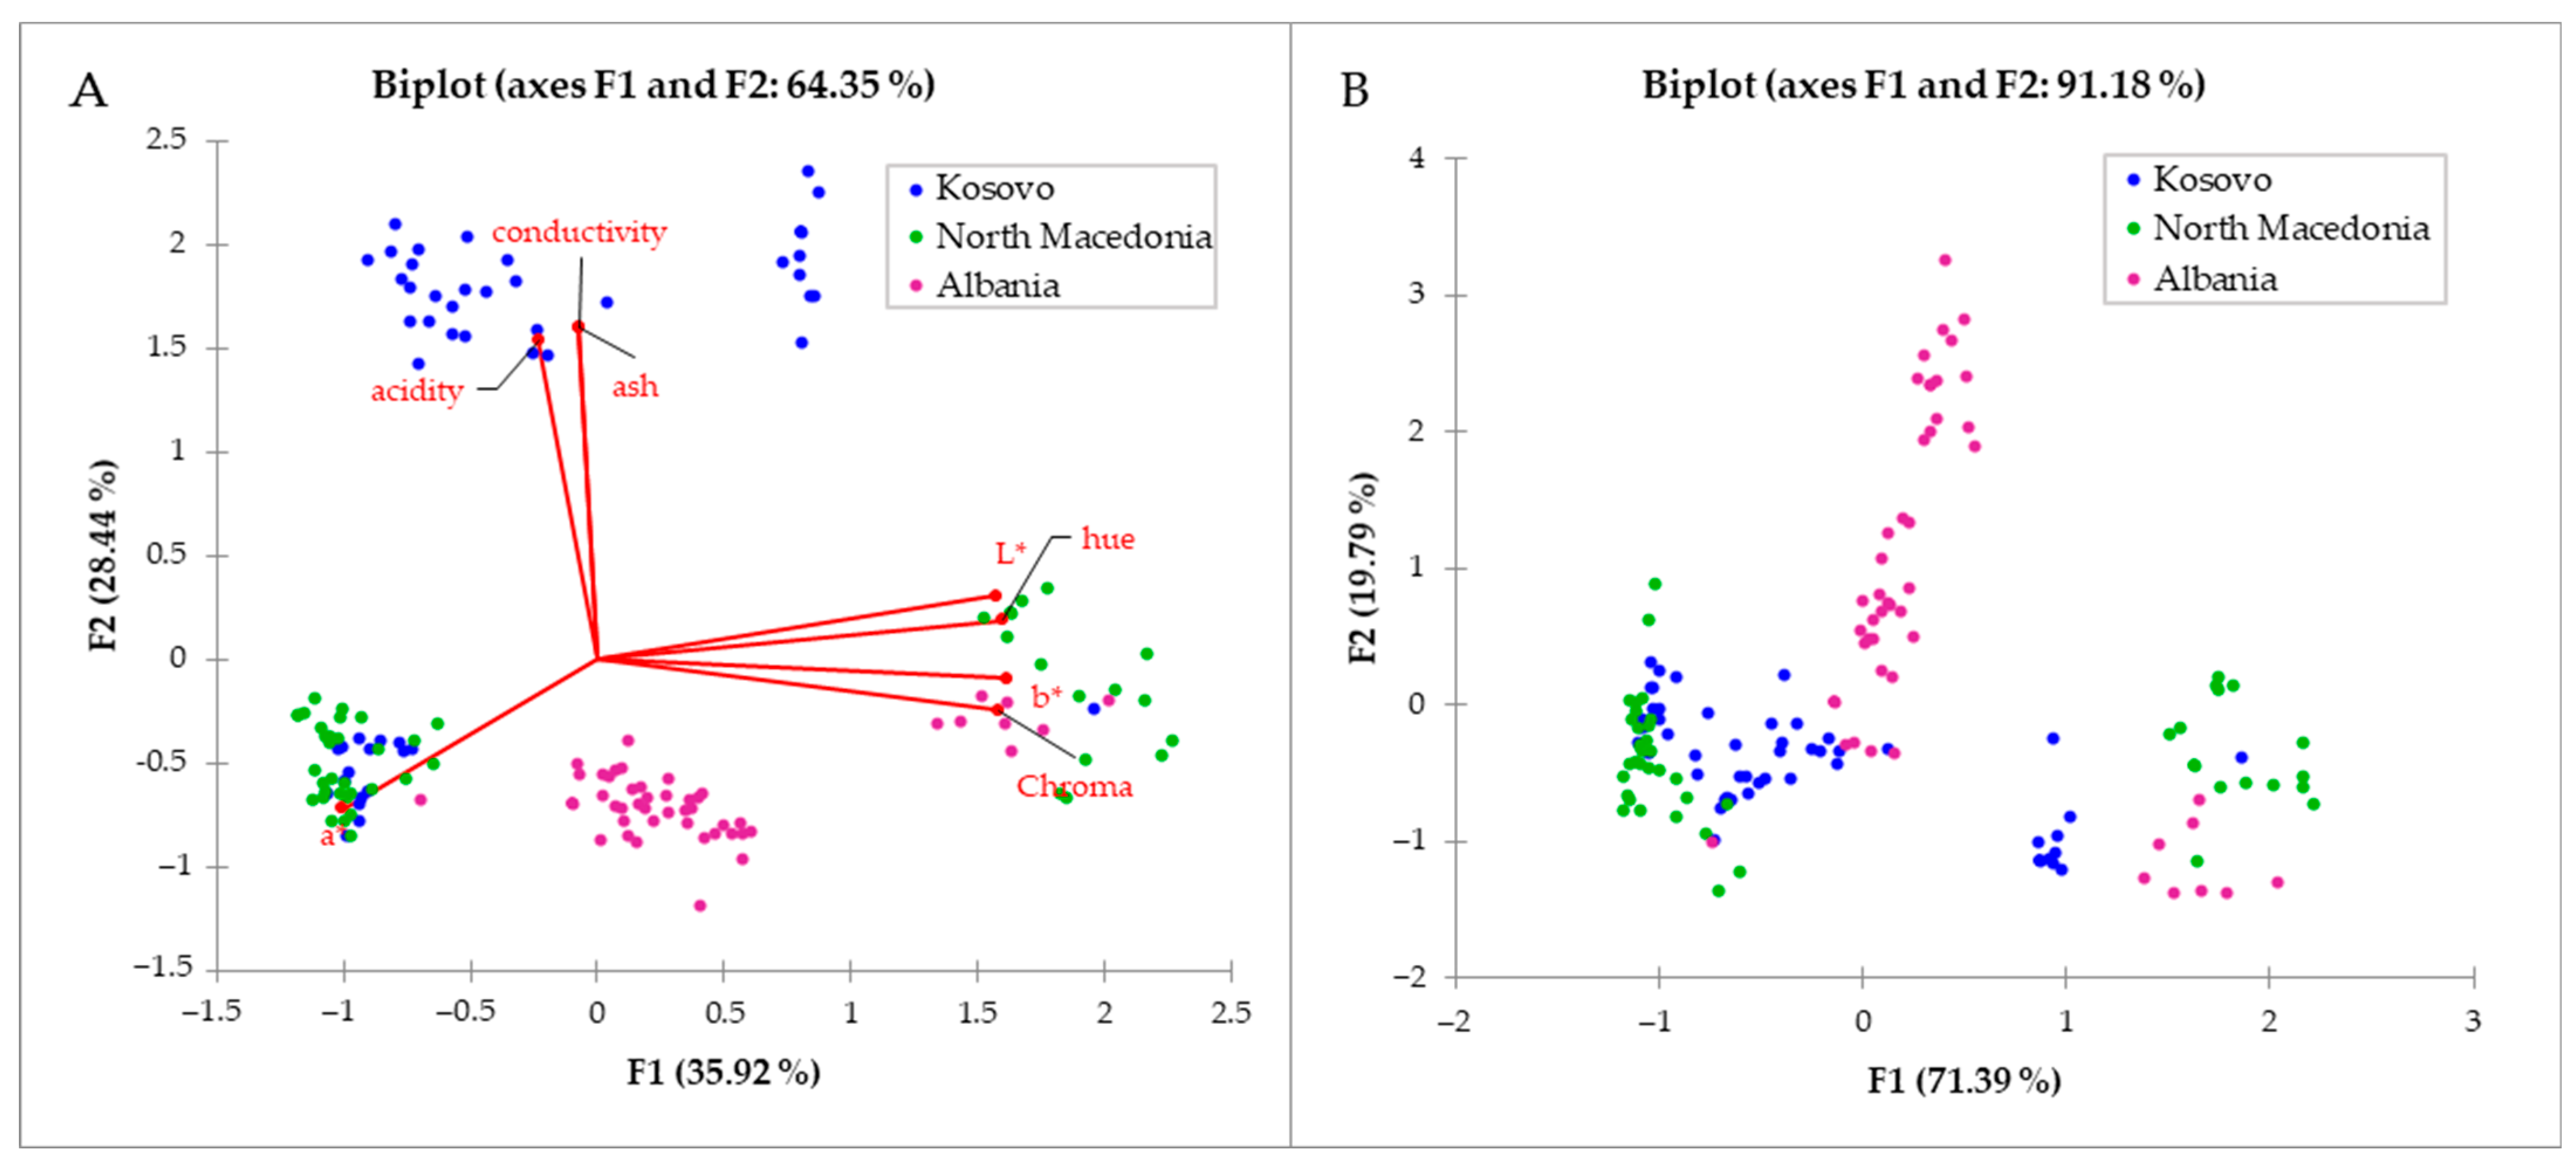
Both Bi-plots (
Figure 5) show clustering; however, the coverage of all variations in the observed data set is significantly higher when using only NIR spectra (
Figure 5A) of measured samples (F1 + F2 = 91.18%), than when using physicochemical data and color parameters (
Figure 5B) where only 64.35% (F1 + F2 = 64.35%) of all variations in the observed data set are explained. The biplot includes the score plot and loading plot in one, and the axes (F1 and F2) represent the amount of variance in the observed data set. Therefore, if their sum is higher, a higher percentage of the variability is described by the observed data set. Thus,
Figure 5 confirms that the association of NIR spectra with data on color, antioxidant activity and physicochemical properties of the samples significantly increased the coverage of variability. All color parameters, except for the parameter “a”, have a significantly higher weight in F1, while the physicochemical parameters, which are significant (not reduced in the PCA), conductivity, ash and acidity are the variables that contribute to the second principal component (F2).
Figure 5A shows a lot of overlap between honey samples (if the country of origin of the honey is considered), and the association of NIR data provides a clearer, but not clean, division by country. However, this was not the primary goal, but it showed that there is potential in NIR spectra for their association with other data. The advantage of using of PCA is the data reduction. Based on the PCA results, for the physicochemical parameters as moisture, DPPH, and Brix values, the Factor loading in the first two principal components was less than 0.5, and therefore they were not included in the Bi-plot itself, indicating no significant influence in the observed data matrix. On the other hand, for the NIR spectra, which have 796 absorbance data (for each wavelength in the range from 904 to 1699 nm), the reduction is more than welcome. According to the literature, the rule that VIP > 1 was used [
30], thus reducing the number of wavelengths by 50%, including the part of the spectrum associated with (i) the third overtone region for C–H bonds, Ar–OH, R–OH, and H
2O in the wavelength range of 904–1027 nm, as well as the (ii) second overtone of previously mentioned bonds (1373–1629 nm) and (iii) first overtone for C–H and Ar–CH bonds, in the (1631–1699 nm) [
33,
43,
44,
45,
46].
After qualitative analysis of honey samples, the next chemometric tool, standardly used for processing spectroscopic data with associated physicochemical parameters and measured color parameters, is the least squares regression method.
The results of the modeling are presented in
Table 4.
For the results summarized in
Table 4, the models were built with a maximum of seven latent variables (LVs) with less than 5% of outliers were removed as in the study of Rambo [
47]. An R-squared value closer to 1 represents better calibration (Rc) and validation (Rv), while the target value for RMSEs (measures of precision and accuracy of calibration and validation) should be as low as possible. The ratio of the standard error of performance to the standard deviation, i.e., the RPD value with higher values suggests higher accuracy of the model, and with values greater than 5 it can also be used in quantitative predictions [
28]. As can be seen from the parameters used in determining the quality of the model, the R
2-validation values range from the lowest value for the color parameter a, i.e., the estimate of red (+
a) to green (−
a) honey color, and the °Brix value (0.737), from the set of observed physicochemical properties. Since the aim of this work was to qualitatively determine the physicochemical and color properties of honey, their similarities and/or differences—the application of NIR spectroscopy showed a very good potential. In addition to the parameters listed for assessing the efficiency of the model (RMSE and R2 after calibration; RMSE and R2 RPD after validation), a test was performed for 10% of the honey samples (n = 14) and the expected values were calculated for each observed parameter (first column in
Table 4) using the PLS regression model. Then, paired t-Student data analysis was used between the data obtained in the laboratory and the data predicted by the chemometric models and a
p-value of less than 0.05 indicates statistically significant differences in the mean values of the parameters determined in the laboratory and those estimated by the models. A graphical representation of the calibration, validation and test values for the observed parameters is given in
Figure S1. All models resulted in values that did not significantly differ from the laboratory values (
p-value for all parameters is greater than 0.05).
4. Discussion
The main focus of this study is investigating the integration of Near-Infrared (NIR) Spectroscopy and chemometric techniques to evaluate honey enriched with aromatic plants, aiming to assess changes in its physicochemical properties, color, and antioxidant activity. This research covers honey samples from Kosovo, Albania, and North Macedonia, examining how botanical and geographical variables influence honey quality.
The data reveal significant variations among honey samples from different regions what is in accordance with recent studies [
48,
49,
50]. Kosovo honeys showed higher conductivity and ash content, indicative of richer mineral profiles possibly due to local floral sources or environmental conditions. All values of ash content were under 0.6% which is the maximal allowable value for floral honeys [
50]. Meanwhile, North Macedonian honeys exhibited slightly higher moisture and pH levels, suggesting a different nectar composition [
9]. Albanian samples maintained more consistent sugar content and lighter coloration, aligning with a more uniform coloration of the samples. The impact of aromatic plant addition—namely rosemary, lavender, oregano, sage, and white pine oil—was significant across all tested parameters. Even at low concentrations (0.5%), these extracts altered the honey’s visual characteristics, evident through Hunter color values and Δ
E measurements [
51]. This not only affects marketability but may also signal underlying compositional changes [
49,
50].
In summary, the data show that aromatic plant additions can markedly boost the antioxidant potential of honey, as measured by DPPH inhibition. However, this effect is highly specific to the plant type, concentration, and honey matrix. Wild pine oil and sage are among the most consistently effective additives, while rosemary, lavender, and oregano demonstrate variable performance. These findings underscore the need for targeted formulation when developing functional honey products with enhanced antioxidant properties.
What was certainly expected was a change in antioxidant capacity with the addition of aromatic herbs [
11,
36] and the antioxidant activity, as measured by the DPPH method. The antioxidant activity improved notably with the inclusion of aromatic extracts, supporting the hypothesis that plant additives can enhance honey’s functional properties. The correlation between concentration and increased antioxidant capacity was especially evident at the 1% addition level. This suggests a potential pathway for developing value-added functional foods, appealing to health-conscious consumers. However, no clear linear trend was found where by increasing the concentration of added herbs, honey has an increasingly stronger antioxidant activity, which is most likely a consequence of the uneven distribution and particle size of the powders of added herbs [
52,
53].
The employment of chemometrics, particularly Principal Component Analysis (PCA) and Partial Least Squares (PLS) regression, proved critical in making sense of the complex, high-dimensional data set [
13,
19]. PCA enabled the clustering of samples based on spectral and physicochemical similarities, while PLS regression models demonstrated high predictive power for quality parameters, with R
2 values nearing 1 [
25,
27,
29] for several traits like ash content, antioxidant activity, and acidity. Our study highlights that NIR, when coupled with chemometric tools, offers a non-destructive, rapid, and eco-friendly alternative to traditional analytical techniques as confirmed in other studies as well [
13,
14,
17,
19]. This is particularly valuable for real-time quality control in food production environments [
19,
25,
42]. Another notable contribution of this work is its demonstration of geographic traceability. The PLS–DA model successfully distinguished honey origins with over 96% accuracy, especially strong in Albanian samples. This capability is critical in combating food fraud and enhancing consumer confidence [
48,
50]. By linking spectral data to origin and composition, the system could be expanded into authentication protocols across the honey supply chain.
Although this study provides robust insights, some limitations exist: (i) geographical narrowness (the samples are originally from Kosovo, Albania, and North Macedonia, which potentially limits the generalizability of our conclusions); (ii) limited scope of added herbs (only five aromatic herbs were tested in three different concentrations, and sensory and microbiological analysis was not performed); (iii) form of added samples (powder and oil, with which it was intended to simulate a “home-made” preparation) which can also affect the measurements due to particle size). In the sensory evaluation, we could only evaluate the extremely pleasant smells of the preparations, but their evaluation or taste evaluation was not performed. This is certainly necessary if the enriched honey preparation is to be offered to consumers. Furthermore, environmental variables like seasonality and storage were not deeply explored, which could influence the reproducibility of results [
54,
55].
Overall, the integration of NIR and chemometrics represents a significant advancement in honey analysis, combining scientific rigor with practical application potential [
45].
5. Conclusions
There are clear plant-specific and concentration-dependent effects on the physicochemical properties of honey: (i) added wild pine oil increases pH and reduces acidity and moisture—potentially desirable traits for stability; (ii) added rosemary tends to increase acidity and moisture, particularly at 0.8%; (iii) the addition of lavender often lowered pH, °Brix, and conductivity, especially at higher concentrations; (iv) the addition of oregano showed modest positive effects on °Brix and antioxidant inhibition, depending on the row honey to which it was added, and (v) adding sage maintains °Brix values close to the control across most honeys while decreases slightly pH and conductivity.
These observations suggest that aromatic plant additions not only impact antioxidant activity but also significantly modulate honey’s core quality attributes. Sage, unlike rosemary or oregano, does not induce extreme changes, making it a balanced additive for improving antioxidant activity without compromising honey’s physicochemical quality. It may be especially suitable where moderate acidity and stable sugar content are desired. In conclusion, antioxidant inhibition (I) in enriched honey samples is influenced by a complex interplay of plant type, concentration, and the base honey’s original properties. While additives like wild pine oil and sage show consistent benefits, others like oregano exhibit variability depending on context. Optimizing additive type and concentration is essential for maximizing honey’s functional qualities, including antioxidant activity.
This research confirms that NIR spectroscopy combined with chemometric analysis is a powerful tool for assessing the quality of honey (physicochemical properties, antioxidant activity, and color) enriched with aromatic plant extracts. The method enables differentiation due to botanical additives and predicts quality parameters with high accuracy. These findings support its adoption for efficient, non-invasive, and environmentally sustainable honey quality monitoring. Moreover, the addition of aromatic herbs enhances the antioxidant properties of honey, opening opportunities for developing premium, functional food products with verified health benefits.

 ,
, 


