Article

Polydopamine-Coated Magnetite as a Sensing Material for the Optical Detection of Cationic Surfactants

by
Alberto Fernández-Núñez
1,
Francisco Pérez-Pla
1,
Maria Ángeles Úbeda
2,
Pedro Amorós
1 and
José V. Ros-Lis
3,*
1
Institut de Ciència dels Materials (ICMUV), Universitat de València, C/Catedrático José Beltrán 2, 46980 Paterna, Spain
2
Departamento de Química Inorgánica, Universitat de València, C/Dr. Moliner 50, 46100 Burjassot, Spain
3
REDOLí Research Group, Instituto Interuniversitario de Investigación de Reconocimiento Molecular y Desarrollo Tecnológico (IDM), Universitat de València, C/Dr. Moliner 50, 46100 Burjassot, Spain
*
Author to whom correspondence should be addressed.
Chemosensors 2025, 13(4), 125; https://doi.org/10.3390/chemosensors13040125
Submission received: 24 December 2024 / Revised: 9 March 2025 / Accepted: 26 March 2025 / Published: 2 April 2025
(This article belongs to the Section Applied Chemical Sensors)

Abstract

:
The sensing of surfactants is a topic of interest for industrial and environmental purposes. Polydopamine-coated magnetite (Fe3O4@PDA) can be a relevant support for the detection of cationic surfactants in water samples. The negative charge in the surface of the PDA material favors the interaction with cationic molecules and allows the design of a chemoreagent for the detection of cationic surfactants by displacement or competition with methylene blue (MB). Magnetite nanoparticles with single and double PDA coating have been prepared and characterized. The PDA surface effectively coats magnetite nanoparticles with a thickness of 5 or 19 nm and a Z potential of −30 mV. The adsorption of MB follows second-order kinetics, and up 33 mg of dye can be loaded in 1 g of the support. The cationic surfactants can displace MB from the Fe3O4@PDA surface, coloring the solution. Thus, it can be applied for the analysis of water samples. The system is selective towards cationic molecules with long alkyl chains, but the response is influenced by high concentrations of divalent cations. The material can be used following diverse sensing protocols with a detection range from 4 × 10⁻⁶ to 2 × 10⁻⁴ M. The simplicity of its handling together with the naked eye detection allows its application in kits for field analysis with screening purposes.

1. Introduction

Surfactants are universal in various aspects of daily life and embody an invaluable part of all possible industrial applications. They are used in several manufacturing process and everyday products, from detergents and personal care products, to paints, textiles, and leather products [1,2]. Special mention should be made of cationic surfactants, which are frequently used due to their emulsifying, antimicrobial, and corrosion-inhibiting properties [3,4]. However, as the use of surfactants has increased, so have their inadvertent release into water sources and the concerns about their environmental impact, particularly in aquatic ecosystems. Although most wastewater treatment systems have improved significantly, a residual fraction of surfactants still finds its way into marine environments, causing environmental problems. For example, the accidental or uncontrolled release of hexadecyltrimethylammonium bromide (CTAB) into freshwater and marine environments generates ecotoxicological challenges [4,5,6]. This problem highlights the need for easy screening systems that support more comprehensive assessments regarding the intensity and geographical distribution of cationic surfactants in water sources.
Simple and reliable detection and quantification of surfactants in different matrices have become popular in recent years. There are different methods for the detection of ionic surfactants, such as titrimetry, spectrophotometry, spectrofluorimetry, chromatography, optical sensing, and ion-selective electrodes or ion-selective field-effect transistors. Most of these methods require time-consuming procedures, the use of harmful solvents (such as chloroform in the spectrophotometric ‘‘Methylene Blue’’ method), or are not suitable for in situ quantitative assays [7,8,9,10]. Electrochemical sensors are a very promising option due to their inherent sensitivity, cost-effectiveness, and short response times [11]. Whether using surfactant-selective electrodes or surfactant-sensitive field-effect transistors, these sensors allow the detection of surfactants even at ultra-low concentrations. Despite their efficiency, producing such sensors faces many technical challenges, one of which is the adhesion of selective membranes, which consist primarily of plasticized polymers such as polyvinyl chloride (PVC) [11].
The combination of supramolecular concepts with nanomaterials has enabled an unprecedented tuning of the properties of nanoscopic solids [10,12] facilitating the development of new, revolutionary synergistic strategies for chemical analysis, including the detection of surfactants [10,13]. Among the nanomaterials, magnetite (Fe3O4) stands out as a mechanical support. It is a cost-effective widely available and versatile material characterized by its interaction with magnetic fields, a relatively stable chemistry, biocompatibility, and low environmental toxicity [14,15,16,17]. In chemical analysis, magnetite nanoparticles (MNPs) emerge as a particularly promising material for conducting quantitative detection and separation of cationic surfactants using magnetic solid-phase extraction (MSPE) technology due to its inherent ferrimagnetic properties, high specific surface area, and easy synthesis and functionalization [18,19]. MNPs have been widely used in water purification as well as playing a main role in the extraction of metal ions, organic contaminants, and pesticide residues [20,21,22,23].
Among the coatings, the polymer derived from dopamine, polydopamine (PDA), is characterized by a good coverage, easy synthesis, and highly unusual adhesive properties compared to other synthetic polymers [24,25,26,27]. The abundance of amine and catechol groups in PDA, together with a negative surface charge allows multiple supramolecular interactions, which endows magnetic composites containing PDA with enormous practical potential for the capture of contaminants in water [28,29]. It has been used in fields such as biomedicine, [30,31,32,33,34] catalysis [35,36] or water treatment [37,38]. Magnetite coated with polydopamine has shown promise across an even broader spectrum of applications such as sensing of glucose, ethanol, and cholesterol, [25] as well as methylene blue and hydroquinone dyes [39].
Despite the potential of PDA to stablish supramolecular and/or electrostatic interactions with cationic species, and the ability of cationic surfactants to offer competitive interaction with catioinic dyes in anionic surfaces, to our knowledge its application for sensing purposes has not been explored. In this work, we hypothesize that MNPs coated with PDA can be a suitable platform for the colorimetric detection of cationic surfactants in water by competitive adsorption of dyes in the nanomaterial surface. Also, the inclusion of the magnetite core, in comparison with other solutions based on nanomaterials, has the advantage of easy removal of the support enabling absorbance measurement. We expect that this kind of system offers an easy naked-eye detection systems for the screening of the presence of cationic surfactants in water.

2. Material and Methods

2.1. Reagents

Ammonium iron(II) sulfate hexahydrate, ammonium iron(III) sulfate dodecahydrate, dopamine hydrocholoride, tris(hydroxymethyl)aminomethane (TRIS), hexadecyltrimethylammonium bromide (CTAB), methylene blue hydrate, hydrochloric acid 37%, ammonia solution 32%, methanol, magnesium chloride, and calcium chloride were purchased from Sigma Aldrich. Potassium chloride, sodium sulfate, sodium bicarbonate, and potassium nitrate were pruchased from Fluka. Sodium chloride and sodium nitrate were purchased From Panreac. The water sample for the real sample test was purchased from a local supermarket.

2.2. Instrumentation

X-ray powder diffraction (XRD) was conducted utilizing a Bruker D8 Advance diffractometer, which was equipped with a monochromatic CuKα source operating at 40 kV and 40 mA. The patterns were collected in steps of 0.02° (2θ) over the angular range of 20–70° (2θ). The transmission electron microscopy (TEM) images were obtained by means of a JEOL JEM-1010 instrument operated at 100 kV. The quantification of the polydopamine content was conducted by means of thermal gravimetric analysis (TGA) on a TGA 550 Discovery from TA Instruments. The FTIR spectroscopy was performed using a Bruker Tensor-27 equipment. Particle size and zeta potential analysis of the sample was carried out with the Zetasizer nano series particle size analyser from Malvern Instruments. A Jasco UV-Vis V-770 spectrophotometer was utilized to determine the absorbance. Nitrogen adsorption–desorption isotherms were recorded in an automated Micromeritics TriStar II Plus instrument. Prior to the N2 adsorption measurements, the samples were outgassed in situ in vacuum (10−6 Torr) at 110 °C for 15 h to remove adsorbed gases. The specific surface area was determined by applying the Brunauer–Emmett–Teller (BET) model to the adsorption data within the low-pressure range. The pore size and volume of the materials have been determined by applying the BJH model to the adsorption branch isotherm data. The representation of the pore size distributions has been accomplished through the utilization of the function dV/dlog(D) versus D, being D the pore diameter, as this curve underscores the significance of the larger pore ranges.

2.3. Synthesis of the Materials

Synthesis of magnetite (Fe3O4): to a NH4Fe(SO4)2-12H2O (8.3 g) solution in water (40 mL) at 65 °C under inert atmosphere, 3.4 g of (NH4)2Fe(SO4)2-6H2O was added slowly. After complete dissolution, a solution of NH3 (14% w/w in NH3, 25 mL) was added at a rate of 1 mL/min. Then, the reaction mixture was refluxed for 3 h. The black solid was separated by filtration, washed with water and methanol, and dried for 24 h at 70 °C.
Synthesis of PDA-coated magnetite (Fe3O4@PDA-X): 1.7 g of Fe3O4 was dispersed in 150 mL TRIS buffer (10 mM, pH 8.5) and treated by ultrasonication for 15 min. Afterwards, 2 g of dopamine dissolved in 10 mL of water was added dropwise, and the mixture was allowed to react at room temperature (20 °C) for 24 h. The magnetic coated material was separated using an iron manet doped with neodinium and washed with water and methanol. Finally, the material was dried for 24 h at 70 °C, obtaining Fe3O4@PDA-1. The Fe3O4@PDA-1 material was coated again in the same conditions, achieving Fe3O4@PDA-2.

2.4. Dye Adsorption Studies

Assays with different dyes: 5 mg of Fe3O4@PDA-1 was added to 10 mL of a solution of 2.5 × 10⁻⁵ M of dye (Rhodamine 6G, Rhodamine B, Safranine O or Methylene blue) in water and allowed to stir for 24 h. Afterwards, the adsorbent was separated with a magnet, and the absorption spectra of the solution was recorded with a spectrophotometer. The absorbance spectra of the dye before contact with Fe3O4@PDA-1 was also measured for comparison.
Evaluation of the maximum dye absorption capacity: the amount of Fe3O4@PDA-X required to give Fe3O4@PDA-X:MB ratios (w/w) of 0.5:1 to 100:1 was added to 40 mL of a 5 mg L−1 solution of MB and allowed to react under stirring for 24 h. Subsequently, the material was separated by means of a magnet and the absorbance of the remaining solution measured at 662 nm.
Studies of absorption kinetics: 10 mg of Fe3O4@PDA-1 or 6.3 mg of Fe3O4@PDA-2 was added to 40 mL of a 5 mg L−1 MB aqueous solution. Then, aliquots were extracted at diverse times and the absorbance at 662 nm measured. In this case, the material was separated by filtration because it was faster than using the magnet, allowing a more accurate analysis.
Effect of pH: 1 mg of Fe3O4@PDA-1 loaded with MB was added to 10 mL of a aqueous solution with pH 1 to 12, previously adjusted with HCl or NaOH and allowed to stir for 24 h. Afterwards the adsorbent was separated with a magnet, and the absorption spectra of the solution was recorded with a spectrophotometer.
Effect of ionic strength: 5 mg of Fe3O4@PDA-1 was suspended in 10 mL of 0.1, 1, or 10 mM NaCl solutions. Afterwards, 50 µL of MB (0.8 g L−1) was added and allowed to react for 1 h. The material was removed with a magnet, and the absorbance was measured at 662 nm.
Effect of ions common in water: 5 mg of Fe3O4@PDA-1 loaded with MB was added to 10 mL of a water solution containing NaCl, KCl, NaNO3, KNO3, NaHCO3, CaCl2, Na2SO4, or MgSO4 10−4 M and allowed to stir for 1 h. Afterwards, the material was removed with a magnet, and the absorbance measured at 662 nm.

2.5. Dye Desorption Studies

Studies of CTAB-induced desorption: First, to load the support with MB, 10 mg Fe3O4@PDA-1 or 6.3 mg Fe3O4@PDA-2 was added to 40 mL of a 5 ppm solution of MB in water and stirred for 24 h. To evaluate desorption, 1 mL of CTAB was added to the previous suspension at various concentrations. The CTAB:MB ratios ranged from 0:1 to 50:1 (w/w). It was allowed to react for one hour, filtered, and the absorbance at 662 nm measured.
Evaluation of the effect of diverse surfactants: 5 mg of Fe3O4@PDA-1 loaded with MB was added to 10 mL of a water solution containing sodium dodecyl sulfate (SDS), dodecyltrimethylammonium bromide (C12+), tetradecyltrimethylammonium bromide (C14+), hexadecyltrimethylammonium bromide (C16+), or octadecyltrimethylammonium bromide (C18+) 10−4 M and stirred for 1 h. In the case of pluronic 127 (P127), the same volume was tested, but the concentration was 35 ppm. Afterwards, the material was removed with a magnet, and the absorbance was measured at 662 nm.

2.6. Sensing Studies

For the evaluation of the effect of the three sensing approaches, the same procedure with slight variations was used. For the initial adsorption of MB followed by contact with the water sample (see Scheme 1a), 10 mL of a CTAB containing water solution was added over 5 mg of Fe3O4@PDA-1 loaded with MB, and the suspension was stirred for 2 h. Afterwards, the adsorbent was separated with a magnet and the absorbance of the solution measured at 662 nm. For the evaluation of the method in which the water sample is exposed to Fe3O4@pDA-1 followed by the addition of MB (Scheme 1b), 5 mg of Fe3O4@PDA-1 was added to 10 mL of a water sample containing CTAB and allowed to react for 1 h. Afterwards, the water sample was removed with the aid of a magnet to retain the adsorbent material, 10 mL of a 4 ppm MB solution in water was added, and the mixture was allowed to react for 1 h. Finally, the solution was recovered with the aid of a magnet, and the absorbance was measured at 662 nm. Regarding the third approach, in which the MB and the sample are added simultaneously (Scheme 1c), 5 mg of Fe3O4@PDA was added to 10 mL of a water sample containing CTAB, followed by the immediate addition of 50 µL of 800 ppm MB solution. The mixture was allowed to react for 1 h, the solution recovered removing the solid with a magnet, and the absorbance measured at 662 nm.
Effect of ions: 10 mg Fe3O4@PDA-1 was added to 50 mL of a water sample containing 100 ppm of CTAB, 4 ppm of MB, and Na+ (115 ppm), K+ (195 ppm), Mg2+ (100 ppm), or Ca2+ (40 ppm). After 1 h, the material was removed with a magnet and the absorbance at 662 nm measured.
Analysis of real samples: mineral still water (Bezoya) was doped with CTAB. A concentrated solution of CTAB in Bezoya water was prepared and mixed with the appropriate volume of non-doped water to reach the desired CTAB concentration. The analysis procedures were indicated in the evaluation of the effect of the three sensing approaches in this section. For the standard addition method, following the experimental procedure in this type of analysis, to a water solution containing CTAB, a Bezoya water containing CTAB was mixed with deionized water, without CTAB or containing variable amounts of CTAB within the linear range to obtain a calibration line. The concentration was determined from the concentration of the cut-off point with the X-axis

3. Results and Discussion
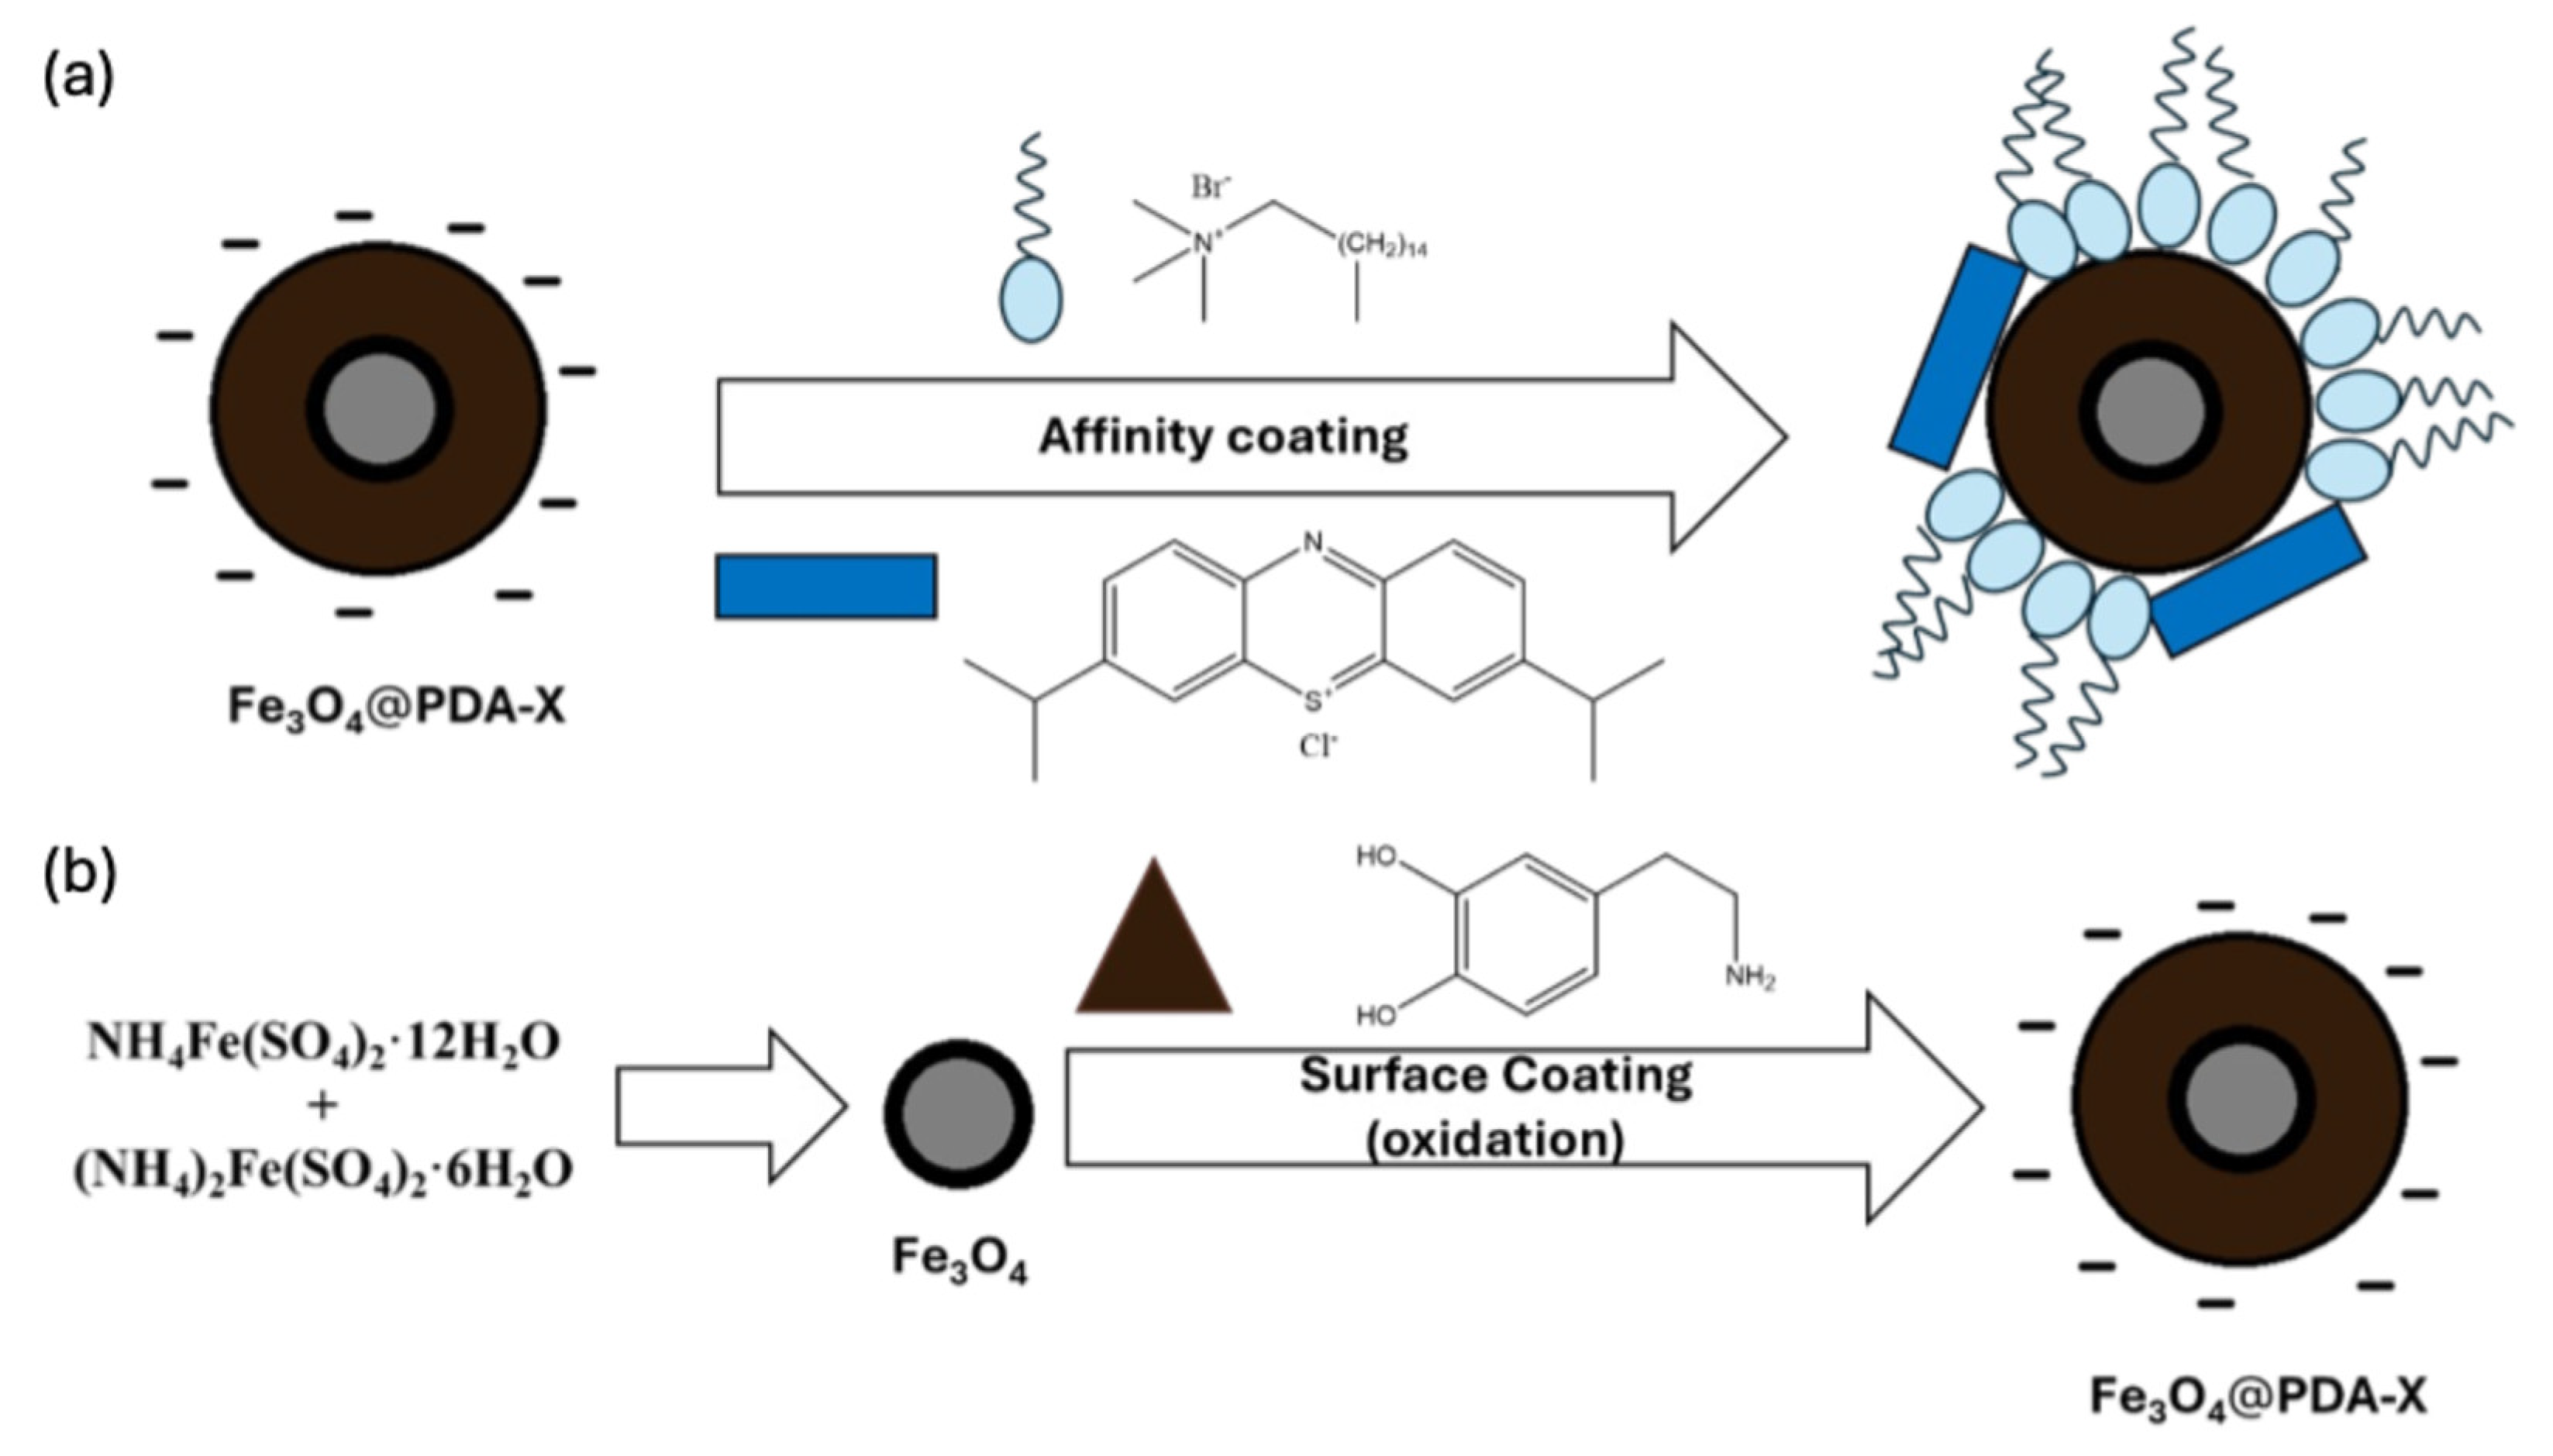
3.1. Sensing Design

PDA can be an interesting support for a novel detection method of cationic surfactants based on competitive surface adsorption. PDA presents diverse coordinating groups and negative charge in the surface. In our case, the prepared sensing materials combine the easy separation offered by a Fe3O4 magnetic core, with the specific adsorption properties of a polydopamine coating. In the absence of cationic surfactant, cationic dyes tend to adsorb on the surface of the material, with a negative charge. On the contrary, when a cationic surfactant is present, it occupies part of the surface decreasing the amount of dye adsorbed (see Scheme 2a). The presence of the dye in solution indirectly informs the amount of surfactant in the sample. It can be easily quantified by means of a spectrophotometer, a widely available equipment, simplified optical systems, or followed with the naked eye. However, to measure the absorbance or evaluate the color properly, it is necessary to remove the suspended material, the reason why a magnetite core was included.

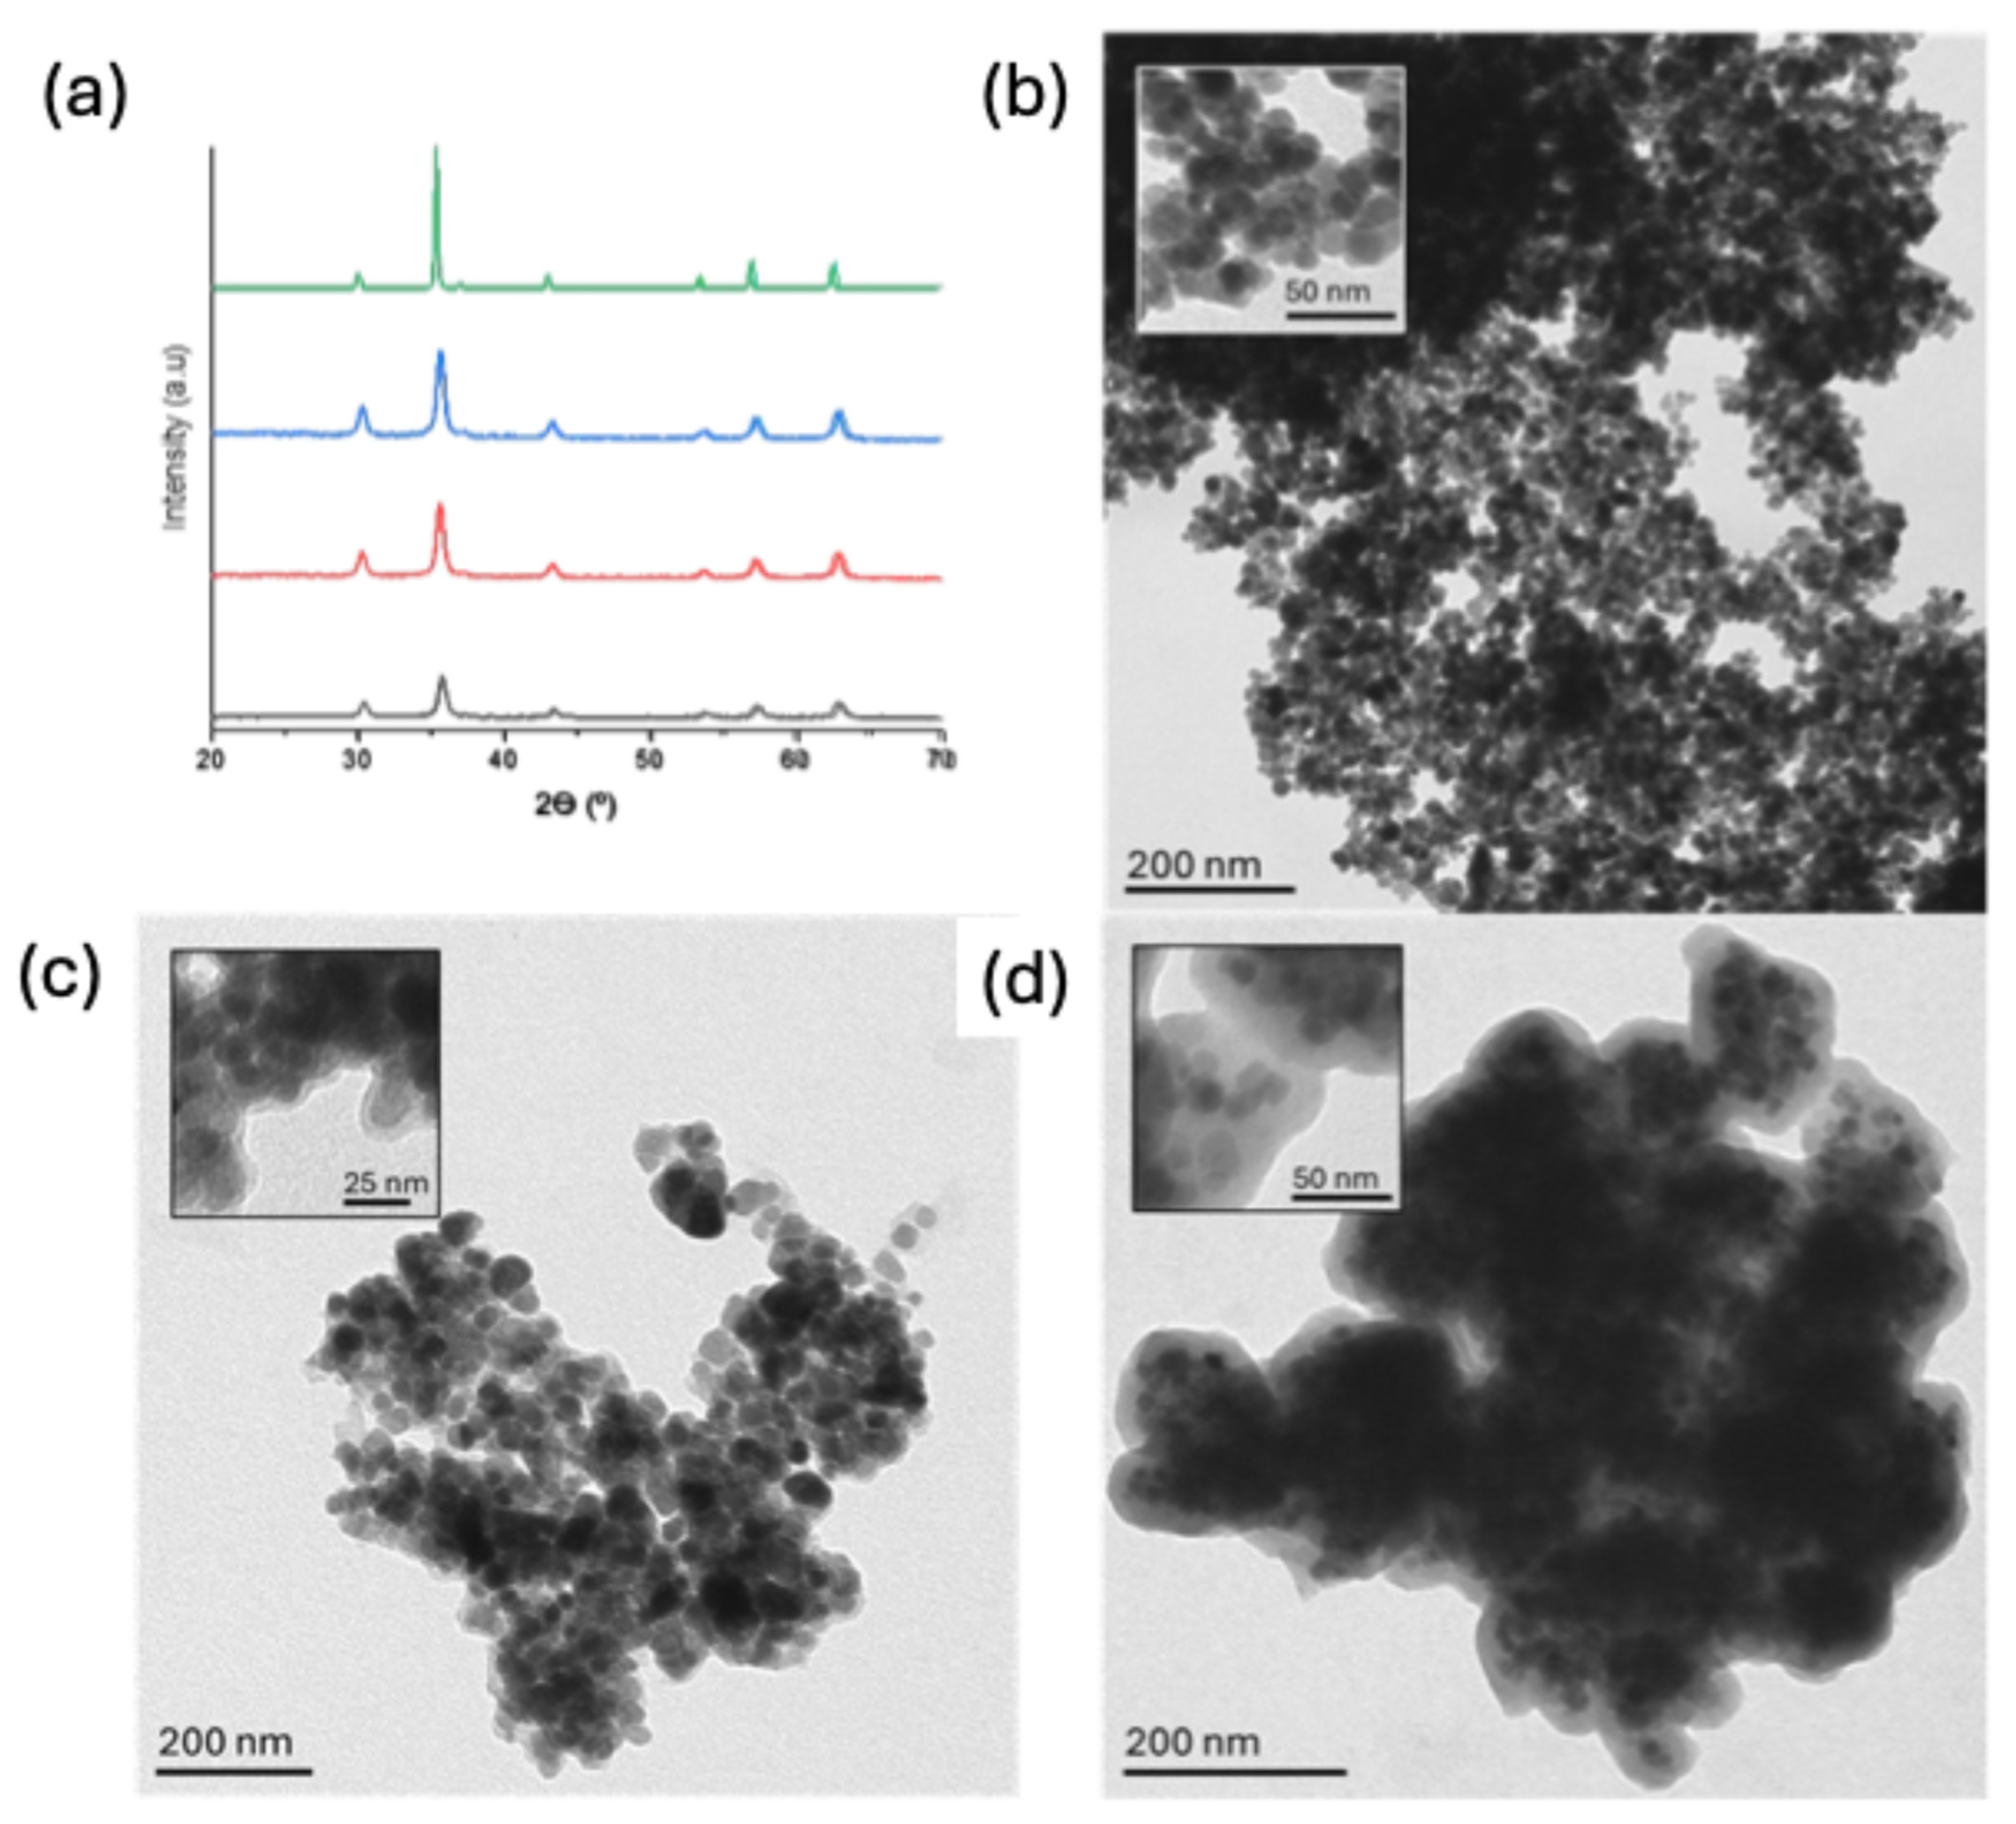
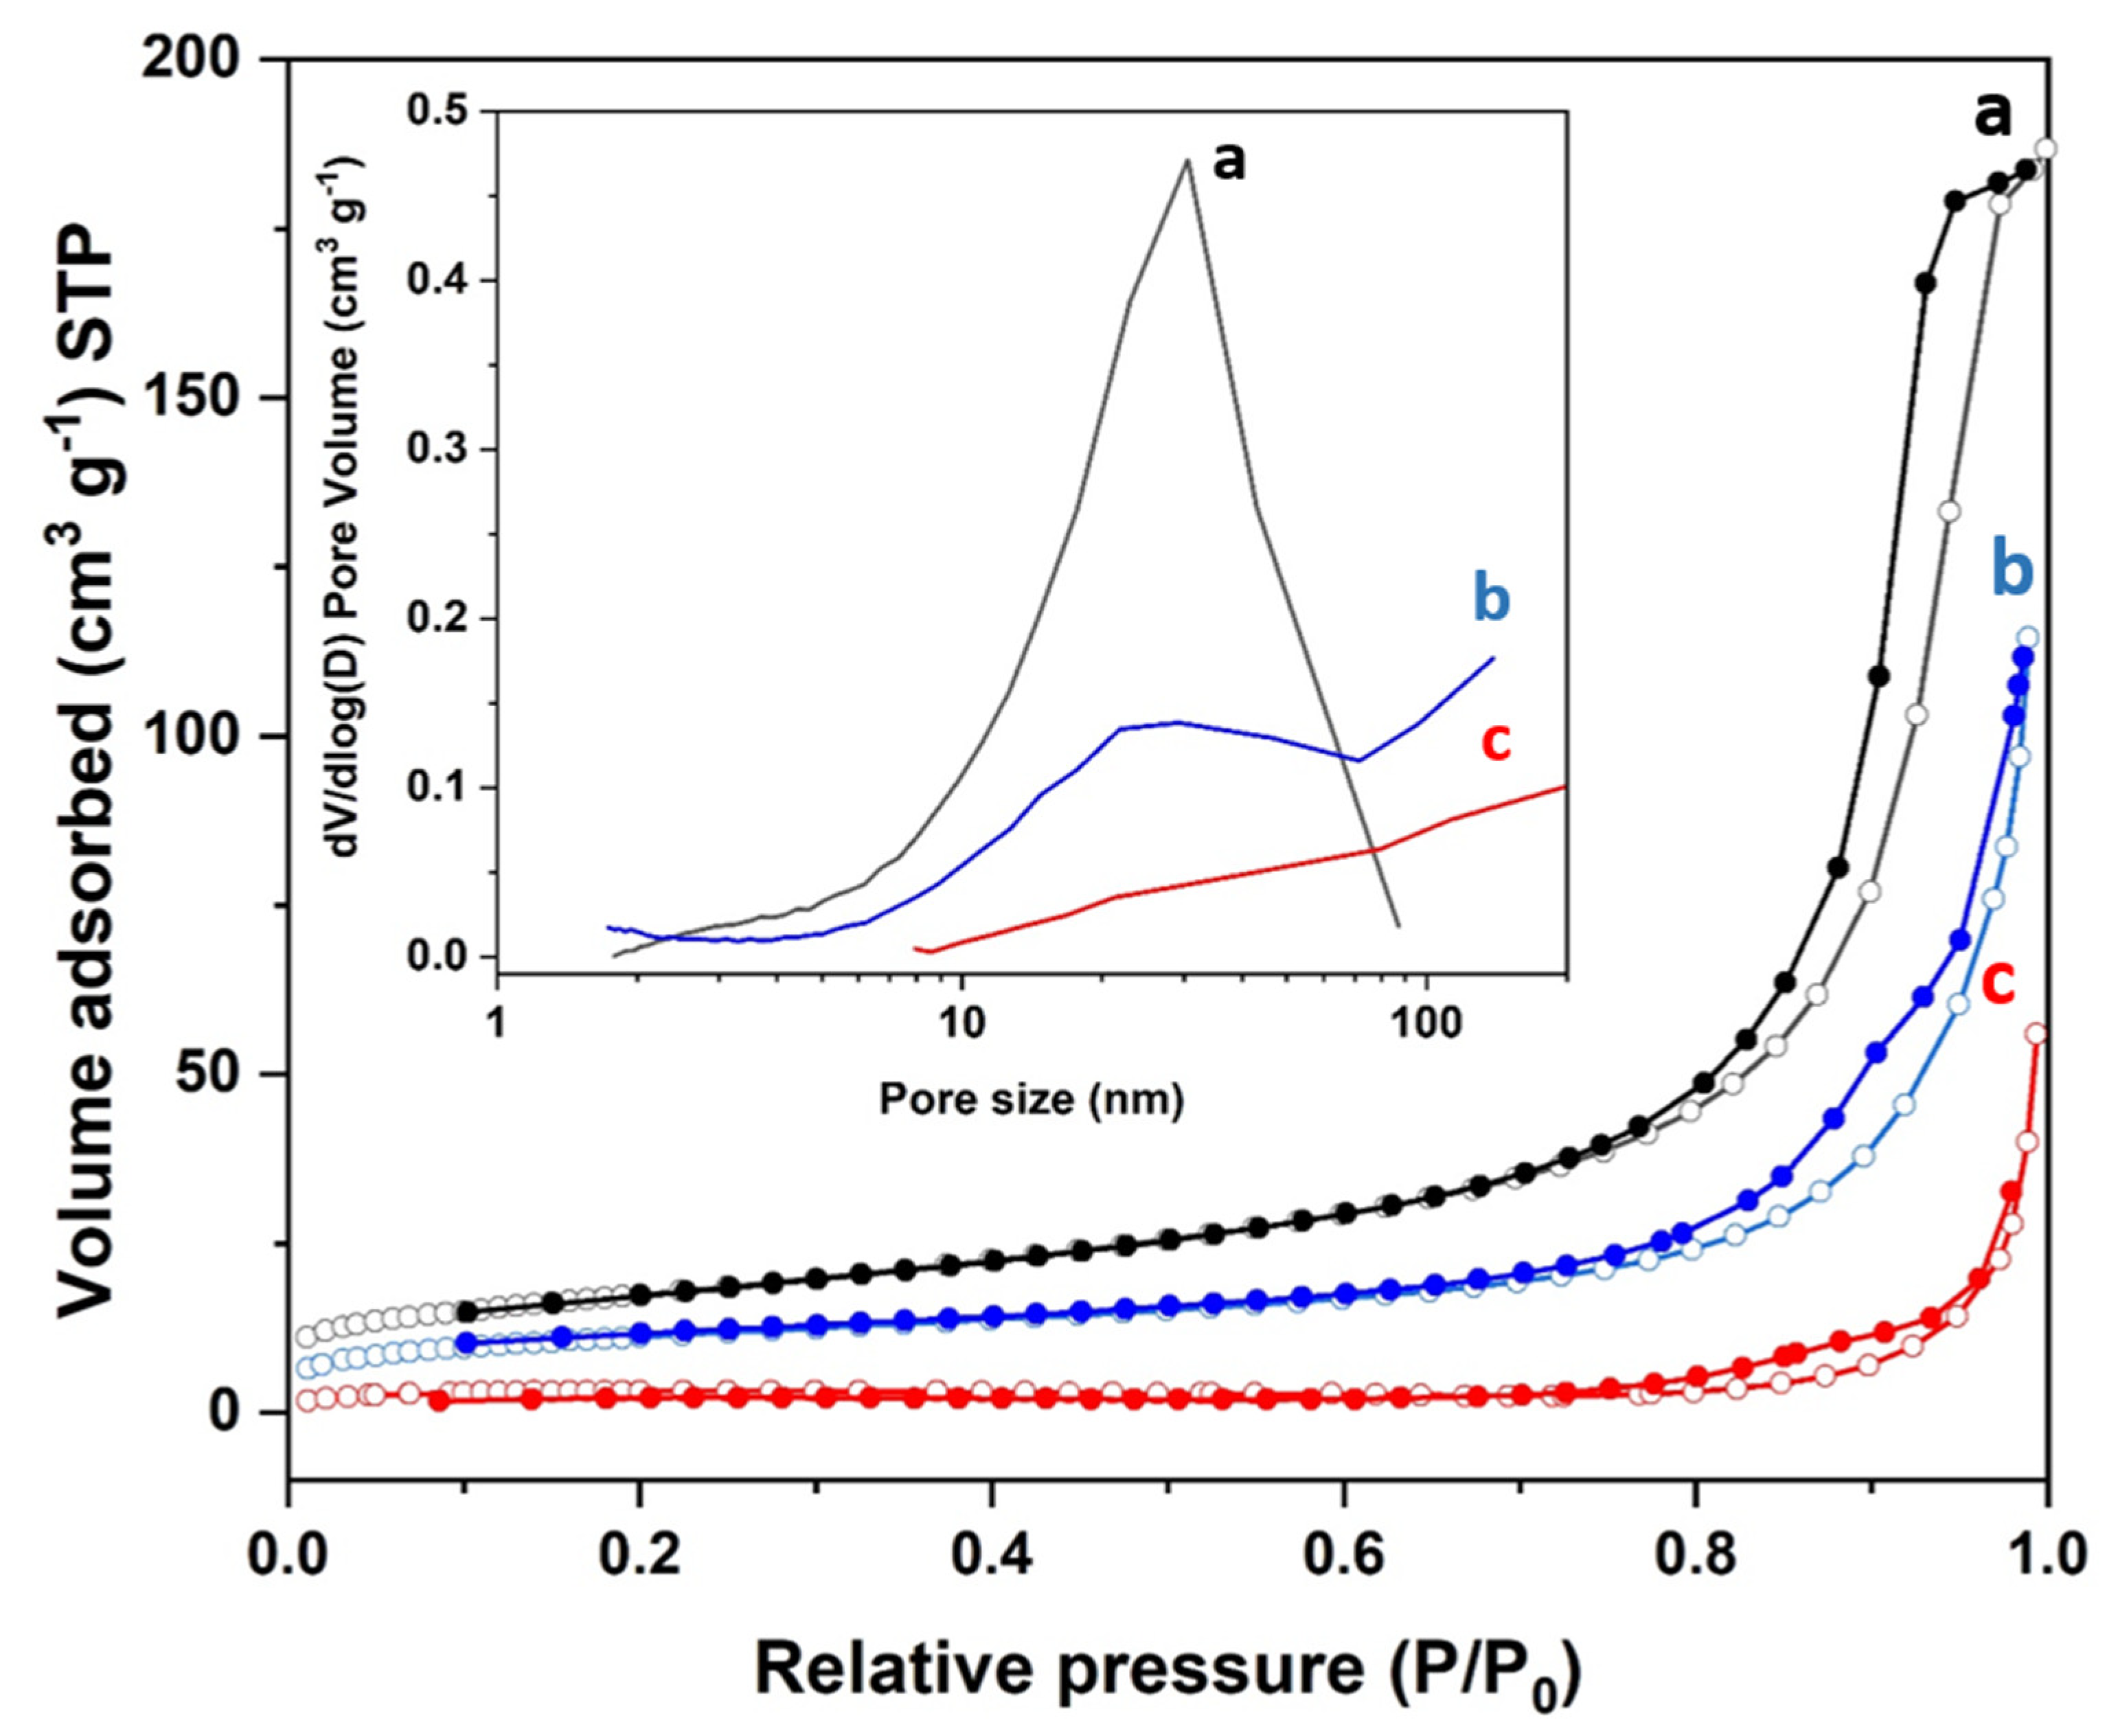
3.2. Synthesis and Characterization of the Materials

The magnetite particles were synthesized by the combination of Fe(II) and Fe(III) salts in an inert atmosphere to avoid oxidation. The resulting material was coated with dopamine through a process of autoxidative polymerization, which resulted in a homogeneous coating of the suspended particles (see Scheme 2b). In addition, the already coated magnetite particles were subjected to a new coating process to study the effect of the thickness of the PDA layer on its surface interaction properties. Thus, three materials were synthesized, two with polydopamine coating in one or two steps (Fe3O4@PDA-1 and Fe3O4@PDA-2), and one without a PDA coating (Fe3O4).
The solids were characterized by standard procedures. The XRD patterns (Figure 1a) agree with the presence of crystalline magnetite without any remarkable extra peaks. Six pronounced characteristic peaks can be assigned to the (200), (311), (400), (422), (511), and (440) hkl [40,41]. After functionalization, the peaks position and intensity were maintained, confirming that the magnetite structure remains unchanged during the dopamine polymerization. The crystallite size was determined using the modified Scherrer method, ref. [42] which reduces errors and provides a constant crystal size for all diffraction peaks. This was achieved by analyzing the six intense reflections previously mentioned, whose profiles were fitted to a pseudo-Voigt function. We worked out the FMHW associated with the equipment by fitting the peak profiles of a LaB6 pattern to pseudo-Voigt functions. The corrected values were subsequently employed to ascertain the crystallite sizes of the PDA-free Fe3O4 and Fe3O4@PDA-1 and Fe3O4@PDA-2 samples, which were determined to be 15.7 ± 0.3 nm, 16.2 ± 0.3 nm, and 16.3 ± 0.3 nm, respectively.
As expected, a change in the surface charge was observed after the PDA coating. The zeta potential increased from −1.5 mV in the case of Fe3O4 and close to −30 mV for Fe3O4@PDA-1 and Fe3O4@PDA-2 (Table 1). The magnetic core seemed to be completely coated with PDA after the first process; therefore, the second coating would increase the thickness of the PDA layer without modifying the surface charge. Remarkably, the particle size decreased from 2700 to 369 nm in the first coating process (Table 1), probably because the highly negative Z potential favors the disaggregation, and after the coating, the material is better dispersed. The second coating would facilitate the particle merge, but not to the extent of the non-coated material. The particle/grain size appears to be dependent on two parameters: the Z potential and the cohesion capacity of the PDA. Therefore, in the case of Fe3O4 particles coated with a relatively thin layer of polymer, the size decreases markedly, primarily due to the notable increase in the Z potential, which results in a dispersion enhanced by a high repulsion between grains. An increase in PDA content, while maintaining a high Z potential, implies the coverage and binding of a greater number of magnetic cores, resulting in an expansion of the average grain size. The grain size doubles, but we are still very far from the original magnetite aggregates. In our application the presence of particles in the nano range is not mandatory, but little particles can favor the surface processes such as the interaction with cationic surfactants and dyes. The PDA coating was confirmed also by IR with the apparition of absorption bands at 1290 and 1486 cm−1, which can be ascribed to the (C=C) and (C–N) bonds of the polydopamine coating, respectively [44].
More detailed information about the morphology of the prepared materials can be obtained by TEM (Figure 1b–d). All the materials have a similar morphology based on the aggregation of several 15–20 nm magnetite nanoparticles [45]. Magnetite nanoparticles have a single crystal appearance. This is in agreement with crystallite size estimates from XRD data. After the PDA coating process, the morphology of the magnetite (dark) cores is maintained, but the appearance of an organic coating (gray in the TEM images due to its lower intensity) can be envisioned for Fe3O4@PDA-1 and is clearly observed for Fe3O4@PDA-2 as it is thicker. Although it is difficult to estimate, measurements in the TEM images reveal that the PDA layer has a thickness of 5.0 ± 1.3 and 19 ± 5 nm for Fe3O4@PDA-1 and Fe3O4@PDA-2, respectively. As expected, the layer thickness for a material with two coating steps is higher than for material with a single step. It is important to note that the increase in PDA content does not imply segregation of the polymeric component. Thus, the TEM images of the Fe3O4@PDA-2 sample also show a homogeneous and regular architecture in which the PDA captures a greater number of magnetite particles and coats them in a regular manner. This increase in the thickness of the PDA coating reduces the voids or cavities observed in the TEM images of the material Fe3O4@PDA-1. To determine the mass of coating, a TGA was performed, where the percentage of mass lost is attributed to the destruction of organic matter, in this case, the polydopamine coating. As expected, the weight loss of pure magnetite is negligible. A decrease of about 17% by weight is observed for Fe3O4@PDA-1 and 41% for Fe3O4@PDA-2 (Table 1).
The coating does not only affect the particle size but also the porosity. The N2 absorption/desorption analysis of Fe3O4 reveals a significant surface area typical of nanoparticulated materials (62 m2 g−1) (Table 1). The N2 adsorption–desorption isotherm of the PDA-free Fe3O4 sample shows an abrupt step at relatively high-pressure values P/P0 > 0.75 (Figure 2). This feature is not due to an intrinsic porosity and can be assigned to the textural voids created by the aggregation of the little magnetite nanocrystals. The BJH-pore size distribution shows a large signal associated with large mesopores. The BJH model gives a mean pore size value of 18.9 nm and a maximum in the size distribution curve at ca. 28 nm. In the coating process, the PDA covers the voids and significantly reduces the surface area and pore volume, especially after the second coating (Table 1). As the amount of PDA increases, the large mesopores gradually disappear. The pore size distribution of the Fe3O4@PDA-1 sample shows a signal combining large mesopores (with a maximum in the distribution curve at ca. 30 nm) and macropores (>90 nm). Finally, after the second PDA incorporation, the large mesopores are practically negligible. This tendency is in good accordance with the TEM images (Figure 1b–d) in which some textural pores remain after the first coating, but they almost completely disappear for Fe3O4@PDA-2.

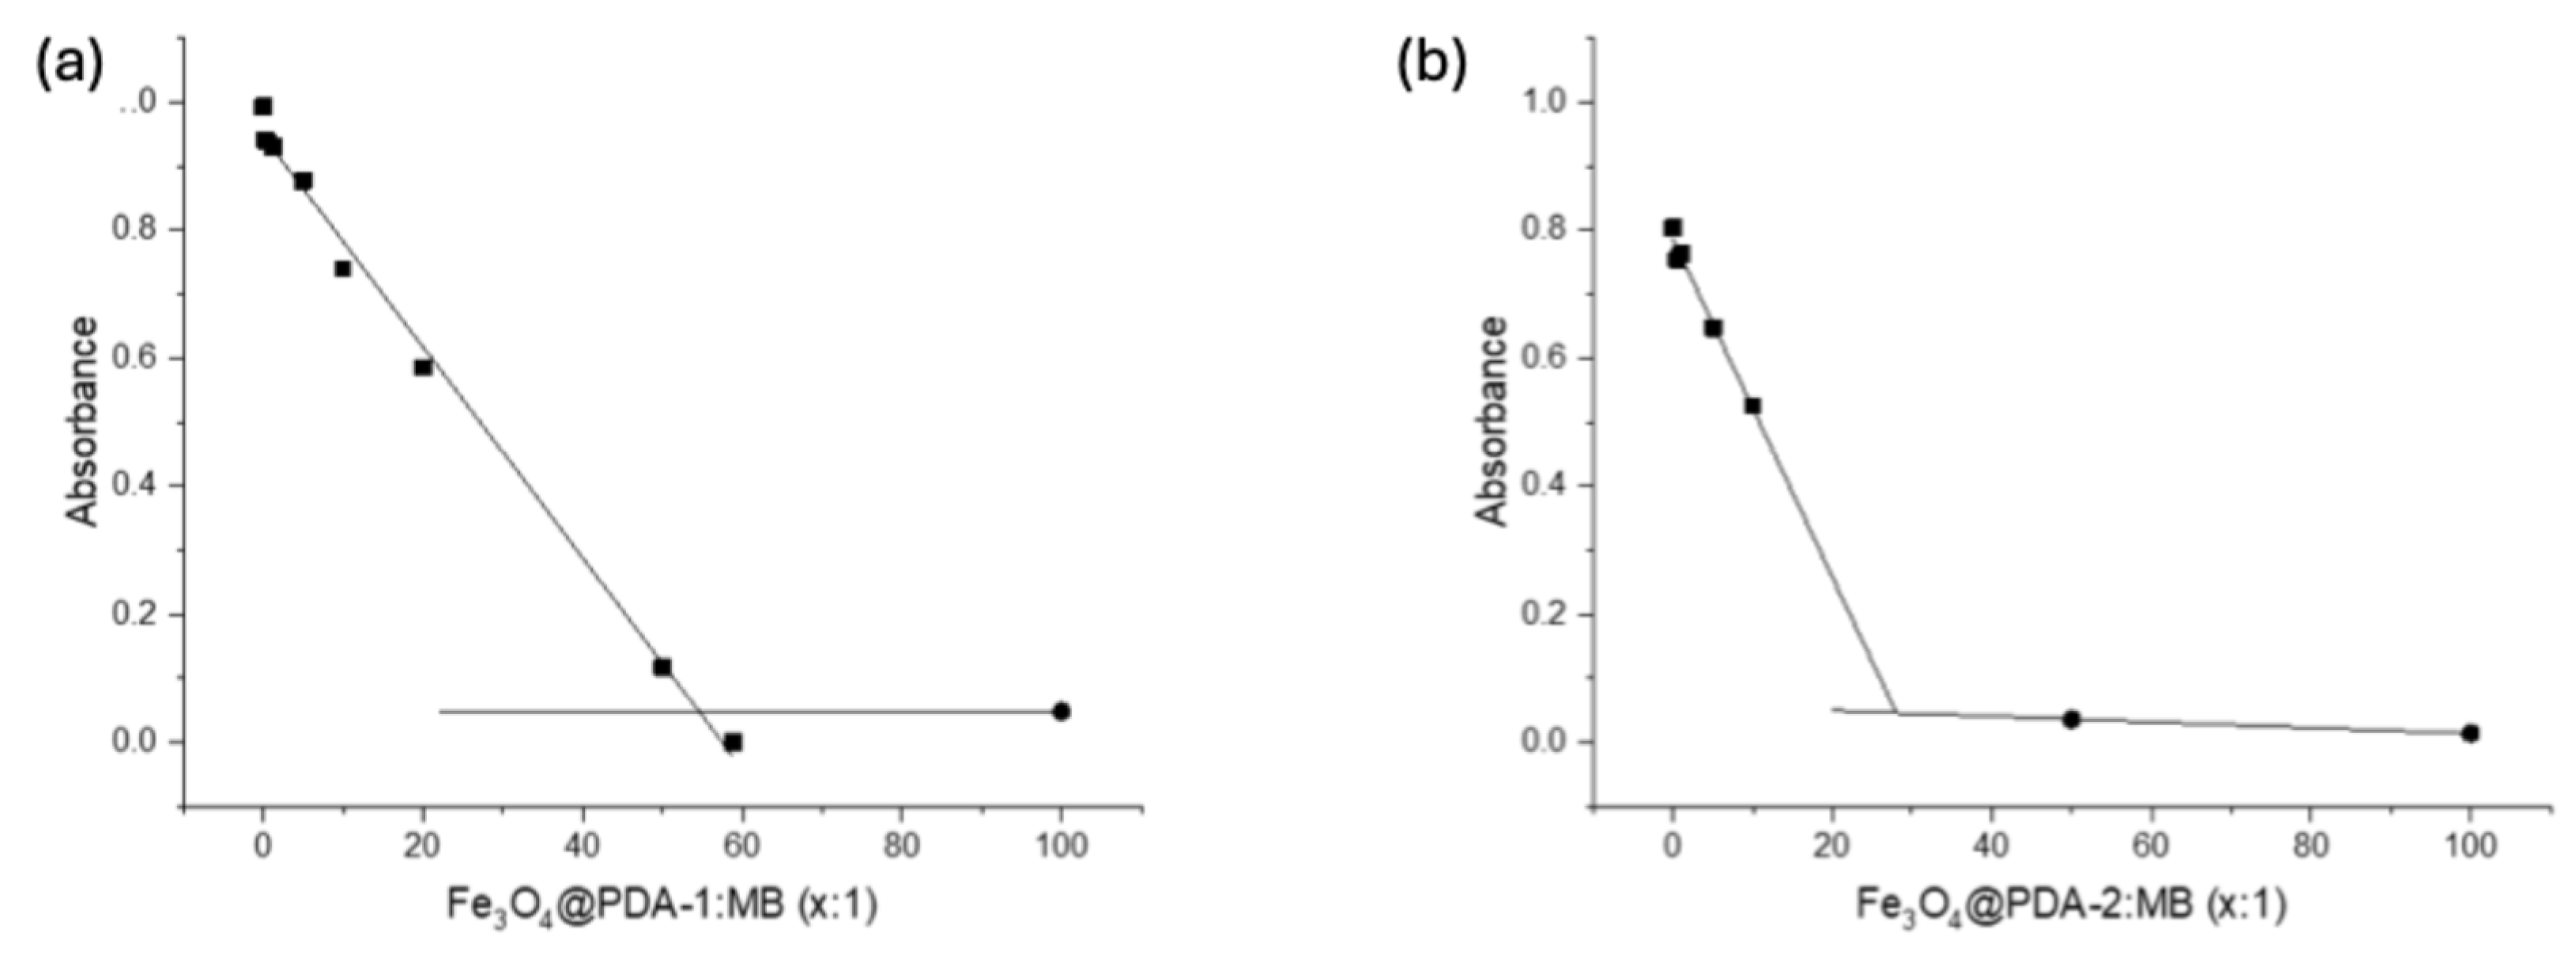
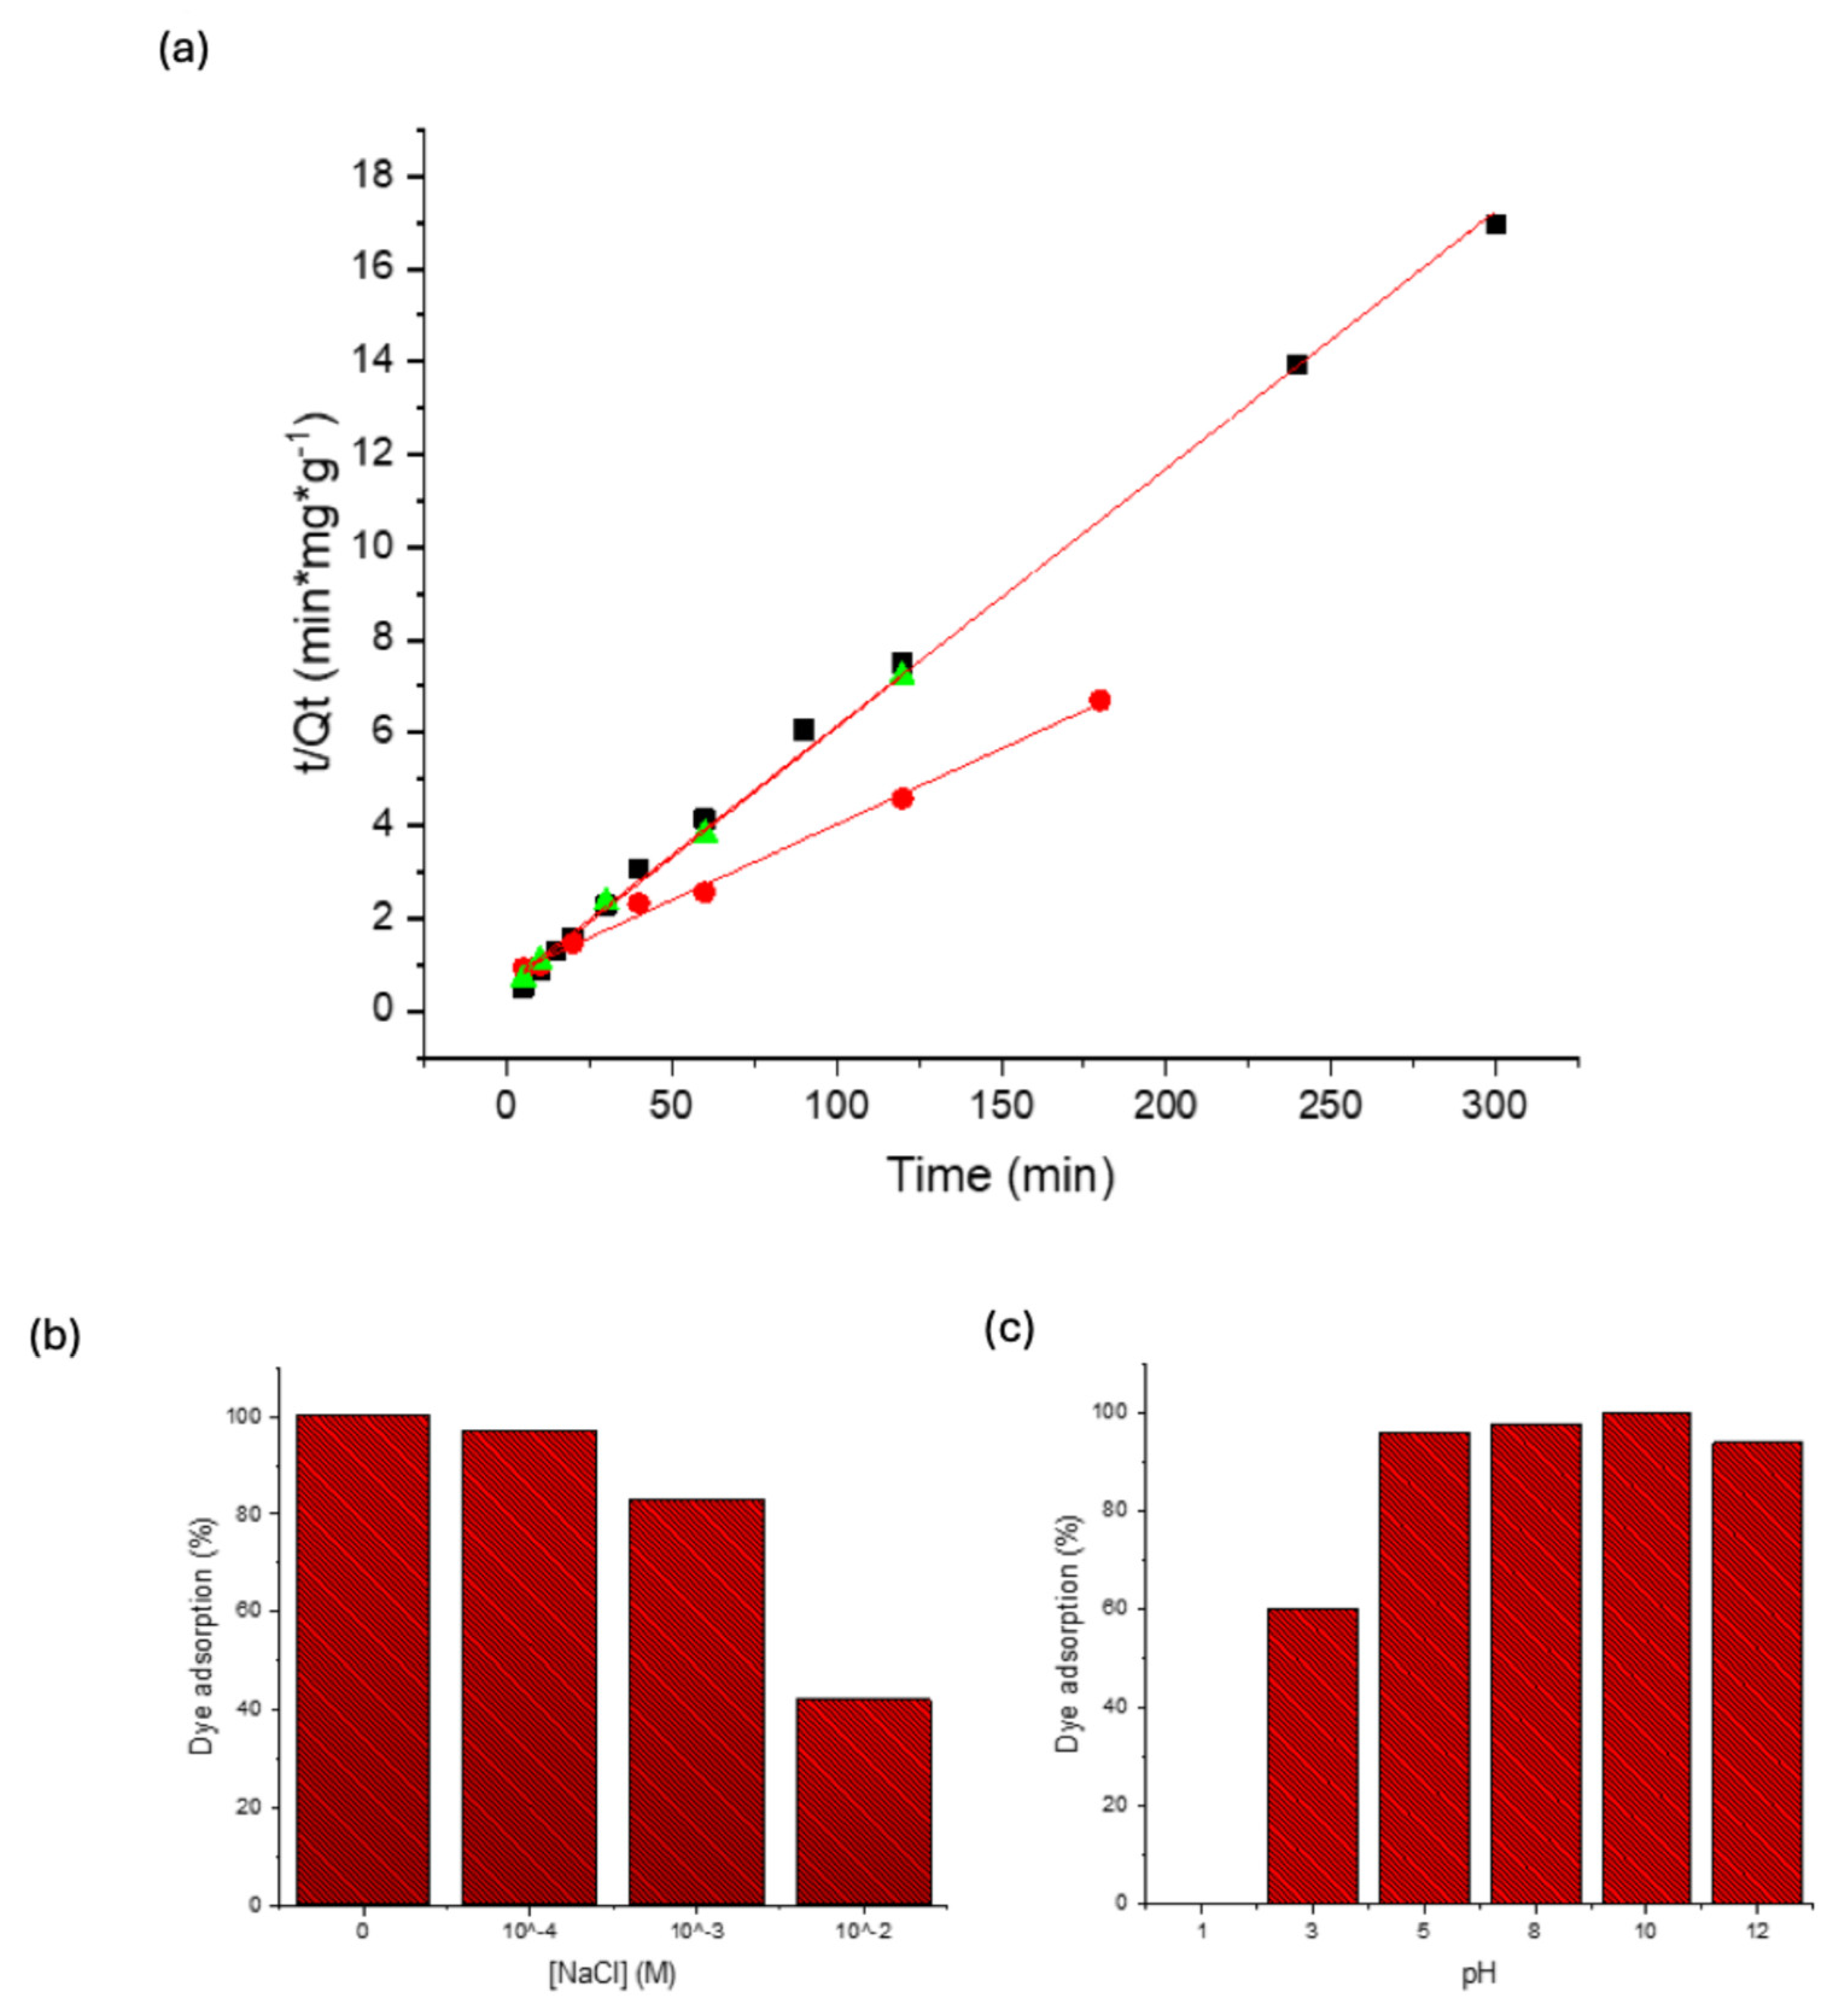
3.3. Dye Adsorption Studies

Considering our objective to develop a reagent for the detection of cationic surfactants in water by displacement/competition with a dye that acts as a signaling unit, the ability of Fe3O4@PDA-1 to absorb different dyes with cationic groups was studied (see Figure S1). Rhodamine 6G, Rhodamine B, Safranine O, and Methylene blue (MB) were selected, as they are widely used dyes with a high molar extinction coefficient. Under the test conditions, the absorption was complete for the case of Methylene blue and Safranine O, and almost complete for Rhodamine G. However, the absorption of Rhodamine B was lower than 25%. The main difference between Rhodamine 6G and Rhodamine B is the presence of a carboxylic acid group in the latter that counteracts the positive charge and can, therefore, decrease the interaction. Among the two dyes that offered the highest absorption, methylene blue was chosen for the following studies because of its higher molar extinction coefficient and, therefore, greater sensitivity. For the sake of comparison, the absorption capability of non-coated Fe3O4 was evaluated. The PDA coating resulted essential for the MB adsorption, as revealed by the 0.04 mmol of MB (g of material)−1 captured by Fe3O4, much lower than the value of 0.18 mmol of MB (g of material)−1 measured for Fe3O4@PDA-1. This behavior agrees with the values of Z potential.
The effect of the degree of coating in the Fe3O4@PDA-MB interaction was further evaluated determining the maximum amount of dye that could be absorbed under equilibrium conditions (24 h) (see Figure 3). The amount of nanoparticles necessary to adsorb 1 mg of MB comes from the crossing of the lines. As can be seen, 50 mg Fe3O4@PDA-1 is necessary to retain 1 mg of MB. By contrast, only 30 mg of Fe3O4@PDA-2 is necessary to capture the same amount of dye. A larger amount of PDA increases the dye adsorption, even if the total surface decreases. Regarding the kinetics, the absorption rate decreases over time, which rules out order 0. The effect of pseudo first-order (R2 < 0.99) and pseudo second-order were studied (Figure 4a and Figure S2), and it was observed a better fit for pseudo second-order in all cases (R2 > 0.995). This behavior is not surprising since pseudo-second-order absorption kinetics has previously been described in PDA spheres [46]. This difference in the adsorption capacity of PDA microspheres for organic dyes is attributed to the synergistic effect of electrostatic interaction and π-π stacking between the adsorbent and adsorbate, and the chemical structure of dye molecules [46]. The calculated adsorption rate offers values of 5.1 and 6.1 mg mg−1 min−1 for Fe3O4@PDA-1:MB 50:1 and Fe3O4@PDA-2:MB 50:1, respectively. By contrast, a value of adsorption rate of only 1.4 mg mg−1 min−1 was calculated for Fe3O4@PDA-2:MB 30:1. Under these conditions, it seems that the adsorption rate depends mainly on the amount of adsorbent material.
Since the adsorption of methylene blue on materials is driven by electrostatic forces and both the PDA and the dye have acid-base properties, the ionic strength of the solution and the pH could have a great influence on the dye adsorption. Thus, a process similar to the previous one was carried out in the presence of NaCl at concentrations of 10−4, 10−3, and 10−2 M or at pH 1 to 12 (Figure 4b,c). Cations compete with the adsorption of MB, and this effect increases proportionally to the ionic strength. At relatively low salt concentrations, it is not relevant, but if the concentration is 10−2 M or higher, it can be significant. Therefore, it is advisable to load the material with MB dissolved in deionized water. Also, an evaluation of the desorption in presence of 10−4 M solutions of other cations and anions common in water (K+, NO3, HCO3, Ca2+. SO42− and Mg2+) was taken, with negligible MB desorption except for divalent cations, which induced a desorption lower than 11%. By contrast, the adsorption of the dye is relatively stable over a wide pH range (5–12), so we can choose any of these pHs to charge the material. The isoelectric point of polydomamine has a value round 4; this behavior agrees with a protonation of polydopamine at an acidic pH that would decrease the electrostatic interaction or even generate a positive charge with the consequent dye repulsion, preventing its adsorption [47].

3.4. Dye Desorption Studies

In agreement with the sensing mechanism proposed in Scheme 1, when a solution containing CTAB is brought into contact with the material loaded with MB, a blue coloration of the solution occurs due to the desorption of the dye from the surface of the polydopamine-coated material (Figure 5). As noted above, the ability of the material to be separated by a magnet offering a clear solution is essential for a proper measurement of the absorbance. The release of the dye can be observed in a few minutes, but it is advisable to use a measurement time of around 1 h to reduce the errors associated with the measurement time. After 60 min, only minor variations in absorbance were observed. Furthermore, a higher signal and greater sensitivity was obtained at longer times. The degree of desorption depends on the concentration of CTAB, being higher for more concentrated solutions of surfactant. At a ratio of surfactant: MB 1:1 it can be observed an absorbance up to 0.2, that could be followed to the naked eye. Depending on the surfactant concentration, absorbances close to 0.8 can be obtained. If the response of the material with 1 or 2 layers of PDA is compared, it can be seen that Fe3O4@PDA-1 has greater sensitivity. It must be considered that Fe3O4@PDA-2 has a greater affinity towards methylene blue, thus a lower dye release and absorbance is observed. This effect is particularly remarkable for the material Fe3O4@PDA-2:MB 50:1, whose surface is partially covered by the dye. This implies that there are free surface positions with the capacity to interact with surfactants and, therefore, higher concentrations of surfactant are necessary to displace the MB and observe the appearance of the blue color. From the results obtained, it can be deduced that both Fe3O4@PDA-1 and Fe3O4@PDA-2 materials are suitable for the detection of cationic surfactants in water by color change with the naked eye (appearance of blue color). The Fe3O4@PDA-1 material may be more suitable as it offers higher sensitivity, a greater detection range, and requires a lower synthesis effort.
To evaluate the effect of the surfactant charge and the length of the alkyl chain, a test was carried out in the presence of surfactants with different types of charge and chain length: dodecyltrimethylammonium bromide (C12+), tetradecyltrimethylammonium bromide (C14+), hexadecyltrimethylammonium bromide (C16+), octadecyltrimethylammonium bromide (C18+), SDS (sodium dodecyl sulfate (SDS), and the nonionic surfactant pluronic 127 (F127). As can be seen in Figure 6, cationic surfactants are the only ones that cause MB desorption. Neither anionic nor nonionic surfactants offer sufficient interaction with the PDA surface to displace the cationic dye. Desorption increases with increasing chain size, being very similar for CTABr and ODTMBr. This result suggests that the arrangement of surfactant chains can offer a cooperative effect of supramolecular interaction that facilitates the displacement of methylene blue [10,13].

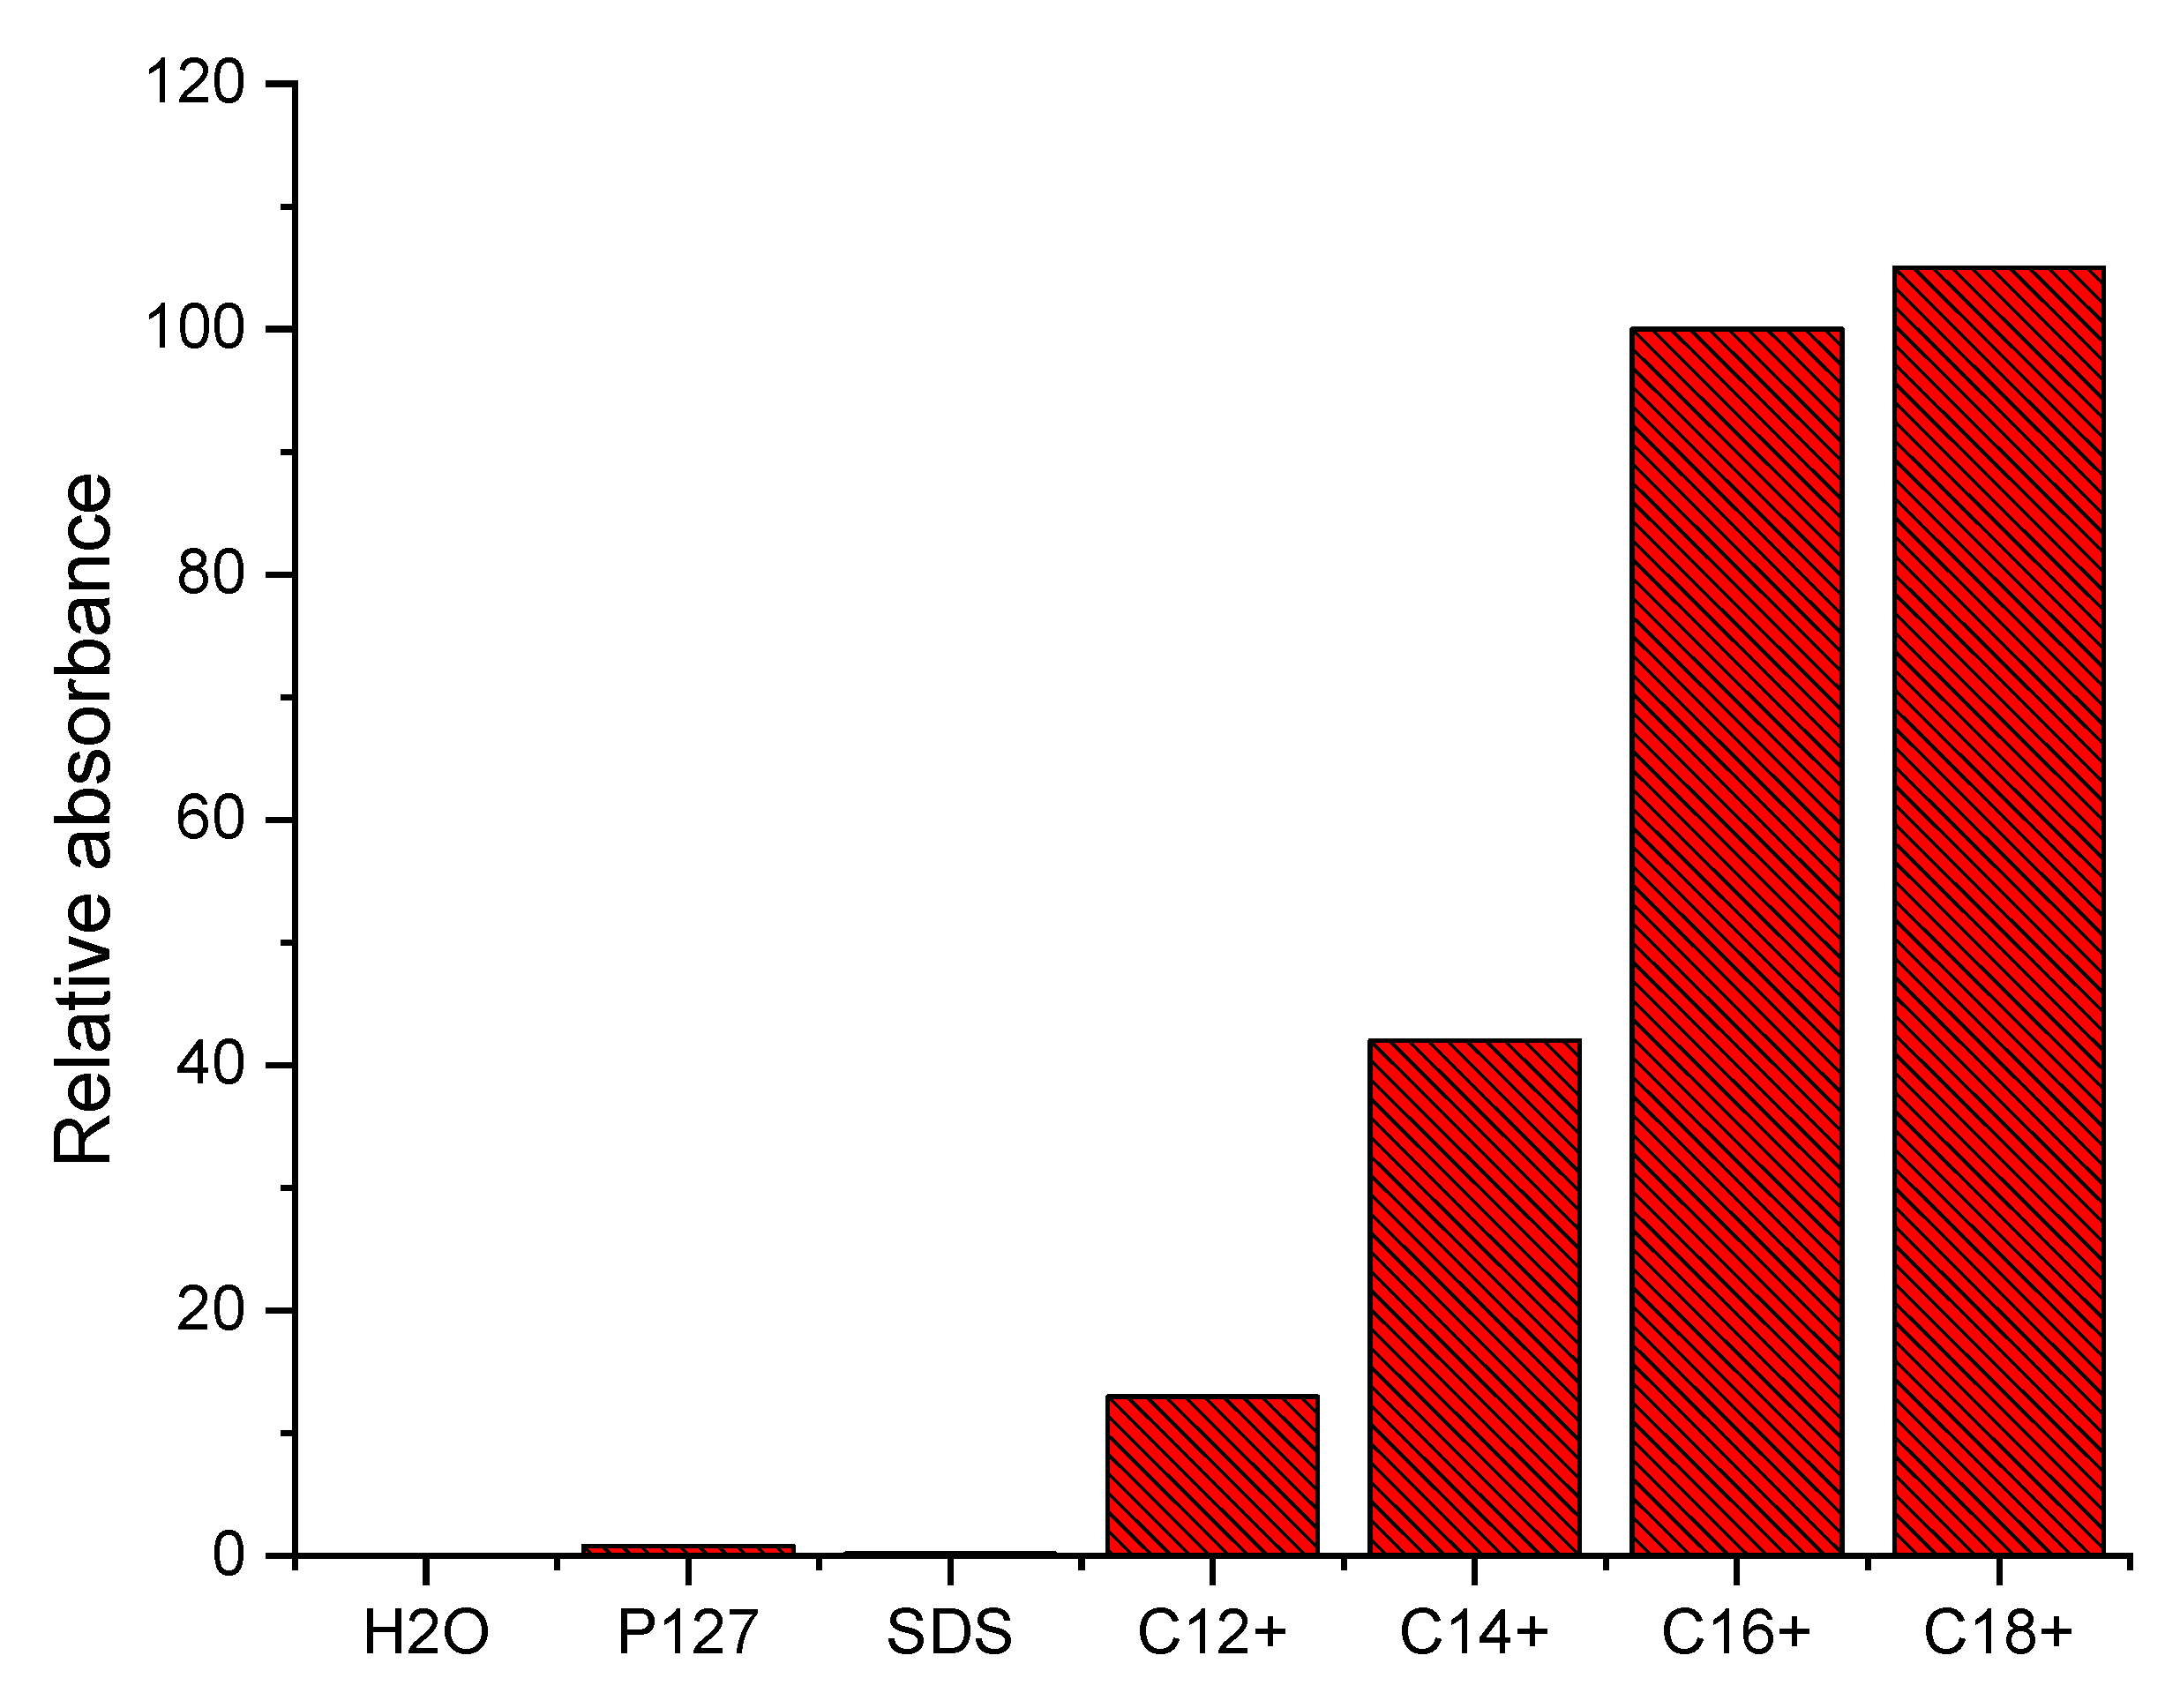
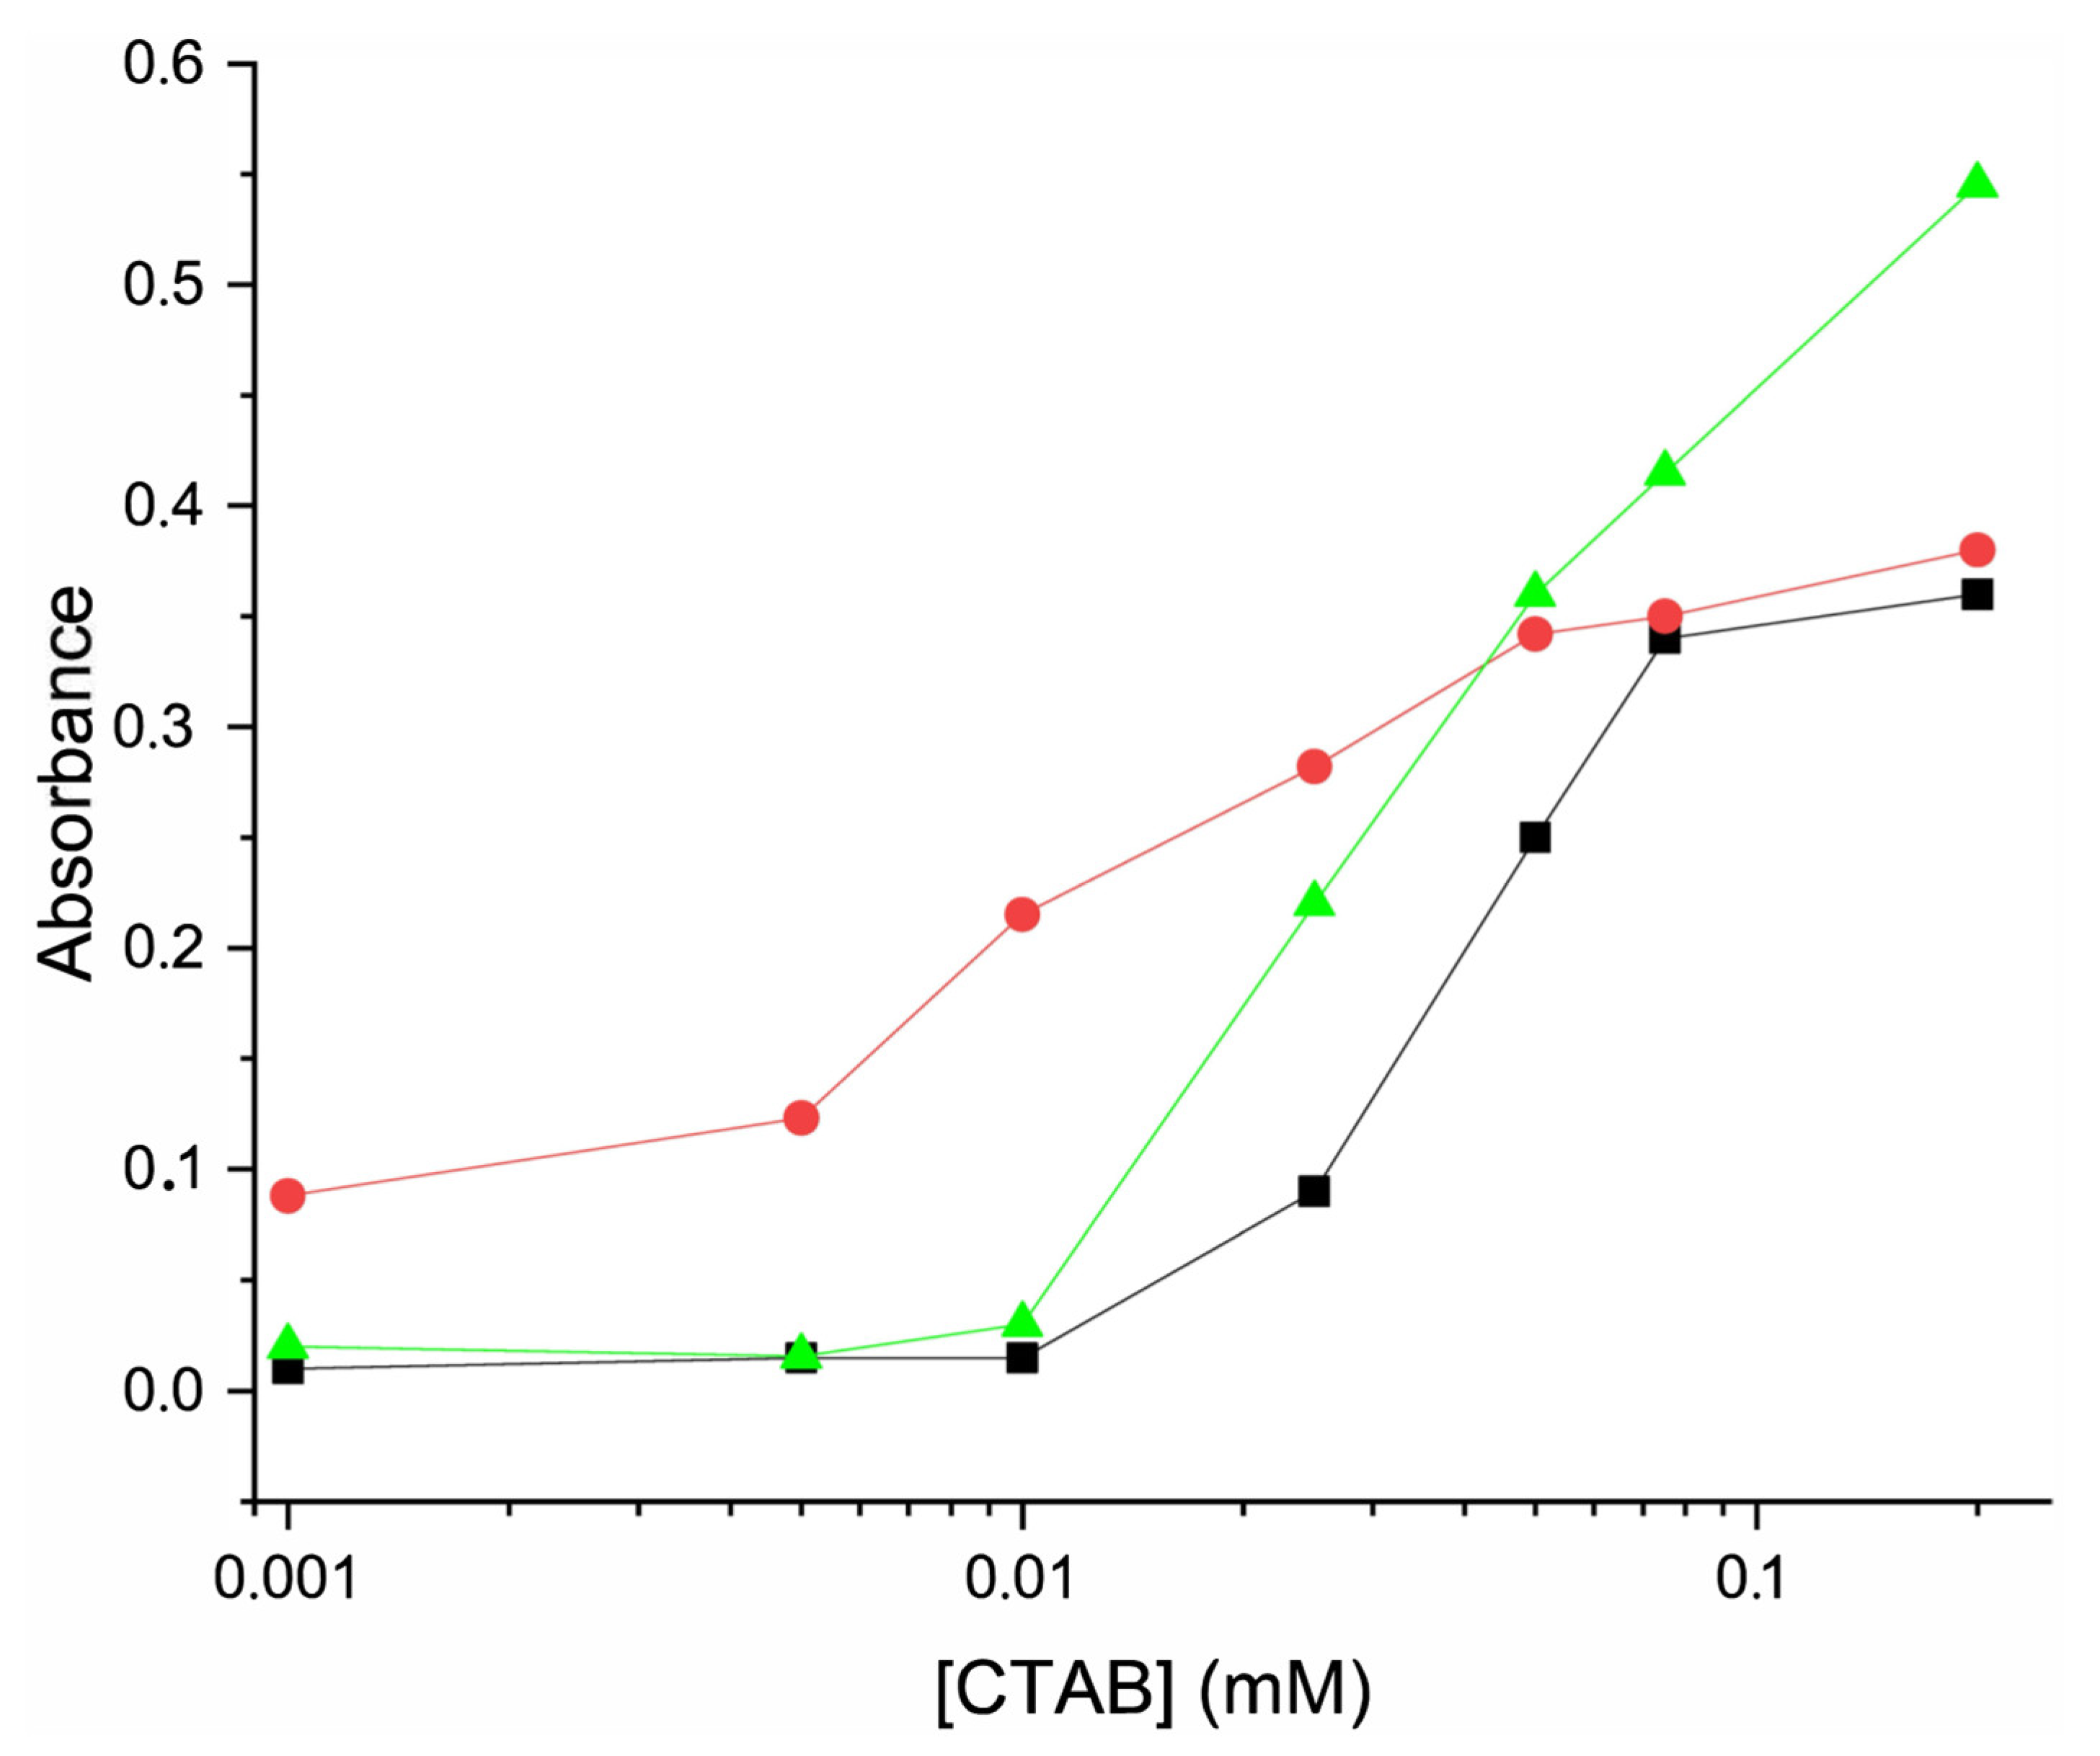
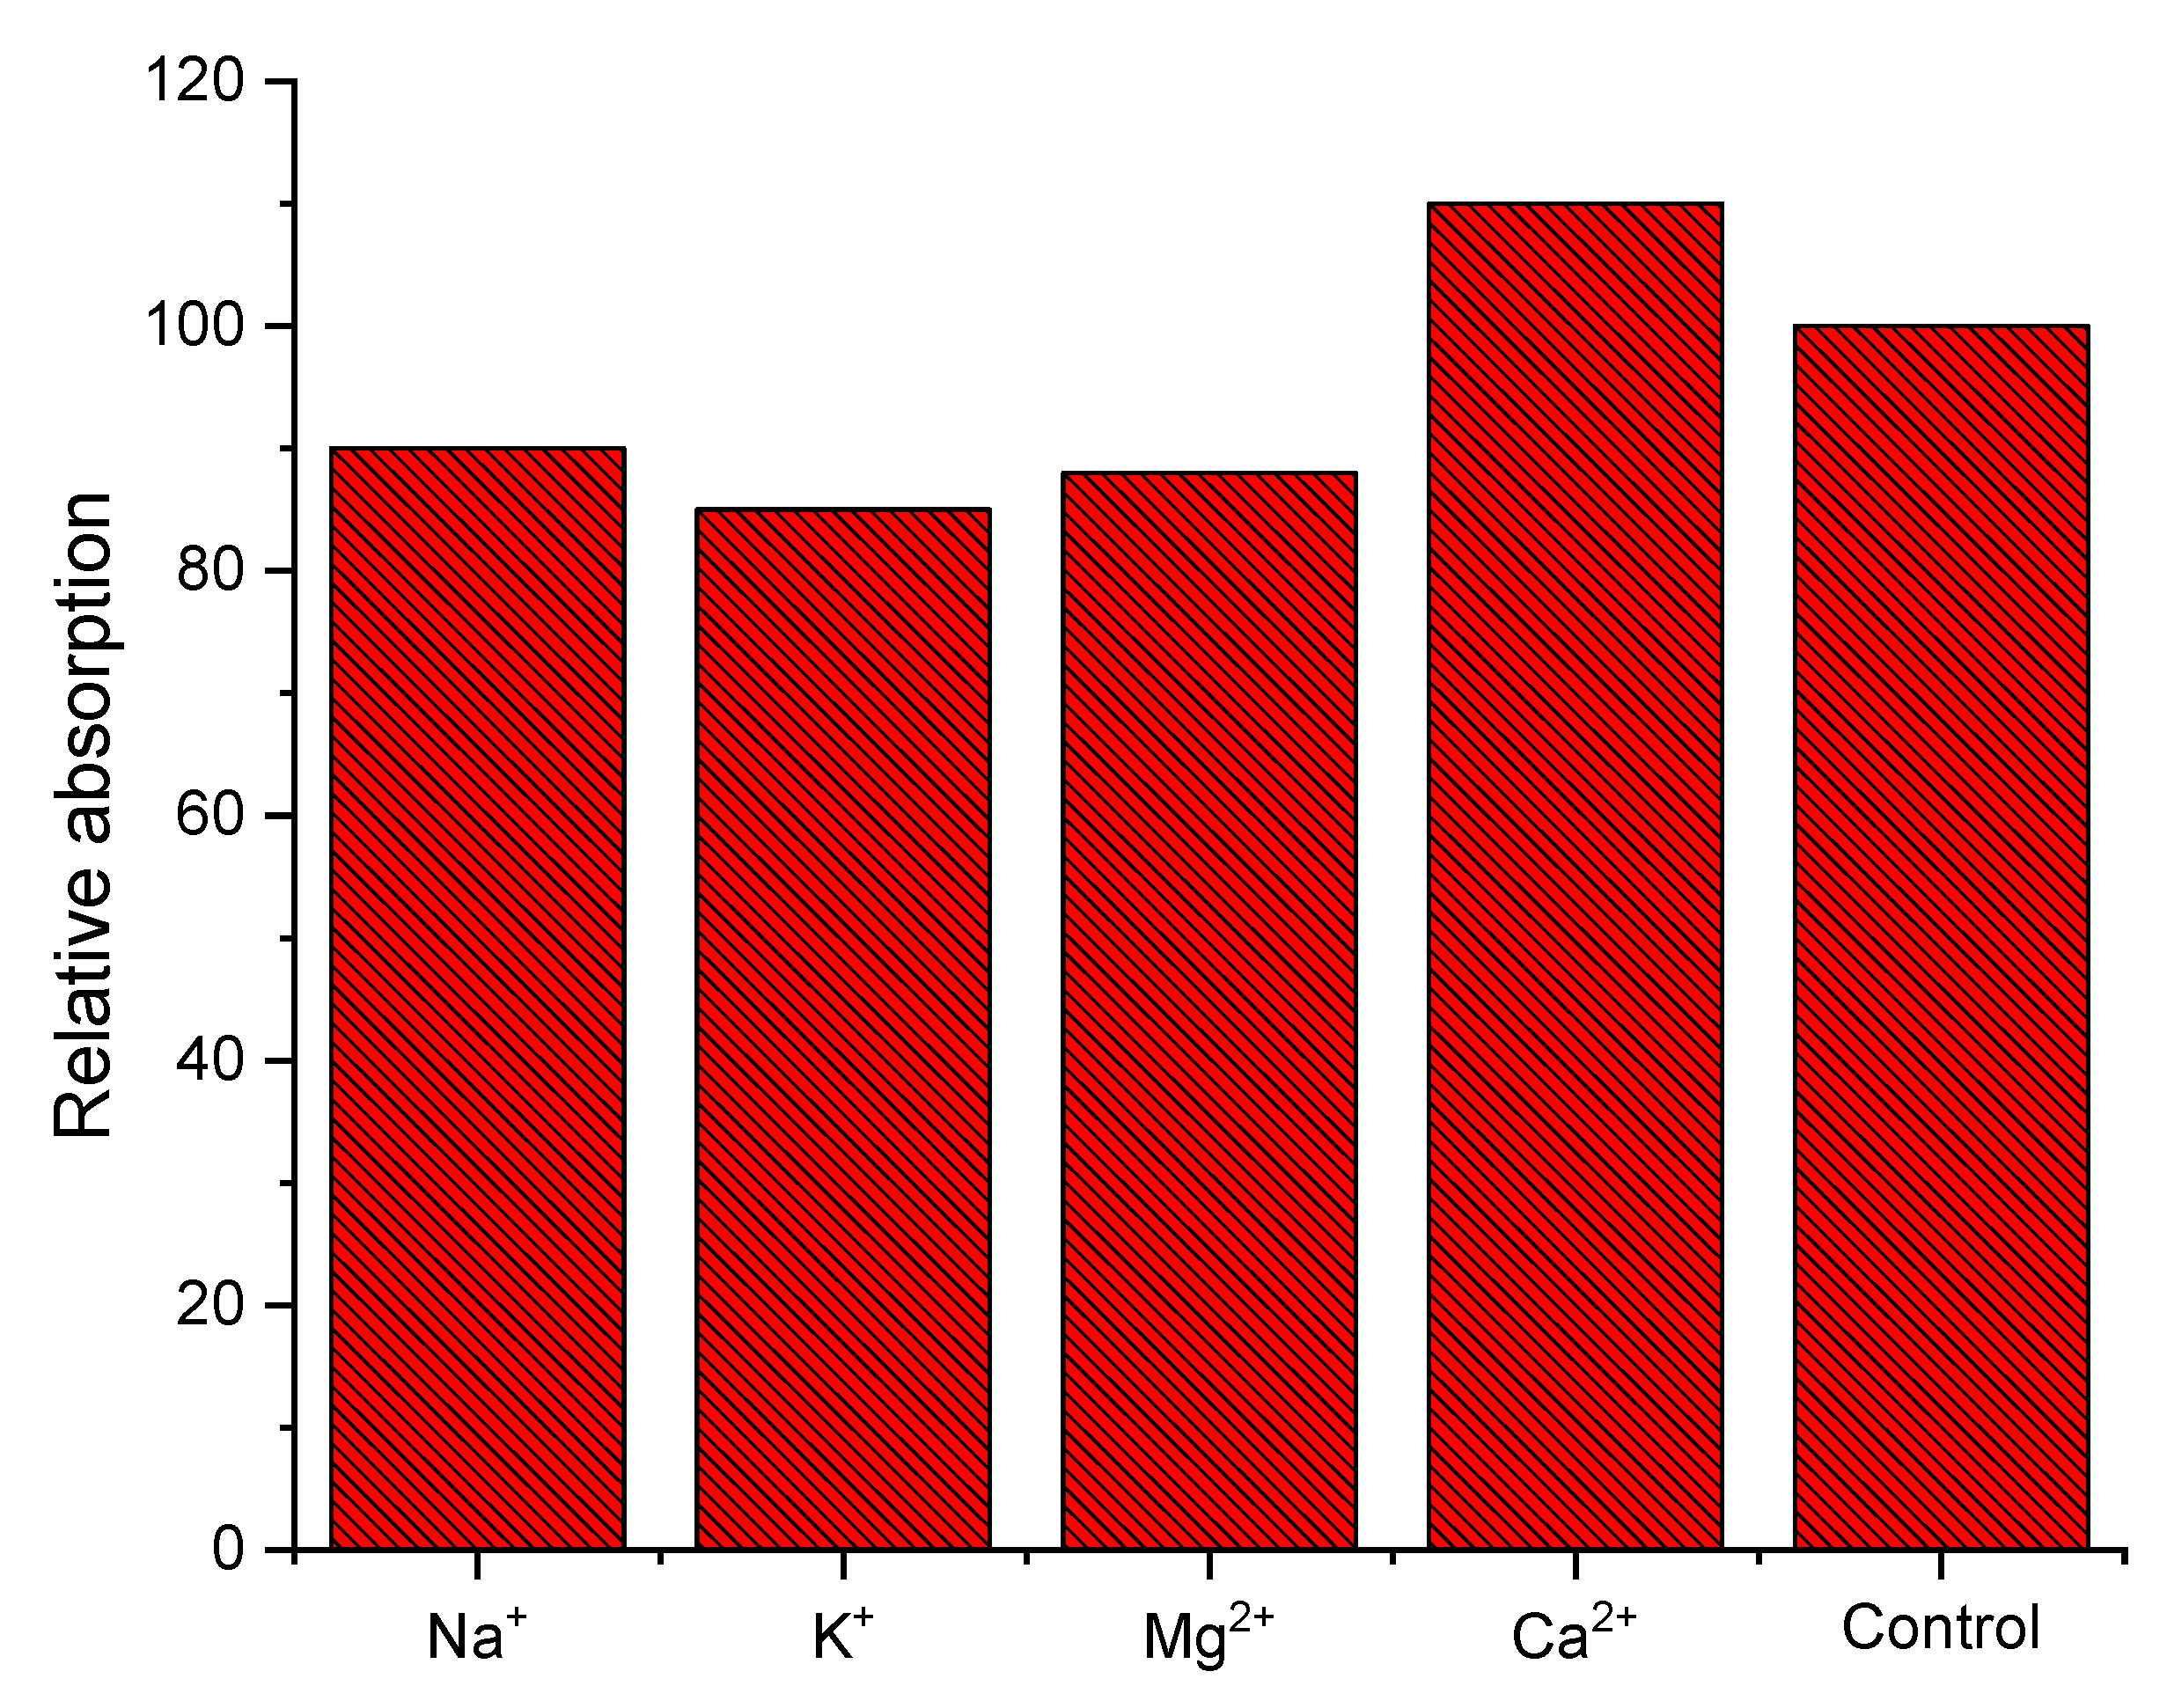
3.5. Sensing Studies

Once the process of competitive adsorption and desorption in the presence of surfactants has been analyzed, it is possible to propose three sensing approaches for the development of a system for the detection of cationic surfactants (see Scheme 1), two based in a displacement approach, and the third one as a competitive assay. The first option is to follow the procedure described so far, a first step of adsorption of MB, that is released upon contact with the sample (Scheme 1a). The second possibility consists of exposing Fe3O4@PDA to the sample containing the cationic surfactant, which would block the surface of the material preventing the methylene blue from being adsorbed by the material (Scheme 1b). Finally, Fe3O4@PDA and a MB solution could be added to the sample simultaneously. In this case, the recognition process does not occur by displacement, but both cationic substances compete to adsorb to the surface simultaneously (Scheme 1c). As noted above, we consider that Fe3O4@PDA-1 is more suitable material for sensing purposes due to the higher release of MB in presence of CTAB.
The comparison of the response of the three detection strategies can be seen in Figure 7. Although the result for the three strategies offers similarities, the order of addition of the reagents has a great influence in the response intensity and linear range. In the system where the sample is mixed with the PDA-coated material prior to the addition of methylene blue (Scheme 1b), the blue color is observed even at low concentrations of surfactant. It has the advantage of higher sensitivity at low concentration and lower risk of interferents, but it is difficult to use for naked-eye applications. The system in which methylene blue is added together with the sample (Scheme 1c) is a priori the simplest since it is executed in a single step, and it is not necessary to separate the solution of the material before the addition of the sample or MB. It offers a wide linear range (0.01 to 0.2 mM) and with a sensitivity even higher than the previous method. However, the effect of ionic strength on methylene blue adsorption may make it less robust for real samples. Finally, the method in which the material is loaded with MB previously to the addition of the sample (Scheme 1a) can detect the surfactant in the range of 0.02 to 0.1 mM of surfactant (7 to 36 ppm of CTAB), with a variation from practically colorless to clearly colored with the naked eye. Adsorption of methylene blue is an independent process that is not affected by the ionic strength of the sample, and the material could be prepared and stored so that only the sample needs to be added. This avoids the handling of two reagents. It is, therefore, the most suitable for its practical application.
An interference test was carried out in water containing the surfactant in presence of common cations in water (Na+ 115 ppm, K+ 195 ppm, Mg2+ 100 ppm, and Ca2+ 40 ppm). It can be seen (Figure 8) that when the surfactant is present, even at such high concentrations of the cations they have a relatively small effect, lower than 20% on the measured absorbance. Finally, the system was tested with a real sample. First, we tested the possibility of using it directly by following the method of first loading it with methylene blue and then putting it in contact with the sample. Although we were able to achieve an analysis range of 0 to 30 ppm, unfortunately, errors of more than 20% were obtained. We think that the presence of ions in the water could have some influence on the response. In view of these results, it was decided to carry out the analysis using the standard addition method to eliminate the effect of the matrix. In this case, the error was similar or even somewhat higher (50%), although it must be considered that the CTAB concentration was at the limit of the detection capacity (2·10−5 M). These results suggest that polydopamine-coated magnetite materials do not offer sufficient robustness for use in quantitative analysis. However, the simplicity of its handling (it only requires mixing the material with the water sample and waiting a few minutes for the reading), together with the fact that it can offer detection to the naked eye (appearance of blue color), makes it possible to apply it in sample screening systems, qualitative tests, or field tests, in which the aim is to make a quick and easy detection of samples. Samples with a positive result could further analyzed using conventional methods.
There are diverse alternatives. The conventional method includes an extraction step with organic solvents. Thus, it has a larger environmental impact and requires a lot of personnel [48]. The most accurate system for the analysis of cationic surfactants is chromatography [7]. It can be coupled to mass spectroscopy to achieve excellent detection limits and identify and quantify several surfactants simultaneously. Paper spray mass spectrometry can also be an interesting alternative [49]. This should be the preferred selection for a laboratory. However, it requires expensive instrumentation and specialized personnel. Potentiometric systems are an excellent alternative to quantify the total amount of cationic surfactants [9]. Nevertheless, equipment is necessary and can be influenced by interferences. Finally, there are some examples of flow injection analysis procedures for spectrophotometric determinations based on the influence of the cationic surfactant in other systems, such as the Bi(III)-I−, Fe(III)–SCN, or copper–pyrocatechol complexes [50,51,52]. These systems require instrumentation and are not based in a change from colorless to colored systems; thus, a spectrophotometer is essential. The linear range is in the ppm range.
In comparison with other methods, our system is not so accurate or able to identify the type of cationic surfactant as chromatography, but it does not require expensive instrumentation or qualified personnel. Potentiometric sensors are easy to handle but need the use of equipment, even if it is relatively cheap. Also, it is more simple than the conventional method and does not require organic solvents or a lot of handling. In comparison with spectrophotometric methods, the detection limits are similar, but we are able to offer naked-eye detection, and the change of color can be easily measured with a digital camera without the interference of the solid. The next steps towards its application could include three strategies: (1) develop a kit with predefined quantities, an assay protocol, and a color scale for naked-eye analysis; (2) incorporate the systems to a multi sensor system able to measure diverse parameters, and in which the measurement of the other sensors enhance the accuracy of the sensing material; and (3) incorporate an extraction step to improve the detection limit and avoid interferences.

4. Conclusions

A new colorimetric protocol based on magnetite coated polydopamine has been developed for the detection of cationic surfactants in water. Cationic surfactants establish a competition for the material surface with methylene blue, so the dye is released to the solution and can be used for the indirect quantification of cationic surfactants, or naked-eye detection. The material can be used following diverse sensing protocols, but probably, the MB loading following the sample addition can be the most convenient. Results confirm the potential of Fe3O4@PDA materials as supports for the sensitive colorimetric determination of this kind of environmentally important substances. However, results with real samples and the influence of divalent cations at high concentrations advises limiting their use to semi-quantitative determinations and as screening kits.

Supplementary Materials

The following supporting information can be downloaded at: https://www.mdpi.com/article/10.3390/chemosensors13040125/s1, Figure S1: Absorbance of the water solution before and after the addition of the Fe3O4@PDA; Figure S2: Pseudo-first order adsorption kinetics for Fe3O4@PDA-1:MB 50:1 (■), Fe3O4@PDA-2:MB 30:1 (), and Fe3O4@PDA-2:MB 50:1 ().

Author Contributions

Conceptualization, investigation, data curation, and writimg: A.F.-N., F.P.-P., M.Á.Ú., P.A. and J.V.R.-L. All authors have read and agreed to the published version of the manuscript.

Funding

This project has been funded by the grants THINKINAZUL/2021/028 from MCIN (Ministerio de Ciencia e Innovación de España) with funds from European Union Next Generation EU (PRTR-C17.I1) and Generalitat Valenciana; PID2021-126304OB-C43 funded by MCIN/AEI/10.13039/501100011033 and by “ERDF A way of making Europe”; and the INVEST/2022/406 INVESTIGO grant funded by Generalitat Valencia.

Institutional Review Board Statement

Not applicable.

Informed Consent Statement

Not applicable.

Data Availability Statement

The original contributions presented in this study are included in the article/Supplementary Materials. Further inquiries can be directed to the corresponding author.

Conflicts of Interest

The authors declare no conflict of interest.

References

  1. Sivaramakrishnan, C.N. The Use of Surfactants in the Finishing of Technical Textiles. In Advances in the Dyeing and Finishing of Technical Textiles; Elsevier: Amsterdam, The Netherlands, 2013; pp. 199–235. [Google Scholar] [CrossRef]
  2. Le Marechal, A.M.; Krianec, B.; Vajnhandl, S.; Volmajer, J. Textile Finishing Industry as an Important Source of Organic Pollutants. In Organic Pollutants Ten Years After the Stockholm Convention—Environmental and Analytical Update; Puzyn, T., Ed.; InTech: Houston, TX, USA, 2012. [Google Scholar] [CrossRef]
  3. Brycki, B.E.; Kowalczyk, I.H.; Szulc, A.; Kaczerewska, O.; Pakiet, M. Multifunctional Gemini Surfactants: Structure, Synthesis, Properties and Applications. In Application and Characterization of Surfactants; Najjar, R., Ed.; InTech: Houston, TX, USA, 2017. [Google Scholar] [CrossRef]
  4. Jackson, M.; Eadsforth, C.; Schowanek, D.; Delfosse, T.; Riddle, A.; Budgen, N. Comprehensive Review of Several Surfactants in Marine Environments: Fate and Ecotoxicity. Environ. Toxic. Chem. 2016, 35, 1077–1086. [Google Scholar] [CrossRef]
  5. Kaczerewska, O.; Martins, R.; Figueiredo, J.; Loureiro, S.; Tedim, J. Environmental Behaviour and Ecotoxicity of Cationic Surfactants towards Marine Organisms. J. Hazard. Mater. 2020, 392, 122299. [Google Scholar] [CrossRef] [PubMed]
  6. Garcia, M.T.; Ribosa, I.; Kowalczyk, I.; Pakiet, M.; Brycki, B. Biodegradability and Aquatic Toxicity of New Cleavable Betainate Cationic Oligomeric Surfactants. J. Hazard. Mater. 2019, 371, 108–114. [Google Scholar] [CrossRef] [PubMed]
  7. Badmus, S.O.; Amusa, H.K.; Oyehan, T.A.; Saleh, T.A. Environmental Risks and Toxicity of Surfactants: Overview of Analysis, Assessment, and Remediation Techniques. Environ. Sci. Pollut. Res. 2021, 28, 62085–62104. [Google Scholar] [CrossRef]
  8. Fernández-Núñez, A.; El Haskouri, J.; Amorós, P.; Ros-Lis, J.V. Graphene Oxide as Inhibitor on the Hydrolysis of Fats under Simulated in Vitro Duodenal Conditions. Heliyon 2024, 10, e28624. [Google Scholar] [CrossRef]
  9. Budetić, M.; Jozanović, M.; Pukleš, I.; Samardžić, M. Review of Potentiometric Determination of Cationic Surfactants. Rev. Anal. Chem. 2024, 43, 20230078. [Google Scholar] [CrossRef]
  10. Coll, C.; Ros-Lis, J.V.; Martínez-Máñez, R.; Marcos, M.D.; Sancenón, F.; Soto, J. A New Approach for the Selective and Sensitive Colorimetric Detection of Ionic Surfactants in Water. J. Mater. Chem. 2010, 20, 1442–1451. [Google Scholar] [CrossRef]
  11. Hnaien, M.; Dzyadevych, S.; Lagarde, F.; Jaffrezic-Renault, N. A Conductometric Sensor Specific for Cationic Surfactants. Electroanalysis 2012, 24, 1441–1445. [Google Scholar] [CrossRef]
  12. Descalzo, A.B.; Martínez-Máñez, R.; Sancenón, F.; Hoffmann, K.; Rurack, K. The Supramolecular Chemistry of Organic–Inorganic Hybrid Materials. Angew. Chem. Int. Ed. 2006, 45, 5924–5948. [Google Scholar] [CrossRef]
  13. Calero, P.; Aznar, E.; Lloris, J.M.; Marcos, M.D.; Martínez-Máñez, R.; Ros-Lis, J.V.; Soto, J.; Sancenón, F. Chromogenic Silica Nanoparticles for the Colorimetric Sensing of Long-Chain Carboxylates. Chem. Commun. 2008, 14, 1668. [Google Scholar] [CrossRef]
  14. Novoselova, L.Y. Nanoscale Magnetite: New Synthesis Approach, Structure and Properties. Appl. Surf. Sci. 2021, 539, 148275. [Google Scholar] [CrossRef]
  15. Niculescu, A.-G.; Chircov, C.; Grumezescu, A.M. Magnetite Nanoparticles: Synthesis Methods—A Comparative Review. Methods 2022, 199, 16–27. [Google Scholar] [CrossRef] [PubMed]
  16. Cotar, A.I.; Grumezescu, A.M.; Huang, K.-S.; Voicu, G.; Chifiriuc, C.M.; Radulescu, R. Magnetite Nanoparticles Influence the Efficacy of Antibiotics against Biofilm Embedded Staphylococcus Aureus Cells. Biointerface Res. Appl. Chem. 2013, 3, 2. [Google Scholar]
  17. Cabeza, V.S. High and Efficient Production of Nanomaterials by Microfluidic Reactor Approaches. In Advances in Microfluidics—New Applications in Biology, Energy, and Materials Sciences; Yu, X.-Y., Ed.; InTech: Houston, TX, USA, 2016. [Google Scholar] [CrossRef]
  18. Carriazo, J.G.; Noval, V.E.; Ochoa Puentes, C. Magnetita (Fe3O4): Una estructura inorgánica con múltiples aplicaciones en catálisis heterogénea. Rev. Colomb. Quim. 2017, 46, 42. [Google Scholar] [CrossRef]
  19. Beveridge, J.S.; Stephens, J.R.; Williams, M.E. The Use of Magnetic Nanoparticles in Analytical Chemistry. Annu. Rev. Anal. Chem. 2011, 4, 251–273. [Google Scholar] [CrossRef]
  20. Öztürk Er, E.; Dalgıç Bozyiğit, G.; Büyükpınar, Ç.; Bakırdere, S. Magnetic Nanoparticles Based Solid Phase Extraction Methods for the Determination of Trace Elements. Crit. Rev. Anal. Chem. 2022, 52, 231–249. [Google Scholar] [CrossRef]
  21. Marcelo, L.R.; De Gois, J.S.; Da Silva, A.A.; Cesar, D.V. Synthesis of Iron-Based Magnetic Nanocomposites and Applications in Adsorption Processes for Water Treatment: A Review. Environ. Chem. Lett. 2021, 19, 1229–1274. [Google Scholar] [CrossRef]
  22. El-Deen, A.K.; Hussain, C.M. Advances in Magnetic Analytical Extraction Techniques for Detecting Antibiotic Residues in Edible Samples. Food Chem. 2024, 450, 139381. [Google Scholar] [CrossRef]
  23. Wan Ibrahim, W.A.; Nodeh, H.R.; Aboul-Enein, H.Y.; Sanagi, M.M. Magnetic Solid-Phase Extraction Based on Modified Ferum Oxides for Enrichment, Preconcentration, and Isolation of Pesticides and Selected Pollutants. Crit. Rev. Anal. Chem. 2015, 45, 270–287. [Google Scholar] [CrossRef]
  24. de Queiroz, D.F.; de Camargo, E.R.; Martines, M.A.U. Synthesis and Characterization of Magnetic Nanoparticles of Cobalt Ferrite Coated with Silica. Biointerface Res. Appl. Chem. 2019, 10, 4908–4913. [Google Scholar] [CrossRef]
  25. Jaime, J.; Rangel, G.; Muñoz-Bonilla, A.; Mayoral, A.; Herrasti, P. Magnetite as a Platform Material in the Detection of Glucose, Ethanol and Cholesterol. Sens. Actuators B Chem. 2017, 238, 693–701. [Google Scholar] [CrossRef]
  26. Ma, Y.; Zhang, X.; Zeng, T.; Cao, D.; Zhou, Z.; Li, W.; Niu, H.; Cai, Y. Polydopamine-Coated Magnetic Nanoparticles for Enrichment and Direct Detection of Small Molecule Pollutants Coupled with MALDI-TOF-MS. ACS Appl. Mater. Interfaces 2013, 5, 1024–1030. [Google Scholar] [CrossRef]
  27. Liu, Y.; Ai, K.; Lu, L. Polydopamine and Its Derivative Materials: Synthesis and Promising Applications in Energy, Environmental, and Biomedical Fields. Chem. Rev. 2014, 114, 5057–5115. [Google Scholar] [CrossRef]
  28. Zhou, Q.; Lei, P.; Cheng, S.; Wang, H.; Dong, W.; Pan, X. Recent Progress in Magnetic Polydopamine Composites for Pollutant Removal in Wastewater Treatment. Int. J. Biol. Macromol. 2024, 262, 130023. [Google Scholar] [CrossRef]
  29. Dreyer, D.R.; Miller, D.J.; Freeman, B.D.; Paul, D.R.; Bielawski, C.W. Elucidating the Structure of Poly(Dopamine). Langmuir 2012, 28, 6428–6435. [Google Scholar] [CrossRef]
  30. Deng, Z.; Shang, B.; Peng, B. Polydopamine Based Colloidal Materials: Synthesis and Applications. Chem. Rec. 2018, 18, 410–432. [Google Scholar] [CrossRef]
  31. Kim, S.; Kim, E.M.; Yamamoto, M.; Park, H.; Shin, H. Engineering Multi-Cellular Spheroids for Tissue Engineering and Regenerative Medicine. Adv. Healthc. Mater. 2020, 9, 2000608. [Google Scholar] [CrossRef]
  32. Cheng, W.; Nie, J.; Xu, L.; Liang, C.; Peng, Y.; Liu, G.; Wang, T.; Mei, L.; Huang, L.; Zeng, X. pH-Sensitive Delivery Vehicle Based on Folic Acid-Conjugated Polydopamine-Modified Mesoporous Silica Nanoparticles for Targeted Cancer Therapy. ACS Appl. Mater. Interfaces 2017, 9, 18462–18473. [Google Scholar]
  33. Bardhan, R.; Lal, S.; Joshi, A.; Halas, N.J. Theranostic Nanoshells: From Probe Design to Imaging and Treatment of Cancer. Acc. Chem. Res. 2011, 44, 936–946. [Google Scholar] [CrossRef]
  34. Lin, J.-H.; Yu, C.-J.; Yang, Y.-C.; Tseng, W.-L. Formation of Fluorescent Polydopamine Dots from Hydroxyl Radical-Induced Degradation of Polydopamine Nanoparticles. Phys. Chem. Chem. Phys. 2015, 17, 15124–15130. [Google Scholar] [CrossRef]
  35. Zhou, J.; Duan, B.; Fang, Z.; Song, J.; Wang, C.; Messersmith, P.B.; Duan, H. Interfacial Assembly of Mussel-Inspired Au@Ag@ Polydopamine Core–Shell Nanoparticles for Recyclable Nanocatalysts. Adv. Mater. 2014, 26, 701–705. [Google Scholar] [CrossRef] [PubMed]
  36. Xiong, W.; Zhao, Q.; Li, X.; Wang, L. Multifunctional Plasmonic Co-Doped Fe2O3 @polydopamine-Au for Adsorption, Photocatalysis, and SERS-Based Sensing. Part. Part. Syst. Charact. 2016, 33, 602–609. [Google Scholar] [CrossRef]
  37. Fang, Q.; Duan, S.; Zhang, J.; Li, J.; Leung, K.C.-F. Dual Shelled Fe3O4/Polydopamine Hollow Microspheres as an Effective Eu(III) Adsorbent. J. Mater. Chem. A 2017, 5, 2947–2958. [Google Scholar] [CrossRef]
  38. Wang, B.; Liu, Y.; Zhang, Y.; Guo, Z.; Zhang, H.; Xin, J.H.; Zhang, L. Bioinspired Superhydrophobic Fe3O4 @Polydopamine@Ag Hybrid Nanoparticles for Liquid Marble and Oil Spill. Adv. Mater. Inter. 2015, 2, 1500234. [Google Scholar] [CrossRef]
  39. Kuznowicz, M.; Jędrzak, A.; Leda, A.; Rębiś, T.; Jesionowski, T. Measurements of Working Parameters of External Mediators for Biodetectors Based on the Polydopamine@magnetite Nanoparticles. Measurement 2021, 184, 109950. [Google Scholar] [CrossRef]
  40. Bui, T.Q.; Ton, S.N.-C.; Duong, A.T.; Tran, H.T. Size-Dependent Magnetic Responsiveness of Magnetite Nanoparticles Synthesised by Co-Precipitation and Solvothermal Methods. J. Sci. Adv. Mater. Devices 2018, 3, 107–112. [Google Scholar] [CrossRef]
  41. Sánchez, E.G.; Melero, M.M.; Úbeda Picot, M.Á.; Pérez-Pla, F.; Marcos, M.D.; El Haskouri, J.; Amorós, P. Nitroarene Hydrogenation Catalysts Based on Pd Nanoparticles Glued with PDA on Inorganic Supports: Multivariate Curve Resolution as an Useful Tool to Compare the Catalytic Activity in Multi-Step Reactions. Appl. Catal. A Gen. 2021, 619, 118125. [Google Scholar] [CrossRef]
  42. Monshi, A.; Foroughi, M.R.; Monshi, M.R. Modified Scherrer Equation to Estimate More Accurately Nano-Crystallite Size Using XRD. World J. Nano Sci. Eng. 2012, 2, 154–160. [Google Scholar] [CrossRef]
  43. Glazyrin, K.; McCammon, C.; Dubrovinsky, L.; Merlini, M.; Schollenbruch, K.; Woodland, A.; Hanfland, M. Effect of High Pressure on the Crystal Structure and Electronic Properties of Magnetite below 25 GPa. Am. Mineral. 2012, 97, 128–133. [Google Scholar] [CrossRef]
  44. Mazario, E.; Sánchez-Marcos, J.; Menéndez, N.; Herrasti, P.; García-Hernández, M.; Muñoz-Bonilla, A. One-Pot Electrochemical Synthesis of Polydopamine Coated Magnetite Nanoparticles. RSC Adv. 2014, 4, 48353–48361. [Google Scholar] [CrossRef]
  45. Brown, H.K.; El Haskouri, J.; Marcos, M.D.; Ros-Lis, J.V.; Amorós, P.; Úbeda Picot, M.Á.; Pérez-Pla, F. Synthesis and Catalytic Activity for 2, 3, and 4-Nitrophenol Reduction of Green Catalysts Based on Cu, Ag and Au Nanoparticles Deposited on Polydopamine-Magnetite Porous Supports. Nanomaterials 2023, 13, 2162. [Google Scholar] [CrossRef] [PubMed]
  46. Fu, J.; Xin, Q.; Wu, X.; Chen, Z.; Yan, Y.; Liu, S.; Wang, M.; Xu, Q. Selective Adsorption and Separation of Organic Dyes from Aqueous Solution on Polydopamine Microspheres. J. Colloid Interface Sci. 2016, 461, 292–304. [Google Scholar] [CrossRef] [PubMed]
  47. Wei, X.; Fang, W.; Chen, F.; Zhong, M. Preparation and Properties of a pH-Responsive PDMS Platform. In AIP Conference Proceedings; AIP: Kelantan, Malaysia, 2019; p. 040004. [Google Scholar] [CrossRef]
  48. International Standard ISO 2871-2.; Surface active agents – Detergents – Determination of cationic-active matter content. ISO: Geneva, Switzerland, 2010.
  49. Min, K.; Yang, Q.; Zhong, X.; Yan, D.; Luo, W.; Fang, Z.; Xiao, J.; Maa, M.; Chen, B. Rapid analysis of anionic and cationic surfactants in water by paper spray mass spectrometry. Anal. Methods 2021, 13, 986–995. [Google Scholar] [PubMed]
  50. Patel, R.; Patel, R.S. Simple and specific method for flow injection analysis determination of cationic surfactants in environmental and commodity samples. Talanta 1999, 48, 923–931. [Google Scholar] [CrossRef]
  51. Agrawal, K.; Agnihotri, G.; Shrivas, K.; Mundhara, G.L.; Patel, K.S.; Hoffmann, P. Determination of Cationic Surfactants in Environmental Samples by Flow Injection Analysis. Microchim. Acta 2004, 147, 273–278. [Google Scholar] [CrossRef]
  52. El Hamd, M.A.; El-Maghrabey, M.; Abdel-Lateef, M.A.; Ali, S.M.; Ibrahim, M.M.; El-Shahat, M.F.; Azeem, S.M.A. Flow Injection Sensing Strategy for Determining Cationic Surfactants in Commodity and Water Samples. Chemosensors 2022, 10, 434. [Google Scholar] [CrossRef]
Scheme 1. Different detection strategies.
Chemosensors 13 00125 sch001
Scheme 2. (a) Detection mechanism and (b) synthesis of Fe3O4@PDA-X.
Chemosensors 13 00125 sch002
Figure 1. (a) XRD patterns of Fe3O4 (black), Fe3O4@PDA-1 (red), Fe3O4@PDA-2 (blue), and theoretical Fe3O4 (green) [43]. (b) TEM image of Fe3O4. (c) TEM image of Fe3O4@PDA-1. (d) TEM image of Fe3O4@PDA-2.
Chemosensors 13 00125 g001
Figure 2. N2 adsorption–desorption isotherms and pore size distributions (inset) of (a) Fe3O4, (b) Fe3O4@PDA-1, and (c) Fe3O4@PDA-2 samples.
Chemosensors 13 00125 g002
Figure 3. Fe3O4@PDA:MB interaction study to determine the amount of (a) Fe3O4@PDA-1 and (b) Fe3O4@PDA-2 required to adsorb all of the methylene blue.
Chemosensors 13 00125 g003
Figure 4. (a) Pseudo-second order adsorption kinetics for Fe3O4@PDA-1:MB 50:1 (■), Fe3O4@PDA-2:MB 30:1 (), and Fe3O4@PDA-2:MB 50:1 (). Influence of (b) NaCl and (c) pH on dye adsorption.
Chemosensors 13 00125 g004
Figure 5. Absorbance of the solution at 60 min for Fe3O4@PDA-1:MB 50:1 (//, dark red), Fe3O4@PDA-2:MB 30:1 (\\, bright red), and Fe3O4@PDA-2:MB 50:1 (XX, pale red).
Chemosensors 13 00125 g005
Figure 6. Relative absorbance in presence of different surfactants (C16+ = 100).
Chemosensors 13 00125 g006
Figure 7. Absorbance at different concentrations of CTAB using different methods to MB-CTAB (■), CTAB-MB (), and CTAB+MB().
Chemosensors 13 00125 g007
Figure 8. Relative absorbance in presence of possible interferents (control = 100).
Chemosensors 13 00125 g008
Table 1. Physical and textural characteristics of Fe3O4, Fe3O4@PDA-1, and Fe3O4@PDA-2.
SampleZ Potential (mV)Particle Size (nm) aOrganic Content (mg/g of Material) bArea (m2/g of Material) cPore Size (nm) dPore Volume (cm3/g of Material) d
Fe3O4−1.52700 ± 200061.918.90.28
Fe3O4@PDA-1−31.7369 ± 917039.522.10.18
Fe3O4@PDA-2−30781 ± 174109.853.20.07
a Determined through DLS measurements. b Values determined from TGA. c Determined by using the BET model. d Values determined by using the BJH model on the adsorption branch of the isotherms.
Disclaimer/Publisher’s Note: The statements, opinions and data contained in all publications are solely those of the individual author(s) and contributor(s) and not of MDPI and/or the editor(s). MDPI and/or the editor(s) disclaim responsibility for any injury to people or property resulting from any ideas, methods, instructions or products referred to in the content.

