The Screening and Diagnosis Technologies Towards Pneumoconiosis: From Imaging Analysis to E-Noses


Abstract

1. Introduction
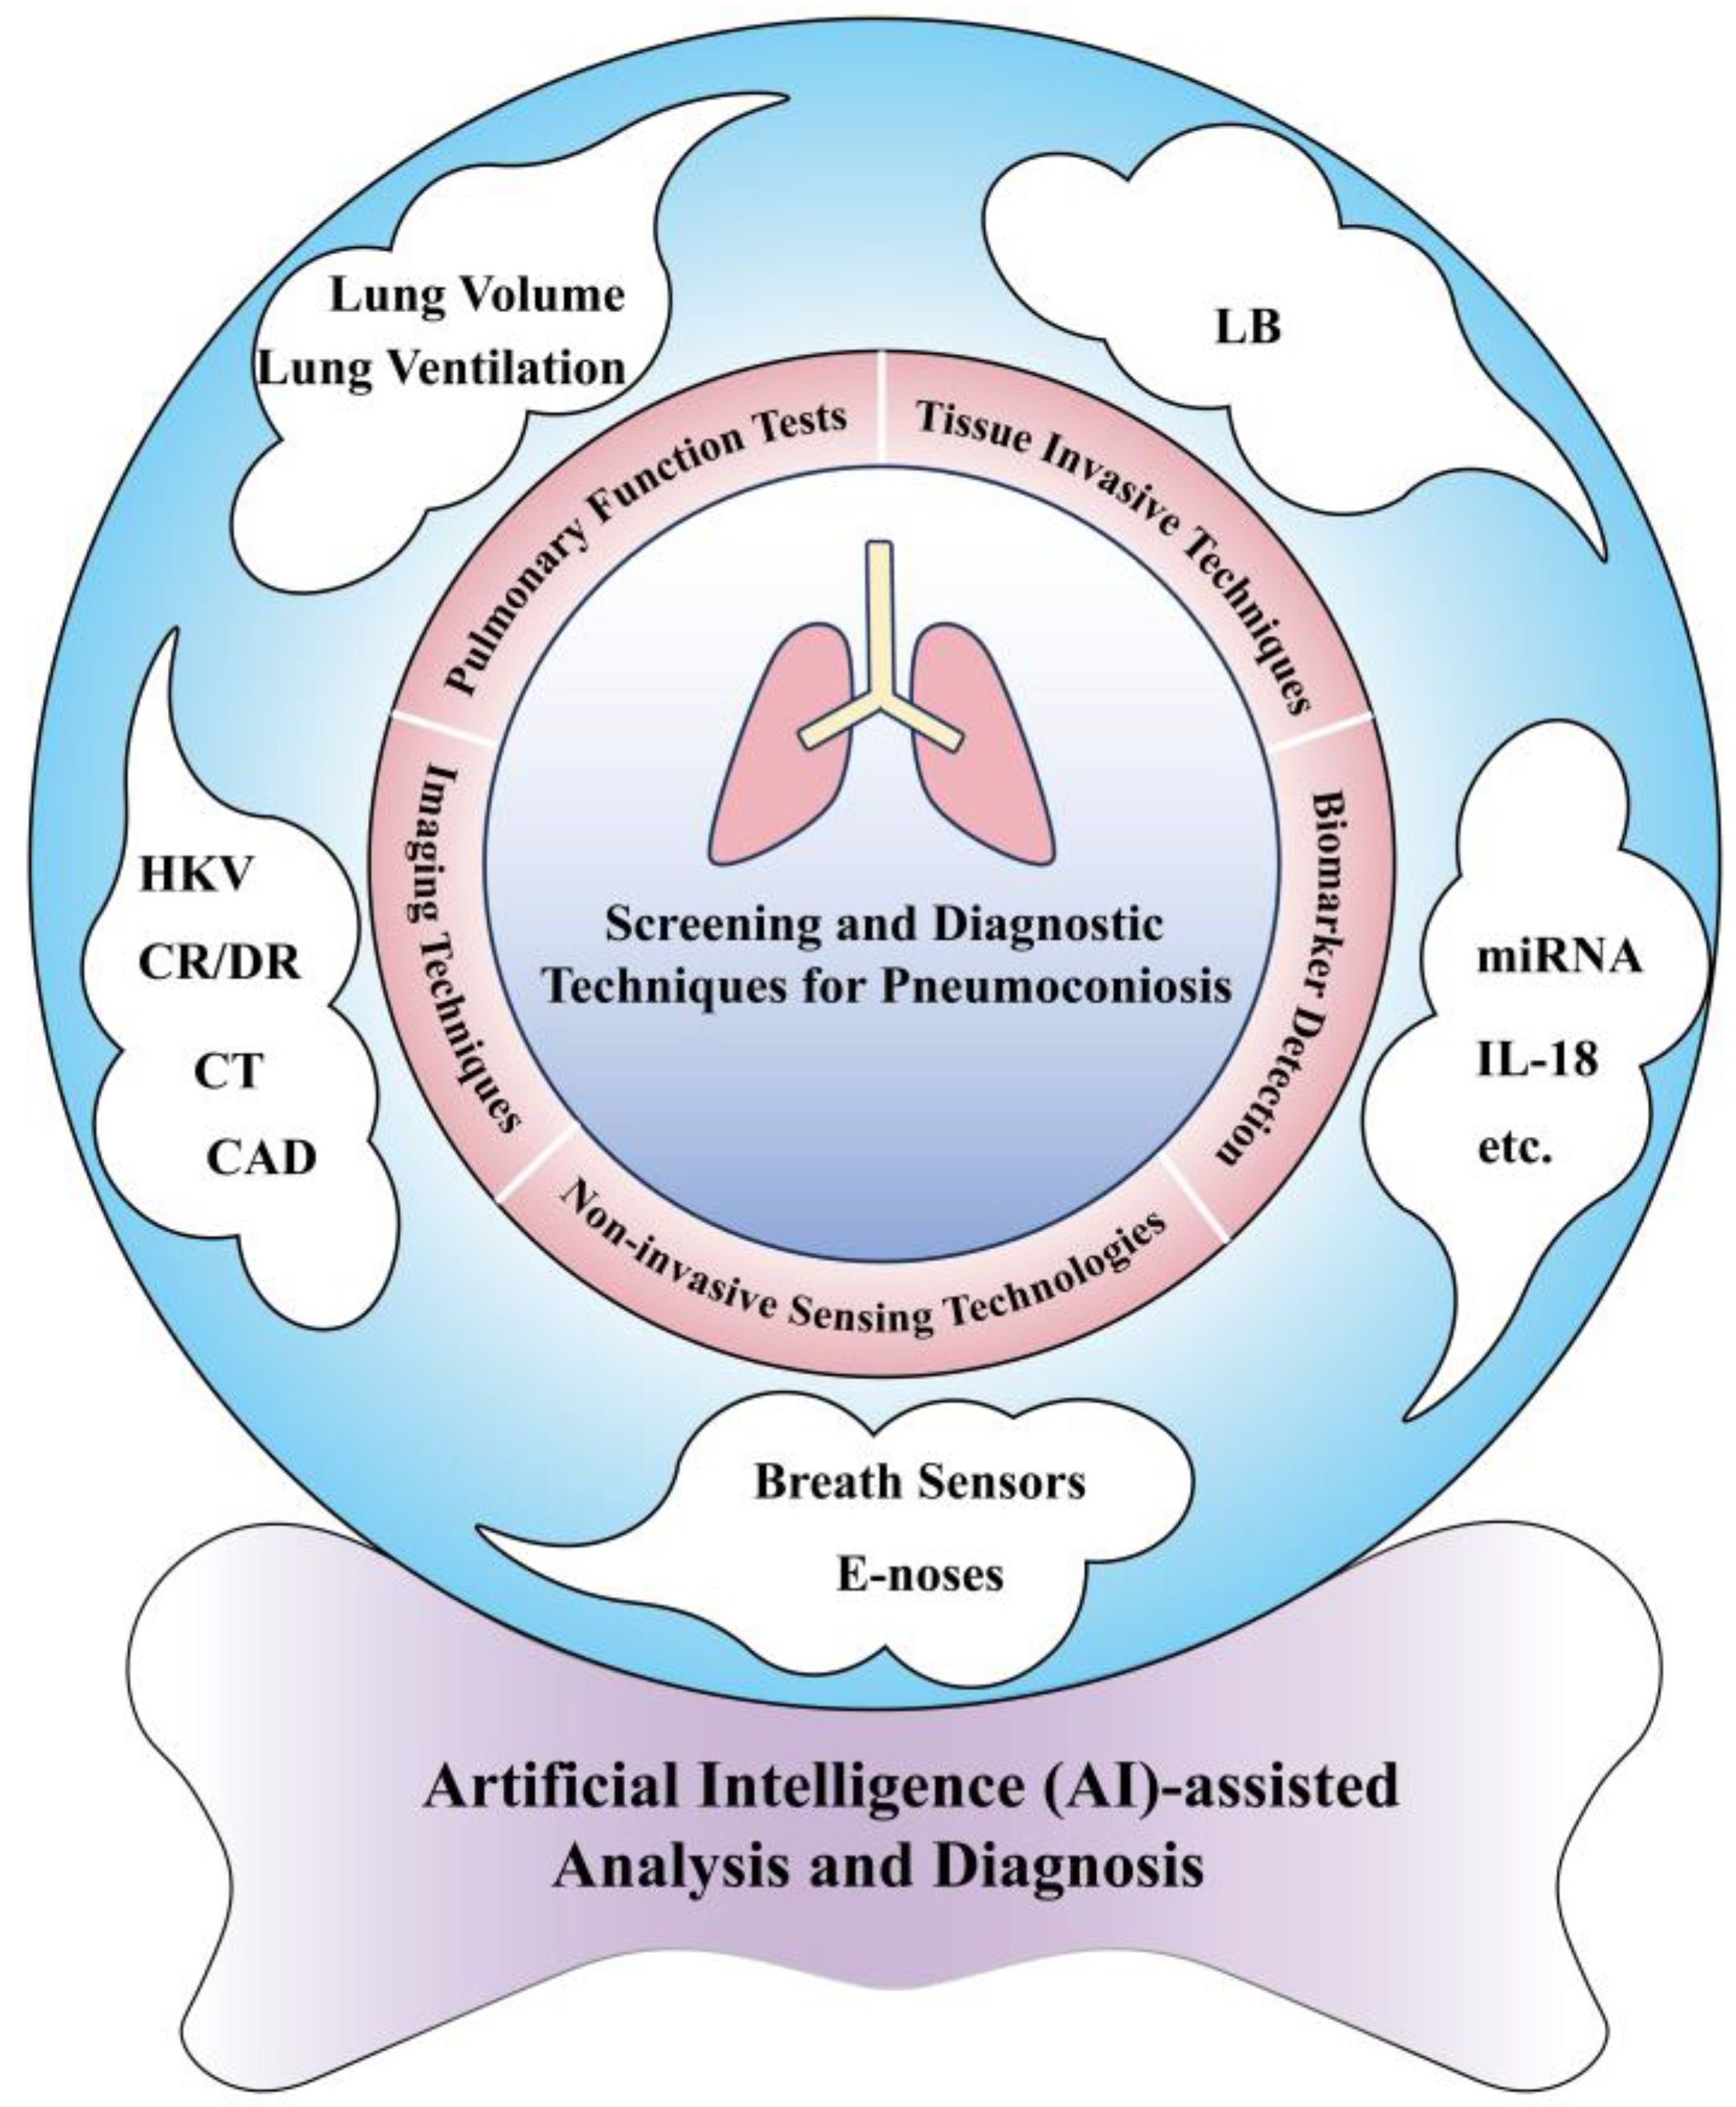
2. Established Techniques for Screening and Diagnosis of Pneumoconiosis
2.1. Imaging Techniques
2.1.1. HKV X-Ray Imaging
2.1.2. CR and DR
2.1.3. CT
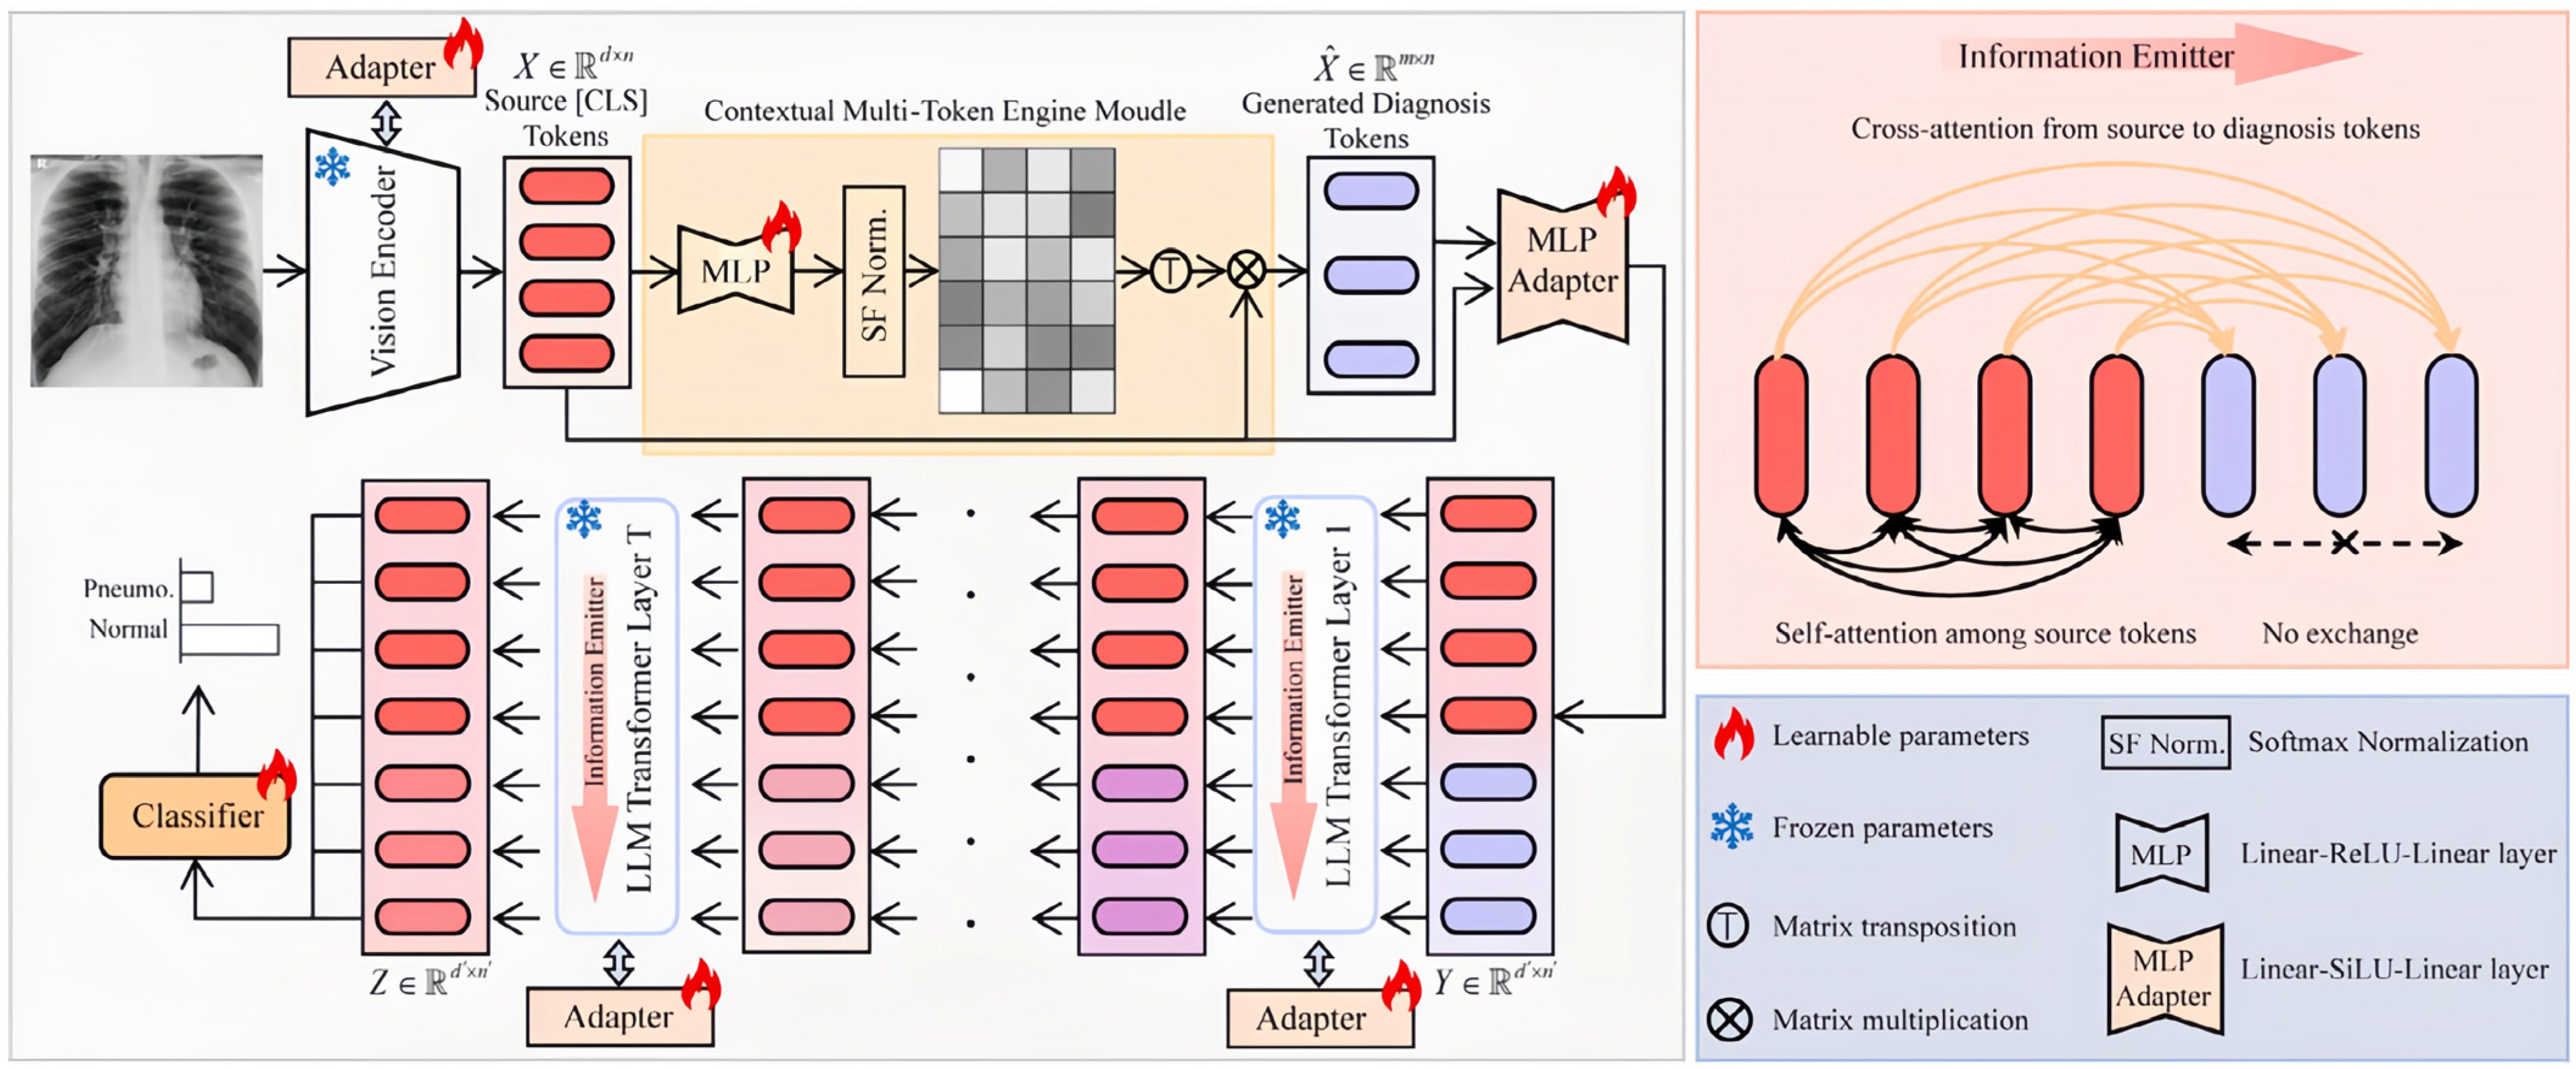
2.1.4. CAD
2.2. PFT
2.3. Tissue-Invasive Techniques
3. Advanced Sensing Technologies for Screening and Diagnosis of Pneumoconiosis
3.1. Biomarker Detection
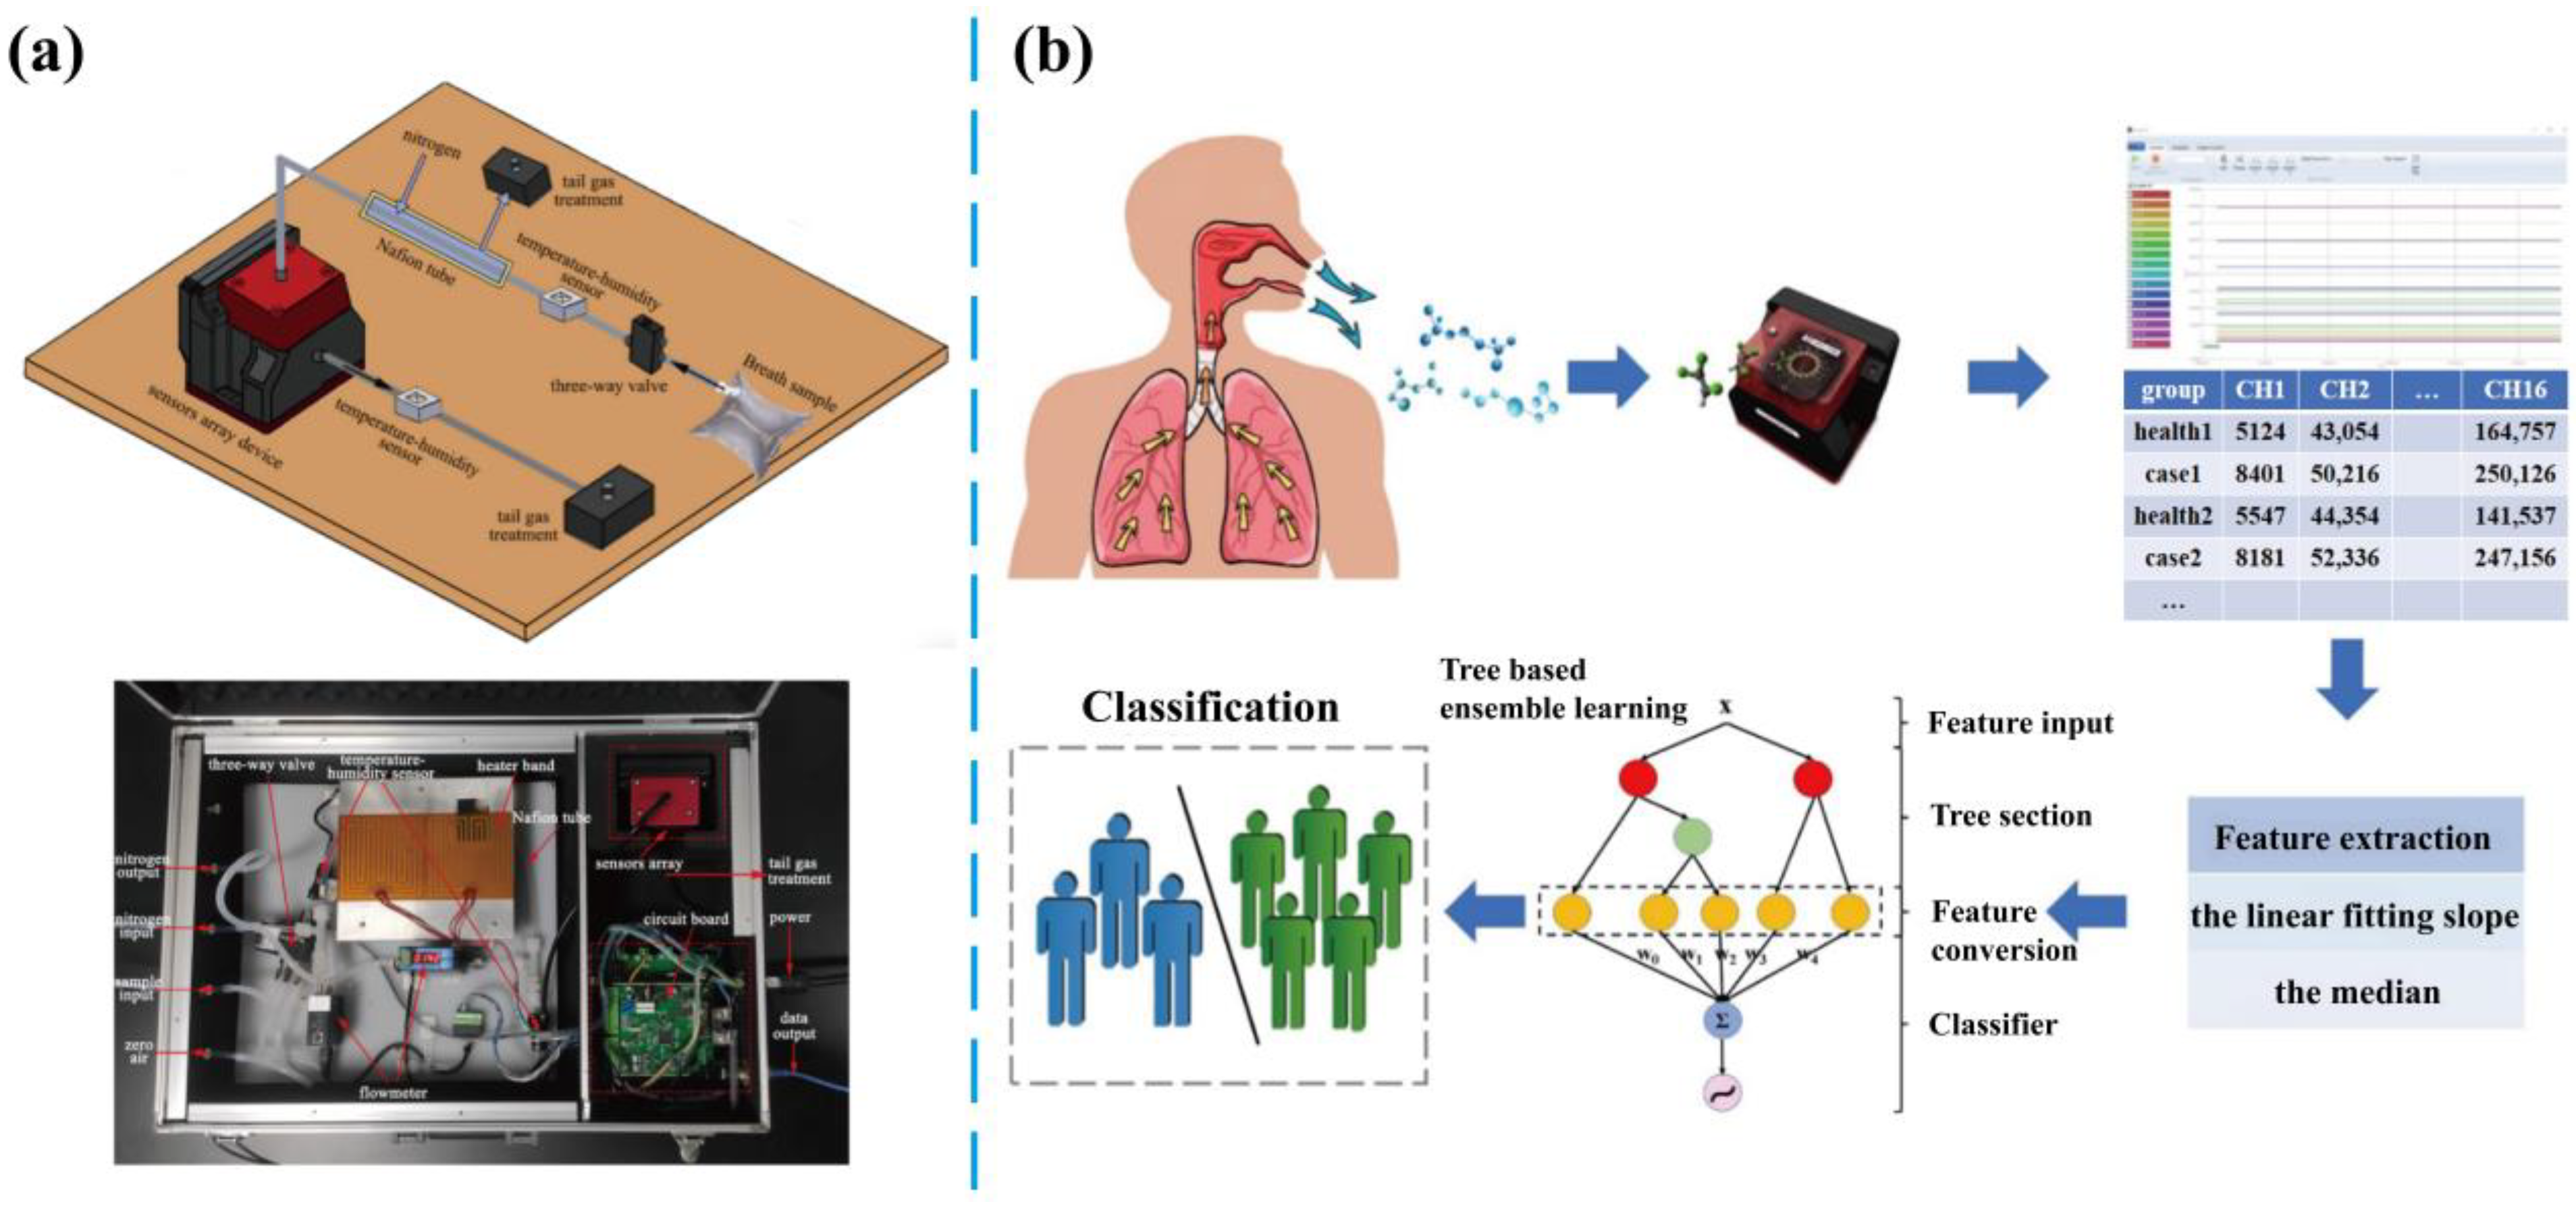
3.2. Breath Analysis
3.2.1. Monitoring of Exhaled Components
3.2.2. Respiratory Physiological Parameters
3.2.3. Key Factors and Strategies for Enhancing Breath Analysis Performance
3.3. E-Noses Technology
4. Conclusions and Outlook
Author Contributions
Funding
Conflicts of Interest
References
- Han, B.; Liu, H.; Zhai, G.; Wang, Q.; Liang, J.; Zhang, M.; Cui, K.; Shen, F.; Yi, H.; Li, Y.; et al. Estimates and predictions of coal workers’ pneumoconiosis cases among redeployed coal workers of the Fuxin mining industry group in China: A historical cohort study. PLoS ONE 2016, 11, e0148179. [Google Scholar] [CrossRef] [PubMed]
- Iijima, Y.; Bando, M.; Yamasawa, H.; Moriyama, H.; Takemura, T.; Niki, T.; Sugiyama, Y. A case of mixed dust pneumoconiosis with desquamative interstitial pneumonia-like reaction in an aluminum welder. Respir. Med. Case Rep. 2017, 20, 150–153. [Google Scholar] [CrossRef] [PubMed]
- Peng, Y.; Li, X.; Cai, S.; Chen, Y.; Dai, W.; Liu, W.; Zhou, Z.; Duan, J.; Chen, P. Prevalence and characteristics of COPD among pneumoconiosis patients at an occupational disease prevention institute: A cross-sectional study. BMC Pulm. Med. 2018, 18, 22. [Google Scholar] [CrossRef] [PubMed]
- Fan, Y.; Xu, W.; Wang, Y.; Wang, Y.; Yu, S.; Ye, Q. Association of occupational dust exposure with combined chronic obstructive pulmonary disease and pneumoconiosis: A cross-sectional study in China. BMJ Open 2020, 10, e038874. [Google Scholar] [CrossRef]
- Hu, M.; Wang, Z.; Hu, X.; Wang, Y.; Wang, G.; Ding, H.; Bian, M. High-resolution computed tomography diagnosis of pneumoconiosis complicated with pulmonary tuberculosis based on cascading deep supervision U-Net. Comput. Methods Programs Biomed. 2022, 226, 107151. [Google Scholar] [CrossRef]
- Li, Z.-G.; Li, B.-C.; Li, Z.-W.; Hu, H.-Y.; Ma, X.; Cao, H.; Yu, Z.-H.; Dai, H.-P.; Wang, J.; Wang, C. The potential diagnostic biomarkers for the IgG subclass in coal workers’ pneumoconiosis. J. Immunol. Res. 2023, 2023, 9233386. [Google Scholar] [CrossRef]
- Martínez, C.; Prieto, A.; García, L.; Quero, A.; González, S.; Casan, P. Silicosis, una enfermedad con presente activo. Arch. Bronconeumol. 2010, 46, 97–100. [Google Scholar] [CrossRef]
- Alam, M.S.; Wang, D.; Sowmya, A. AMFP-net: Adaptive multi-scale feature pyramid network for diagnosis of pneumoconiosis from chest X-ray images. Artif. Intell. Med. 2024, 154, 102917. [Google Scholar] [CrossRef]
- Akima, R.; JP, N.A.; Ito, K.; Nogami, S.; Nishimori, M.; Oogi, K.; Hayashi, N.; Suganuma, N.; Yamagami, T. Perceptual and objective physical quality of chest images: A comparison between digital radiographic chest images processed for cancer screening and pneumoconiosis screening in Japan. Ind. Health 2023, 61, 260–268. [Google Scholar] [CrossRef]
- Hayashi, H.; Ashizawa, K.; Takahashi, M.; Kato, K.; Arakawa, H.; Kishimoto, T.; Otsuka, Y.; Noma, S.; Honda, S. The diagnosis of early pneumoconiosis in dust-exposed workers: Comparison of chest radiography and computed tomography. Acta Radiol. 2022, 63, 909–913. [Google Scholar] [CrossRef]
- Foley, R.W.; Nassour, V.; Oliver, H.C.; Hall, T.; Masani, V.; Robinson, G.; Rodrigues, J.C.; Hudson, B.J. Chest X-ray in suspected lung cancer is harmful. Eur. Radiol. 2021, 31, 6269–6274. [Google Scholar] [CrossRef] [PubMed]
- Bosdelekidis, V.; Ioakeimidis, N.S. Lung field segmentation in chest X-rays: A deformation-tolerant procedure based on the approximation of rib cage seed points. Appl. Sci. 2020, 10, 6264. [Google Scholar] [CrossRef]
- Sauter, A.P.; Andrejewski, J.; Frank, M.; Willer, K.; Herzen, J.; Meurer, F.; Fingerle, A.A.; Makowski, M.R.; Pfeiffer, F.; Pfeiffer, D. Correlation of image quality parameters with tube voltage in X-ray dark-field chest radiography: A phantom study. Sci. Rep. 2021, 11, 14130. [Google Scholar] [CrossRef] [PubMed]
- Wang, Z.; Hu, M.; Zeng, M.; Wang, G. Intelligent image diagnosis of pneumoconiosis based on wavelet transform-derived texture features. Comput. Math. Method Med. 2022, 2022, 2037019. [Google Scholar] [CrossRef]
- Zhao, C.-Y.; Jia, R.-S.; Liu, Q.-M.; Liu, X.-Y.; Sun, H.-M.; Zhang, X.-L. Chest X-ray images super-resolution reconstruction via recursive neural network. Multimed. Tools Appl. 2021, 80, 263–277. [Google Scholar] [CrossRef]
- Sarapata, A.; Stayman, J.; Finkenthal, M.; Siewerdsen, J.; Pfeiffer, F.; Stutman, D. High energy X-ray phase contrast CT using glancing-angle grating interferometers. Med. Phys. 2014, 41, 021904. [Google Scholar] [CrossRef]
- Devnath, L.; Luo, S.; Summons, P.; Wang, D. Automated detection of pneumoconiosis with multilevel deep features learned from chest X-ray radiographs. Comput. Biol. Med. 2021, 129, 104125. [Google Scholar] [CrossRef]
- Alam, M.S.; Wang, D.; Sowmya, A. DLA-Net: Dual lesion attention network for classification of pneumoconiosis using chest X-ray images. Sci. Rep. 2024, 14, 11616. [Google Scholar] [CrossRef]
- Tucker, D.; Souto, M.; Barnes, G. Scatter in computed radiography. Radiology 1993, 188, 271–274. [Google Scholar] [CrossRef]
- Soneji, S.; Yang, J.; Tanner, N.T.; Dang, R.; Silvestri, G.A.; Black, W. Underuse of chest radiography versus computed tomography for lung cancer screening. Am. J. Public Health 2017, 107, 1248–1250. [Google Scholar] [CrossRef]
- Yu, H.; Guo, H.; Wang, Y.; Wang, Y.; Zhang, L. Bismuth nanomaterials as contrast agents for radiography and computed tomography imaging and their quality/safety considerations. WIREs Nanomed. Nanobiotechnol. 2022, 14, e1801. [Google Scholar] [CrossRef] [PubMed]
- Penenberg, B.L.; Samagh, S.P.; Rajaee, S.S.; Woehnl, A.; Brien, W.W. Digital radiography in total hip arthroplasty: Technique and radiographic results. J. Bone Jt. Surg. 2018, 100, 226–235. [Google Scholar] [CrossRef] [PubMed]
- Chung, N.; Cheng, Y.-H.; Po, H.-L.; Ng, W.-K.; Cheung, K.-C.; Yung, H.-Y.; Lai, Y.-M. Spinal phantom comparability study of cobb angle measurement of scoliosis using digital radiographic imaging. J. Orthop. Translat. 2018, 15, 81–90. [Google Scholar] [CrossRef] [PubMed]
- Doyle, P.; Martin, C. Calibrating automatic exposure control devices for digital radiography. Phys. Med. Biol. 2006, 51, 5475. [Google Scholar] [CrossRef]
- Scott, A.W.; Zhou, Y.; Allahverdian, J.; Nute, J.L.; Lee, C. Evaluation of digital radiography practice using exposure index tracking. J. Appl. Clin. Med. Phys. 2016, 17, 343–355. [Google Scholar] [CrossRef]
- Li, X.; Xu, M.; Yan, Z.; Xia, F.; Li, S.; Zhang, Y.; Xing, Z.; Guan, L. Deep convolutional network-based chest radiographs screening model for pneumoconiosis. Front. Med. 2024, 11, 1290729. [Google Scholar] [CrossRef]
- Marincowitz, C.; Gravesteijn, B.; Sheldon, T.; Steyerberg, E.; Lecky, F. Performance of the hull Salford Cambridge decision rule (HSC DR) for early discharge of patients with findings on CT scan of the brain: A CENTER-TBI validation study. Emerg. Med. J. 2022, 39, 213–219. [Google Scholar] [CrossRef]
- Moore, C.S.; Wood, T.J.; Jones, S.; Saunderson, J.R.; Beavis, A.W. A practical method to calibrate and optimise automatic exposure control devices for computed radiography (CR) and digital radiography (DR) imaging systems using the signal-to-noise ratio (SNR) metric. Biomed. Phys. Eng. Express 2019, 5, 035027. [Google Scholar] [CrossRef]
- Thomas, M.A.; Rowberg, A.H.; Langer, S.G.; Kim, Y. Interactive image enhancement of CR and DR images. J. Digit. Imaging 2004, 17, 189–195. [Google Scholar] [CrossRef]
- Petsonk, E.L.; Rose, C.; Cohen, R. Coal mine dust lung disease. New lessons from an old exposure. Am. J. Respir. Crit. Care Med. 2013, 187, 1178–1185. [Google Scholar] [CrossRef]
- Gao, X.; Qian, Y.; Gao, A. COVID-VIT: Classification of COVID-19 from CT chest images based on vision transformer models. arXiv 2021, arXiv:2107.01682. [Google Scholar]
- Catapano, F.; Marchitelli, L.; Cundari, G.; Cilia, F.; Mancuso, G.; Pambianchi, G.; Galea, N.; Ricci, P.; Catalano, C.; Francone, M. Role of advanced imaging in COVID-19 cardiovascular complications. Insights Imaging 2021, 12, 28. [Google Scholar] [CrossRef] [PubMed]
- Walkoff, L.; Hobbs, S. Chest imaging in the diagnosis of occupational lung diseases. Clin. Chest Med. 2020, 41, 581–603. [Google Scholar] [CrossRef] [PubMed]
- Khanna, S.A.; Nance, J.W.; Suliman, S.A. Detection and monitoring of interstitial lung disease in patients with systemic sclerosis. Curr. Rheumatol. Rep. 2022, 24, 166–173. [Google Scholar] [CrossRef]
- da Silva Teles, G.B.; Macedo, A.C.S.; Chate, R.C.; Valente, V.A.T.; de Gusmao Funari, M.B.; Szarf, G. LDCT lung cancer screening in populations at different risk for lung cancer. BMJ Open Respir. Res. 2020, 7, e000455. [Google Scholar] [CrossRef]
- Chang, S.; Li, M.; Yu, H.; Chen, X.; Deng, S.; Zhang, P.; Mou, X. Spectrum estimation-guided iterative reconstruction algorithm for dual energy CT. IEEE Trans. Med. Imaging 2019, 39, 246–258. [Google Scholar] [CrossRef]
- Sui, X.; Huang, Y.; Song, W.; Zheng, F.; Wang, X.; Xu, X.; Wang, Z.; Jiang, J.; Jin, Z. Clinical features of pulmonary cryptococcosis in thin-section CT in immunocompetent and non-AIDS immunocompromised patients. Radiol. Med. 2020, 125, 31–38. [Google Scholar] [CrossRef]
- Leineman, I.; Faizenberg, R.; Golimbievskaya, T.; Shostak, M.; Mazurov, V. OP0120 post-processing techniques for enhanced visualization of pulmonary vasculitis and pulmonary thrombosis by multislice spiral computed tomography in patients with systemic lupus erythematosus and antiphospholipid syndrome. Ann. Rheum. Dis. 2016, 75, 100–101. [Google Scholar] [CrossRef]
- Hamid, N.; Portnoy, J.M.; Pandya, A. Computer-assisted clinical diagnosis and treatment. Curr. Allergy Asthma Rep. 2023, 23, 509–517. [Google Scholar] [CrossRef]
- Young, C.; Barker, S.; Ehrlich, R.; Kistnasamy, B.; Yassi, A. Computer-aided detection for tuberculosis and silicosis in chest radiographs of gold miners of South Africa. Int. J. Tuberc. Lung Dis. 2020, 24, 444–451. [Google Scholar] [CrossRef]
- Mushtaq, F.; Bhattacharjee, S.; Mandia, S.; Singh, K.; Chouhan, S.S.; Kumar, R.; Harjule, P. Artificial intelligence for computer aided detection of pneumoconiosis: A succinct review since 1974. Eng. Appl. Artif. Intell. 2024, 133, 108516. [Google Scholar] [CrossRef]
- Wang, X.; Huang, F.; Cheng, Y. Computational performance optimization of support vector machine based on support vectors. Neurocomputing 2016, 211, 66–71. [Google Scholar] [CrossRef]
- Okumura, E.; Kawashita, I.; Ishida, T. Computerized classification of pneumoconiosis on digital chest radiography artificial neural network with three stages. J. Digit. Imaging 2017, 30, 413–426. [Google Scholar] [CrossRef] [PubMed]
- Okamoto, M.; Tominaga, M.; Shimizu, S.; Yano, C.; Masuda, K.; Nakamura, M.; Zaizen, Y.; Nouno, T.; Sakamoto, S.; Yokoyama, M. Dental technicians’ pneumoconiosis. Intern. Med. 2017, 56, 3323–3326. [Google Scholar] [CrossRef] [PubMed]
- Rosenbloom, J.; Ren, S.; Macarak, E. New frontiers in fibrotic disease therapies: The focus of the Joan and Joel Rosenbloom Center for fibrotic diseases at Thomas Jefferson University. Matrix Biol. 2016, 51, 14–25. [Google Scholar] [CrossRef]
- Zhang, L.; Rong, R.; Li, Q.; Yang, D.M.; Yao, B.; Luo, D.; Zhang, X.; Zhu, X.; Luo, J.; Liu, Y. A deep learning-based model for screening and staging pneumoconiosis. Sci. Rep. 2021, 11, 2201. [Google Scholar] [CrossRef]
- Chen, M.; Wang, Y.; Wang, Q.; Shi, J.; Wang, H.; Ye, Z.; Xue, P.; Qiao, Y. Impact of human and artificial intelligence collaboration on workload reduction in medical image interpretation. NPJ Digit. Med. 2024, 7, 349. [Google Scholar] [CrossRef]
- Wu, Y.; Xia, S.; Liang, Z.; Chen, R.; Qi, S. Artificial intelligence in COPD CT images: Identification, staging, and quantitation. Resp. Res. 2024, 25, 319. [Google Scholar] [CrossRef]
- Song, M.; Wang, J.; Yu, Z.; Wang, J.; Yang, L.; Lu, Y.; Li, B.; Wang, X.; Wang, X.; Huang, Q. PneumoLLM: Harnessing the power of large language model for pneumoconiosis diagnosis. Med. Image Anal. 2024, 97, 103248. [Google Scholar] [CrossRef]
- Dankert, A.; Dohrmann, T.; Löser, B.; Zapf, A.; Zöllner, C.; Petzoldt, M. Pulmonary function tests for the prediction of postoperative pulmonary complications: A systematic review. Deutsch. Ärztebl Int. 2022, 119, 99. [Google Scholar] [CrossRef]
- Presti, T.P.; Johnson, D.C. Improving pulmonary function test interpretation. Eur. Respir. J. 2023, 61, 2201858. [Google Scholar] [CrossRef] [PubMed]
- Hou, X.; Wei, Z.; Jiang, X.; Wei, C.; Dong, L.; Li, Y.; Liang, R.; Nie, J.; Shi, Y.; Qin, X. A comprehensive retrospect on the current perspectives and future prospects of pneumoconiosis. Front. Public Health 2025, 12, 1435840. [Google Scholar] [CrossRef] [PubMed]
- Huang, C.; Liu, R.; Cai, C.; Huang, L.; Xia, T.; Luo, S.; Wang, S.; Gan, Y.; Cai, J.; Peng, X. Investigation of factors influencing abnormal pulmonary ventilation function in occupational exposed populations and the establishment of a risk prediction model. Sci. Rep. 2024, 14, 25215. [Google Scholar] [CrossRef] [PubMed]
- Carney, J.; McAdams, P.; McCluskey, J.; Roggli, V.L. Aluminum-induced pneumoconiosis confirmed by analytical scanning electron microscopy: A case report and review of the literature. Ultrastruct. Pathol. 2016, 40, 155–158. [Google Scholar] [CrossRef]
- Raj, R.; Raparia, K.; Lynch, D.A.; Brown, K.K. Surgical lung biopsy for interstitial lung diseases. Chest 2017, 151, 1131–1140. [Google Scholar] [CrossRef]
- Govender, P.; Keyes, C.M.; Hankinson, E.A.; O’Hara, C.J.; Sanchorawala, V.; Berk, J.L. Transbronchial biopsies safely diagnose amyloid lung disease. Amyloid 2017, 24, 37–41. [Google Scholar] [CrossRef]
- Mukhopadhyay, S.; Mehta, A.C. Utility of core needle biopsies and transbronchial biopsies for diagnosing nonneoplastic lung diseases. Arch. Pathol. Lab. Med. 2018, 142, 1054–1068. [Google Scholar] [CrossRef]
- Yoon, H.-Y.; Kim, Y.; Park, H.S.; Kang, C.-W.; Ryu, Y.J. Combined silicosis and mixed dust pneumoconiosis with rapid progression: A case report and literature review. World J. Clin. Cases 2018, 6, 1164. [Google Scholar] [CrossRef]
- Chao, B.; Sage, A.; Cypel, M.; Liu, M.; Yeung, J.; Bai, X.; Van Raemdonck, D.; Ceulemans, L.; Neyrinck, A.; Verleden, S. The reliability and validity of donor tissue biopsies in lung transplantation. J. Heart Lung Transpl. 2021, 40, S347. [Google Scholar] [CrossRef]
- Guo, Y.; Li, H.; Chen, H.; Li, Z.; Ding, W.; Wang, J.; Yin, Y.; Jin, L.; Sun, S.; Jing, C. Metagenomic next-generation sequencing to identify pathogens and cancer in lung biopsy tissue. EBioMedicine 2021, 73, 103639. [Google Scholar] [CrossRef]
- Liu, G.; Xing, R.; Zhu, Z.; Wan, C. Changes in serum protein expression in patients with pneumoconiosis fibrosis treated with Vernonia anthelmintica Willd. injection. Asian J. Surg. 2022, 45, 1285–1286. [Google Scholar] [CrossRef] [PubMed]
- Chair, S.Y.; Chan, J.Y.W.; Law, B.M.H.; Waye, M.M.Y.; Chien, W.T. Genetic susceptibility in pneumoconiosis in China: A systematic review. Int. Arch. Occup. Environ. Health 2023, 96, 45–56. [Google Scholar] [CrossRef] [PubMed]
- Qian, Q.; Cao, X.; Wang, B.; Qu, Y.; Qian, Q.; Sun, Z.; Feng, F. Retracted: TNF-α-TNFR signal pathway inhibits autophagy and promotes apoptosis of alveolar macrophages in coal worker’s pneumoconiosis. J. Cell. Physiol. 2019, 234, 5953–5963. [Google Scholar] [CrossRef] [PubMed]
- Pingle, S.K.; Tumane, R.G.; Jawade, A.A. Neopterin: Biomarker of cell-mediated immunity and potent usage as biomarker in silicosis and other occupational diseases. Indian J. Occup. Environ. 2008, 12, 107–111. [Google Scholar] [CrossRef]
- Hakim, M.; Broza, Y.Y.; Barash, O.; Peled, N.; Phillips, M.; Amann, A.; Haick, H. Volatile organic compounds of lung cancer and possible biochemical pathways. Chem. Rev. 2012, 112, 5949–5966. [Google Scholar] [CrossRef]
- Pan, X.; Shi, X.; Zhang, H.; Chen, Y.; Zhou, J.; Shen, F.; Wang, J.; Jiang, R. Exosomal miR-4516 derived from ovarian cancer stem cells enhanced cisplatin tolerance in ovarian cancer by inhibiting GAS7. Gene 2024, 927, 148738. [Google Scholar] [CrossRef]
- Kiszałkiewicz, J.; Majewski, S.; Piotrowski, W.; Górski, P.; Pastuszak-Lewandoska, D.; Migdalska-Sęk, M.; Brzeziańska-Lasota, E. Evaluation of selected IL6/STAT3 pathway molecules and miRNA expression in chronic obstructive pulmonary disease. Sci. Rep. 2021, 11, 22756. [Google Scholar] [CrossRef]
- Yarali, E.; Eksin, E.; Torul, H.; Ganguly, A.; Tamer, U.; Papakonstantinou, P.; Erdem, A. Impedimetric detection of miRNA biomarkers using paper-based electrodes modified with bulk crystals or nanosheets of molybdenum disulfide. Talanta 2022, 241, 123233. [Google Scholar] [CrossRef]
- Huang, R.; Yu, T.; Li, Y.; Hu, J. Upregulated has-miR-4516 as a potential biomarker for early diagnosis of dust-induced pulmonary fibrosis in patients with pneumoconiosis. Toxicol. Res. 2018, 7, 415–422. [Google Scholar] [CrossRef]
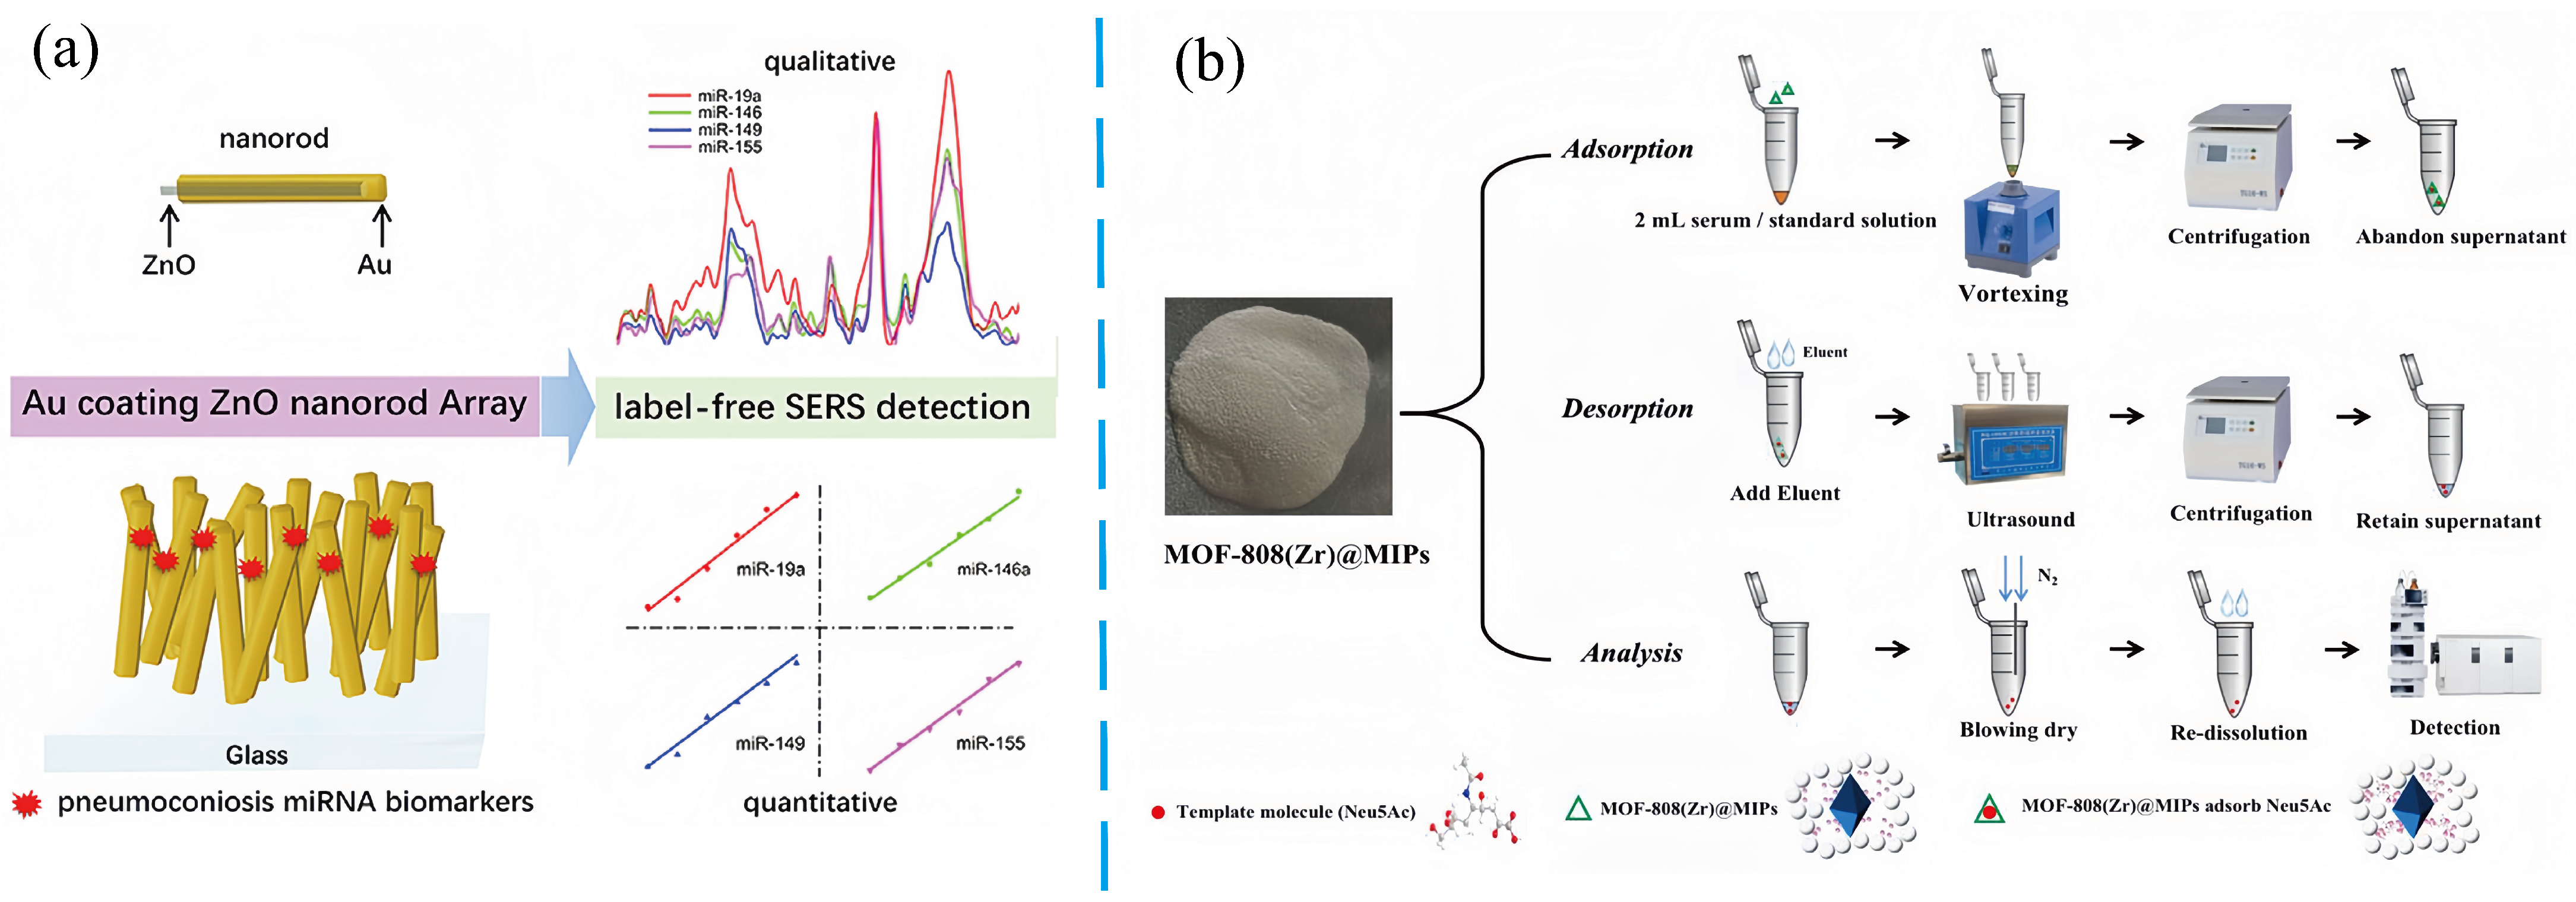
- Cui, J.; Guan, Q.; Lv, H.; Fu, K.; Fu, R.; Feng, Z.; Chen, F.; Zhang, G. Three-dimensional nanorod array for label-free surface-enhanced Raman spectroscopy analysis of microRNA pneumoconiosis biomarkers. Spectrochim. Acta Part A Mol. Biomol. Spectrosc. 2021, 261, 120015. [Google Scholar] [CrossRef]
- Lin, R.; Chen, B.; Luo, D.; Wu, Y.; Huang, L.; Huang, L.; Liao, Q.; Zheng, L. Molecularly imprinted polymers coated on the surface of metal-organic frameworks combined with liquid chromatography-tandem mass spectrometry for the detection of free N-acetylneuraminic acid in serum of pneumoconiosis patients. Microchem. J. 2022, 181, 107821. [Google Scholar] [CrossRef]
- Wang, H.; Zhou, S.; Liu, Y.; Yu, Y.; Xu, S.; Peng, L.; Ni, C. Exploration study on serum metabolic profiles of Chinese male patients with artificial stone silicosis, silicosis, and coal worker’s pneumoconiosis. Toxicol. Lett. 2022, 356, 132–142. [Google Scholar] [CrossRef] [PubMed]
- Hamdy, N.M.; Zaki, M.B.; Abdelmaksoud, N.M.; Elshaer, S.S.; Abd-Elmawla, M.A.; Rizk, N.I.; Fathi, D.; Doghish, A.S.; Abulsoud, A.I. Comprehensive insights and in silico analysis into the emerging role of LincRNAs in lung diseases pathogenesis; a step toward ncRNA precision. Funct. Integr. Genom. 2025, 25, 34. [Google Scholar] [CrossRef] [PubMed]
- Bahia, W.; Soltani, I.; Abidi, A.; Mahdhi, A.; Mastouri, M.; Ferchichi, S.; Almawi, W.Y. Structural impact, ligand-protein interactions, and molecular phenotypic effects of TGF-β1 gene variants: In silico analysis with implications for idiopathic pulmonary fibrosis. Gene 2024, 922, 148565. [Google Scholar] [CrossRef]
- Deng, C.-W.; Zhang, X.-X.; Lin, J.-H.; Huang, L.-F.; Qu, Y.-L.; Bai, C. Association between genetic variants of transforming growth factor-β1 and susceptibility of pneumoconiosis: A meta-analysis. Chin. Med. J. 2017, 130, 357–364. [Google Scholar] [CrossRef]
- Zhang, Y.; Sun, D.; Song, Y.; Ye, Q. Candidate gene polymorphisms associated with silicosis and coal workers’ pneumoconiosis: A systematic review and meta-analysis. BMC Pulm. Med. 2024, 24, 580. [Google Scholar] [CrossRef]
- Sullivan, D.E.; Ferris, M.; Pociask, D.; Brody, A.R. The latent form of TGFβ1 is induced by TNFα through an ERK specific pathway and is activated by asbestos-derived reactive oxygen species in vitro and in vivo. J. Immunotoxicol. 2008, 5, 145–149. [Google Scholar] [CrossRef]
- Wojnowski, W.; Dymerski, T.; Gębicki, J.; Namieśnik, J. Electronic noses in medical diagnostics. Curr. Med. Chem. 2019, 26, 197–215. [Google Scholar] [CrossRef]
- Behera, B.; Joshi, R.; Vishnu, G.A.; Bhalerao, S.; Pandya, H.J. Electronic nose: A non-invasive technology for breath analysis of diabetes and lung cancer patients. J. Breath Res. 2019, 13, 024001. [Google Scholar] [CrossRef]
- Scarlata, S.; Finamore, P.; Meszaros, M.; Dragonieri, S.; Bikov, A. The role of electronic noses in phenotyping patients with chronic obstructive pulmonary disease. Biosensors 2020, 10, 171. [Google Scholar] [CrossRef]
- Hsiao-Yu, Y.; Shie, R.-H.; Che-Jui, C.; Pau-Chung, C. Development of breath test for pneumoconiosis: A case-control study. Resp. Res. 2017, 18, 178. [Google Scholar]
- Hashoul, D.; Haick, H. Sensors for detecting pulmonary diseases from exhaled breath. Eur. Respir. Rev. 2019, 28, 190011. [Google Scholar] [CrossRef] [PubMed]
- Marzorati, D.; Mainardi, L.; Sedda, G.; Gasparri, R.; Spaggiari, L.; Cerveri, P. A review of exhaled breath: A key role in lung cancer diagnosis. J. Breath Res. 2019, 13, 034001. [Google Scholar] [CrossRef] [PubMed]
- Park, S.Y.; Kim, Y.; Kim, T.; Eom, T.H.; Kim, S.Y.; Jang, H.W. Chemoresistive materials for electronic nose: Progress, perspectives, and challenges. InfoMat 2019, 1, 289–316. [Google Scholar] [CrossRef]
- Guntner, A.T.; Abegg, S.; Konigstein, K.; Gerber, P.A.; Schmidt-Trucksass, A.; Pratsinis, S.E. Breath sensors for health monitoring. ACS Sens. 2019, 4, 268–280. [Google Scholar] [CrossRef]
- Adiguzel, Y.; Kulah, H. Breath sensors for lung cancer diagnosis. Biosens. Bioelectron. 2015, 65, 121–138. [Google Scholar] [CrossRef]
- Xuan, W.; Zheng, L.; Bunes, B.R.; Crane, N.; Zhou, F.; Zang, L. Engineering solutions to breath tests based on an e-nose system for silicosis screening and early detection in miners. J. Breath Res. 2022, 16, 036001. [Google Scholar] [CrossRef]
- Broza, Y.Y.; Mochalski, P.; Ruzsanyi, V.; Amann, A.; Haick, H. Hybrid volatolomics and disease detection. Angew. Chem. Int. Ed. 2015, 54, 11036–11048. [Google Scholar] [CrossRef]
- Hu, W.; Wu, W.; Jian, Y.; Haick, H.; Zhang, G.; Qian, Y.; Yuan, M.; Yao, M. Volatolomics in healthcare and its advanced detection technology. Nano Res. 2022, 15, 8185–8213. [Google Scholar] [CrossRef]
- Song, X.; Qian, L.; Fu, L.; Cao, R.; Wang, X.; Chen, M. Real-time mildew detection and gradation in simulated containerized soybeans: Insights from GC-IMS analysis of mVOCs and VOCs. Food Sci. Nutr. 2024, 12, 6772–6788. [Google Scholar] [CrossRef]
- Yang, C.; Jiao, L.; Dong, C.; Wen, X.; Lin, P.; Duan, D.; Li, G.; Zhao, C.; Fu, X.; Dong, D. Long-range infrared absorption spectroscopy and fast mass spectrometry for rapid online measurements of volatile organic compounds from black tea fermentation. Food Chem. 2024, 449, 139211. [Google Scholar] [CrossRef] [PubMed]
- Xiong, H.; Zhang, X.; Sun, J.; Xue, Y.; Yu, W.; Mou, S.; Hsia, K.J.; Wan, H.; Wang, P. Recent advances in biosensors detecting biomarkers from exhaled breath and saliva for respiratory disease diagnosis. Biosens. Bioelectron. 2025, 267, 116820. [Google Scholar] [CrossRef] [PubMed]
- Kołodziej, M.; de Veer, M.J.; Cholewa, M.; Egan, G.F.; Thompson, B.R. Lung function imaging methods in cystic fibrosis pulmonary disease. Respir. Res. 2017, 18, 96. [Google Scholar] [CrossRef] [PubMed]
- Zhou, Z.; Xu, T.; Zhang, X. Empowerment of AI algorithms in biochemical sensors. TrAC Trends Anal. Chem. 2024, 173, 117613. [Google Scholar] [CrossRef]
- Ni, Y.; Zang, X.; Yang, Y.; Gong, Z.; Li, H.; Chen, J.; Wu, C.; Huang, J.; Lai, Y. Environmental stability stretchable organic hydrogel humidity sensor for respiratory monitoring with ultrahigh sensitivity. Adv. Func. Mater. 2024, 34, 2402853. [Google Scholar] [CrossRef]
- Lagopati, N.; Valamvanos, T.-F.; Proutsou, V.; Karachalios, K.; Pippa, N.; Gatou, M.-A.; Vagena, I.-A.; Cela, S.; Pavlatou, E.A.; Gazouli, M. The role of nano-sensors in breath analysis for early and non-invasive disease diagnosis. Chemosensors 2023, 11, 317. [Google Scholar] [CrossRef]
- Lourenço, C.; Turner, C. Breath analysis in disease diagnosis: Methodological considerations and applications. Metabolites 2014, 4, 465–498. [Google Scholar] [CrossRef]
- Najafabadi, S.A.N.; Huang, C.; Betlem, K.; van Voorthuizen, T.A.; de Smet, L.C.; Ghatkesar, M.K.; van Dongen, M.; van der Veen, M.A. Advancements in inkjet printing of metal and covalent organic frameworks: Process design and ink optimization. ACS Appl. Mater. Interfaces 2025, 17, 11469–11494. [Google Scholar] [CrossRef]
- Emmanuel, A.O.; Zine, N.; Raffin, G.; Jaffrezic-Renault, N.; Elaissari, A.; Errachid, A. Integrated breath analysis technologies: Current advances and future prospects. TrAC Trend. Anal. Chem. 2024, 181, 118048. [Google Scholar]
- Zuliani, C.; Luque, J.; Falco, C.; Gardner, E.; De Luca, A.; Vincent, T.; Tripathy, S.; Ali, Z.; Udrea, F. Flow compensated gas sensing array for improved performances in breath-analysis applications. IEEE Sens. Lett. 2020, 4, 5500504. [Google Scholar] [CrossRef]
- Janeiro, R.; Flores, R.; Viegas, J. Silicon photonics waveguide array sensor for selective detection of VOCs at room temperature. Sci. Rep. 2019, 9, 17099. [Google Scholar] [CrossRef] [PubMed]
- Li, Q.; He, C.; Wang, C.; Huang, Y.; Yu, J.; Wang, C.; Li, W.; Zhang, X.; Zhang, F.; Qing, G. Sustainable, insoluble, and photonic cellulose nanocrystal patches for calcium ion sensing in sweat. Small 2023, 19, 2207932. [Google Scholar] [CrossRef]
- Singh, S.; Varma, P.; Sreelekha, G.; Adak, C.; Shukla, R.P.; Kamble, V.B. Metal oxide-based gas sensor array for VOCs determination in complex mixtures using machine learning. Microchim. Acta 2024, 191, 196. [Google Scholar] [CrossRef] [PubMed]
- Li, Y.; Wang, Z.; Zhao, T.; Li, H.; Jiang, J.; Ye, J. Electronic nose for the detection and discrimination of volatile organic compounds: Application, challenges, and perspectives. TrAC Trend. Anal. Chem. 2024, 180, 117958. [Google Scholar] [CrossRef]
- Yu, K.-L.; Yang, H.-C.; Lee, C.-F.; Wu, S.-Y.; Ye, Z.-K.; Rai, S.K.; Lee, M.-R.; Tang, K.-T.; Wang, J.-Y. Exhaled breath analysis using a novel electronic nose for different respiratory disease entities. Lung 2025, 203, 14. [Google Scholar] [CrossRef]
- Cai, M.; Xu, S.; Zhou, X.; Lu, H. Electronic nose humidity compensation system based on rapid detection. Sensors 2024, 24, 5881. [Google Scholar] [CrossRef]
- Togbe, D.; Benmerzoug, S.; Jacobs, M.; Ryffel, B.; Quesniaux, V. Silica-related diseases in the modern world: A role for self-DNA sensing in lung inflammatory diseases. Allergy 2020, 75, 3009–3010. [Google Scholar] [CrossRef]
- Hendrick, H.; Hidayat, R.; Horng, G.-J.; Wang, Z.-H. Non-invasive method for tuberculosis exhaled breath classification using electronic nose. IEEE Sens. J. 2021, 21, 11184–11191. [Google Scholar] [CrossRef]
- Kononov, A.; Korotetsky, B.; Jahatspanian, I.; Gubal, A.; Vasiliev, A.; Arsenjev, A.; Nefedov, A.; Barchuk, A.; Gorbunov, I.; Kozyrev, K. Online breath analysis using metal oxide semiconductor sensors (electronic nose) for diagnosis of lung cancer. J. Breath Res. 2019, 14, 016004. [Google Scholar] [CrossRef]
- Wu, Y.; Yuan, J.; Li, X.; Zhang, X. GeP3 monolayer as a promising 2D sensing materials in detecting SO2, H2S, SOF2 and SO2F2. Phys. Scr. 2024, 99, 085956. [Google Scholar] [CrossRef]
- Ohnishi, M.; Ishimoto, C.I.C.; Aoki, M.A.M. Fundamental properties and characteristics of a gas-sensitive device, made of a surface acoustic wave device and Langmuir-Blodgett film, used in a recognition system for odoriferous gases. Jpn. J. Appl. Phys. 1994, 33, 5987. [Google Scholar] [CrossRef]
- Burgués, J.; Hernández, V.; Lilienthal, A.J.; Marco, S. Gas distribution mapping and source localization using a 3D grid of metal oxide semiconductor sensors. Sens. Actuators B Chem. 2020, 304, 127309. [Google Scholar] [CrossRef]
- Yang, J.; Wang, T.; Zhu, C.; Yin, X.; Dong, P.; Wu, X. A composite gas-phase explosives sensor with frequency-resistance dual-signal display based on surface acoustic wave. ACS Appl. Electron. Mater. 2023, 5, 1526–1535. [Google Scholar] [CrossRef]
- Ji, H.; Zeng, W.; Li, Y. Gas sensing mechanisms of metal oxide semiconductors: A focus review. Nanoscale 2019, 11, 22664–22684. [Google Scholar] [CrossRef]
- Krishna, K.G.; Parne, S.; Pothukanuri, N.; Kathirvelu, V.; Gandi, S.; Joshi, D. Nanostructured metal oxide semiconductor-based gas sensors: A comprehensive review. Sens. Actuators A Phys. 2022, 341, 113578. [Google Scholar] [CrossRef]
- Zhou, X.; Cheng, X.; Zhu, Y.; Elzatahry, A.A.; Alghamdi, A.; Deng, Y.; Zhao, D. Ordered porous metal oxide semiconductors for gas sensing. Chin. Chem. Lett. 2018, 29, 405–416. [Google Scholar] [CrossRef]
- Shooshtari, M.; Salehi, A. An electronic nose based on carbon nanotube-titanium dioxide hybrid nanostructures for detection and discrimination of volatile organic compounds. Sens. Actuators B Chem. 2022, 357, 131418. [Google Scholar] [CrossRef]
- Amoah, N.A.; Xu, G.; Kumar, A.R.; Wang, Y. Calibration of low-cost particulate matter sensors for coal dust monitoring. Sci. Total Environ. 2023, 859, 160336. [Google Scholar] [CrossRef]
- Tirzïte, M.; Bukovskis, M.; Strazda, G.; Jurka, N.; Taivans, I. Detection of lung cancer with electronic nose and logistic regression analysis. J. Breath Res. 2018, 13, 016006. [Google Scholar] [CrossRef]
- Kovacs, D.; Bikov, A.; Losonczy, G.; Murakozy, G.; Horvath, I. Follow up of lung transplant recipients using an electronic nose. J. Breath Res. 2013, 7, 017117. [Google Scholar] [CrossRef]


| Diagnostic Techniques | Advantages | Limitations |
|---|---|---|
| HKV X-ray Imaging | Short exposure time; less radiation dose | Multifactorial |
| CR | Indirect digital imaging; reduces the exposure dose | Low image resolution and clarity, slow imaging process vs. DR |
| DR | Direct digital imaging; high image resolution and clarity, fast imaging process vs. CR | High cost; complex lesions inferior to CT; specialized technical staff required |
| HRCT | High spatial resolution | Risk of radiation exposure |
| LDCT | Low radiation dose; universal adoption | Increased image noise vs. HRCT |
| Dual Energy Spectrum CT | High accuracy | Complicated operation |
| Thin-Section CT | High clarity | Limited scanning range |
| MSCT | Fast scanning and data acquisition speed; high temporal and spatial resolution; higher image quality; obvious 3D effects | High radiation dose |
Disclaimer/Publisher’s Note: The statements, opinions and data contained in all publications are solely those of the individual author(s) and contributor(s) and not of MDPI and/or the editor(s). MDPI and/or the editor(s) disclaim responsibility for any injury to people or property resulting from any ideas, methods, instructions or products referred to in the content. |
© 2025 by the authors. Licensee MDPI, Basel, Switzerland. This article is an open access article distributed under the terms and conditions of the Creative Commons Attribution (CC BY) license (https://creativecommons.org/licenses/by/4.0/).
Share and Cite
Zhang, Y.; Xuan, W.; Chen, S.; Yang, M.; Xing, H. The Screening and Diagnosis Technologies Towards Pneumoconiosis: From Imaging Analysis to E-Noses. Chemosensors 2025, 13, 102. https://doi.org/10.3390/chemosensors13030102
Zhang Y, Xuan W, Chen S, Yang M, Xing H. The Screening and Diagnosis Technologies Towards Pneumoconiosis: From Imaging Analysis to E-Noses. Chemosensors. 2025; 13(3):102. https://doi.org/10.3390/chemosensors13030102
Chicago/Turabian StyleZhang, Yuqian, Wufan Xuan, Shuai Chen, Mingna Yang, and Huakun Xing. 2025. "The Screening and Diagnosis Technologies Towards Pneumoconiosis: From Imaging Analysis to E-Noses" Chemosensors 13, no. 3: 102. https://doi.org/10.3390/chemosensors13030102
APA StyleZhang, Y., Xuan, W., Chen, S., Yang, M., & Xing, H. (2025). The Screening and Diagnosis Technologies Towards Pneumoconiosis: From Imaging Analysis to E-Noses. Chemosensors, 13(3), 102. https://doi.org/10.3390/chemosensors13030102