Article

A Hydrogen Peroxide Responsive Biotin-Guided Near-Infrared Hemicyanine-Based Fluorescent Probe for Early Cancer Diagnosis

State Key Laboratory of Digital Medical Engineering, School of Biological Science and Medical Engineering, Southeast University, Nanjing 210096, China
*
Author to whom correspondence should be addressed.
These authors contributed equally to this work.
Chemosensors 2025, 13(3), 104; https://doi.org/10.3390/chemosensors13030104
Submission received: 22 January 2025 / Revised: 5 March 2025 / Accepted: 11 March 2025 / Published: 13 March 2025

Abstract

:
H2O2 plays an important role in oxidative damage and redox signaling. Studies have shown that abnormal levels of H2O2 are closely related to the development of cancer. The levels of H2O2 in tumor cells are higher than in normal cells. Thus, it is of great importance to develop a fluorescent probe to monitor the level of H2O2 in vivo. This work reports a new biotin-guided NIR fluorescent probe, Bio-B-Cy, consisting of boronic acid ester as a H2O2-recognition site and biotin as a tumor binding site, which accelerates the fluorescence response to H2O2 in vivo. Bio-B-Cy exhibits good sensitivity and selectivity toward H2O2. In addition, Bio-B-Cy shows a dose-dependent response to H2O2 and the detection limit is 0.14 μM. We further demonstrate that Bio-B-Cy could successfully detect the H2O2 in biotin receptor-positive cancer cells and tumor tissues. Based on the results, Bio-B-Cy has the potential to serve as an efficient tool for early diagnosis of cancer.

1. Introduction

Hydrogen peroxide (H2O2) is one of the reactive oxygen species (ROS) and plays an important role in diverse pathological and physiological processes such as cell growth, poliferation, migration, and apoptosis [1]. H2O2 affects the regulatory function of proteins and the associated cascades by selectively reacting with the thiol group of cystine residues of proteins. Thus, abnormal expression levels of H2O2 can cause cell damage, apoptosis, and autophagy, thereby inducing diseases such as inflammation [2], Alzheimer’s disease [3], and cancers [4]. It is noteworthy that although H2O2 is ubiquitous in various cells, H2O2 is usually upregulated in cancer cells (~5.0 μM to 1.0 mM), while the concentration of H2O2 in normal cells is significantly lower (less than 0.7 μM), which makes it a promising biomarker for cancer diagnosis [5]. Furthermore, due to the widespread presence of H2O2 in vivo, the development of H2O2-targeted diagnostic strategies for tumors is particularly crucial to avoid false positives.
Compared with other clinical imaging technologies, fluorescence imaging technologies are attractive in biomedical applications due to their high selectivity, non-invasiveness, and high-resolution imaging [6,7,8,9,10]. Fluorescent probes play an important role in fluorescence imaging. Fluorescent probes refer to a type of fluorescent molecule that has a characteristic fluorescence response in the ultraviolet-visible-near-infrared (UV-Vis-NIR) region [11]. To date, many traditional fluorescent dyes have been applied to form H2O2-sensitive probes in biological imaging. For instance, 2,7-dichlorofluorescein (DCF) derivative probes have been widely used to detect gas, such as H2S, ROS, and NO [12]. Fluorescein derivative probes are developed for sensitive detection of H2O2 in living cells [13]. However, the application in vivo of these reported H2O2 probes is limited due to its short analytical wavelengths. Near-infrared (NIR) fluorescent probes have long excitation/emission wavelengths, enabling deeper tissue penetration, and lower background fluorescence of proteins, which are beneficial to apply in biological imaging [14,15,16]. For instance, Lin reported an approach for near-infrared fluorescent imaging in vivo [17]. Wang et al. developed an NIR probe DHX-1 for imaging H2O2 in kidney injury caused by environmental hazards of physiological factors [18]. Zan et al. presented an NIR probe for the visualization of endogenous levels of H2O2 changes in different disease models [19]. However, as mentioned above, H2O2 is not exclusively expressed in tumor cells but is also present in other cell types, such as inflammatory cells. Therefore, non-targeted H2O2 fluorescent probes may produce strong signals in non-tumor cells, leading to false-positive results. Considering this, the development of fluorescent probes with tumor-cell-specific targeting is of great importance. To improve the selectivity of tumor cells in vivo, installing a recognition group for specific cell membrane receptors in cancer cells is a classical strategy [20]. Biotin receptors are overexpressed in various tumor cells including lung, breast, ovarian, and cervical cancer cells [21]. Therefore, biotin can be used as an NIR probe ligand to enhance tumor targeting in vivo due to its high affinity for biotin receptors [22]. However, biotin was also found to affect a range of metabolic processes in the liver [23], such as participating in liver lipid metabolism [24], and regulating liver glucokinase [25], which indicates that the excretion and degradation of biotin in organisms is delayed. Therefore, when designing the molecular probe, carefully considering the incorporation and removal of biotin is crucial, as it can impact the probe’s specificity and metabolic performance.
Herein, we present a tumor-cell-targeted NIR fluorescent probe (Bio-B-Cy), which contains a biotin group as the tumor cells targeting part, a cyanine dye as NIR fluorophore [26], and a boronic acid ester [27] as the H2O2-responsive unit. The dye is a stable hemicyanine skeleton and possesses an NIR feature. The conjugation of biotin in Bio-B-Cy facilitates its great tumor-targeting ability [22]. The fluorescence of cyanine is quenched by the boronic acid ester group. Upon reacting with H2O2, Bio-B-Cy quickly cleaves the boronic acid ester group and releases a strong NIR fluorescence. Bio-B-Cy exhibits high sensitivity and selectivity towards H2O2 in solution with a relatively low limit of detection of 0.14 μM. Meanwhile, Bio-B-Cy can quickly target biotin-receptor-positive cancer cells and tissues, which has been successfully utilized for detecting H2O2 in cancer cells and tumor-bearing mice, confirming its potential to be a promising agent for cancer diagnosis. Additionally, previous similar probe retained the biotin moiety even after the H2O2 response [28], which may potentially accumulate in the liver during metabolism. In contrast, molecular designed in this work incorporates the biotin group as a removable component. The clever molecular design work ensures that the biotin is cleaved from the NIR fluorescent dye upon the reaction with H2O2, thereby avoiding metabolic issues and false-positive concerns. This work designed a near-infrared fluorescent probe that responds to H2O2 and targets tumors, highlighting its potential applications in cancer imaging.

2. Materials and Methods

2.1. Instrumentation

Commercial analytical grade chemicals were purchased and used without purification. Cy-OH was synthesized according to the previously described method [26]. NMR spectra were collected on a 600 MHz spectrometer (Bruker AVANCE III HD 600, Bremen, Germany) using chloroform-d or Dimethyl sulfoxide-d as the solvent. Mass spectra were obtained by using MALDI-TOF-MS (Bruker Autoflex III, Bremen, Germany).

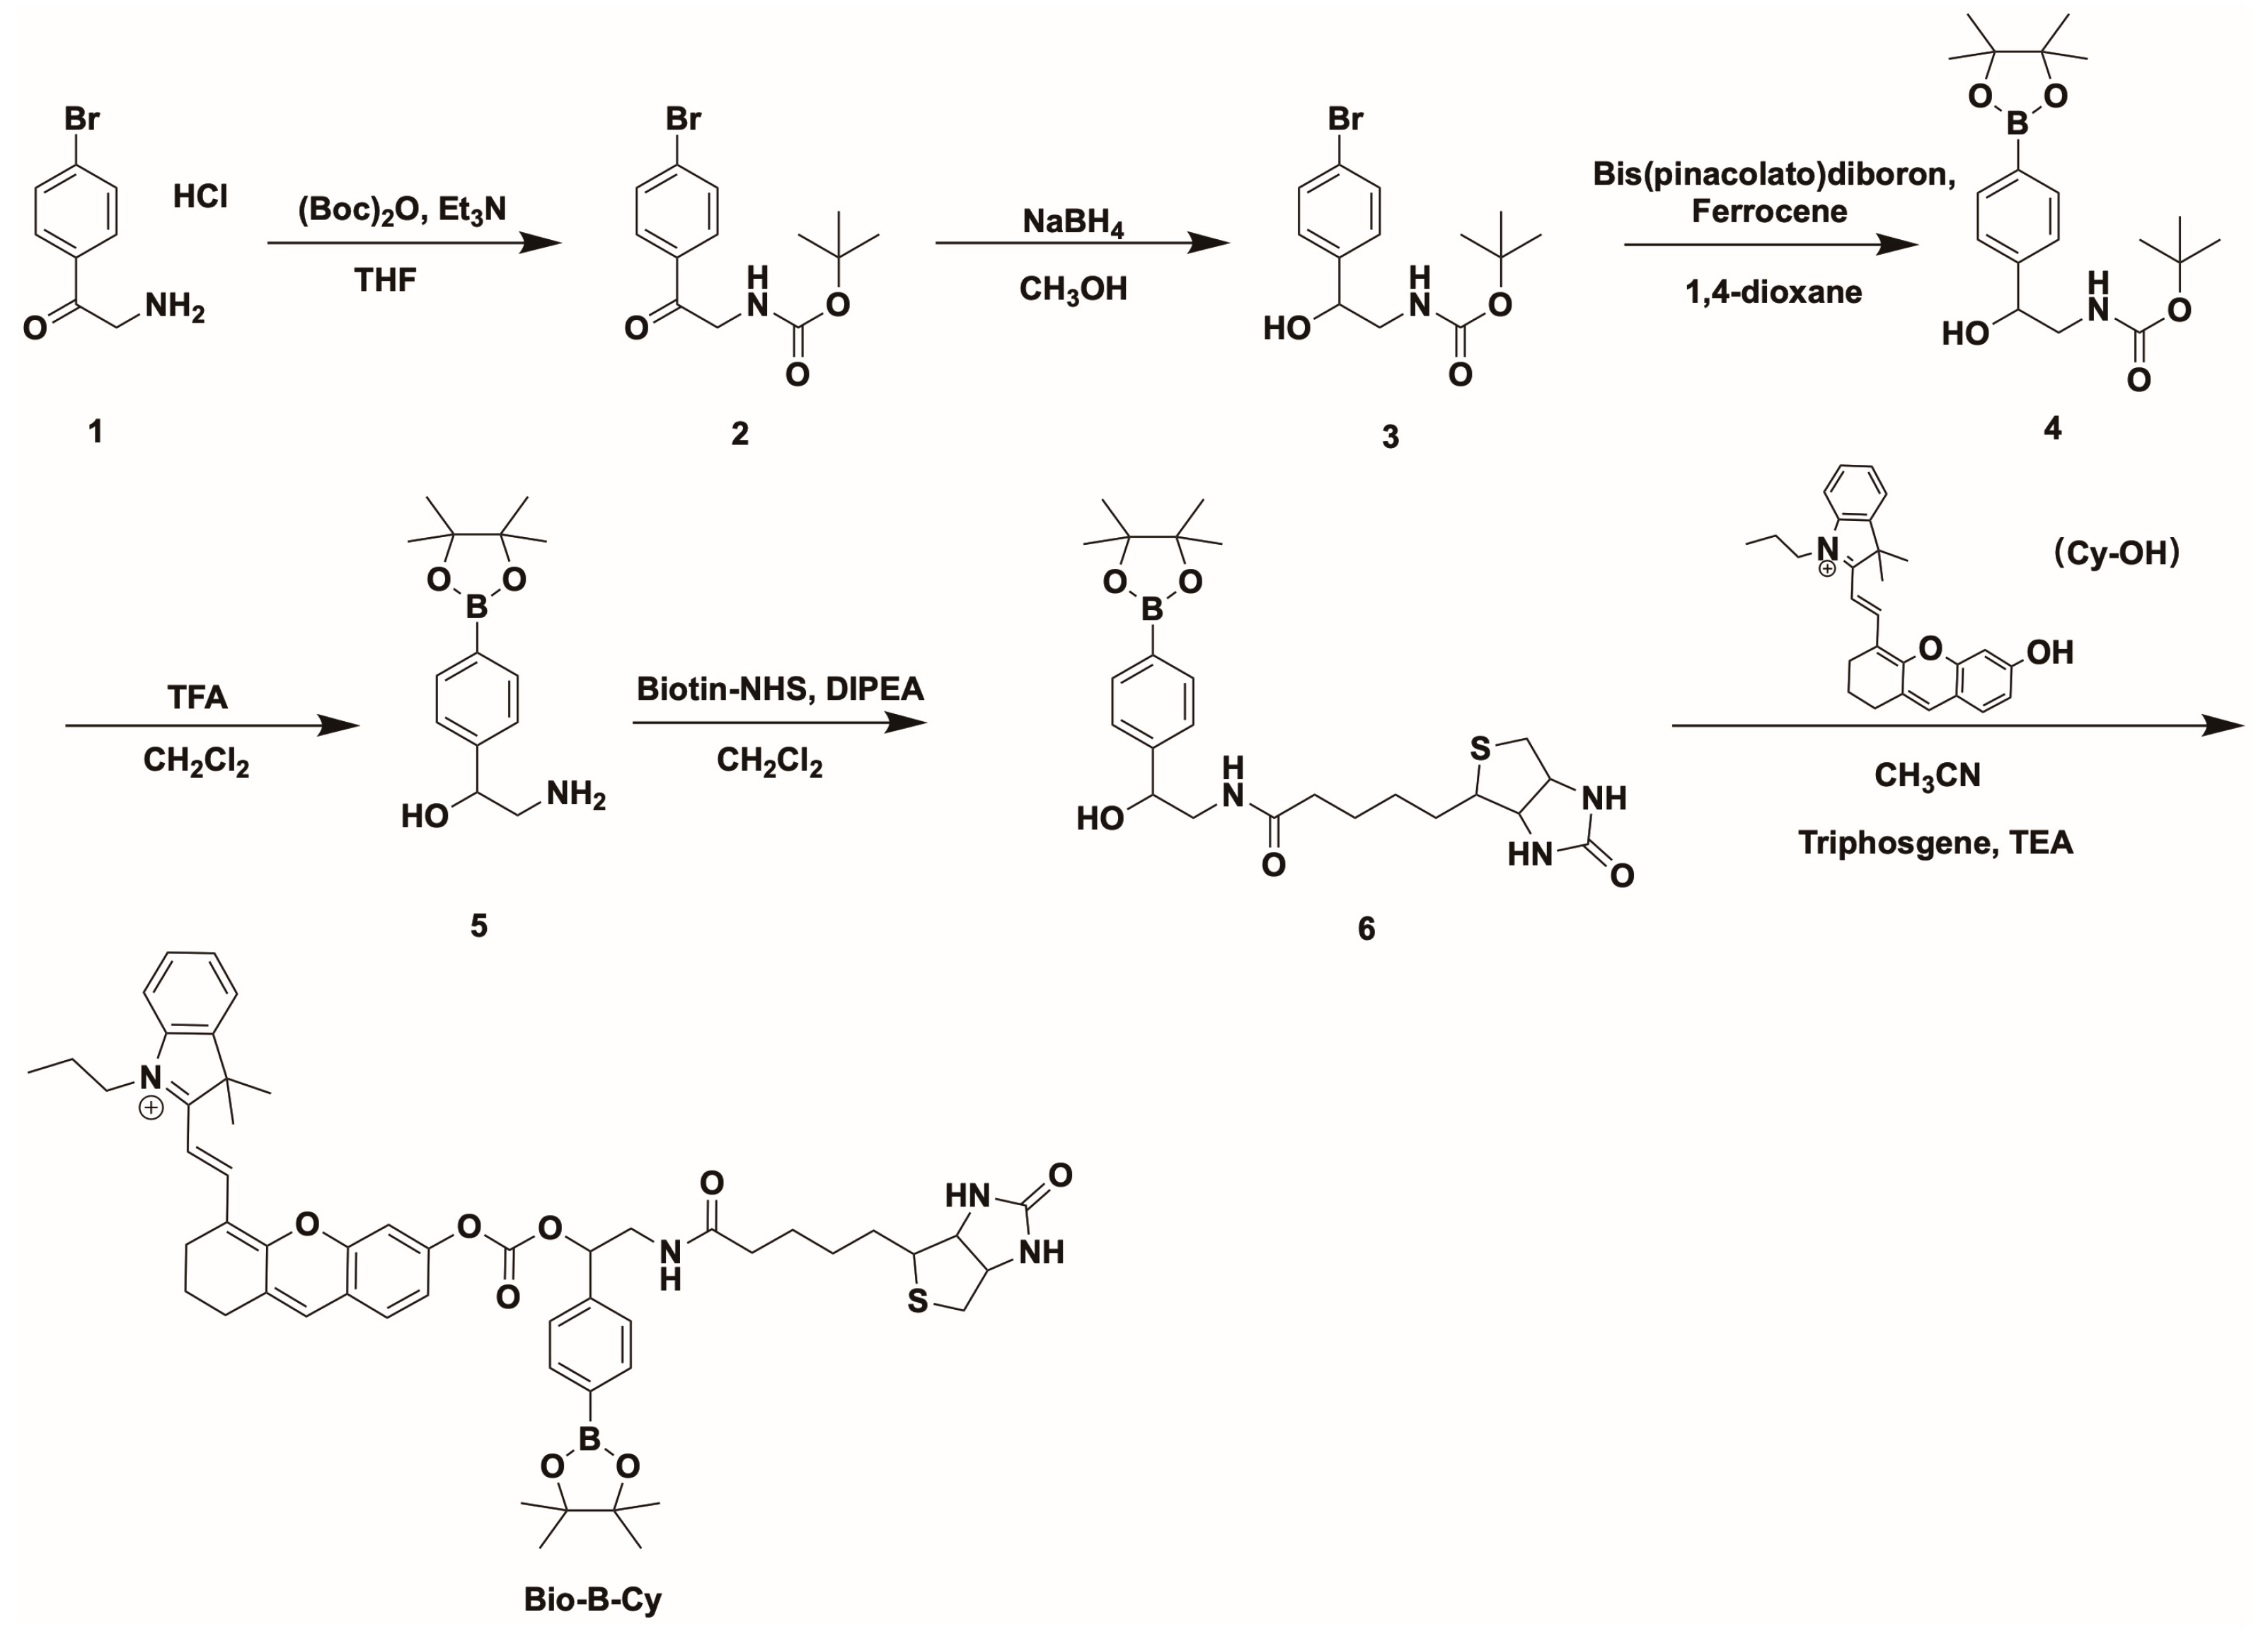
2.2. Synthesis of Bio-B-Cy

Scheme 1 illustrates the chemical structure of Bio-B-Cy and its synthesis routine. Compound 1 was treated with Di-tert-butyl decarbonate to protect the amino. Then, NaBH4 converted the carbonyl group of compound 2 to the alcohol group, which was then treated with Bis(pinacolato)diboron to obtain compound 4. The protecting group left and the amino was linked to Biotin-yielding compound 6. The NIR fluorescent substrate (Cy-OH) was synthesized according to the method reported in the literature. Subsequently, Cy-OH was conjugated with compound 6 to yield the Bio-B-Cy.

2.2.1. Synthesis of Compound Cy-OH

Resorcinol (248 mg, 2.3 mmol) and K2CO3 (311 mg, 2.3 mmol) were dissolved in 5 mL acetonitrile under an argon atmosphere. The mixture was stirred for 10 min at room temperature. IR 780 (600 mg, 0.9 mmol) was dissolved in 5 mL acetonitrile and was added to the mixture with vigorous stirring. The reaction mixture was then warmed to 50 °C and stirred for 2 h. The desired product came at methanol and dichloromethane in the volume ratio of 1:60, yielding the product as a blue solid (231 mg, 38.5%). 1H NMR (600 MHz, Chloroform-d) δ 8.66 (d, 1H), 7.53 (d, 1H), 7.47–7.42 (m, 1H), 7.38–7.32 (m,3H), 7.14 (d, 2H), 6.23 (d, 1H), 4.20 (s, 1H), 3.69 (s, 1H), 2.77 (t, 2H), 2.70 (t, 2H), 1.96 (d, 2H), 1.85 (s, 8H), 1.12 (t, 3H). HRMS (MALDI): m/z, 412.23 [M]+, calcd for C28H30NO2+, 412.23.

2.2.2. Synthesis of Compound 2

In total, 7.5 mL Triethylamine in 50 mL tetrahydrofuran (THF) was added to a THF solution (100 mL) of compound 1 (5 g, 23.3 mmol) and Di-tert-butyl decarbonate (5.6 g, 25.7 mmol) at 0 °C. The mixture was heated to 40 °C and stirred for 2 h. Reaction mixture was filtrated, and the solvent was removed under reduced pressure. In total, 200 mL ethyl acetate (EtOAc) was added to dissolve the residues. The organic solution was washed with NH4Cl aqueous solution, NaHCO3 aqueous, and brine, then dried over Na2SO4. After removal of the solvent, the residues were purified by silica gel affording compound 2 a white solid (6.6 g, yield:90%). 1H NMR (500 MHz, Chloroform-d) δ 7.92–7.86 (m, 2H), 7.44–7.37 (m, 2H), 4.02 (t, J = 8.6 Hz, 1H), 3.54 (t, J = 8.1 Hz, 1H), 1.38 (s, 9H). HRMS (MALDI): m/z, 336.02 [M + Na]+, calcd for C13H16BrNNaO3+, 336.02.

2.2.3. Synthesis of Compound 3

Compound 2 (5 g, 15.9 mmol) was dissolved in 100 mL methanol. NaBH4 (3 g, 79.3 mmol) was added to the solution and stirred for 30 min. The reaction solution was diluted with water and methanol was removed under reduced pressure. The aqueous solution was extracted with EtOAc 150 mL × 3. The organic solution was washed with brine and then dried over Na2SO4. After removal of the solvent, the residues were purified by silica gel affording compound 3 a white solid (4.6 g, yield:92%). 1H NMR (600 MHz, CDCl3) δ 7.53–7.48 (m, 2H), 7.27 (d, J = 8.5 Hz, 2H), 4.87–4.80 (m, 1H), 3.48 (d, J = 14.5 Hz, 1H), 3.24 (dd, J = 14.1, 7.8 Hz, 1H), 1.47 (s, 9H). HRMS (MALDI): m/z, 338.04 [M + Na]+, calcd for C13H18BrNNaO3+, 338.04.

2.2.4. Synthesis of Compound 4

1,4-dioxane solution of compound 3 (2 g, 9.5 mmol), Bis(pinacolato)diboron (5.6 g, 22.1 mmol), Potassium Acetate (3.3,33 mmol), Pd(dppf)Cl2·DCM (0.42 g, 0.52 mmol) was heated to 90 °C and stirred under a nitrogen atmosphere for 12 h. The reaction mixture was filtrated, and the solvent was removed under reduced pressure. In total, 200 mL ethyl acetate (EtOAc) was added to dissolve the residues, and washed by HCl (1 M), and brine, then dried over Na2SO4. After removal of the solvent, the residues were purified by silica gel affording compound 4 a white solid (2.8 g, yield:80%). 1H NMR (600 MHz, CDCl3) δ 7.83 (d, J = 7.8 Hz, 2H), 7.40 (d, J = 7.7 Hz, 2H), 4.90–4.86 (m, 1H), 3.52 (s, 1H), 3.29–3.23 (m, 1H), 1.47 (s, 9H), 1.37 (s, 12H). HRMS (MALDI): m/z, 386.21 [M + Na]+, calcd for C19H30BNNaO5+, 386.21.

2.2.5. Synthesis of Compound 6

Compound 4 (0.5 g, 1.36 mmol) was dissolved in 4 mL Methylene Chloride (CH2Cl2) and 2 mL Trifluoroacetic Acid (TFA). After stirring for 12 h, the solvent was removed under reduced pressure and the residues were dissolved in CH2Cl2. In total, 3 mL Triethylamine and Biotin-NHS ester (0.75 g, 2.20 mmol) were added to the solution and stirred for 24 h. The reaction mixture was filtrated, and the solvent was removed under reduced pressure. In total, 200 mL CH2Cl2 was added to dissolve the residues, washed with HCl (1 M) and brine and then dried over Na2SO4. After removal of the solvent, the residues were purified by silica gel affording compound 6 a yellow solid (2.7 g, yield:40%). 1H NMR (600 MHz, DMSO-d6) δ 7.55–7.48 (m, 2H), 7.35–7.30 (m, 2H), 4.66 (dd, J = 9.0, 3.5 Hz, 1H), 4.31 (dd, J = 7.7, 5.1 Hz, 1H), 4.13 (ddd, J = 7.5, 4.4, 1.7 Hz, 1H), 3.10 (ddd, J = 8.6, 6.2, 4.4 Hz, 1H), 2.84 (ddd, J = 25.9, 12.7, 4.4 Hz, 2H), 2.66 (dd, J = 12.8, 9.0 Hz, 1H), 2.58 (d, J = 12.4 Hz, 1H), 2.11 (t, J = 7.4 Hz, 2H), 1.62 (ddt, J = 12.2, 9.8, 6.2 Hz, 1H), 1.52–1.44 (m, 3H), 1.33 (dq, J = 9.5, 7.1 Hz, 2H), 1.17 (s, 12H). 13C NMR (151 MHz, DMSO-d6) δ 176.48, 163.27, 142.87, 131.47, 128.64, 120.68, 83.30, 70.58, 61.56, 59.70, 55.94, 47.48, 35.60, 28.80, 28.54, 25.64, 25.30. HRMS (ESI): m/z, 490.27 [M + H]+, calcd for C24H37BN3O5S+, 490.25.

2.2.6. Synthesis of Compound Bio-B-Cy

Compound Cy-OH (50 mg, 0.125 mmol) and DIPEA (43.1 μL, 0.24 mmol) were dissolved in 10 mL acetone. Bis(trichloromethyl) carbonate (80 mg, 0.155 mmol) was added to the solution under an ice bath. After stirring for 4 h under an ice bath, 10 mL acetone of compound 6 (195 mg, 0.275 mmol) was added to the solution and stirred for 24 h under room temperature. The reaction mixture was filtrated, and the solvent was removed under reduced pressure. In total, 200 mL CH2Cl2 was added to dissolve the residues, and washed by HCl (1 M), and brine, then dried over Na2SO4. After removal of the solvent, the residues were purified by silica gel affording compound 6 a purple solid (34.7 mg, yield:30%). 1H NMR (600 MHz, DMSO-d6) δ 7.60 (s, 1H), 7.55 (dd, J = 23.5, 7.8 Hz, 4H), 7.44–7.28 (m, 6H), 7.25–7.08 (m, 3H), 6.70–6.62 (m, 1H), 6.50 (d, J = 16.2 Hz, 2H), 6.44 (s, 1H), 6.27–6.19 (m, 1H), 6.06 (d, J = 14.1 Hz, 1H), 4.33 (dd, J = 7.8, 5.0 Hz, 1H), 4.18–4.13 (m, 2H), 4.07 (d, J = 7.2 Hz, 1H), 3.12 (dd, J = 8.9, 4.8 Hz, 2H), 3.04 (dd, J = 12.8, 3.3 Hz, 1H), 2.87–2.81 (m, 2H), 2.63 (dd, J = 23.2, 15.2 Hz, 4H), 2.19 (t, J = 7.4 Hz, 2H), 1.83–1.76 (m, 2H), 1.65 (d, J = 16.0 Hz, 6H), 1.58–1.47 (m, 6H), 1.34 (t, J = 7.9 Hz, 3H), 1.17 (s, 15H). 13C NMR (151 MHz, DMSO-d6) δ 175.08, 163.29, 158.93, 141.73, 131.68, 131.31, 130.09, 128.90, 128.72, 128.42, 128.09, 122.87, 121.98, 121.23, 106.66, 102.99, 81.81, 78.68, 72.71, 69.05, 61.57, 59.71, 55.88, 45.95, 45.20, 43.30, 34.15, 29.71, 28.62, 28.53, 28.39, 25.53, 25.41, 25.08, 24.95, 19.63, 11.85, 11.64. HRMS (MALDI): m/z, 927.63 [M]+, calcd for C53H64BN4O8S+, 927.45.

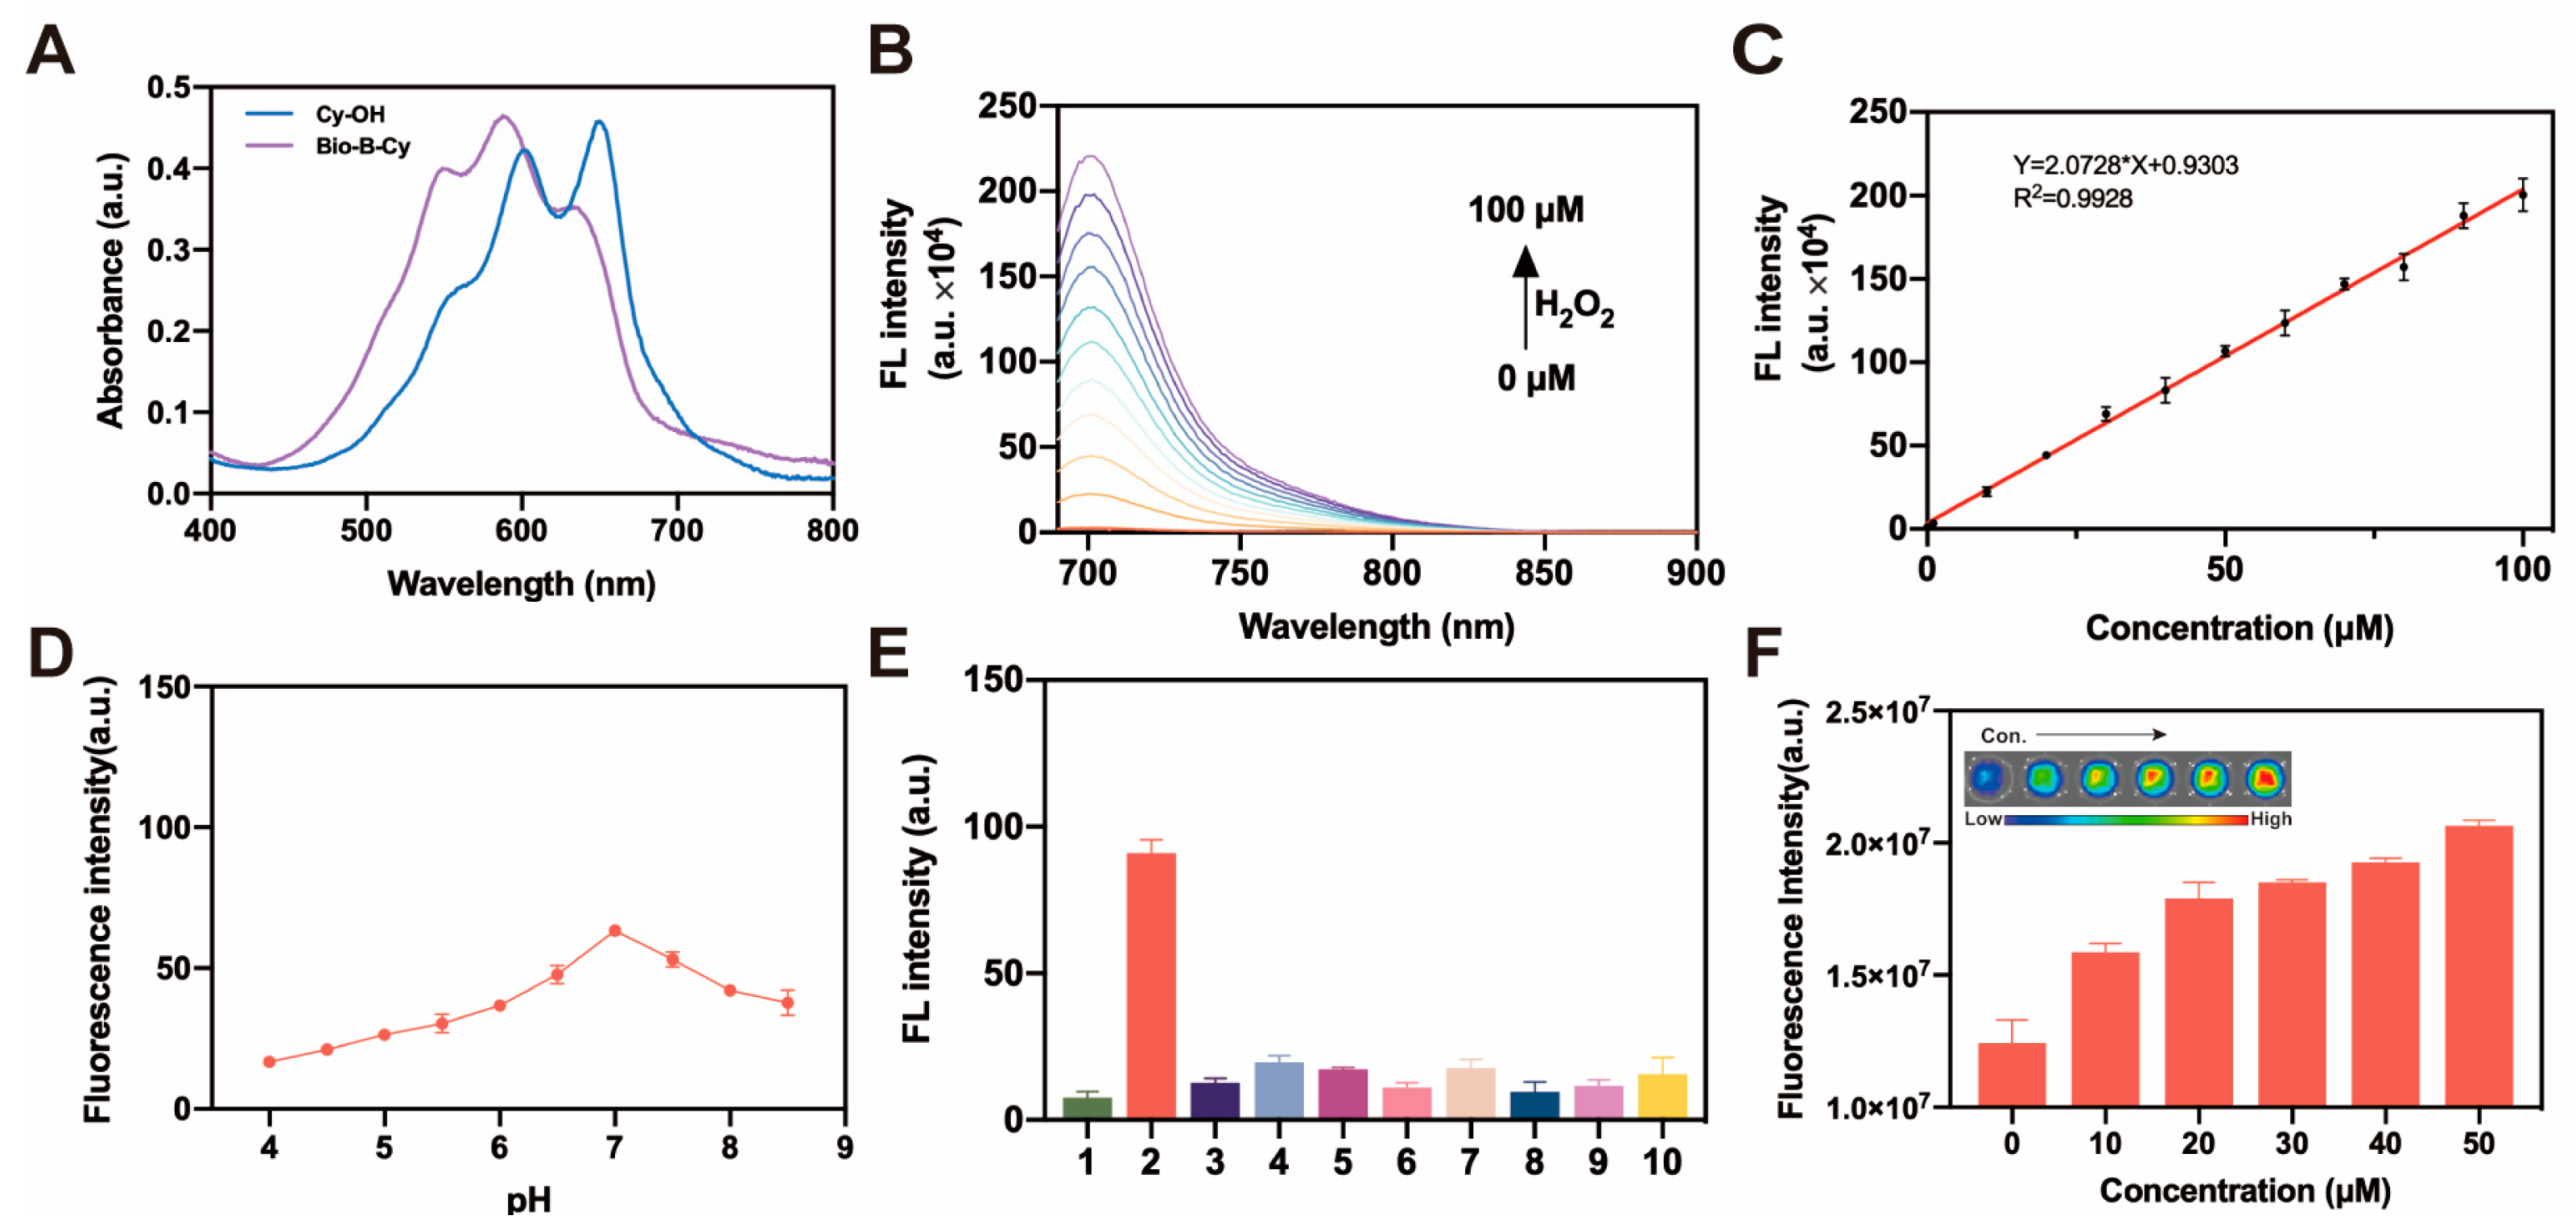
2.3. Fluorescence Response of Bio-B-Cy Toward H2O2

Bio-B-Cy was dissolved in DMSO to make a 5 mM stock solution. For fluorescence measurements, H2O2 with different concentrations was added into 2 mL PBS buffer solution containing 10 μM Bio-B-Cy. The mixture solution was incubated at 37 °C for 30 min. The fluorescence signal was recorded with the excitation at 680 nm and the emission at 700–710 nm. The slit was 5 nm.

2.4. The Selectivity of Bio-B-Cy Toward H2O2

For fluorescence measurements, 10 μM Bio-B-Cy was incubated with PBS buffer (blank), other ROS (O2, ClO, 1O2, ·OH, TBHP, ⋅NO, ONOO, ⋅OtBu) and H2O2, respectively. The mixture solution was incubated at 37 °C for 20 min. The fluorescence signal was recorded with the excitation at 680 nm and the emission at 700–710 nm. The slit was 5 nm.

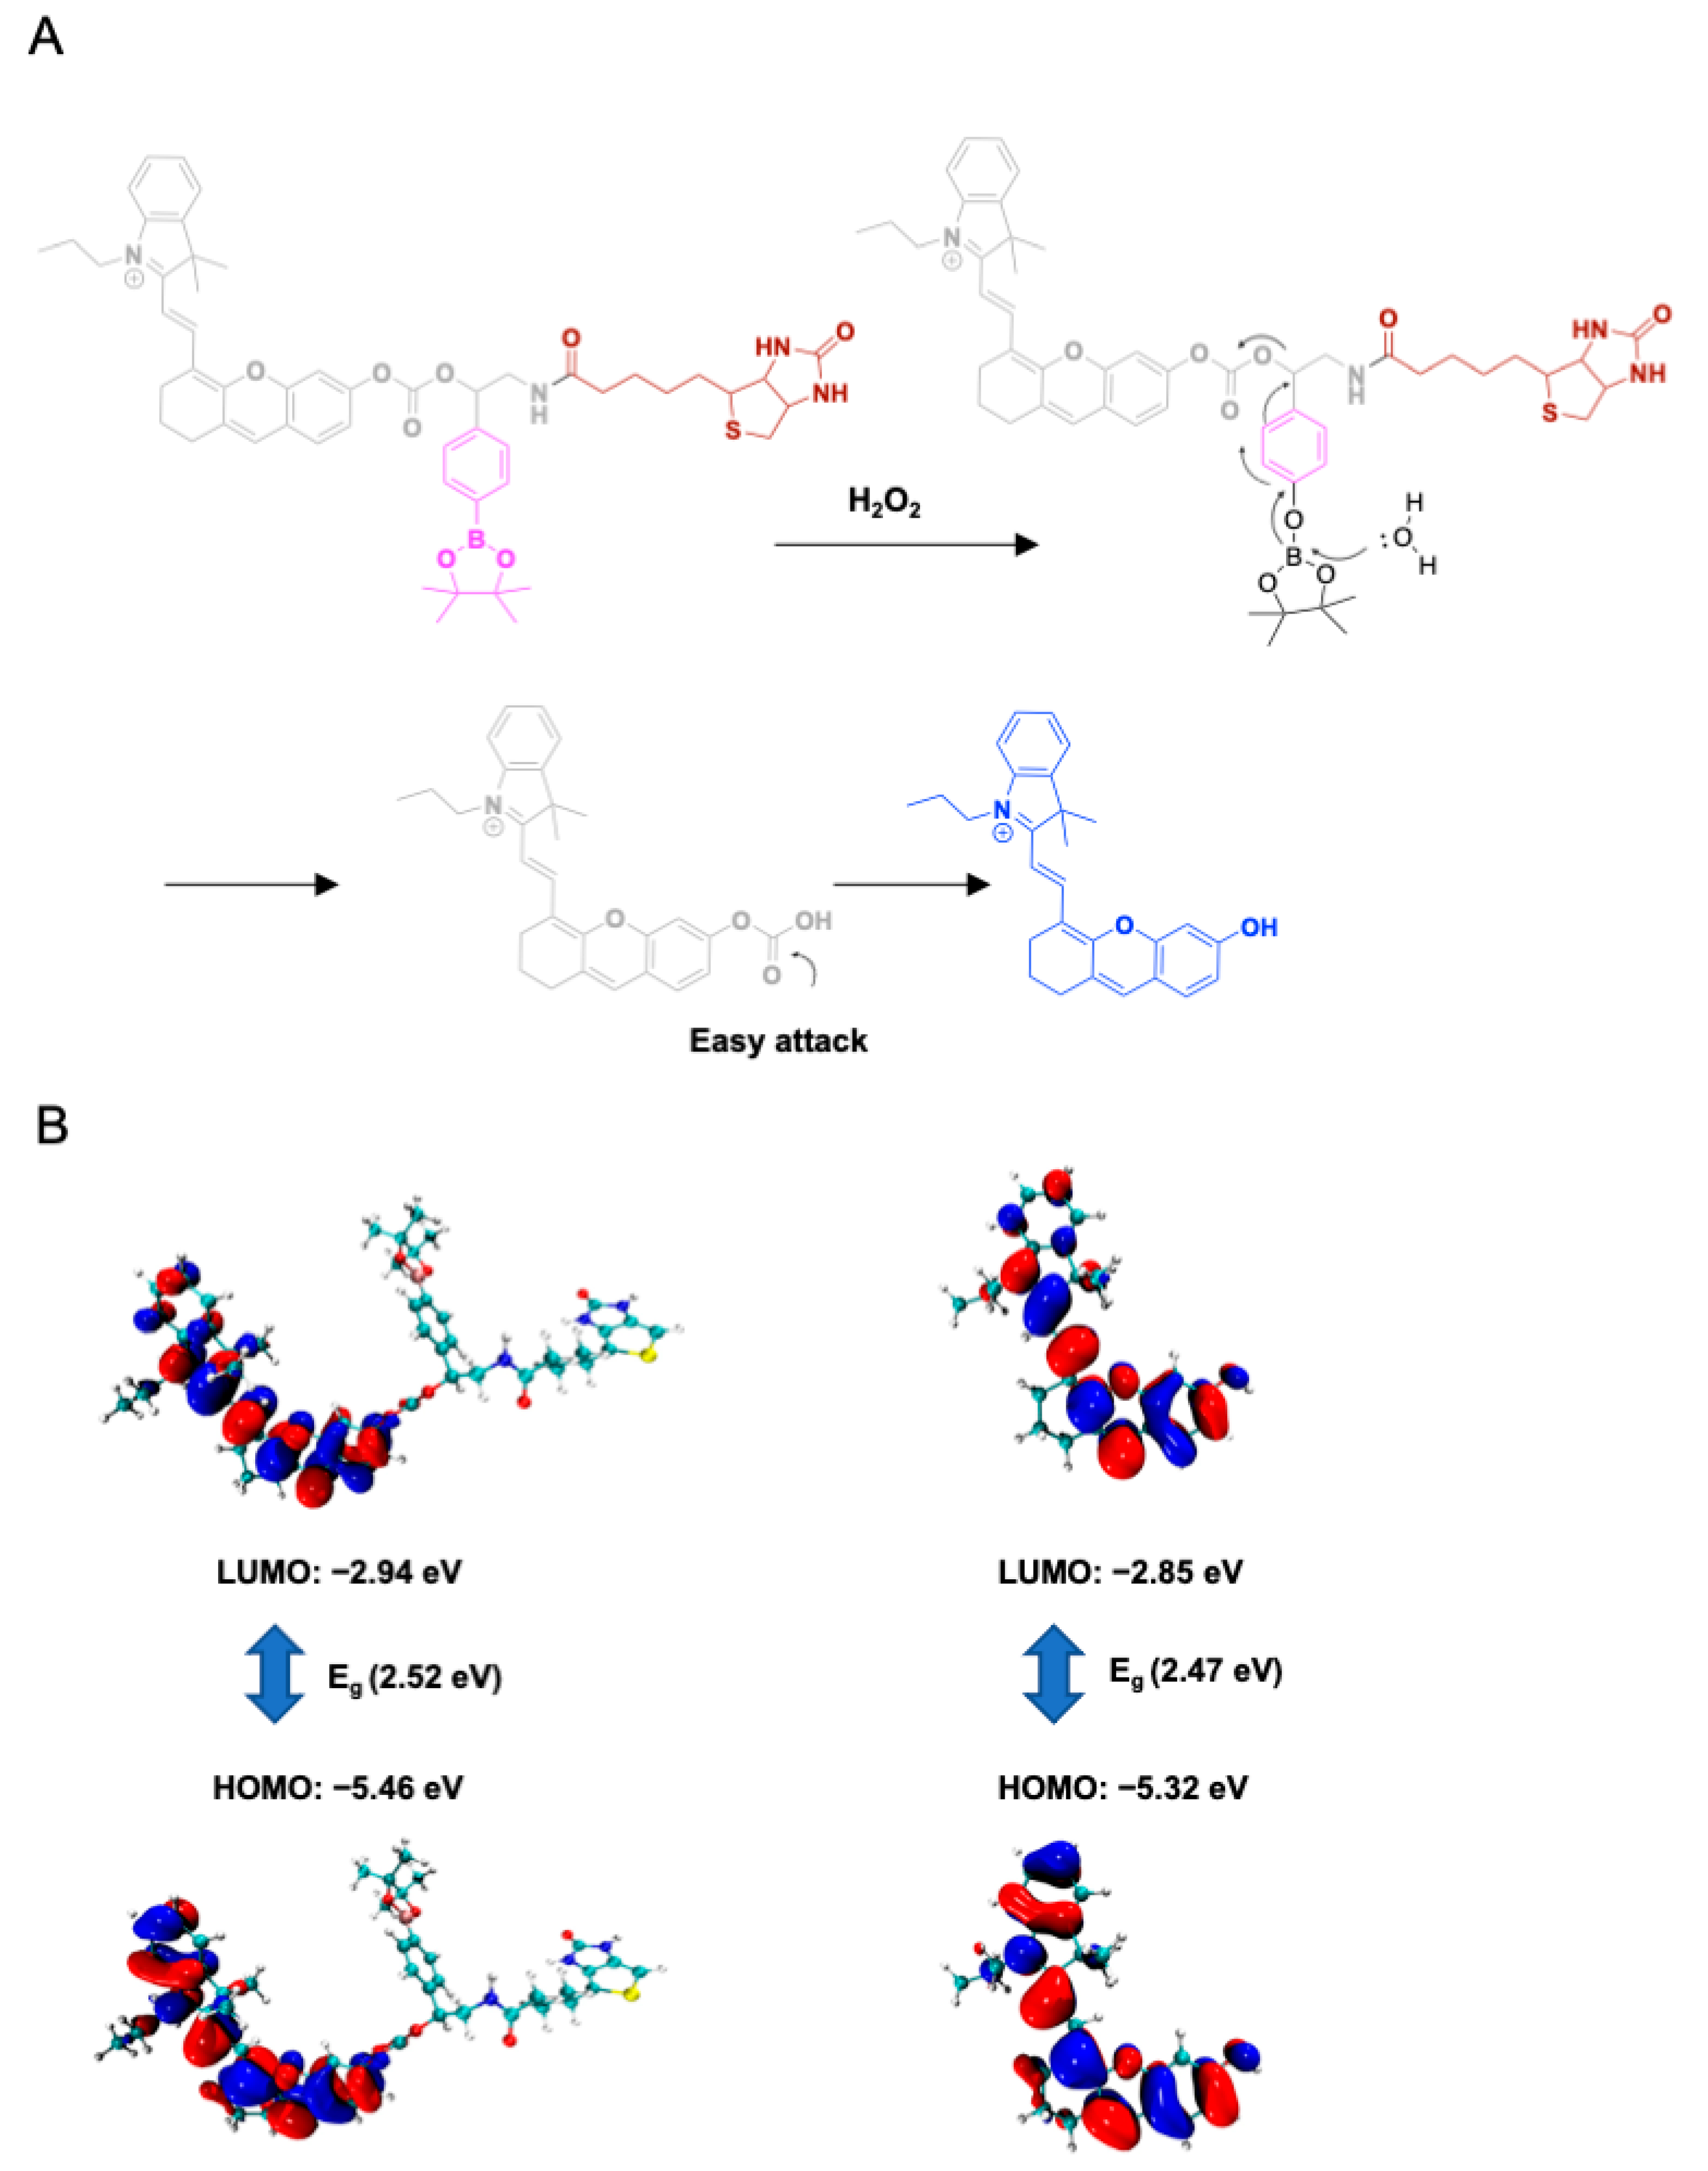
2.5. Theoretical Calculations

Density functional theory (DFT) calculations were used to understand the electronic excitation and photophysical properties of Bio-B-Cy and Cy-OH. Geometry optimizations on the ground were carried out with the B3LYP function in combination with the 6-31G(d) basis set. All calculations were carried out with Gaussian 16 W.

2.6. Cell Viability

The 4T1 cells and L929 cells were seeded at a density of 1 × 10⁴/well in 96 wells and grown overnight at 37 °C. The next day, the cells were incubated with different concentrations of Bio-B-Cy for 24 h. The viability of cells was evaluated by the CCK 8 kit.

2.7. Flow Cytometric Analyses

4T1 cells and L929 cells were seeded in six-well plates at a density of 2 × 10⁶ cells/well and cultured overnight at 37 °C. After 24 h of incubation, the cells were treated with 10 μM Bio-B-Cy. Following incubation, cells were harvested by scraping, resuspended in PBS, and transferred to flow cytometry tubes. Cellular analysis was performed using a flow cytometer with red RL2 fluorescence detection parameters (excitation: 680 nm, emission: 720/30 nm). A minimum of 10,000 cells were analyzed for each sample. All experiments were conducted three times.

2.8. In Vitro Cell Imaging

4T1 cells and L929 cells were plated on glass-bottomed dishes at a density of 2 × 10⁶ cells, respectively, and grown overnight. The next day, the cells were incubated with 10 μM Bio-B-Cy in 30 min. The cells were washed with PBS three times after incubation. Then, the cells were incubated with calcein-AM for 30 min to confirm the cell viability. Fluorescence images were acquired from CLSM using a 680 nm laser and a 707 nm emission filter.

2.9. In Vivo Animal Imaging

Four-week-old female BALB/C mice were subcutaneously injected with 4T1 cells (5 × 10⁵ cells/mouse) to establish a tumor model. The mice were used before the tumor grew to 10 mm in average diameter. The mice were separated into two groups. Bio-B-Cy: the mice were injected intravenously with 100 μL saline containing 500 μM Bio-B-Cy. B-Cy: the mice were injected intravenously with 100 μL saline containing 500 μM B-Cy. After intravenous injection, in vivo, fluorescence images were acquired at 1, 2, 4, and 8 h using an optical system with the excitation at 680 nm and the emission at 707 nm. The mice were sacrificed at 4 h after the injection and the fluorescence images of tumors and major organs were recorded with the excitation at 680 nm and the emission at 707 nm.

3. Results

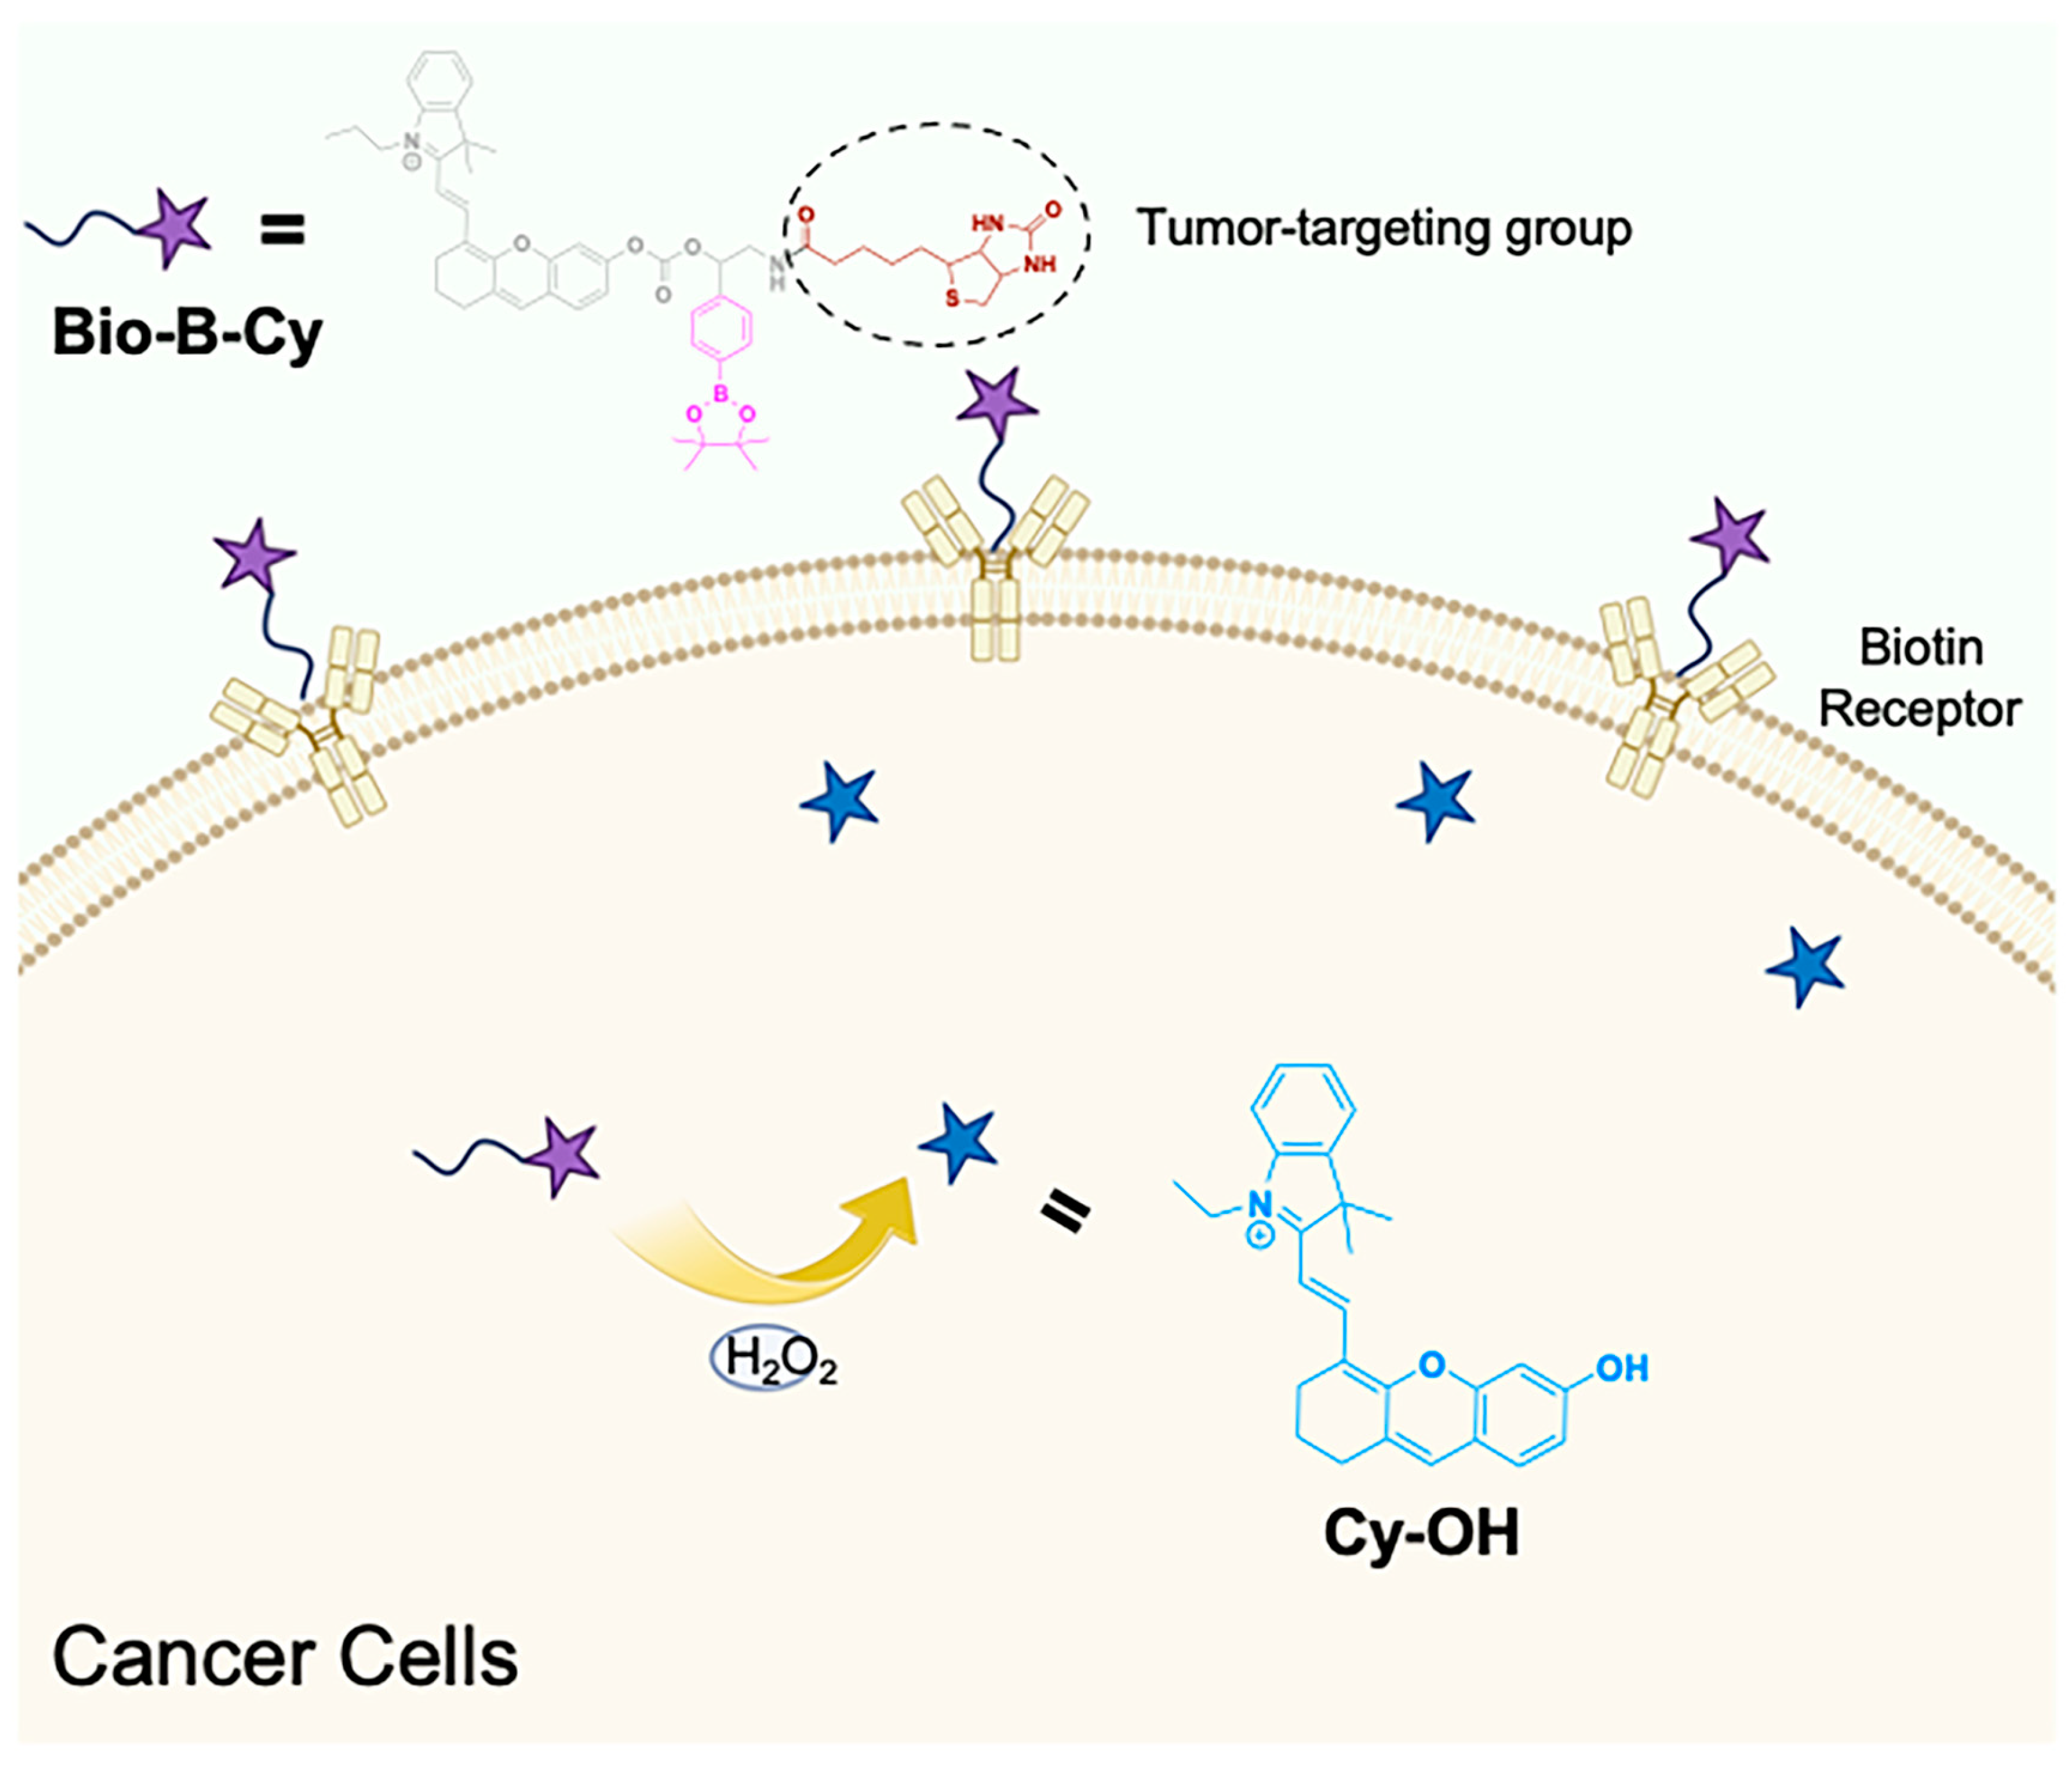
3.1. Design and Synthesis of Bio-B-Cy

To enable reliable detection of the H2O2 produced from cancer cells, it is required that the probe should own a rapid response toward H2O2 associated with great tumor-targeting ability. The H2O2-activatable NIR probe Bio-B-Cy is designed to be composed of an NIR fluorescent substrate (Cy-OH), a H2O2-sensitive unit (Boronic acid ester), and a tumor-targeting group (biotin). Cy-OH is used because it showed strong fluorescence at 707 nm, which ensures great tissue penetration, allowing the application of Bio-B-Cy in vivo [26]. Considering the diffusion of H2O2 in tumor cells, we choose Boronic acid ester as the detection group, which exhibits fast oxidation kinetic towards H2O2 [29,30]. The Boronic acid ester is linked to the NIR fluorescent substrate via a carbamate bond, resulting in the quenching of the fluorescence. Different from normal cells, cancer cells overexpress different kinds of proteins on the surface. As reported, some types of tumor cells overexpressed biotin receptors [22,31]. Bio-B-Cy could immediately target tumor cells with the advantage of conjunction with Biotin. Figure 1 illustrates the general mechanism for NIR FL of the H2O2 in the tumor site. After intravenously injected into 4T1-bearing mice, Bio-B-Cy moved towards tumor cells with the help of biotin and quickly responded to H2O2 overexpressed by tumor cells, simultaneously turning on NIR FL signals, while the probe without biotin showed weaker NIR FL. Therefore, Bio-B-Cy was capable of tumor diagnosis via sensitive NIR FL of H2O2 in the tumor site. Scheme 1 showed the synthesis routine of Bio-B-Cy and the characterization (1H NMR, HRMS and 13C NMR) of the probe Bio-B-Cy was presented in the Supporting Information (Figures S1–S14).

3.2. Photophysical Properties of Bio-B-Cy

We performed a spectral study in solutions to evaluate the sensitivity of Bio-B-Cy for H2O2 detection. First, we tested whether Bio-B-Cy could quickly react with H2O2 to recover fluorescence. As shown in Figure S15, there were no fluorescence emissions when Bio-B-Cy did not react with H2O2. We added 50 μM H2O2 to 10 μM Bio-B-Cy in PBS, which led to the increase in emission intensity at 707 nm in 20 min, indicating that boronic acid ester reacted with H2O2 and recovered the fluorescence from the NIR dye efficiently. As depicted in Figure 2A, Bio-B-Cy has a maximum absorption wavelength of 544 nm. Upon the addition of H2O2, the maximum absorption wavelength performed a red shift from 544 nm to 680 nm. The color of the solution changed from purple to blue. Next, we evaluated the correlation between the concentration of H2O2 and Bio-B-Cy. After incubation with H2O2 from 0 μM to 100 μM for 30 min, a strong fluorescence peak at 707 nm appeared, and the fluorescence intensity increased with the increasing concentrations of H2O2 (Figure 2B). In addition, when the concentration of H2O2 was 0–100 μM, the fluorescence intensity at 707 nm showed a linear relationship with the concentration of H2O2 (Figure 2C). Based on a regression analysis, the detection limit of Bio-B-Cy was found to be 0.14 μM. These results indicated that Bio-B-Cy could be used for the quantitative determination of H2O2 in PBS.
The reaction of Bio-B-Cy and H2O2 in serum was also investigated. As depicted in Figure S16, after reacting with H2O2, fluorescence intensity at 707 nm increased with increasing concentration of H2O2. This was consistent with the Bio-B-Cy in PBS. The results represented that Bio-B-Cy can sensitively respond to H2O2 with the change in fluorescence intensity. Second, we tested the reaction of Bio-B-Cy toward H2O2 at different pH. As shown in Figure 2D, Bio-B-Cy performed the maximal fluorescence intensity at pH 7. Meanwhile, to verify the selectivity of Bio-B-Cy toward H2O2, we also tested the fluorescence response of Bio-B-Cy to other ROS including O2, ClO, 1O2, ·OH, TBHP, ⋅NO, ONOO, ⋅OtBu. There was no obvious fluorescence change at 707 nm after incubating with other ROS. This result suggested that the influence of other ROS on the fluorescence spectrum was negligible (Figure 2E). The equilibrium of fluorescence intensity was reached within 20 min with the addition of H2O2 at 37 °C (Figure S17). The fluorescence intensity of Bio-B-Cy stayed stable in PBS over 4 h (Figure S18). The fluorescence imaging of the Bio-B-Cy (10 μM) with varying concentrations of H2O2 (0, 10, 20, 30, 40, and 50 μM) was also investigated (Figure 2F), which was consistent with the spectral study. These results indicated that Bio-B-Cy was suitable for the selective detection of H2O2 in biological systems.

3.3. Mechanism Study

Based on the spectral results, the proposed mechanism is shown in Figure 3A. The H2O2 oxidized the p-(Boronic acid ester) benzyl group and induced the subsequent 1,4-elimination reaction, resulting in a self-cleavage of the linker to release Cy-OH. The released Cy-OH showed fluorescence emission at 707 nm. To confirm the presumption, the reaction of Bio-B-Cy and H2O2 was carried out and analyzed by HPLC. As depicted in Figure S19, the peak of Bio-B-Cy disappeared after incubation with H2O2 for 20 min at 37 °C, and the peak of the main product appeared at the same retention time as Cy-OH. Furthermore, density functional theory (DFT) calculations were performed to analyze the optical properties of Bio-B-Cy. All calculations of DFT were performed by using Gaussian 16. B3LYP with the 6-31G(d) level of DFT was used for estimating the molecular orbitals (highest occupied molecular orbital (HOMO) and the lowest unoccupied molecular orbital (LUMO)). Frontier molecular orbitals diagrams and data on energy levels are given in Figure 3B. The computed energy gap between HOMO and LUMO between Bio-B-Cy and Cy-OH were 2.52 and 2.47 eV, respectively, which show the red shift of the absorption. Notably, previous reports showed that a red-shift of absorption appeared due to reducing the energy gap Eg (Eg = ELUMO − EHOMO) [32]. The above result confirmed the generation of Cy-OH.

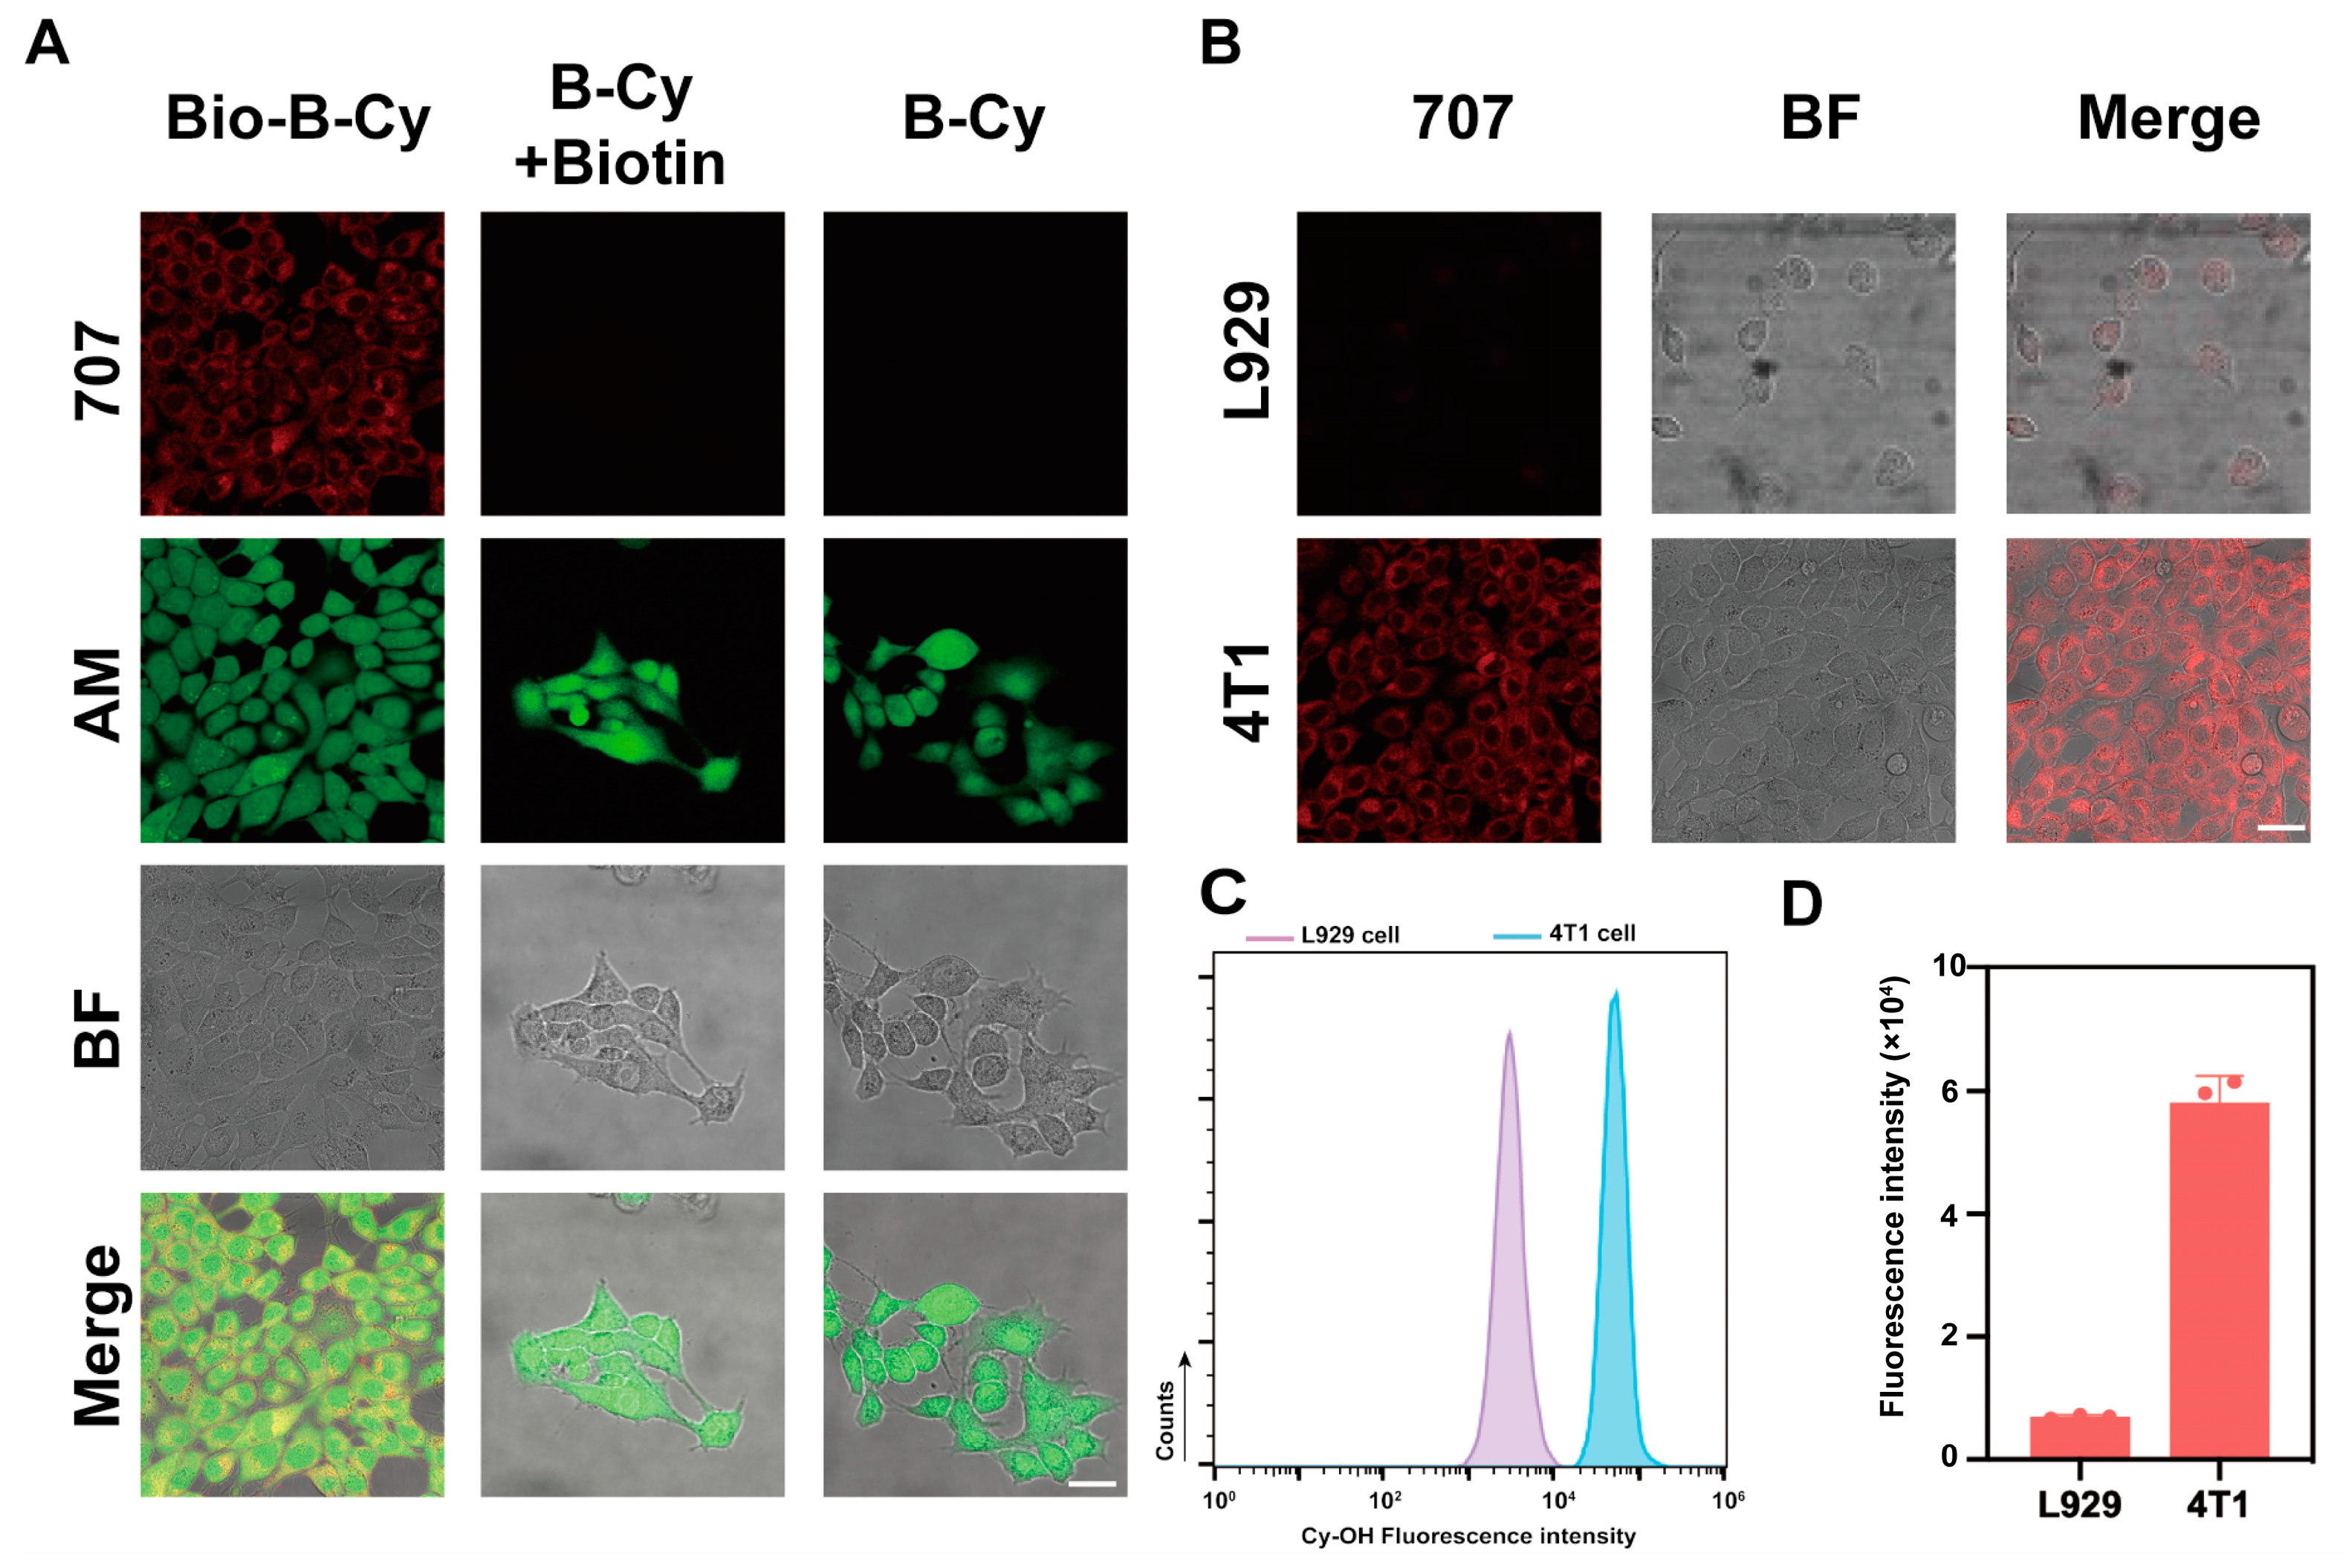
3.4. In Vitro Probe Activation and Imaging of 4T1 Cells

Encouraged by the good sensitivity and selectivity of Bio-B-Cy toward H2O2 in PBS, we applied the Bio-B-Cy to H2O2 imaging in living cells. We chose biotin receptor-positive 4T1 cells [33,34] and biotin receptor-negative L929 mouse fibroblast cells to explore the detecting ability of the probe Bio-B-Cy to H2O2 secreted from cancer cells. Before the bioimaging application, the cytotoxicity of Bio-B-Cy was evaluated by a CCK 8 kit. Cytotoxicity was an important issue of whether Bio-B-Cy could be applied in vivo. After incubation with 0–50 μM Bio-B-Cy for 24 h, the viabilities of 4T1 and L929 cells were above 90%, which meant Bio-B-Cy was low cytotoxicity and biocompatibility (Figure S20).
Then, we chose 4T1 cells as a cancer cell model to explore the targeting ability of Bio-B-Cy to biotin receptor-positive cancer cells. 4T1 cells were treated with Bio-B-Cy, B-Cy, B-Cy+biotin, respectively, and fluorescence images of cells were acquired. As depicted in Figure 4A, each group showed red fluorescence, but the fluorescence intensity of the Bio-B-Cy group was the greatest. This was because the biotin of Bio-B-Cy helped the probe enter cells via biotin overexpressed on the surface of cancer cells, which increased the uptake rate of the Bio-B-Cy. The fluorescence intensity of the B-Cy+Biotin group was similar to the B-Cy group, just showing a weak red fluorescence. Meanwhile, we have also stained the cells of calcein-AM to ensure the viability of 4T1 cells after incubating with probes. As shown in Figure 4A, 4T1 cells treated with different groups exhibited great cell viability after incubation, which was consistent with the results of CCK8. This phenomenon indicated free biotin cannot increase the uptake rate of the probe. Based on the results obtained, it can be summarized that Bio-B-Cy can target biotin receptor-positive cancer cells.
We also explored the detecting ability of Bio-B-Cy to cellular H2O2. 4T1 cells and L929 cells were incubated with Bio-B-Cy for 30 min at 37 °C. As illustrated in Figure 4B, because of the low concentration of intracellular H2O2, L929 cells showed only weak fluorescence at 707 nm. In contrast, the fluorescence increased significantly in 4T1 cells, indicating the detection of cellular H2O2. To quantitatively examine whether Bio-B-Cy could respond towards H2O2, flow cytometric analysis was performed. The Bio-B-Cy showed greater fluorescence in 4T1 cells than in L929 cells, which was consistent with LSCM (Figure 4C). The results indicated that Bio-B-Cy could quickly respond to cellular H2O2 and it was suitable for the detection of tumor cells.

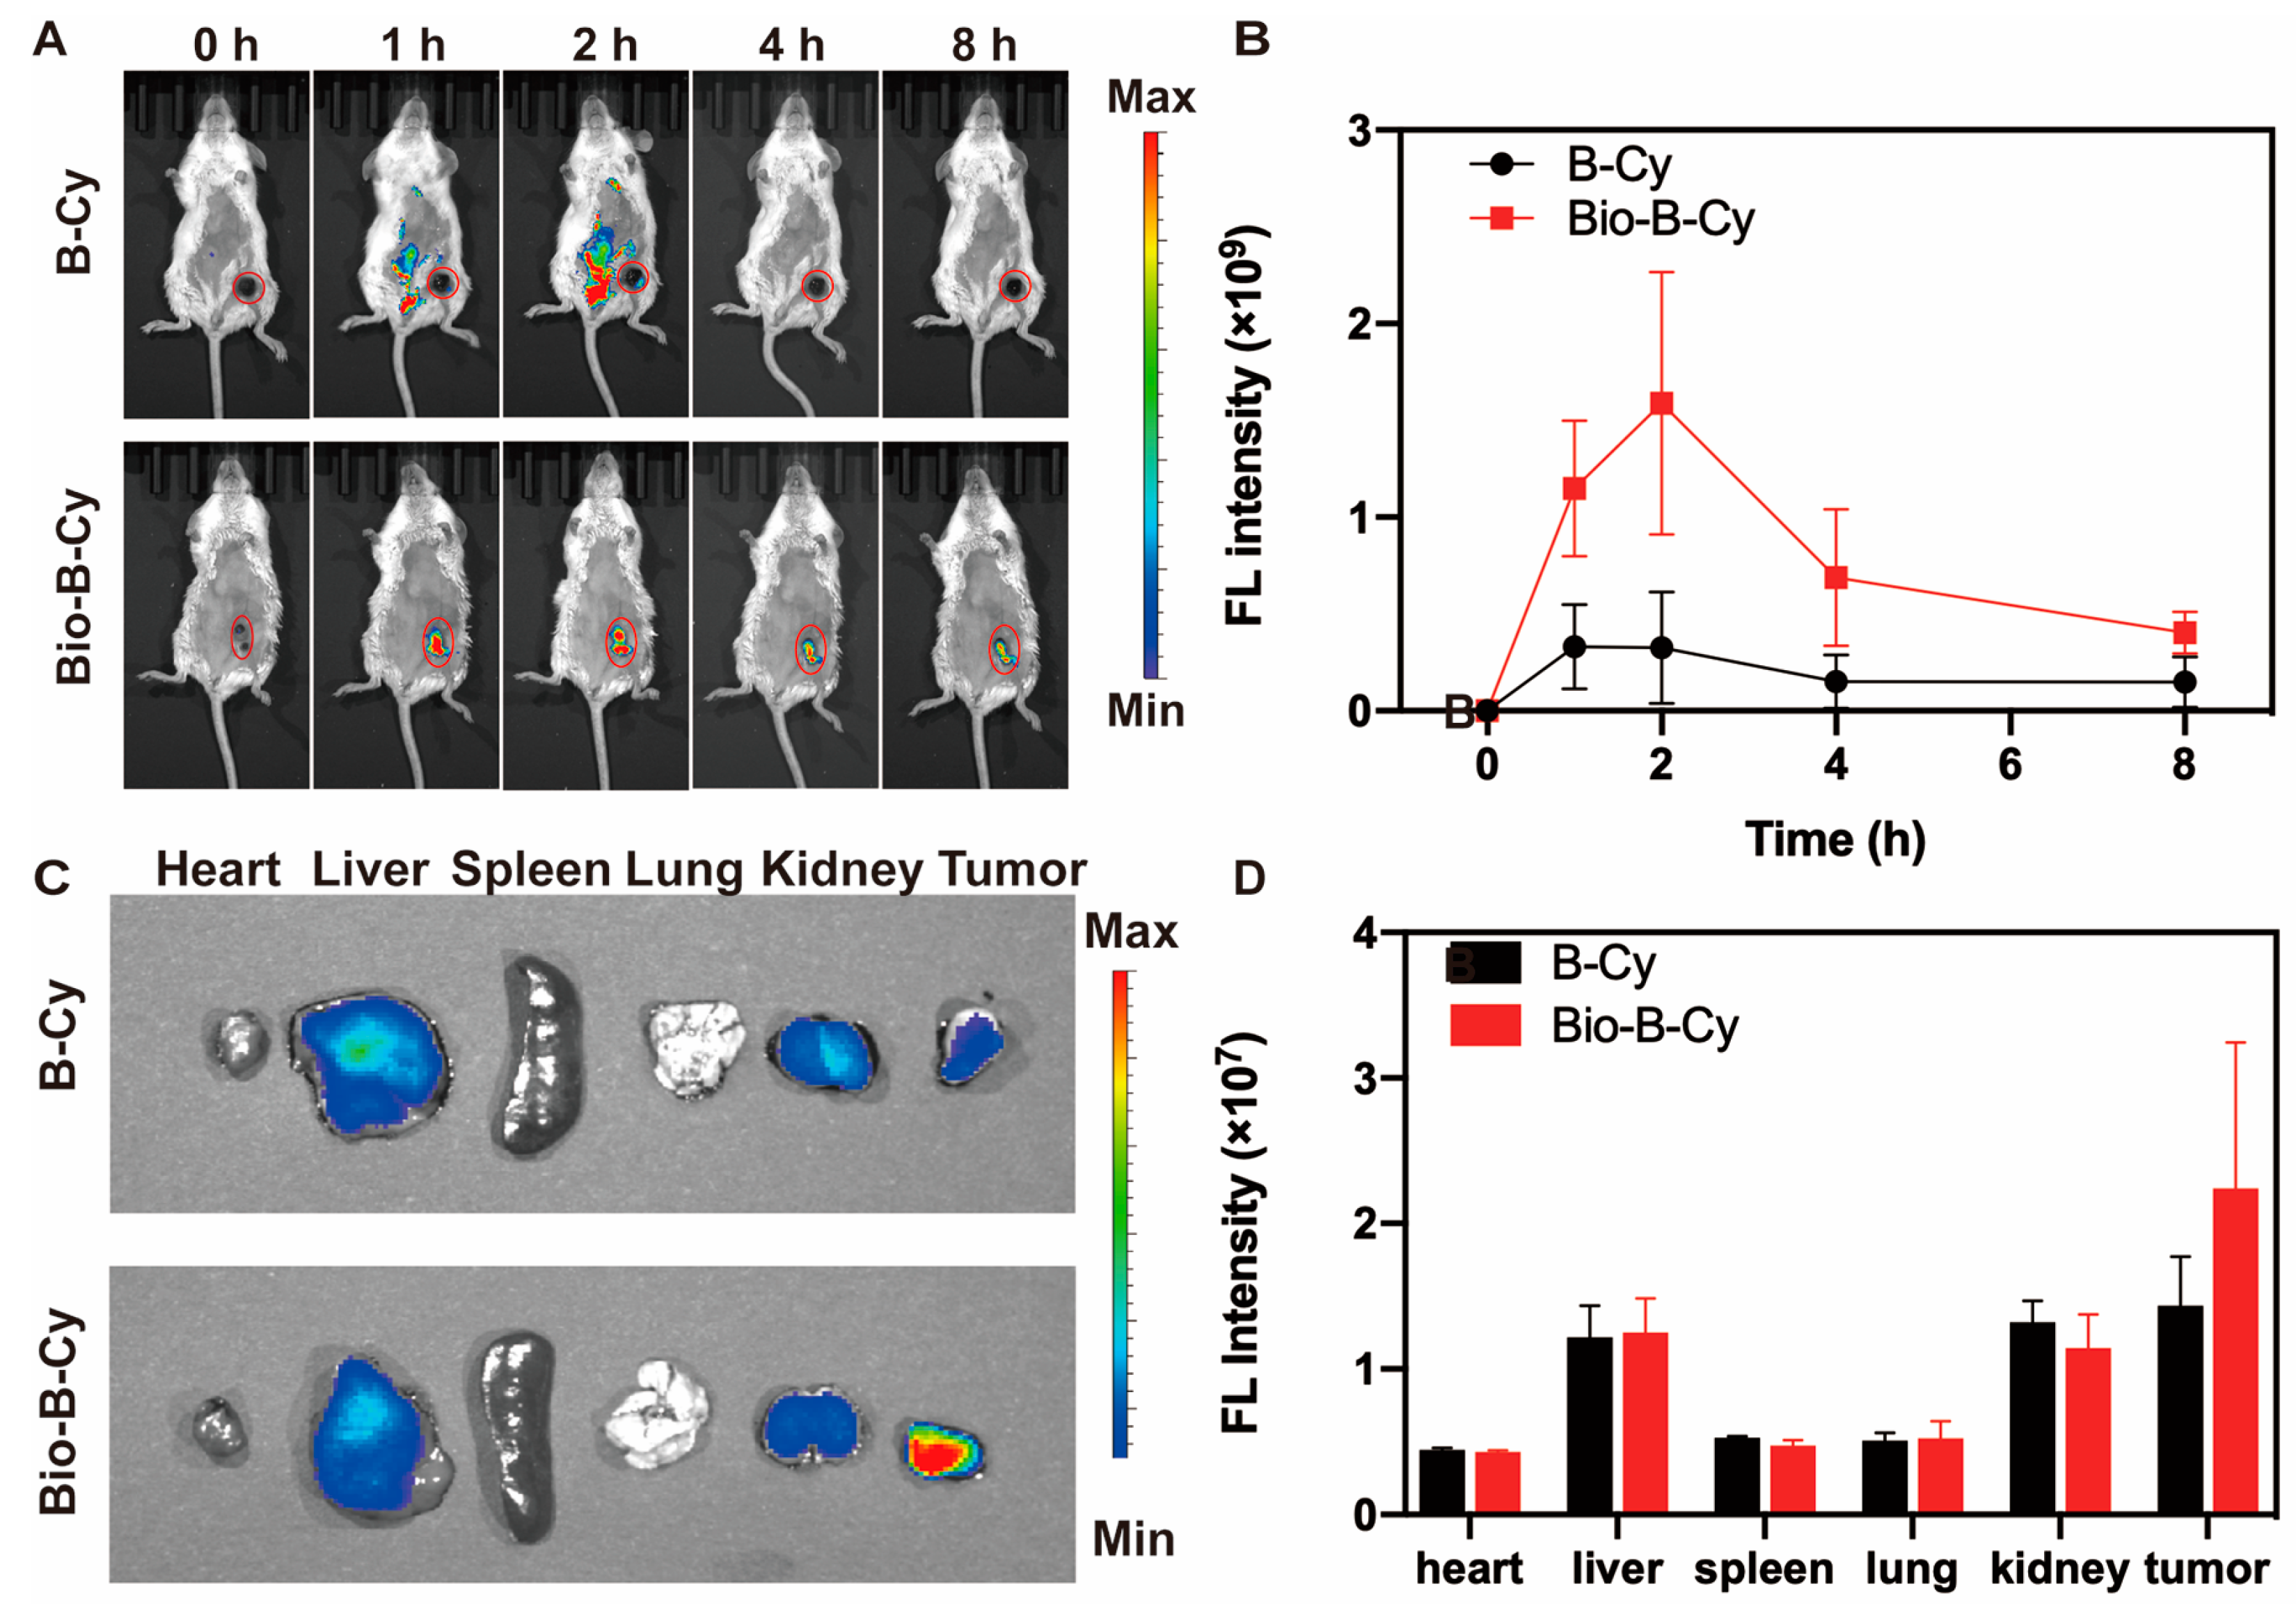
3.5. In Vivo Image of Tumor-Bearing Mice

With the excellent performance of Bio-B-Cy being firmly established in 4T1 cells, we next assessed its targeted imaging of H2O2 in a 4T1-bearing mouse model. We first investigated whether Bio-B-Cy could be delivered and retained in the 4T1-bearing mice. Longitudinal FL imaging showed that the fluorescence intensity of Bio-B-Cy and B-Cy at 707 nm gradually increased after intravenous injection, which peaked at 2 h (Figure 5A). However, due to the lack of biotin, the maximum tumor fluorescence intensity was ~3-fold higher than in mice treated with B-Cy. To further prove the fluorescence generation in the tumor site, we sacrificed the injecting mice after a 2 h injection. After sacrifice, organs and tumor tissues were harvested from tumor-bearing mice and their fluorescence intensity was detected individually. Compared with B-Cy, Bio-B-Cy exhibited less liver accumulation and the fluorescence intensity of Bio-B-Cy is mainly distributed in tumor tissue (Figure 5C). This indicated that Bio-B-Cy was able to achieve a specific distribution within the tumor through the targeting ability of biotin groups, resulting in a high signal-to-noise ratio. Quantification of the data revealed a 1.5-fold higher fluorescence intensity for Bio-B-Cy in tumor sites than B-Cy. The results demonstrated that the biotin-bearing probe Bio-B-Cy could be more efficient than B-Cy to enter and accumulate in 4T1 tumors assisted by the biotin-mediated targeting, generating fluorescence intensity to figure out the tumors.

4. Conclusions

In summary, we have designed and synthesized a new NIR fluorescent probe Bio-B-Cy that can discriminate between cancer cells and normal cells, selectively enter the former ones, and react with intracellular H2O2. With the addition of H2O2, Bio-B-Cy emitted intense fluorescence. The results demonstrated that Bio-B-Cy owns favorable properties, like well selectivity, stability, and low toxicity. Moreover, Bio-B-Cy was applied to selectively monitor the high level of H2O2 in biotin-receptor positive 4T1 cells. Most importantly, Bio-B-Cy not only can target the tumor of 4T1-bearing mice but also has a good screening ability for tumor cells in animal models. Our findings suggest that Bio-B-Cy has the potential to improve early diagnosis and monitoring of TNBC, giving a new approach to personalized treatment strategies for this challenging disease. We also expect that Bio-B-Cy could be used in preclinical and clinical studies, which will validate the efficacy and safety of this promising imaging tool.

Supplementary Materials

The following supporting information can be downloaded at: https://www.mdpi.com/article/10.3390/chemosensors13030104/s1, Figure S1. 1H-NMR spectrum of Cy-OH in CDCl3; Figure S2. ESI-MS spectra of Cy-OH; Figure S3. 1H-NMR spectrum of compound 2 in CDCl3; Figure S4. ESI-MS spectra of compound 2; Figure S5. 1H-NMR spectrum of compound 3 in CDCl3; Figure S6. ESI-MS spectra of compound 3; Figure S7. 1H-NMR spectrum of compound 4 in CDCl3; Figure S8. ESI-MS spectra of compound 4; Figure S9. 1H-NMR spectrum of compound 6 in CDCl3; Figure S10. ESI-MS spectra of compound 6; Figure S11. 13C-NMR spectra of compound 6 in DMSO-d6; Figure S12. 1H-NMR spectrum of Bio-B-Cy in CDCl3; Figure S13. ESI-MS spectra of Bio-B-Cy; Figure S14. 13C-NMR spectra of Bio-B-Cy in DMSO-d6; Figure S15. The fluorescence spectra of Bio-B-Cy (10 μM) with/without the absence of H2O2; Figure S16. The fluorescence spectra of Bio-B-Cy (10 μM) with different concentrations of H2O2 in the absence of serum; Figure S17. Time dependence of Bio-B-Cy (10 μM) upon H2O2 (50 mM) for 0–25 min; Figure S18. The time-dependent fluorescence intensity of Bio-B-Cy (10 μM) with 50 μM H2O2 in PBS; Figure S19. HPLC chromatograms of Bio-B-Cy and its reaction with H2O2 for 30 min; Figure S20. Cytotoxicity of Bio-B-Cy. Figure S21. 1H-NMR spectrum of Bio-B-Cy incubating with/without H2O2.

Author Contributions

Conceptualization, L.Z., Y.W. and H.L.; methodology, L.Z., Y.W. and H.L.; software, L.Z.; formal analysis and investigation, L.Z.; writing—original draft preparation, L.Z.; writing—review and editing, Y.W., Q.H. and H.L.; All authors have read and agreed to the published version of the manuscript.

Funding

This research was funded by the Jiangsu Provincial Scientific Research Center of Applied Mathematics under Grant (BK20233002), the Natural Science Foundation of Jiangsu Province (BK20241271), the China Postdoctoral Science Foundation (2024M750407), the Jiangsu Funding Program for Excellent Postdoctoral talent (2024ZB081), the Postdoctoral Fellowship Program of CPSF (GZC20240249), and Open Research Fund of State Key Laboratory of Analytical Chemistry for Life Science (SKLACLS2413), the National Natural Science Foundation of China (22404019).

Institutional Review Board Statement

The animal study protocol was approved by Animal Use and Care Committee of Southeast University, China (ethics code: 20241125001).

Informed Consent Statement

Not applicable.

Data Availability Statement

Additional data in support of the findings of the study are available from the corresponding author upon reasonable request.

Conflicts of Interest

The authors declare no conflicts of interest.

References

  1. Rhee, S.G. H2O2, a necessary evil for cell signaling. Science 2006, 312, 1882–1883. [Google Scholar] [CrossRef] [PubMed]
  2. Pravda, J. Hydrogen peroxide and disease: Towards a unified system of pathogenesis and therapeutics. Mol. Med. 2020, 26, 41. [Google Scholar] [CrossRef]
  3. Lin, M.T.; Beal, M.F. Mitochondrial dysfunction and oxidative stress in neurodegenerative diseases. Nature 2006, 443, 787–795. [Google Scholar] [CrossRef]
  4. Saikolappan, S.; Kumar, B.; Shishodia, G.; Koul, S.; Koul, H.K. Reactive oxygen species and cancer: A complex interaction. Cancer Lett. 2019, 452, 132–143. [Google Scholar] [CrossRef]
  5. Kumar, R.; Han, J.; Lim, H.J.; Ren, W.X.; Lim, J.Y.; Kim, J.H.; Kim, J.S. Mitochondrial Induced and Self-Monitored Intrinsic Apoptosis by Antitumor Theranostic Prodrug: In Vivo Imaging and Precise Cancer Treatment. J. Am. Chem. Soc. 2014, 136, 17836–17843. [Google Scholar] [CrossRef] [PubMed]
  6. Chen, X.; Wang, F.; Hyun, J.Y.; Wei, T.; Qiang, J.; Ren, X.; Shin, I.; Yoon, J. Recent progress in the development of fluorescent, luminescent and colorimetric probes for detection of reactive oxygen and nitrogen species. Chem. Soc. Rev. 2016, 45, 2976–3016. [Google Scholar] [CrossRef]
  7. Karan, S.; Cho, M.Y.; Lee, H.; Kim, H.M.; Park, H.S.; Han, E.H.; Sessler, J.L.; Hong, K.S. Hypoxia-Directed and Self-Immolative Theranostic Agent: Imaging and Treatment of Cancer and Bacterial Infections. J. Med. Chem. 2023, 66, 14175–14187. [Google Scholar] [CrossRef] [PubMed]
  8. Wang, K.; Zhang, R.; Zhao, X.; Ma, Y.; Ren, L.; Ren, Y.; Chen, G.; Ye, D.; Wu, J.; Hu, X.; et al. Reversible Recognition-Based Boronic Acid Probes for Glucose Detection in Live Cells and Zebrafish. J. Am. Chem. Soc. 2023, 145, 8408–8416. [Google Scholar] [CrossRef]
  9. Lu, Q.; Wang, Z.; Bai, S.; Wang, Y.; Liao, C.; Sun, Y.; Zhang, Y.; Li, W.; Mei, Q. Hydrophobicity Regulation of Energy Acceptors Confined in Mesoporous Silica Enabled Reversible Activation of Optogenetics for Closed-Loop Glycemic Control. J. Am. Chem. Soc. 2023, 145, 5941–5951. [Google Scholar] [CrossRef]
  10. Yang, N.; Huang, Y.; Wang, X.; Wang, D.; Yao, D.; Ren, G. Fibronectin-Targeting Dual-Modal MR/NIRF Imaging Contrast Agents for Diagnosis of Gastric Cancer and Peritoneal Metastasis. Bioconjug. Chem. 2024, 35, 843–854. [Google Scholar] [CrossRef]
  11. Xu, L.; Zhang, Q.; Wang, X.; Lin, W. Biomedical applications of NIR-II organic small molecule fluorescent probes in different organs. Coord. Chem. Rev. 2024, 519, 216122. [Google Scholar] [CrossRef]
  12. Qian, Y.; Cui, H.; Lu, Z.; Guo, J.; Feng, Y.; Li, J.; Wang, Y.; Zhao, H.; Jiao, C.; Xiong, X. Construction and application of fluorescent probe and sensing aerogel with ability to detect hydrogen sulfide. Microchem. J. 2024, 207, 112107. [Google Scholar] [CrossRef]
  13. Luo, S.; Zou, R.; Wu, J.; Landry, M.P. A Probe for the Detection of Hypoxic Cancer Cells. ACS Sens. 2017, 2, 1139–1145. [Google Scholar] [CrossRef] [PubMed]
  14. Zhai, R.; Fang, B.; Lai, Y.; Peng, B.; Bai, H.; Liu, X.; Li, L.; Huang, W. Small-molecule fluorogenic probes for mitochondrial nanoscale imaging. Chem. Soc. Rev. 2023, 52, 942–972. [Google Scholar] [CrossRef]
  15. Huang, X.; Song, J.; Yung, B.C.; Huang, X.; Xiong, Y.; Chen, X. Ratiometric optical nanoprobes enable accurate molecular detection and imaging. Chem. Soc. Rev. 2018, 47, 2873–2920. [Google Scholar] [CrossRef]
  16. Han, H.-H.; Tian, H.; Zang, Y.; Sedgwick, A.C.; Li, J.; Sessler, J.L.; He, X.-P.; James, T.D. Small-molecule fluorescence-based probes for interrogating major organ diseases. Chem. Soc. Rev. 2021, 50, 9391–9429. [Google Scholar] [CrossRef]
  17. Yuan, L.; Lin, W.Y.; Zhao, S.; Gao, W.S.; Chen, B.; He, L.W.; Zhu, S.S. A Unique Approach to Development of Near-Infrared Fluorescent Sensors for in Vivo Imaging. J. Am. Chem. Soc. 2012, 134, 13510–13523. [Google Scholar] [CrossRef]
  18. Wang, M.; Guo, X.; Liao, Z.; Sun, S.; Farag, M.A.; Ren, Q.; Li, P.; Li, N.; Sun, J.; Liu, C. Monitoring the fluctuation of hydrogen peroxide with a near-infrared fluorescent probe for the diagnosis and management of kidney injury. J. Hazard. Mater. 2024, 476, 134949. [Google Scholar] [CrossRef]
  19. Zan, Q.; Zhao, K.; Li, R.; Yang, Y.; Yang, X.; Li, W.; Zhang, G.; Dong, C.; Shuang, S.; Fan, L. Mitochondria-Targetable Near-Infrared Fluorescent Probe for Visualization of Hydrogen Peroxide in Lung Injury, Liver Injury, and Tumor Models. Anal. Chem. 2024, 96, 10488–10495. [Google Scholar] [CrossRef]
  20. Guo, R.; Huang, F.; Zhang, B.; Yan, Y.; Che, J.; Jin, Y.; Zhuang, Y.; Dong, R.; Li, Y.; Tan, B.; et al. GSH Activated Biotin-tagged Near-Infrared Probe for Efficient Cancer Imaging. Theranostics 2019, 9, 3515–3525. [Google Scholar] [CrossRef]
  21. Ren, W.X.; Han, J.; Uhm, S.; Jang, Y.J.; Kang, C.; Kim, J.-H.; Kim, J.S. Recent development of biotin conjugation in biological imaging, sensing, and target delivery. Chem. Commun. 2015, 51, 10403–10418. [Google Scholar] [CrossRef]
  22. Lee, Y.; Lee, S.; Jon, S. Biotinylated Bilirubin Nanoparticles as a Tumor Microenvironment-Responsive Drug Delivery System for Targeted Cancer Therapy. Adv. Sci. 2018, 5, 1800017. [Google Scholar] [CrossRef] [PubMed]
  23. Lewis, B.; Rathman, S.; Mcmahon, R. Dietary Biotin Intake Modulates the Pool of Free and Protein-Bound Biotin in Rat Liver. J. Nutr. 2001, 131, 2310–2315. [Google Scholar] [CrossRef] [PubMed]
  24. Puddu, P.; Zanetti, P.; Turchetto, E.; Marchetti, M. Aspects of liver lipid metabolism in the biotin-deficient rat. J. Nutr. 1967, 91, 509. [Google Scholar] [CrossRef]
  25. Dakshinamurti, K.; Cheah-Tan, C. Biotin-mediated synthesis of hepatic glucokinase in the rat. Arch. Biochem. Biophys. 1968, 127, 17–21. [Google Scholar] [CrossRef] [PubMed]
  26. Li, L.; Li, Z.; Shi, W.; Li, X.; Ma, H. Sensitive and Selective Near-Infrared Fluorescent Off–On Probe and Its Application to Imaging Different Levels of β-Lactamase in Staphylococcus aureus. Anal. Chem. 2014, 86, 6115–6120. [Google Scholar] [CrossRef]
  27. Gatin-Fraudet, B.; Ottenwelter, R.; Le Saux, T.; Norsikian, S.; Pucher, M.; Lombes, T.; Baron, A.; Durand, P.; Doisneau, G.; Bourdreux, Y.; et al. Evaluation of borinic acids as new, fast hydrogen peroxide-responsive triggers. Proc. Natl. Acad. Sci. USA 2021, 118, e2107503118. [Google Scholar] [CrossRef]
  28. Zhong, D.; Xiong, S.; Zhang, Y.; Cui, M.; Liu, L.; Xu, Y.; Wang, P.; Zhang, W. H2O2-activated NIR fluorescent probe with tumor targeting for cell imaging and fluorescent-guided surgery. Sens. Actuators B-Chem. 2024, 418, 136249. [Google Scholar] [CrossRef]
  29. Huang, Y.; Qiu, F.; Chen, D.; Shen, L.; Xu, S.; Guo, D.; Su, Y.; Yan, D.; Zhu, X. Color-Convertible, Unimolecular, Micelle-Based, Activatable Fluorescent Probe for Tumor-Specific Detection and Imaging In Vitro and In Vivo. Small 2017, 13, 1604062. [Google Scholar] [CrossRef]
  30. Lippert, A.R.; Van de Bittner, G.C.; Chang, C.J. Boronate Oxidation as a Bioorthogonal Reaction Approach for Studying the Chemistry of Hydrogen Peroxide in Living Systems. Acc. Chem. Res. 2011, 44, 793–804. [Google Scholar] [CrossRef]
  31. Chen, M.-M.; Tang, X.; Li, J.-J.; Chen, F.-Y.; Jiang, Z.-T.; Fu, R.; Li, H.-B.; Hu, X.-Y.; Geng, W.-C.; Guo, D.-S. Active targeting tumor therapy using host-guest drug delivery system based on biotin functionalized azocalix[4]arene. J. Control. Release 2024, 368, 691–702. [Google Scholar] [CrossRef] [PubMed]
  32. Ma, L.; Zhang, C.-R.; Zhang, M.-L.; Liu, X.-M.; Gong, J.-J.; Chen, Y.-H.; Liu, Z.-J.; Wu, Y.-Z.; Chen, H.-S. Theoretical Study on Functionalizing A–D–A Type Non-Fullerene Acceptor by Fused Rings and Side Chains for Organic Solar Cells. Adv. Theory Simul. 2024, 7, 2300624. [Google Scholar] [CrossRef]
  33. Chen, S.; Zhao, X.; Chen, J.; Chen, J.; Kuznetsova, L.; Wong, S.S.; Ojima, I. Mechanism-Based Tumor-Targeting Drug Delivery System. Validation of Efficient Vitamin Receptor-Mediated Endocytosis and Drug Release. Bioconjug. Chem. 2010, 21, 979–987. [Google Scholar] [CrossRef] [PubMed]
  34. Gholipour, N.; Akhlaghi, M.; Mokhtari Kheirabadi, A.; Geramifar, P.; Beiki, D. Development of Ga-68 labeled, biotinylated thiosemicarbazone dextran-coated iron oxide nanoparticles as multimodal PET/MRI probe. Int. J. Biol. Macromol. 2020, 148, 932–941. [Google Scholar] [CrossRef]
Scheme 1. Synthesis routine of Bio-B-Cy.
Chemosensors 13 00104 sch001
Figure 1. Chemical structure and application of the NIR probe Bio-B-Cy.
Chemosensors 13 00104 g001
Figure 2. (A) UV absorption of Bio-B-Cy with/without the addition of H2O2. (B) Fluorescence spectra changes in Bio-B-Cy (10 μM) after incubation with different concentrations of H2O2 for 30 min. (C) The plot of fluorescent emission spectra for Bio-B-Cy (10 μM) versus concentration of H2O2 in the range of 1–100 μM. (D) Fluorescence intensity at 707 nm of Bio-B-Cy (10 μM) in the presence of 50 mM H2O2 at different pH. (E) Fluorescence intensity at 707 nm of Bio-B-Cy (10 μM) with various ROS: 1. blank; 2. H2O2; 3. O2; 4. ⋅OH; 5. 1O2; 6. ClO; 7. ⋅NO; 8. ONOO; 9. ⋅OtBu; 10. TBHP. (F) Fluorescence imaging and intensity measurements of the Bio-B-Cy (10 μM) with varying concentrations of H2O2 (0, 10, 20, 30, 40, and 50 μM).
Chemosensors 13 00104 g002
Figure 3. (A) Proposed mechanism of Bio-B-Cy reacting with H2O2. (B) HOMO and LUMO distributions of Bio-B-Cy and Cy-OH.
Chemosensors 13 00104 g003
Figure 4. In vitro fluorescence imaging of 4T1 cells. (A) Representative confocal laser scanning microscopy (CLSM) images of 4T1 cells incubated with Bio-B-Cy, B-Cy+Biotin, and B-Cy for 20 min. Red channel: λex = 707 nm. Green channel: calcein-AM. Scale bar: 20 μm. (B) Representative confocal laser scanning microscopy (CLSM) images of 4T1 cells and L929 cells incubated with Bio-B-Cy for 20 min. Scale bar: 20 μm. (C) Representative flow cytometer result of 4T1 cells and L929 cells incubated with Bio-B-Cy for 20 min. (D) Quantities of mean fluorescence intensity of (C).
Chemosensors 13 00104 g004
Figure 5. In vivo fluorescence imaging of 4T1 tumor-bearing mouse model. (A) Time-dependent in vivo imaging of 4T1 tumor-bearing mice following intravenous injection of Bio-B-Cy or B-Cy (500 μM each, 100 μL) and (B) Quantified fluorescence intensities of images in (A) at 0, 2, 4, 6, 8 h. (C) Representative ex vivo fluorescence images obtained from several organs including the liver, lung, spleen, heart, kidney, and tumor at 2 h after intravenous injection. (D) Corresponding comparison of the relative mean fluorescence intensity (MFI) measured in organs and tumors (n = 3).
Chemosensors 13 00104 g005
Disclaimer/Publisher’s Note: The statements, opinions and data contained in all publications are solely those of the individual author(s) and contributor(s) and not of MDPI and/or the editor(s). MDPI and/or the editor(s) disclaim responsibility for any injury to people or property resulting from any ideas, methods, instructions or products referred to in the content.

