Development of a Calibration Transfer Methodology and Experimental Setup for Urine Headspace Analysis
Abstract
1. Introduction
2. Materials and Methods
2.1. Design of the Experimental Setup for Calibration Transfer
2.1.1. Sampling System
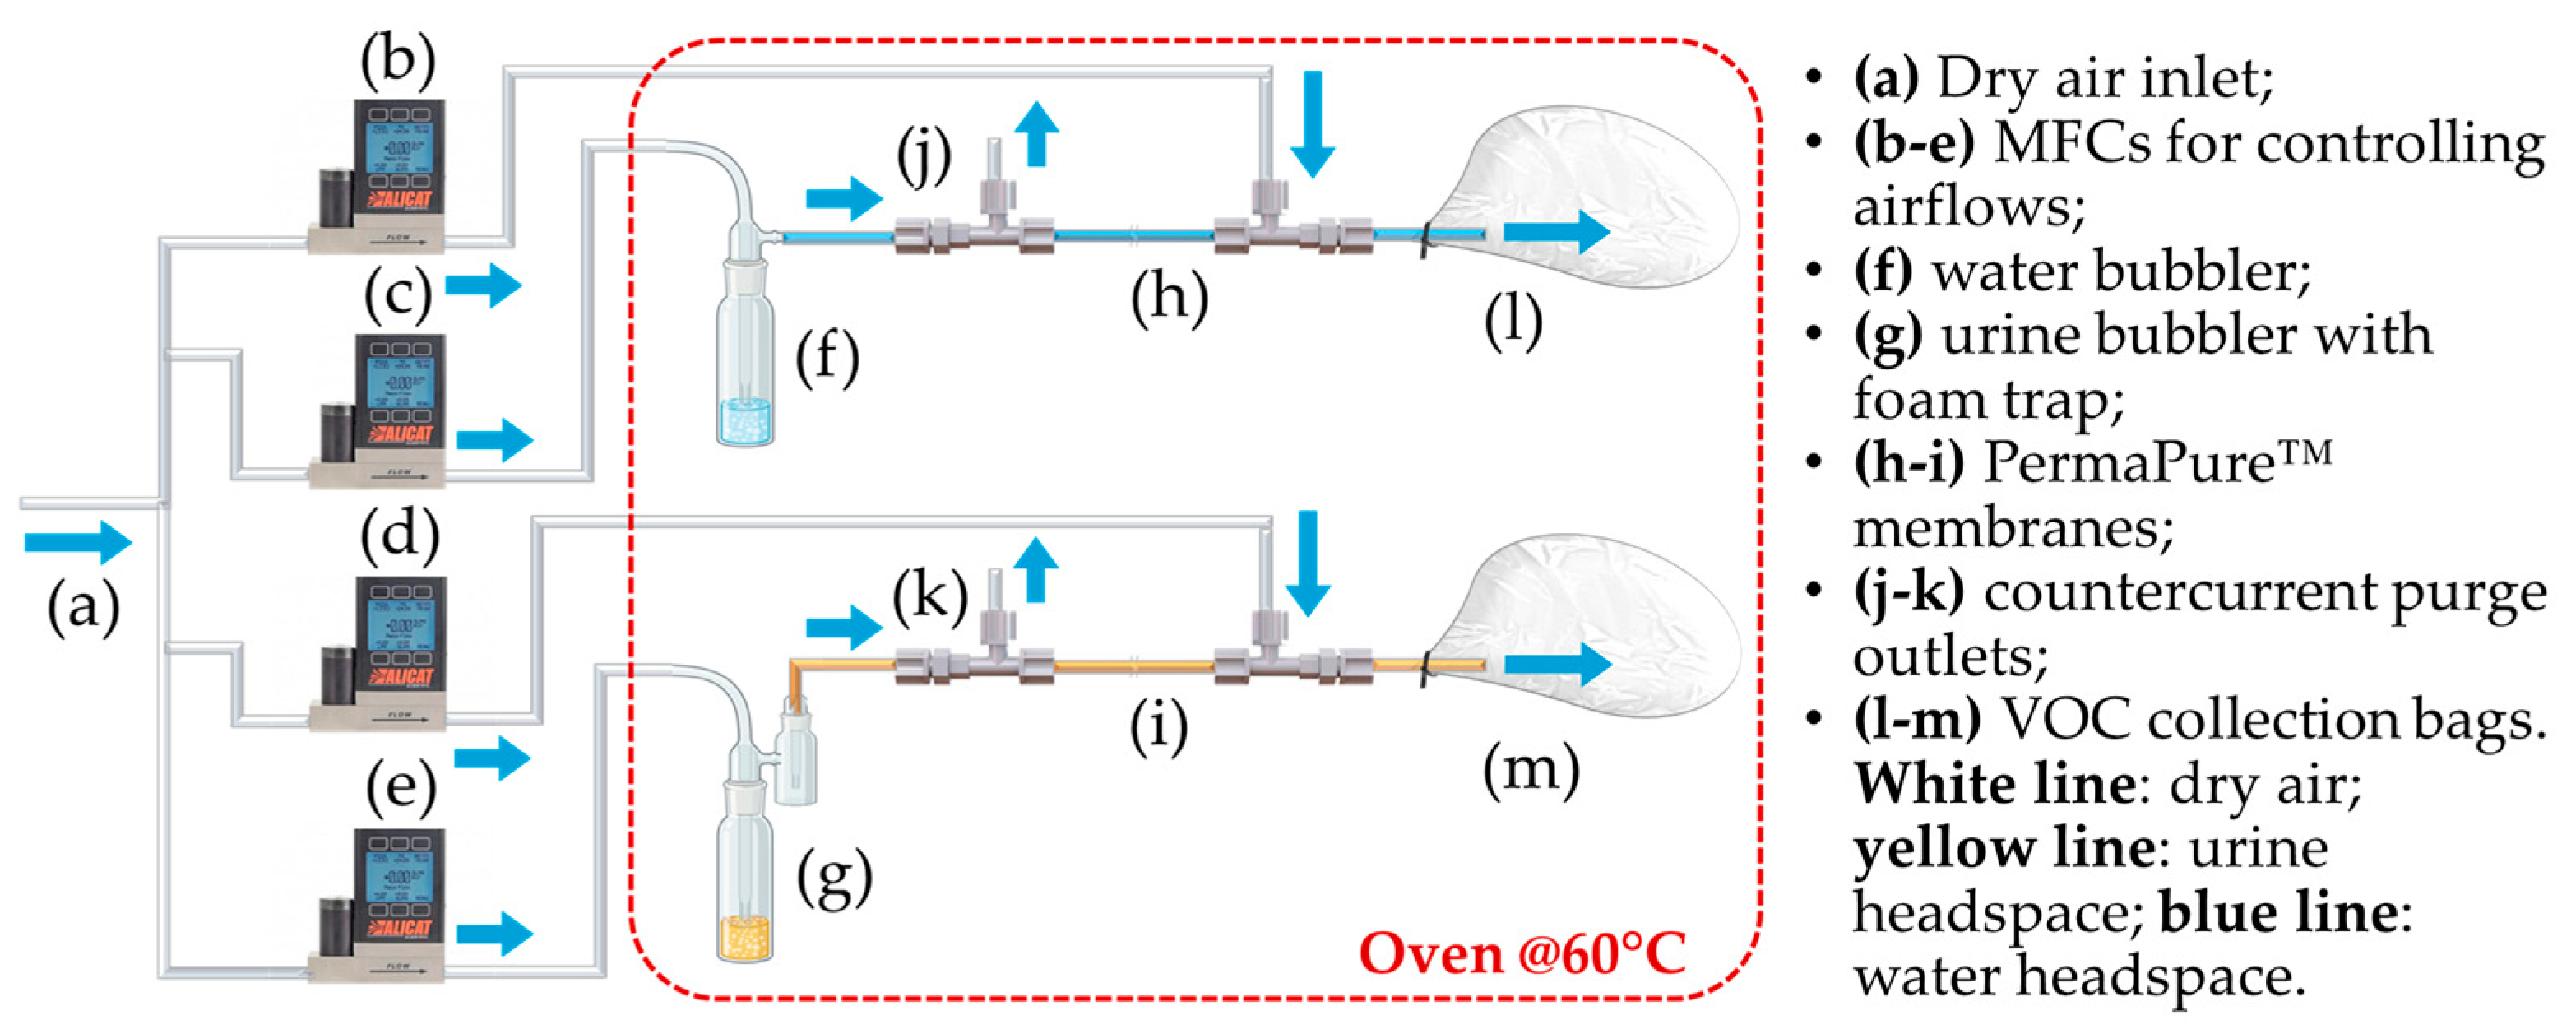
- A compressed air line supplying filtered air;
- Two glass bubblers, one containing the liquid urine sample and the other containing distilled water to be used as reference for sensor baseline;
- A foam trap in the urine line to prevent foam from entering the sample bag;
- Two Nafion™ membranes to reduce the humidity content of the gaseous samples (PermaPure™, Inc., model MD-050-72S-1; Lakewood, NJ, USA);
- Disposable Nalophan™ bags used for VOCs collection, in compliance with the European Standard EN13725:2022 [14] for dynamic olfactometry;
- Four mass flow controllers (MFC) from Alicat Scientific (Tucson, AZ, USA) to regulate the flow rate of the air streams;
- Teflon™ tubing for system connections;
- A forced-air oven set at 60 °C, equipped with temperature control and inlet/outlet ports for gas tubing;
- Heating wires with thermocouples and insulation to maintain gas line temperature.
2.1.2. E-Noses Setup for Calibration Transfer
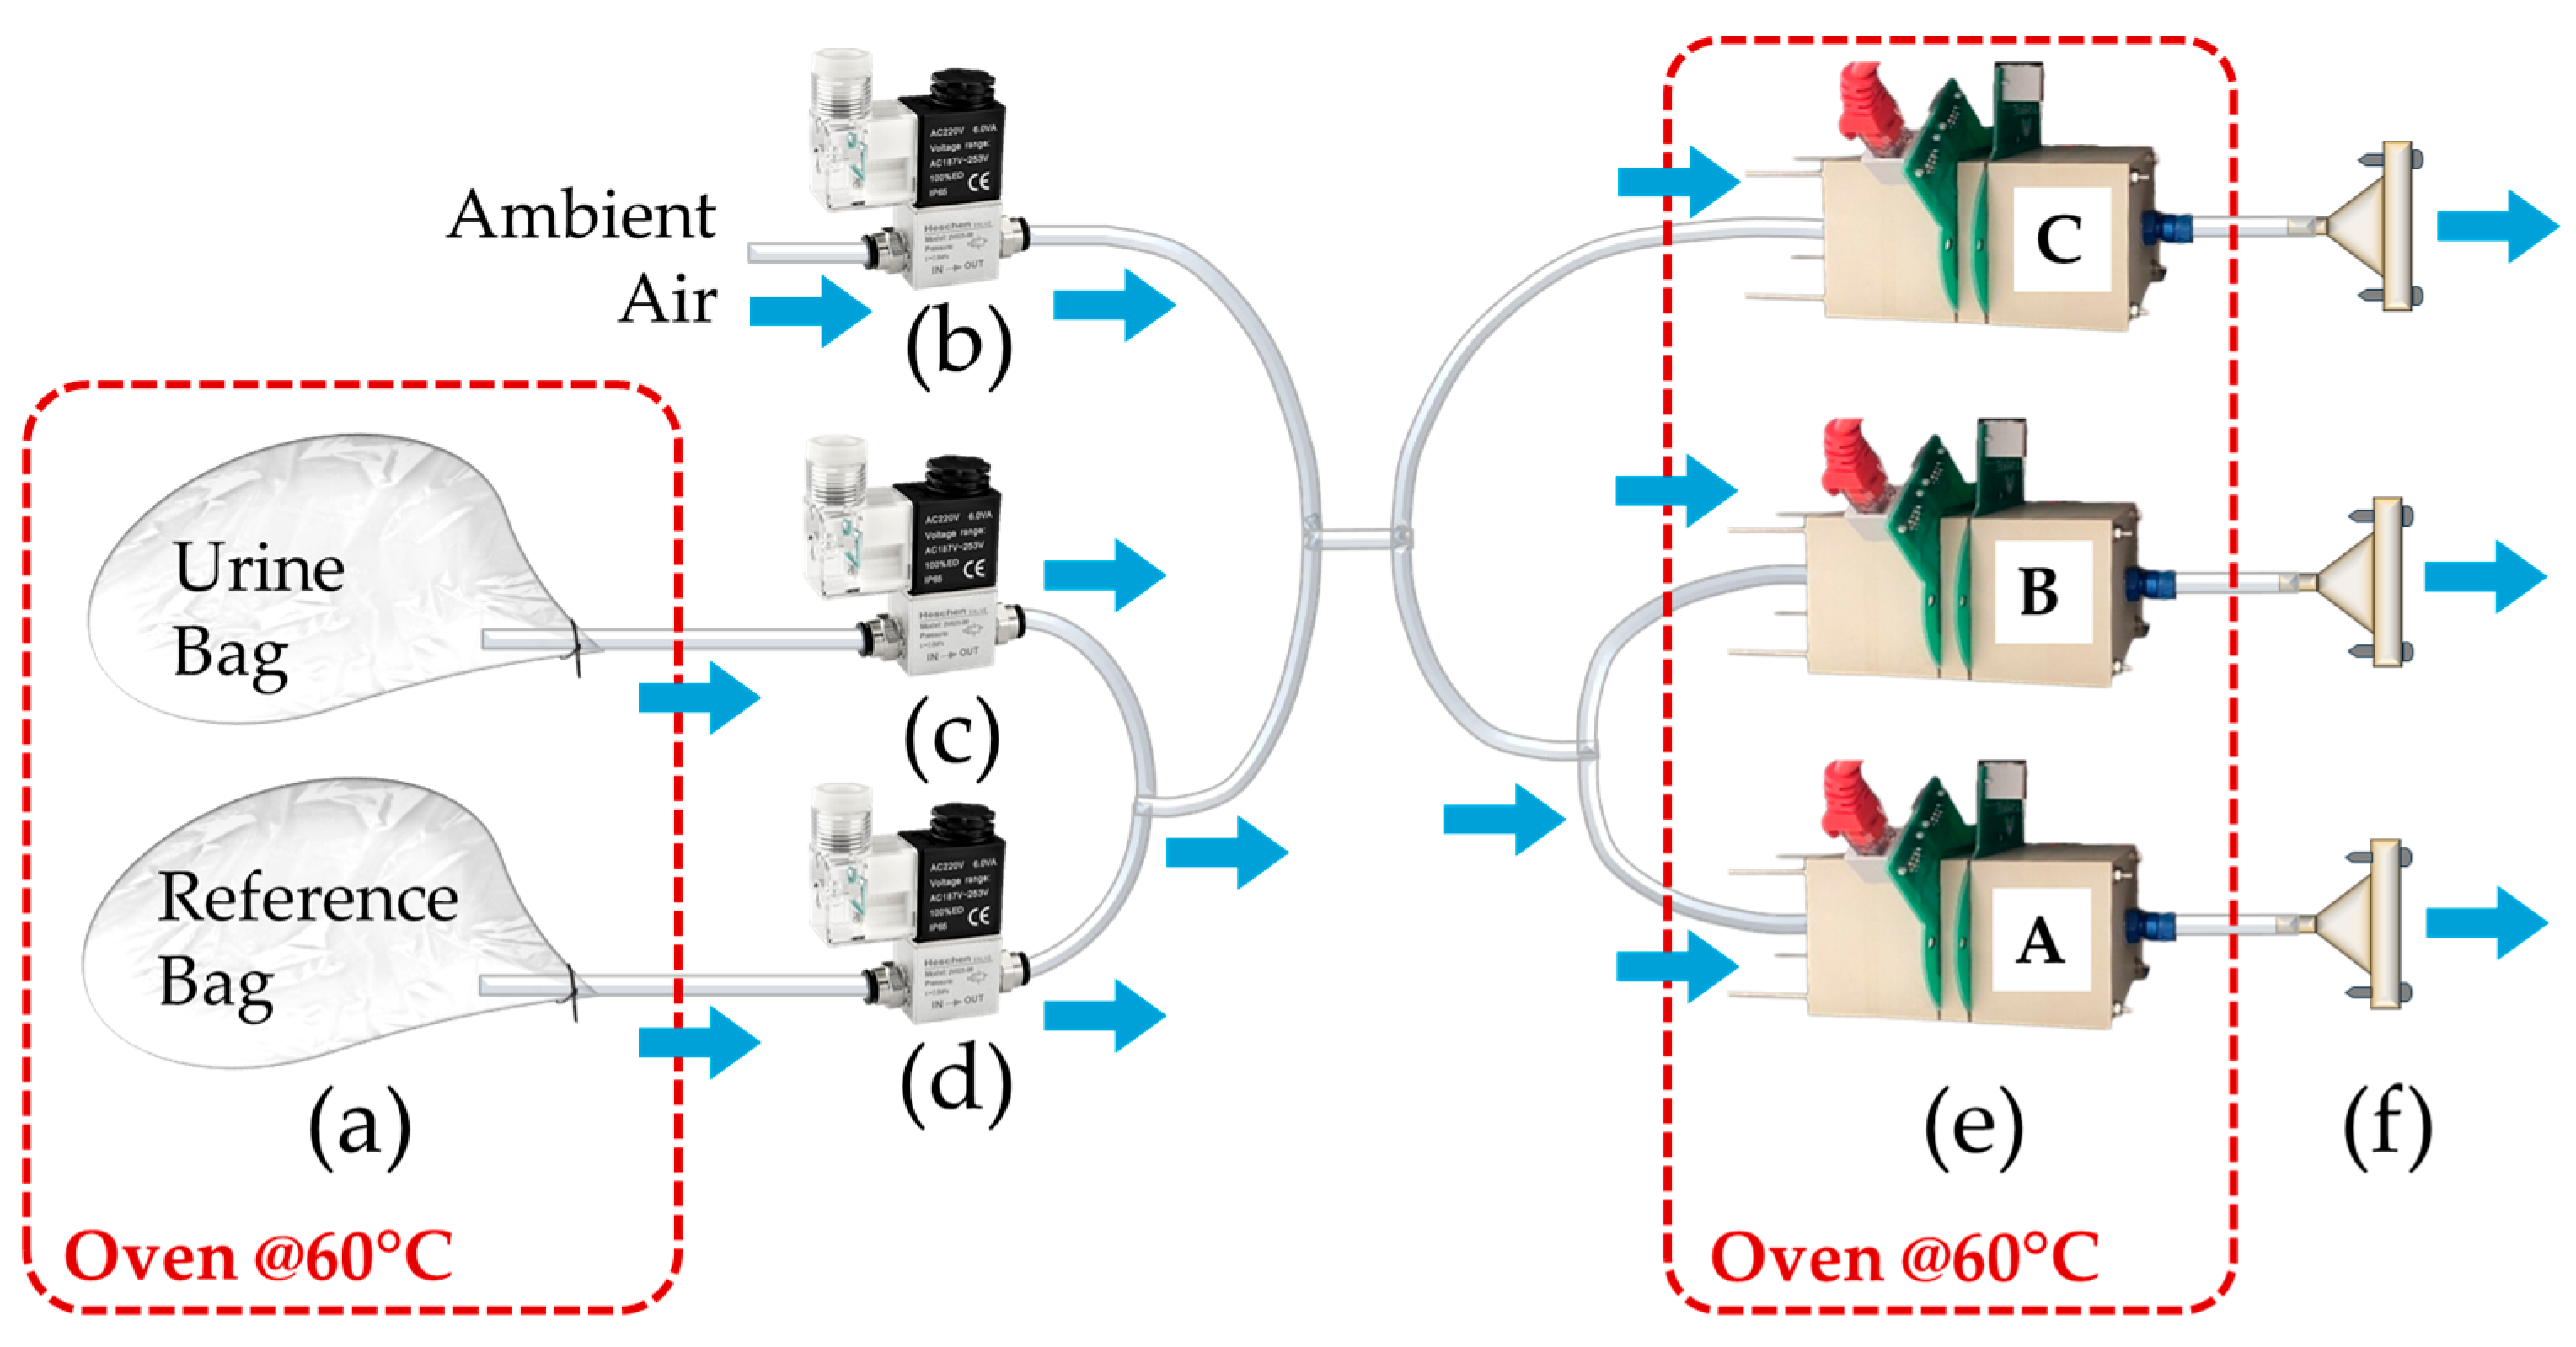
- Before phase (4 min): at the start of the analysis, the electro valve system switches from ambient air to the reference air bag line, allowing the sensors to establish a baseline;
- During phase (3 min): the system then switches to the sample air bag line, enabling the sensors to analyze the sample;
- After phase (4 min): once the sample analysis is complete, the system reopens the reference air bag line to restore the baseline;
- Cleaning phase: at the end of the process, the system switches back to the ambient air line.
2.2. Sample Preparation
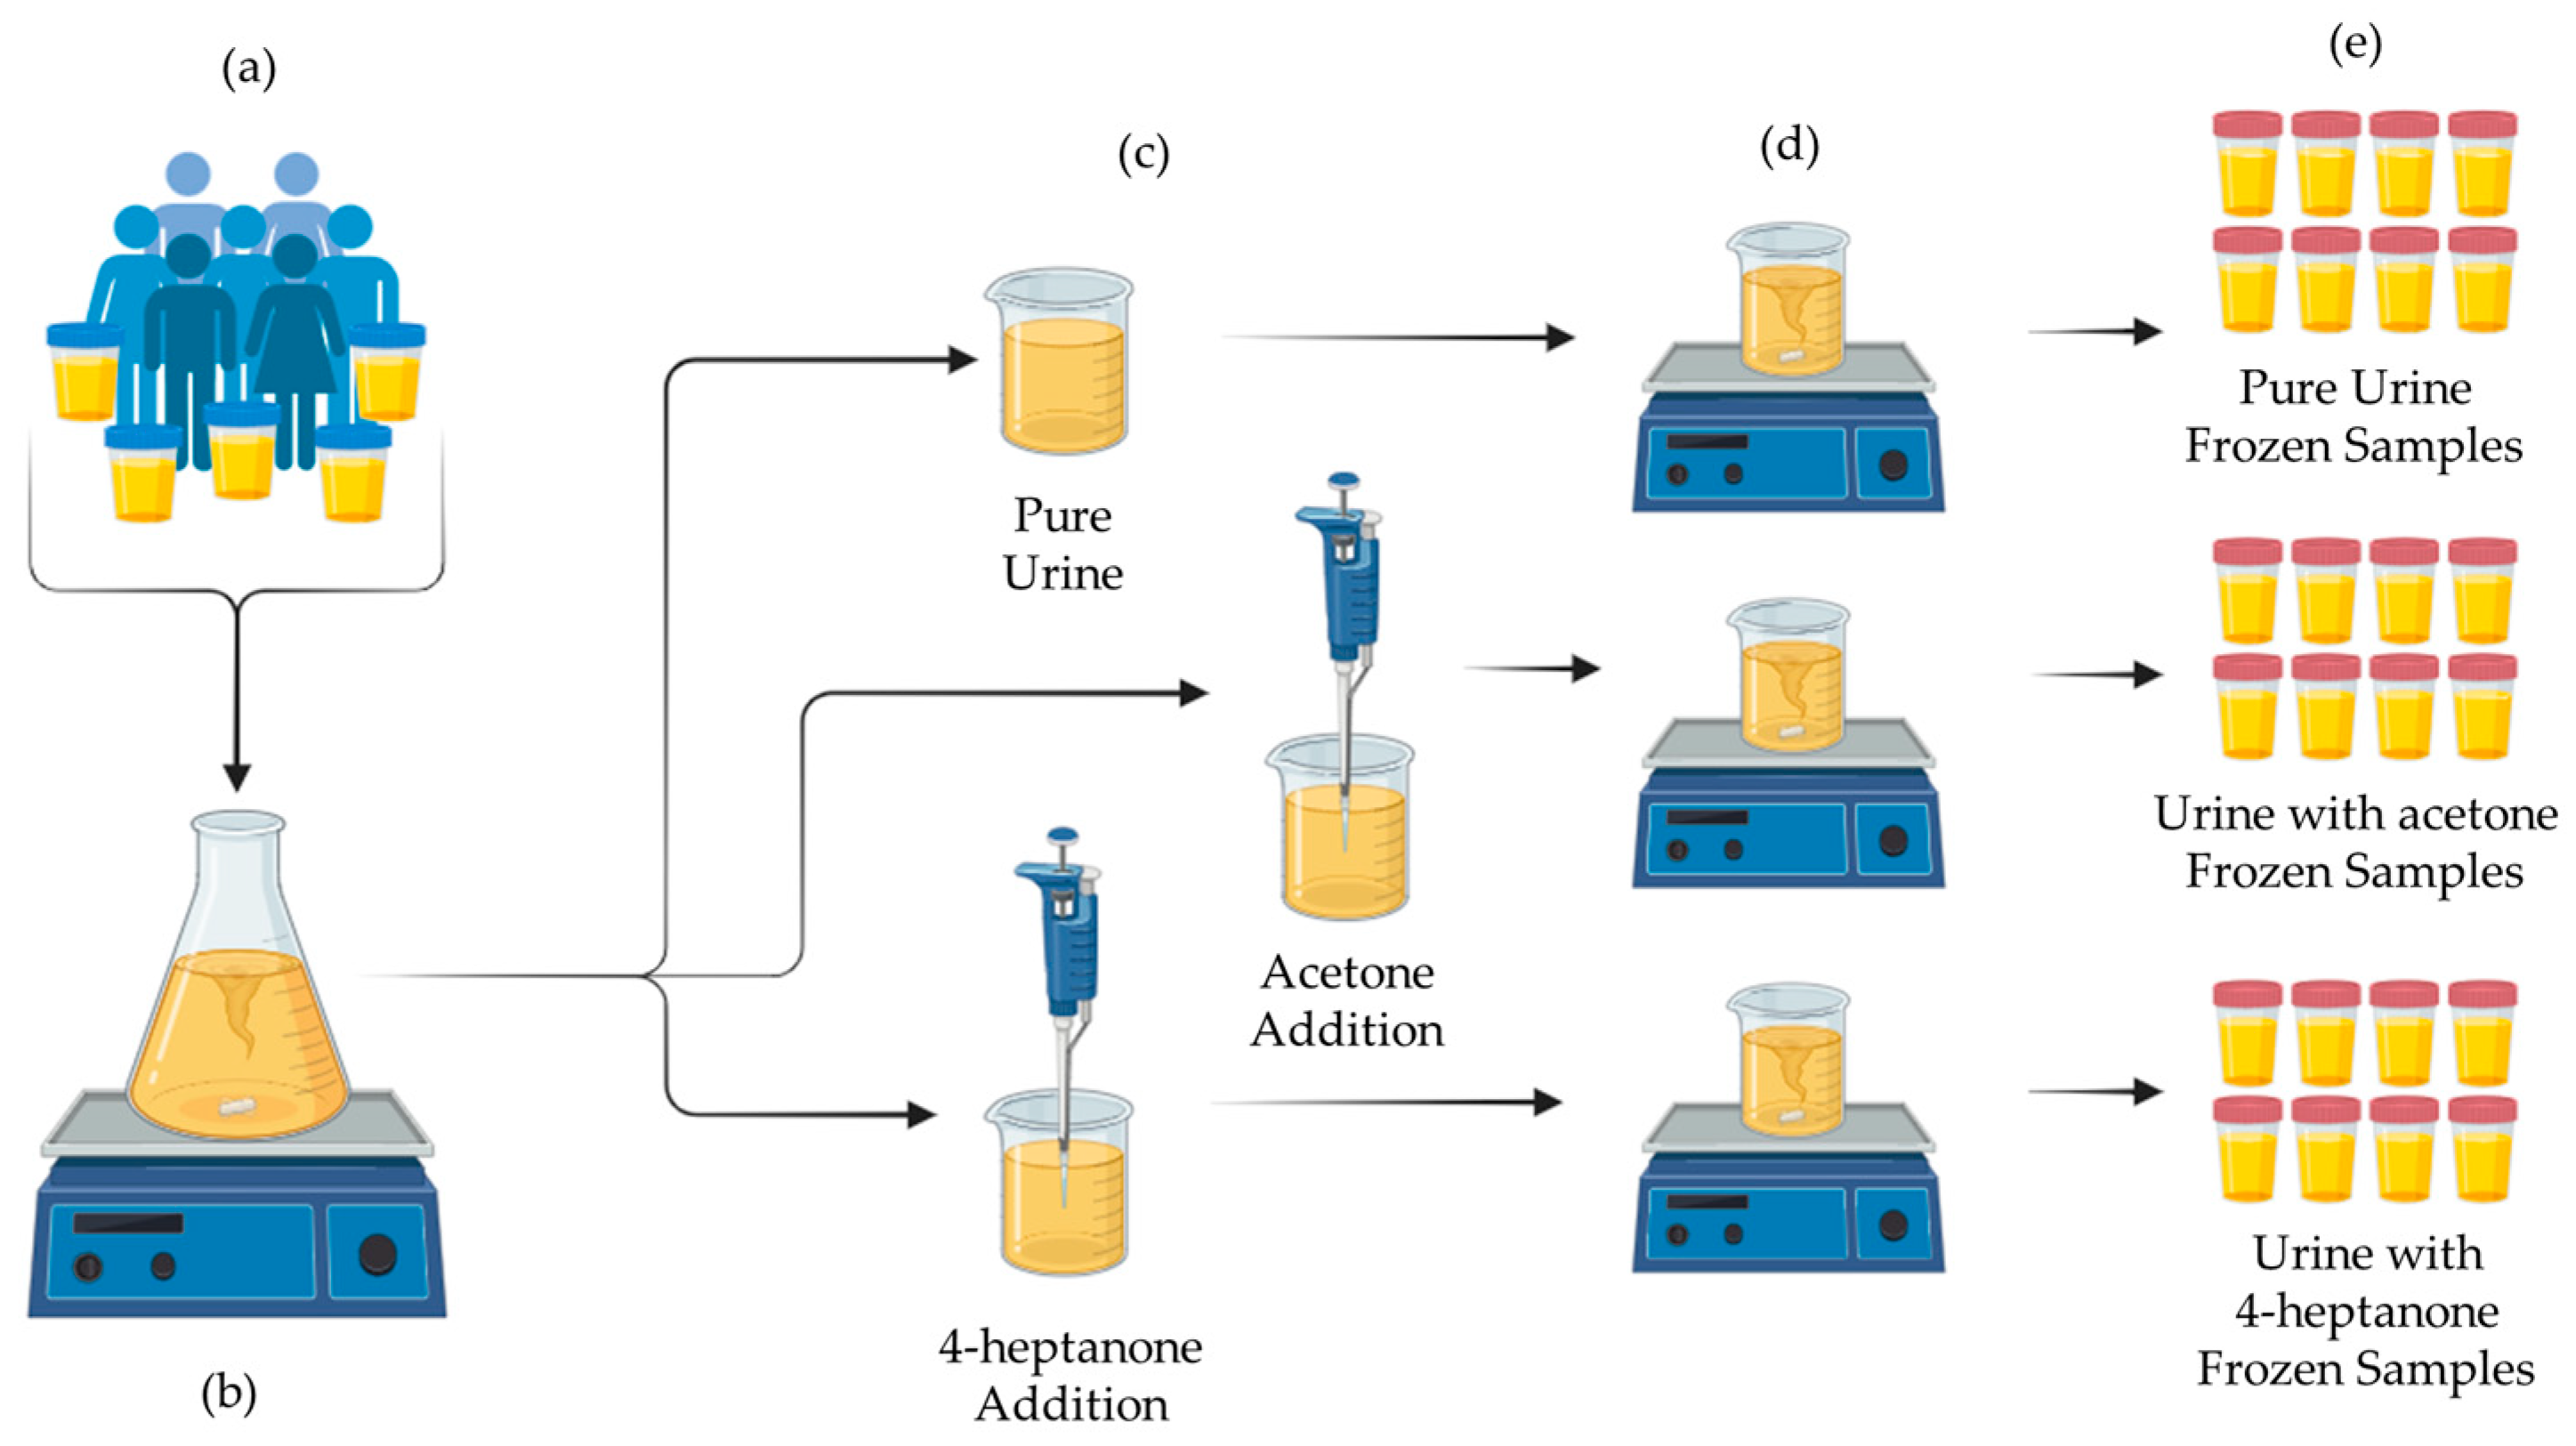
2.2.1. Human Urine Mixtures for E-Nose Classification Model Development
2.2.2. Synthetic Urine Mixtures as E-Nose Calibrants
2.3. E-Nose Classification Models
2.3.1. Data Preprocessing
2.3.2. Feature Extraction
2.3.3. Feature Selection and Classification Models Development
2.4. Calibration Transfer and Selection of Transfer Samples
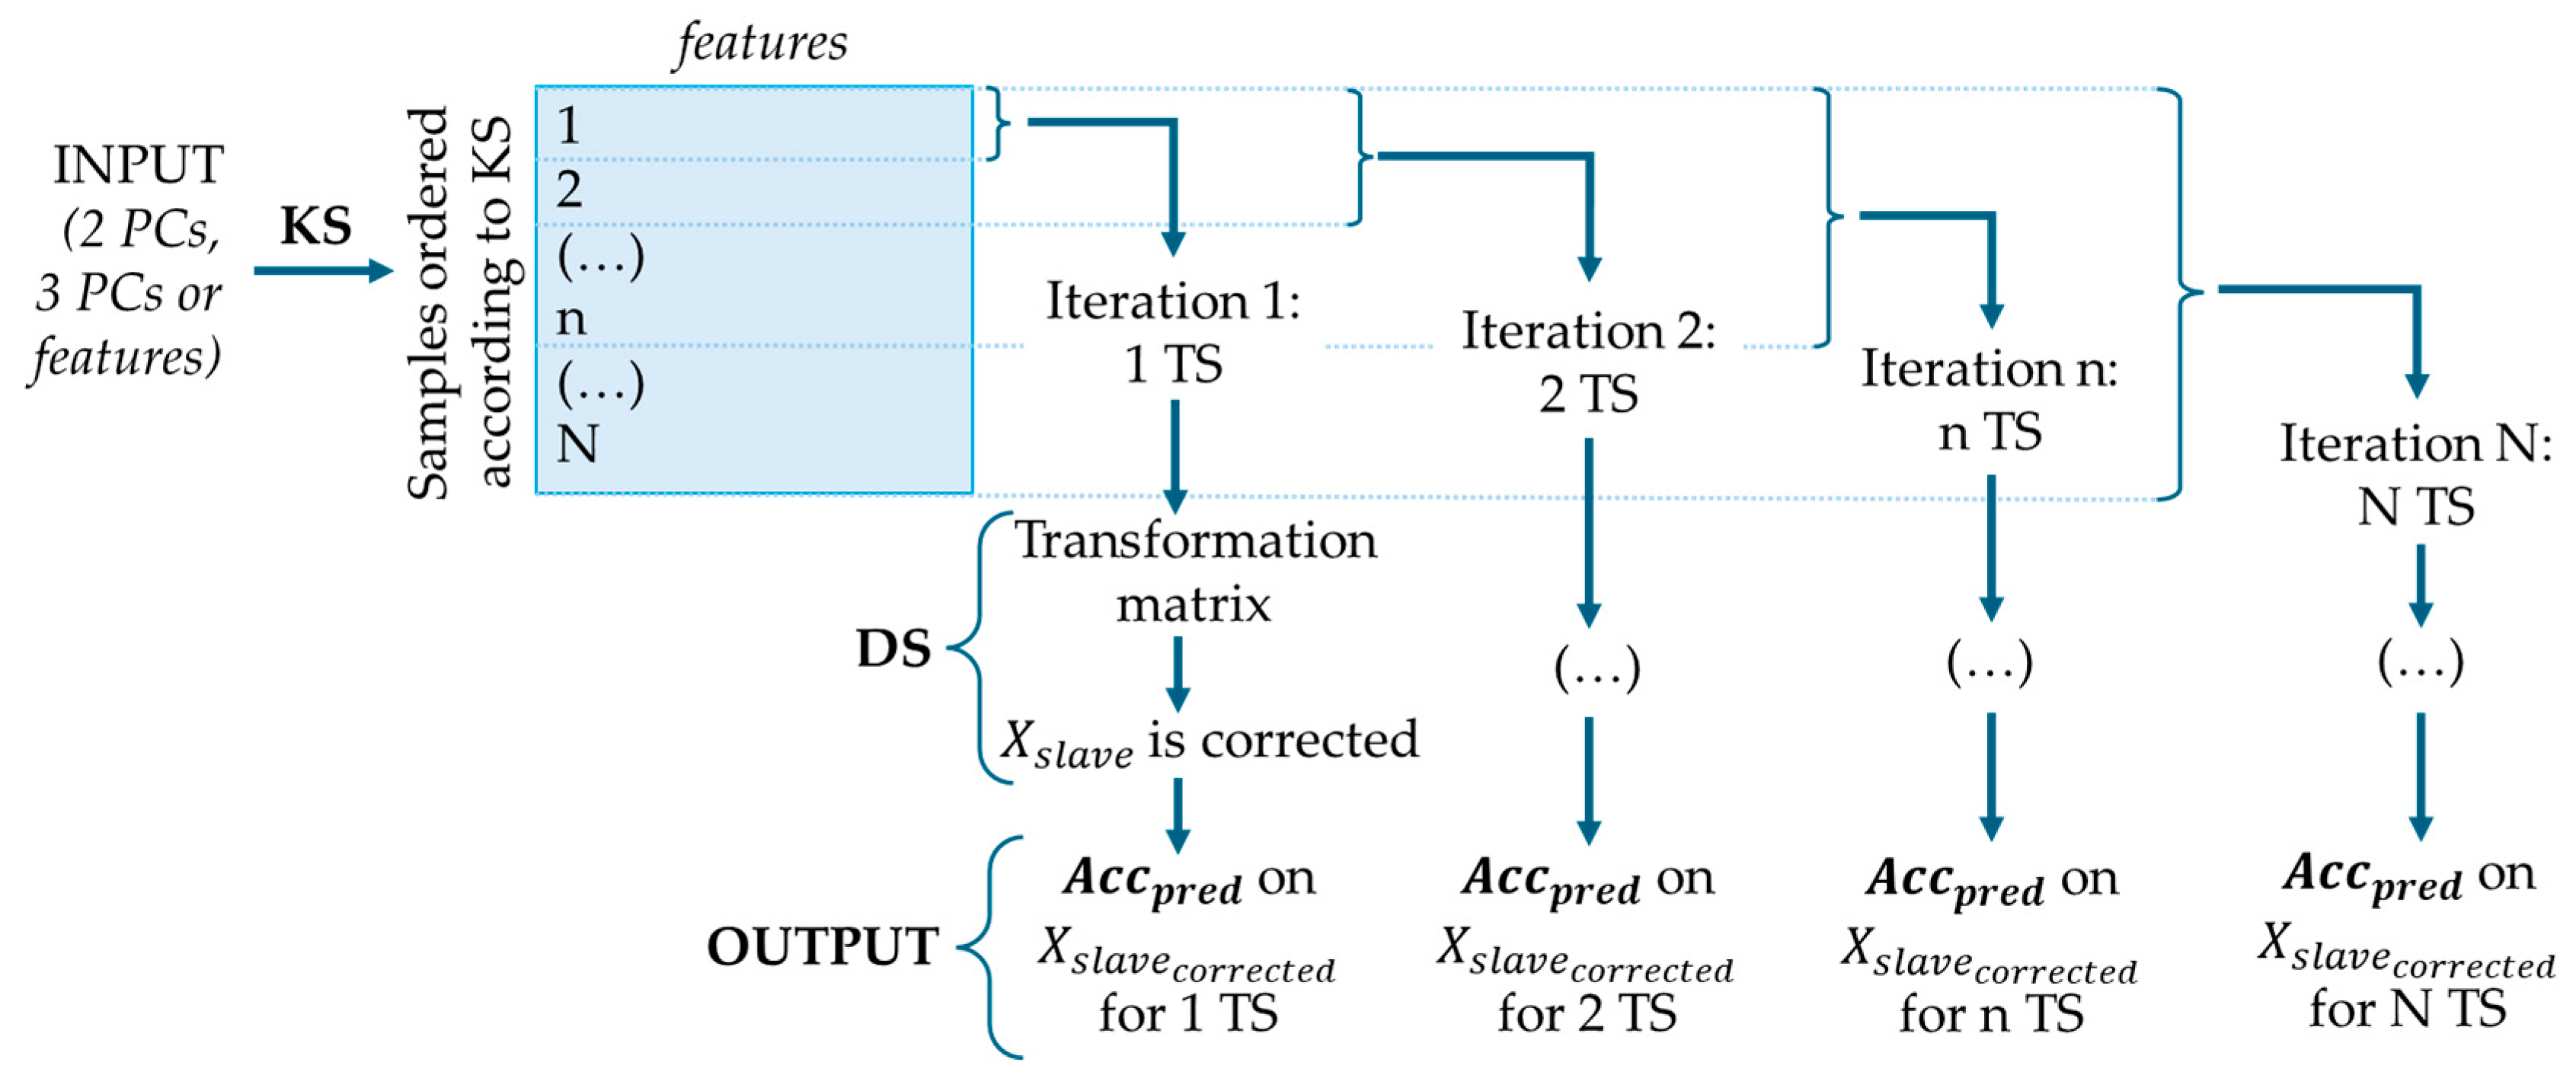
2.4.1. Kennard–Stone (KS) Algorithm
2.4.2. The Extremes + Densest Cluster Method
2.4.3. Random Selection
3. Results
3.1. Development of E-Nose Classification Models
3.2. Synthetic Urine Mixtures
3.3. Calibration Transfer Results
3.3.1. Transfer of Calibration Models Without Correction
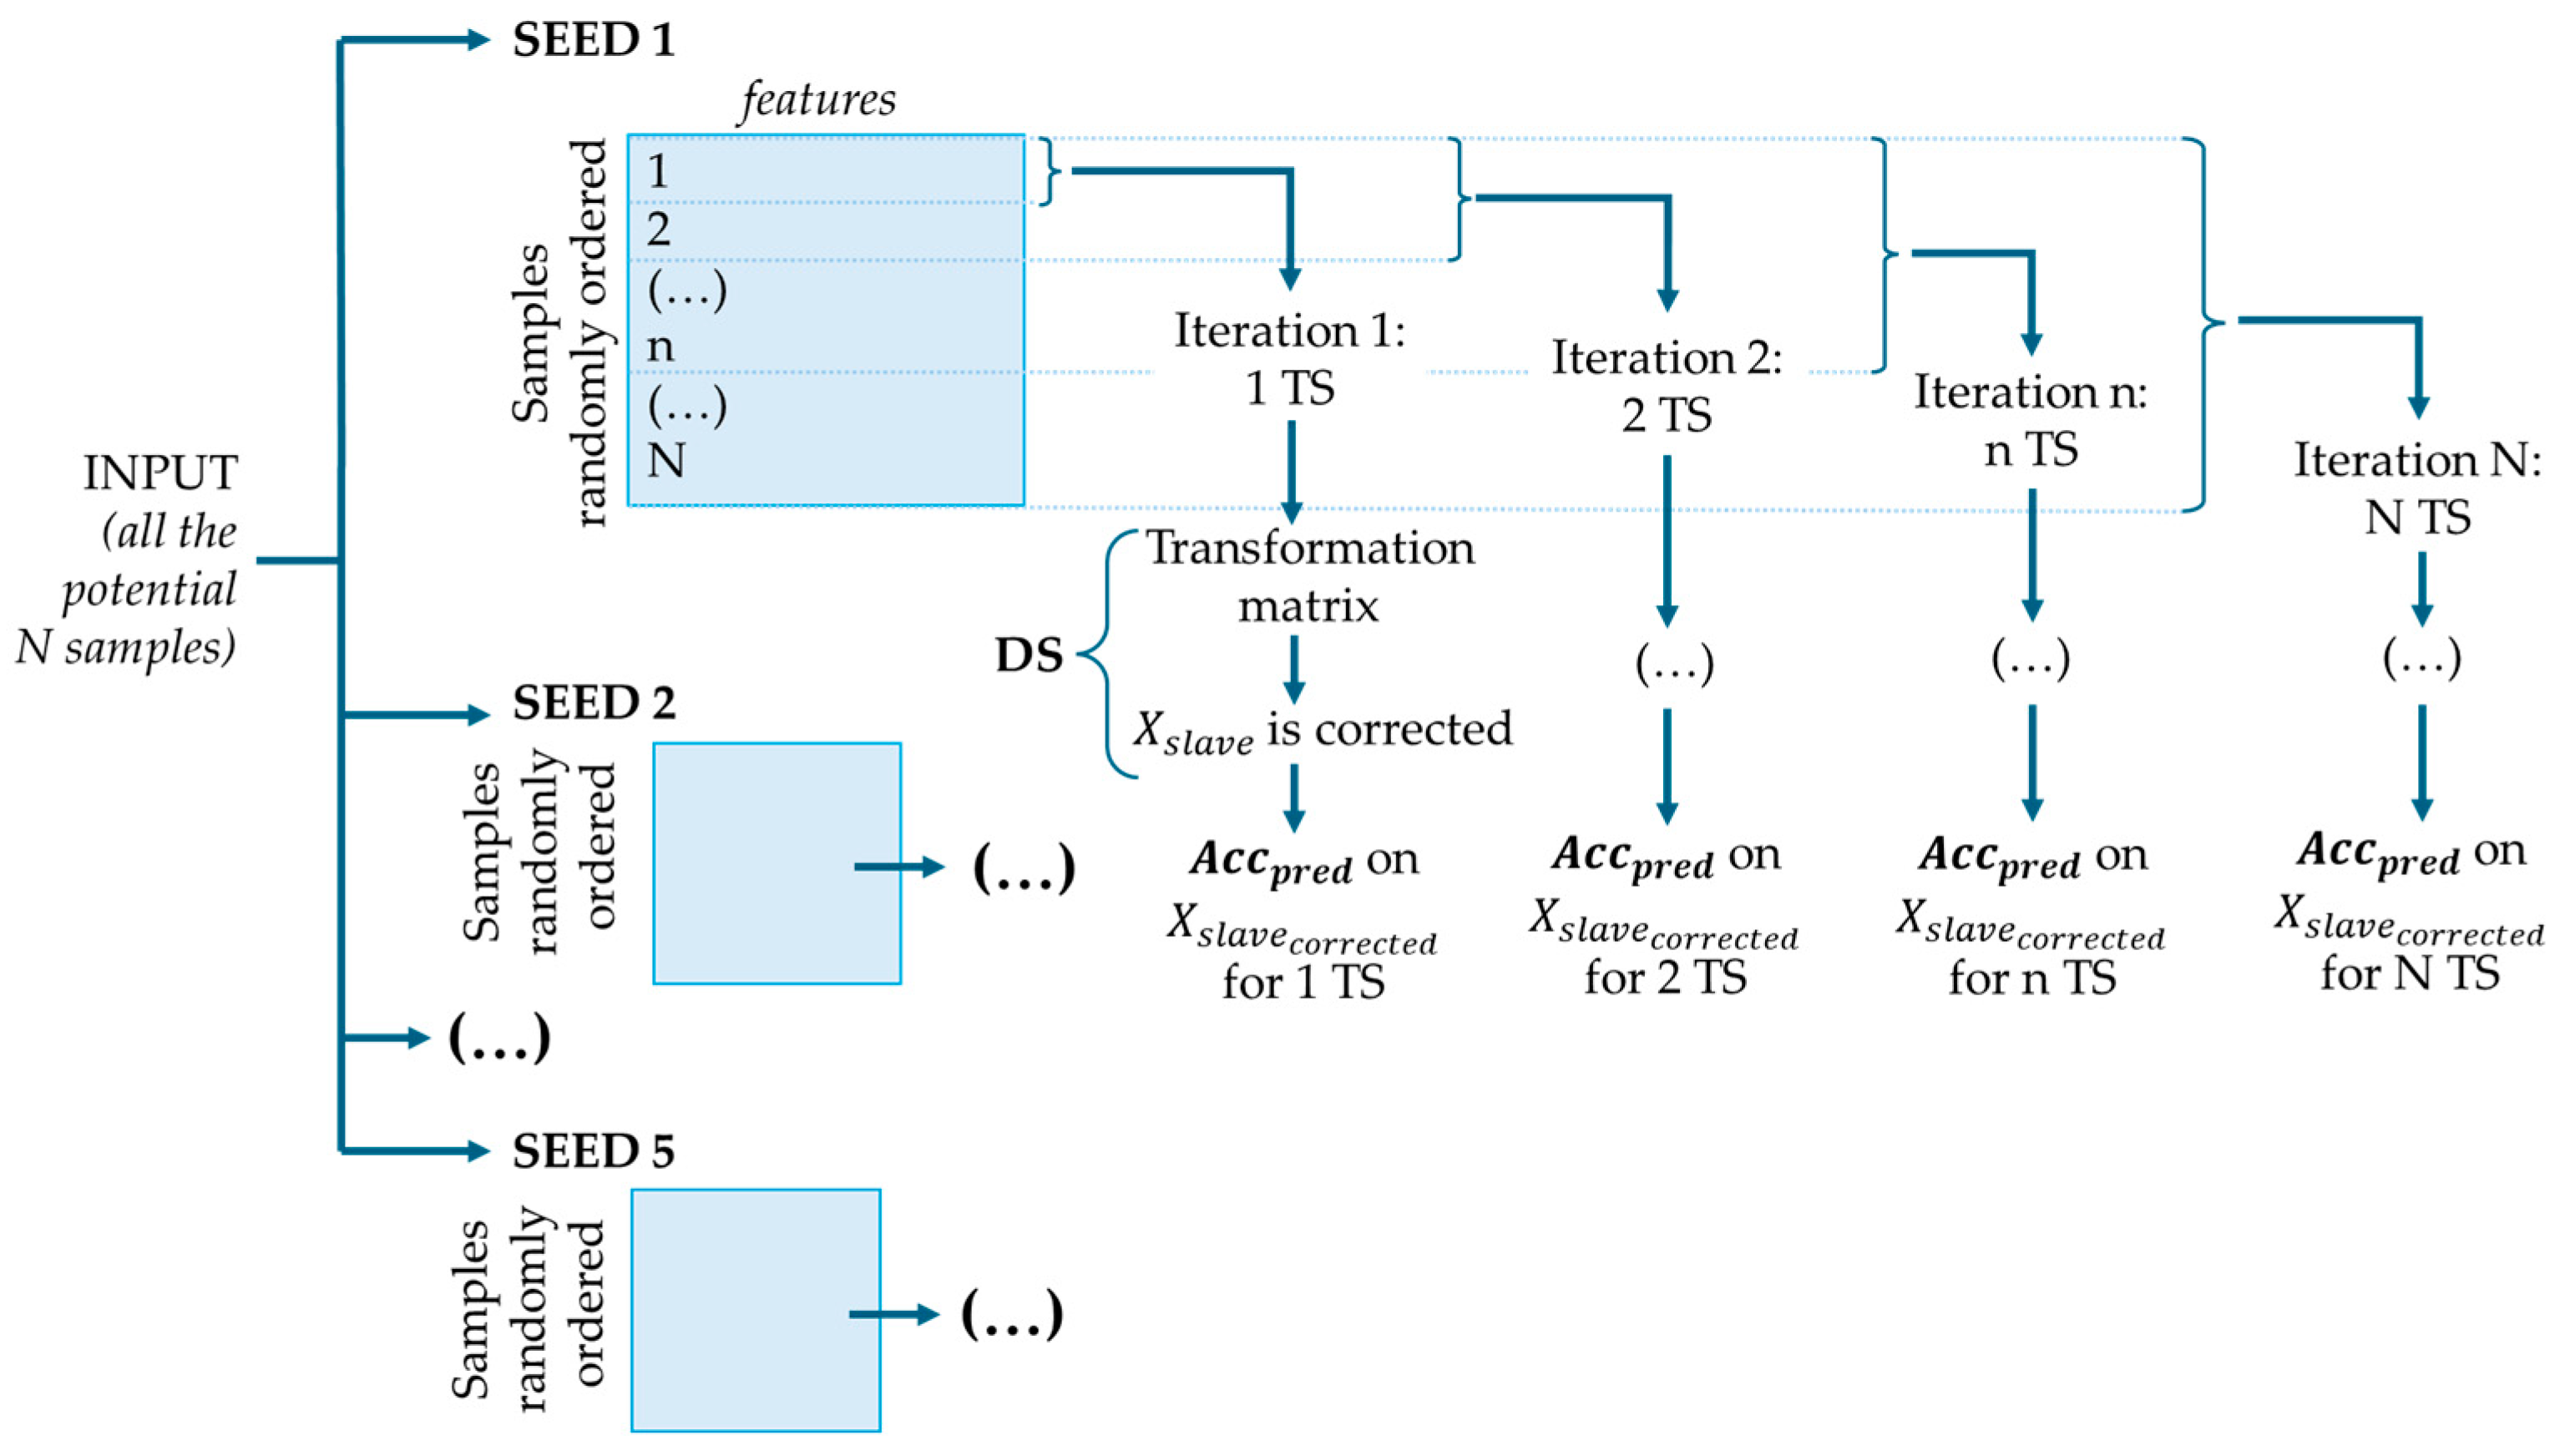
3.3.2. Transfer Samples Selection and Direct Standardization Correction
- V1→V2: Satisfactory prediction accuracies were achieved using all three synthetic mixtures combined, as well as with mixtures #6 and #7 individually. Mixture #6 performed best with a limited number of Transfer Samples (5 TS), while mixture #4 1:5 underperformed. The DBSCAN method with 3 PCs achieved the highest accuracy of 80% (CI95%: 61.4–92.9%) using all mixtures combined with 15 TS.
- V1→V3: Only the combined use of all synthetic mixtures resulted in prediction accuracy values exceeding 70%. While most non-random methods performed well, the number of required TS was relatively high (19–32) also when algorithms for Transfer Samples selection were implemented. The best performance was achieved with the Kennard–Stone method with 3 PCs (77.5% accuracy, CI95%: 60.2–90.3%, with 19 TS).
- V1→V4: performed well using all mixtures or mixture #7. The DBSCAN method with three PCs performed reliably, although the highest accuracy (i.e., 75.4% with CI95%: 58.8–88.6%) was obtained using the KS method with 2 PCs.
- V1 + V2→V3 + V4: This configuration showed strong transferability, particularly with all mixtures used together. Fewer TS were required compared to V1→V3 and V1→V4 to achieve comparable accuracies. Using KS or DBSCAN (with 3 PCs), accuracies of up to 76.9% (CI95%: 59.2–89.5%) were achieved with as few as 8 TS. This contrasts with V1→V3 and V1→V4, which required 19 and 12 TS, respectively, to achieve comparable results. These findings indicate that paired-chamber models, with duplicated sensors, enhance both robustness and transferability, ultimately reducing the number of TS necessary. Even mixture #4 (1:5), which had previously shown limited effectiveness, performed well under these conditions when combined with the KS method and 3 PCs.
4. Discussion and Conclusions
Supplementary Materials
Author Contributions
Funding
Informed Consent Statement
Data Availability Statement
Acknowledgments
Conflicts of Interest
Abbreviations
| DBSCAN | Density-Based Spatial Clustering of Applications with Noise |
| CT | Calibration Transfer |
| DS | Direct Standardization |
| E–Nose | Electronic Nose |
| KS | Kennard–Stone |
| MOS | Metal oxide semiconductor |
| PCs | Principal Components |
| PCA | Principal Component Analysis |
| PLS-DA | Partial Least Squares-Discriminant Analysis |
| TS | Transfer Samples |
| VOC | Volatile Organic Compound |
| VIP | Variable Importance in Projection |
References
- Zhang, L.; Tian, F.C.; Peng, X.W.; Yin, X. A Rapid Discreteness Correction Scheme for Reproducibility Enhancement Among a Batch of MOS Gas Sensors. Sens. Actuators A Phys. 2014, 205, 170–176. [Google Scholar] [CrossRef]
- Marco, S.; Gutiérrez-Gálvez, A. Signal and Data Processing for Machine Olfaction and Chemical Sensing: A Review. IEEE Sens. J. 2011, 12, 3189–3214. [Google Scholar] [CrossRef]
- Zhang, L.; Tian, F.; Zhang, D. Electronic Nose: Algorithmic Challenges, 1st ed.; SpringerLink: London, UK, 2018; ISBN 9789811321672. [Google Scholar]
- da Costa, B.R.B.; De Martinis, B.S. Analysis of Urinary VOCs Using Mass Spectrometric Methods to Diagnose Cancer: A Review. Clin. Mass Spectrom. 2020, 18, 27–37. [Google Scholar] [CrossRef]
- Wilson, P.F.; Freeman, C.G.; McEwan, M.J.; Allardyce, R.A.; Shaw, G.M. SIFT-MS Measurement of VOC Distribution Coefficients in Human Blood Constituents and Urine. Appl. Occup. Environ. Hyg. 2003, 18, 759–763. [Google Scholar] [CrossRef]
- Issitt, T.; Wiggins, L.; Veysey, M.; Sweeney, S.T.; Brackenbury, W.J.; Redeker, K. Volatile Compounds in Human Breath: Critical Review and Meta-Analysis. J. Breath Res. 2022, 16, 024001. [Google Scholar] [CrossRef]
- D’Amico, A.; Pennazza, G.; Santonico, M.; Martinelli, E.; Roscioni, C.; Galluccio, G.; Paolesse, R.; Di Natale, C. An Investigation on Electronic Nose Diagnosis of Lung Cancer. Lung Cancer 2010, 68, 170–176. [Google Scholar] [CrossRef] [PubMed]
- Taverna, G.; Grizzi, F.; Tidu, L.; Bax, C.; Zanoni, M.; Vota, P.; Lotesoriere, B.J.; Prudenza, S.; Magagnin, L.; Langfelder, G.; et al. Accuracy of a New Electronic Nose for Prostate Cancer Diagnosis in Urine Samples. Int. J. Urol. 2022, 29, 890–896. [Google Scholar] [CrossRef]
- Bruins, M.; Rahim, Z.; Bos, A.; Van De Sande, W.W.J.; Endtz, H.P.; Van Belkum, A. Diagnosis of Active Tuberculosis by E-Nose Analysis of Exhaled Air. Tuberculosis 2013, 93, 232–238. [Google Scholar] [CrossRef]
- Lekha, S.; Suchetha, M.S. Real-Time Non-Invasive Detection and Classification of Diabetes Using Modified Convolution Neural Network. IEEE J. Biomed. Health Inform. 2018, 22, 1630–1636. [Google Scholar] [CrossRef]
- Sansone, F.; Tonacci, A. Non-Invasive Diagnostic Approaches for Kidney Disease: The Role of Electronic Nose Systems. Sensors 2024, 24, 6475. [Google Scholar] [CrossRef] [PubMed]
- Feudale, R.N.; Woody, N.A.; Tan, H.; Myles, A.J.; Brown, S.D.; Ferré, J. Transfer of Multivariate Calibration Models: A Review. Chemom. Intell. Lab. Syst. 2002, 64, 181–192. [Google Scholar] [CrossRef]
- Lotesoriere, B.J. Combination of GC-MS and e Nose Analysis for Early Prostate Cancer Detection by Means of Urine Odour Analysis; Politecnico di Milano: Milano, Italy, 2020. [Google Scholar]
- EN 13725:2022; Emissioni da Sorgente Fissa—Determinazione della Concentrazione di Odore Mediante Olfattometria Dinamica e della Portata di Odore. European Committee for Standardization (CEN): Brussels, Belgium, 2022.
- Capelli, L.; Bax, C.; Grizzi, F.; Taverna, G. Optimization of Training and Measurement Protocol for ENose Analysis of Urine Headspace Aimed at Prostate Cancer Diagnosis. Sci. Rep. 2021, 11, 20898. [Google Scholar] [CrossRef]
- Lotesoriere, B.J.; Robbiani, S.; Tischer, A.M.; Corrà, L.; Zanni, E.; Gianfranceschi, A.; Giuffrida, L.; Dellacà, R.; Capelli, L.M.T. Experimental Setup to Study Poisoning Effects of Different Materials on Chemical Sensors Used in E-Nose Systems. J. Sens. Sens. Syst. 2024, 14, 237–247. [Google Scholar] [CrossRef]
- Cucciniello, M. Development and Testing of Novel Sampling Systems for Biological Fluids Characterization by Electronic Noses; Politecnico di Milano: Milano, Italy, 2022. [Google Scholar]
- Garde, A.H.; Hansen, Å.M.; Kristiansen, J.; Knudsen, L.E. Comparison of Uncertainties Related to Standardization of Urine Samples with Volume and Creatinine Concentration. Ann. Occup. Hyg. 2004, 48, 171–179. [Google Scholar] [CrossRef]
- Arndt, T. Urine-Creatinine Concentration as a Marker of Urine Dilution: Reflections Using a Cohort of 45,000 Samples. Forensic Sci. Int. 2009, 186, 48–51. [Google Scholar] [CrossRef] [PubMed]
- Sander, R.; Acree, W.E.; De Visscher, A.; Schwartz, S.E.; Wallington, T.J. Henry’s Law Constants (IUPAC Recommendations 2021). Pure Appl. Chem. 2022, 94, 71–85. [Google Scholar] [CrossRef]
- Putnam, D.F. Composition and Concentrative Properties of Human Urine; National Aeronautics and Space Administration (NASA): Washington, DC, USA, 1971.
- Patro, S.G.K.; Sahu, K.K. Normalization: A Preprocessing Stage. Int. Adv. Res. J. Sci. Eng. Technol. 2015, 2, 20–22. [Google Scholar] [CrossRef]
- Fordellone, M.; Bellincontro, A.; Mencarelli, F. Partial Least Squares Discriminant Analysis: A Dimensionality Reduction Method to Classify Hyperspectral Data. Stat. Appl. Ital. J. Appl. Stat. 2020, 31, 11–13. [Google Scholar] [CrossRef]
- Webb, G.; Sammut, C.; Perlich, C.; Horváth, T.; Wrobel, S.; Korb, K.; Noble, W.; Leslie, C.; Lagoudakis, M.; Quadrianto, N.; et al. Leave-One-Out Cross-Validation. In Encyclopedia of Machine Learning; Springer: Boston, MA, USA, 2011; pp. 600–601. [Google Scholar]
- Kuhn, M. Package “caret”, Classification and Regression Training, R package version 7.0-1; The R Foundation for Statistical Computing: Vienna, Austria, 2024.
- Ding, B.; Gentleman, R. Classification Using Generalized Partial Least Squares. J. Comput. Graph. Stat. 2005, 14, 280–298. [Google Scholar] [CrossRef]
- Szymańska, E.; Saccenti, E.; Smilde, A.K.; Westerhuis, J.A. Double-Check: Validation of Diagnostic Statistics for PLS-DA Models in Metabolomics Studies. Metabolomics 2012, 8, 3–16. [Google Scholar] [CrossRef]
- Grandini, M.; Bagli, E.; Visani, G. Metrics for Multi-Class Classification: An Overview. arXiv 2020, arXiv:2008.05756. [Google Scholar] [CrossRef]
- Galind-Prieto, B. Novel Variable Influence on Projection (VIP) Methods in OPLS, O2PLS, and OnPLS Models for Single-and Multi-Block Variable Selection VIPOPLS, VIPO2PLS, and MB-VIOP Methods. Ph.D. Thesis, Umeå University, Umeå, Sweden, 2017. [Google Scholar]
- Fonollosa, J.; Fernández, L.; Gutiérrez-Gálvez, A.; Huerta, R.; Marco, S. Calibration Transfer and Drift Counteraction in Chemical Sensor Arrays Using Direct Standardization. Sens. Actuators B Chem. 2016, 236, 1044–1053. [Google Scholar] [CrossRef]
- Igne, B.; Hurburgh, C.R. Standardisation of near Infrared Spectrometers: Evaluation of Some Common Techniques for Intra- And Inter-Brand Calibration Transfer. J. Near Infrared Spectrosc. 2008, 16, 539–550. [Google Scholar] [CrossRef]
- De Maesschalck, R.; Jouan-Rimbaud, D.; Massart, D.L. The Mahalanobis Distance. Chemom. Intell. Lab. Syst. 2000, 50, 1–18. [Google Scholar] [CrossRef]
- Hahsler, M.; Piekenbrock, M.; Doran, D. Dbscan: Fast Density-Based Clustering with R. J. Stat. Softw. 2019, 91, 1–30. [Google Scholar] [CrossRef]
- Gardner, J.W.; Boilot, P.; Hines, E.L. Enhancing Electronic Nose Performance by Sensor Selection Using a New Integer-Based Genetic Algorithm Approach. Sens. Actuators B Chem. 2005, 106, 114–121. [Google Scholar] [CrossRef]
- Wahl, H.G.; Hoffmann, A.; Luft, D.; Liebich, H.M. Analysis of Volatile Organic Compounds in Human Urine by Headspace Gas Chromatography–Mass Spectrometry with a Multipurpose Sampler. J. Chromatogr. A 1999, 847, 117–125. [Google Scholar] [CrossRef] [PubMed]
- Bouatra, S.; Aziat, F.; Mandal, R.; Guo, A.C.; Wilson, M.R.; Knox, C.; Bjorndahl, T.C.; Krishnamurthy, R.; Saleem, F.; Liu, P.; et al. The Human Urine Metabolome. PLoS ONE 2013, 8, e73076. [Google Scholar] [CrossRef]
- Guneral, F.; Bachmann, C. Age-Related Reference Values for Urinary Organic Acids in a Healthy Turkish Pediatric Population. Clin. Chem. 1994, 40, 862–868. [Google Scholar] [CrossRef]
- Gronwald, W.; Klein, M.S.; Zeltner, R.; Schulze, B.-D.; Reinhold, S.W.; Deutschmann, M.; Immervoll, A.-K.; Böger, C.A.; Banas, B.; Eckardt, K.-U.; et al. Detection of Autosomal Dominant Polycystic Kidney Disease by NMR Spectroscopic Fingerprinting of Urine. Kidney Int. 2011, 79, 1244–1253. [Google Scholar] [CrossRef]
- Takeuchi, A.; Takigawa, T.; Abe, M.; Kawai, T.; Endo, Y.; Yasugi, T.; Endo, G.; Ogino, K. Determination of Formaldehyde in Urine by Headspace Gas Chromatography. Bull. Environ. Contam. Toxicol. 2007, 79, 1–4. [Google Scholar] [CrossRef] [PubMed]
- Hušek, P.; Švagera, Z.; Hanzlíková, D.; Řimnáčová, L.; Zahradníčková, H.; Opekarová, I.; Šimek, P. Profiling of Urinary Amino-Carboxylic Metabolites by in-Situ Heptafluorobutyl Chloroformate Mediated Sample Preparation and Gas Chromatography–Mass Spectrometry. J. Chromatogr. A 2016, 1443, 211–232. [Google Scholar] [CrossRef]
- Lentner, C. Geigy Scientific Tables, 8th edition. Vol. 1. Units of Measurement. Body Fluids. Composition of the Body. Nutrition. 1981, 298 pp. Vol. 2. Introduction to Statistics. Statistical Tables. Mathematical Formulae. 1982, 241 pp. Vol. 3. Physical Chemistry. Composition of the Blood. Haematology. Human Somatometric Data. 1984, 359 pp. Vol. 4. Biochemistry. Metabolism of Xenobiotics. Inborn Error of Metabolism. Pharmacogenetics and Ecogenetics. 1986, 330 pp. Ciba-Geigy, Basel, £12.50 each volume. Distributed in U.K. by Farrand Press. J. Appl. Toxicol. 1987, 7, 413. [Google Scholar] [CrossRef]
- Mochalski, P.; Unterkofler, K. Quantification of Selected Volatile Organic Compounds in Human Urine by Gas Chromatography Selective Reagent Ionization Time of Flight Mass Spectrometry (GC-SRI-TOF-MS) Coupled with Head-Space Solid-Phase Microextraction (HS-SPME). Analyst 2016, 141, 4796–4803. [Google Scholar] [CrossRef]
- National Library of Medicine. Hazardous Substances Data Bank (HSDB); National Library of Medicine: Bethesda, MD, USA, 2015. Available online: https://www.nlm.nih.gov/toxnet/index.html (accessed on 23 June 2025).
- Kuhn, B.; Hilpert, H.; Benz, J.; Binggeli, A.; Grether, U.; Humm, R.; Märki, H.P.; Meyer, M.; Mohr, P. Structure-Based Design of Indole Propionic Acids as Novel PPARα/γ Co-Agonists. Bioorganic Med. Chem. Lett. 2006, 16, 4016–4020. [Google Scholar] [CrossRef]
- Leng, C.; Kish, J.D.; Roberts, J.E.; Dwebi, I.; Chon, N.; Liu, Y. Temperature-Dependent Henry’s Law Constants of Atmospheric Amines. J. Phys. Chem. A 2015, 119, 8884–8891. [Google Scholar] [CrossRef]
- Parsons, G.H.; Rochester, C.H.; Wood, C.E.C. Effect of 4-Substitution on the Thermodynamics of Hydration of Phenol and the Phenoxide Anion. J. Chem. Soc. B Phys. Org. 1971, 533–536. [Google Scholar] [CrossRef]
- Parsons, G.H.; Rochester, C.H.; Rostron, A.; Sykes, P.C. The Thermodynamics of Hydration of Phenols. J. Chem. Soc. Perkin Trans. 2 1972, 2, 136–138. [Google Scholar] [CrossRef]
- Snider, J.R.; Dawson, G.A. Tropospheric Light Alcohols, Carbonyls, and Acetonitrile: Concentrations in the Southwestern United States and Henry’s Law Data. J. Geophys. Res. Atmos. 1985, 90, 3797–3805. [Google Scholar] [CrossRef]
- Betterton, E.A.; Hoffmann, M.R. Henry’s Law Constants of Some Environmentally Important Aldehydes. Environ. Sci. Technol. 1988, 22, 1415–1418. [Google Scholar] [CrossRef] [PubMed]
- Mackay, D.; Shiu, W.-Y.; Shiu, W.-Y.; Lee, S.C. Handbook of Physical-Chemical Properties and Environmental Fate for Organic Chemicals; CRC Press: Boca Raton, FA, USA, 2006; ISBN 9780429150074. [Google Scholar]
- Butler, J.A.V.; Ramchandani, C.N. The Solubility of Non-Electrolytes. Part II. The Influence of the Polar Group on the Free Energy of Hydration of Aliphatic Compounds. J. Chem. Soc. 1935, 952–955. [Google Scholar] [CrossRef]
- Abraham, J.L. Identification and Quantitative Analysis of Tissue Particulate Burden. Ann. N. Y. Acad. Sci. 1984, 428, 60–67. [Google Scholar] [CrossRef] [PubMed]
- Johnson, B.J.; Betterton, E.A.; Craig, D. Henry’s Law Coefficients of Formic and Acetic Acids. J. Atmos. Chem. 1996, 24, 113–119. [Google Scholar] [CrossRef]
- Hartungen, E.; von Wisthaler, A.; Mikoviny, T.; Jaksch, D.; Boscaini, E.; Dunphy, P.J.; Märk, T.D. Proton-Transfer-Reaction Mass Spectrometry (PTR-MS) of Carboxylic Acids. Int. J. Mass. Spectrom. 2004, 239, 243–248. [Google Scholar] [CrossRef]
- Khan, I.; Brimblecombe, P.; Clegg, S.L. Solubilities of Pyruvic Acid and the Lower (C1–C6) Carboxylic Acids. Experimental Determination of Equilibrium Vapour Pressures Above Pure Aqueous and Salt Solutions. J. Atmos. Chem. 1995, 22, 285–302. [Google Scholar] [CrossRef]
- U.S. EPA. Air Quality Criteria for Oxides of Nitrogen; U.S. Environmental Protection Agency: Washington, DC, USA, 1982.
- Janini, G.M.; Quaddora, L.A. Determination of Activity Coefficients of Oxygenated Hydrocarbons by Liquid-Liquid Chromatography. J. Liq. Chromatogr. 1985, 9, 39–53. [Google Scholar] [CrossRef]


| Number of Sensors | ||||||
|---|---|---|---|---|---|---|
| Chamber | TGS2602 | TGS2603 | TGS2610 | TGS2620 | TGS2611 | TGS2600 |
| A | 1× | 1× | 2× | 1× | 1× | 2× |
| B | 1× | 1× | 1× | 2× | 2× | 1× |
| C | 2× | 2× | 1× | 1× | 1× | 1× |
| V1 | 1× | 1× | 1× | 1× | 1× | 1× |
| V2 | 1× | 1× | 1× | 1× | 1× | 1× |
| V3 | 1× | 1× | 1× | 1× | 1× | 1× |
| V4 | 1× | 1× | 1× | 1× | 1× | 1× |
| Portion | Class | ID |
|---|---|---|
| 1 | Pure Urine | B1 pure |
| 2 | B2 pure | |
| 3 | B3 pure | |
| 4 | B4 pure | |
| 5 | B5 pure | |
| 6 | B6 pure | |
| 7 | Urine spiked with acetone | B1 + acetone |
| 8 | B2 + acetone | |
| 9 | B3 + acetone | |
| 10 | B4 + acetone | |
| 11 | B5 + acetone | |
| 12 | B6 + acetone | |
| 13 | Urine spiked with 4-heptanone | B1 + 4-heptanone |
| 14 | B2 + 4-heptanone | |
| 15 | B3 + 4-heptanone | |
| 16 | B4 + 4-heptanone | |
| 17 | B5 + 4-heptanone | |
| 18 | B6 + 4-heptanone |
| VOCs | Concentration () |
|---|---|
| 4-Heptanone | 1.56 × 10⁻⁴ |
| Trimethylamine | 2.46 × 10⁻³ |
| p-Cresol | 5.38 × 10⁻² |
| Methanol | 1.67 × 10⁻² |
| Acetaldehyde | 1.62 × 10⁻³ |
| 2-Butanone | 5.49 × 10⁻³ |
| Acetone | 3.22 × 10⁻³ |
| Acetic acid | 8.28 × 10⁻³ |
| Isobutyric acid | 3.54 × 10⁻³ |
| Propionic acid | 2.47 × 10⁻³ |
| Method | Inputs | Description | Advantages/Limitations |
|---|---|---|---|
| Kennard–Stone Algorithm (Mahalanobis distance) | Selected features | Samples ordered based on Mahalanobis distance, to homogeneously cover the analysis space. | Advantages: homogeneous coverage of the space; reproducible. Limitations: samples located at the edges of the space may represent atypical behaviours and reduce the representativeness of the main data distribution. |
| 2 PCs scores | |||
| 3 PCs scores | |||
| Extremes + Densest Cluster (DBSCAN) | 2 PCs scores | Selection of extremes and central points from the densest cluster using DBSCAN | Advantages: balances diversity and density. Limitations: when few Transfer Samples are used, the selected set may overrepresent uncommon behaviours. |
| 3 PCs scores | |||
| Random Selection | Selected features | Random selection of Transfer Samples. | Advantages: provides baseline comparison; simple and unbiased towards feature distribution. Limitations: non–reproducible; typically lower and more unstable accuracy. |
| Chamber(s) Configuration | Average Internal Accuracy [%] | Internal Accuracy Range [%] | Average Prediction Accuracy [%] | Prediction Accuracy Range [%] |
|---|---|---|---|---|
| A | 79.6 | (78.5–80.7) | 76.1 | (73.3–78.8) |
| B | 81.6 | (80.6–82.5) | 78.4 | (75.9–80.9) |
| C | 77.4 | (76.1–78.7) | 75.5 | (72.6–78.4) |
| V1 | 80.6 | (79.5–81.7) | 74.8 | (72.2–77.5) |
| V2 | 79.6 | (78.5–80.6) | 76.9 | (74.6–79.3) |
| V3 | 77.3 | (76–78.6) | 73.5 | (70.5–76.4) |
| V4 | 76.9 | (75.8–78.1) | 73.5 | (70.8–76.1) |
| V1 + V2 | 82.8 | (81.7–83.9) | 81.3 | (78.7–83.8) |
| V1 + V3 | 79.6 | (78.3–80.8) | 78.4 | (75.6–81.2) |
| V1 + V4 | 80 | (79–81) | 77.3 | (74.5–80) |
| V2 + V3 | 81.9 | (80.8–83.1) | 78.4 | (75.9–80.9) |
| V2 + V4 | 82.5 | (81.2–83.7) | 81.4 | (78.6–84.1) |
| V3 + V4 | 78.8 | (77.7–80.1) | 73.2 | (70.2–76.1) |
| Synthetic #4 1:5 [mV] | Synthetic #6 [mV] | Synthetic #7 [mV] | Real Urine [mV] | |
|---|---|---|---|---|
| AVERAGE: | 110.6 | 164.6 | 103.8 | 107.0 |
| STDEV: | 15.25 | 18.42 | 8.71 | 14.37 |
| #4 1:5 | #6 | #7 | |
|---|---|---|---|
| Liquid Species: | μL/Lwater | μL/Lwater | μL/Lwater |
| 4-heptanone | 0.10 | 0.10 | 0.02 |
| Acetone | 0.27 | 0.66 | 0.66 |
| Trimethylamine | 2.05 | 2.05 | 0.29 |
| Acetaldehyde | 0.27 | 0.50 | 0.50 |
| 2-butanone | 0.92 | 0.92 | 0 |
| Methanol | 1.84 | 4.52 | 4.52 |
| Acetic acid | 1.38 | 1.59 | 1.59 |
| Isobutyric acid | 1.68 | 1.68 | 1.24 |
| Propionic acid | 0.41 | 0.41 | 0.17 |
| Ammonia | 24.50 | 24.50 | 24.50 |
| Solid Species | mg/Lwater | mg/Lwater | mg/Lwater |
| P-cresol | 9.23 | 9.23 | 1.45 |
| V1→V2 | Method | Input | All Synthetic Samples Together (from #4 1:5, #6, #7) | Samples of #6 | Samples of #4 1:5 | Samples of #7 |
|---|---|---|---|---|---|---|
| Kennard–Stone (Mahalanobis distance) | PC1 and PC2 | 57.1% 21 TS | 70% 5 TS | 54.3% 3 TS | 62.8% 3 TS | |
| PC1, PC2 and PC3 | 67.1% 20 TS | 55.7% 8 TS | 50% 3 TS | 62.9% 6 TS | ||
| Features | 51.4% 2 TS | 60% 3 TS | 51.4% 3 TS | 55.7% 13 TS | ||
| Extremes + Dense cluster (DBSCAN) | PC1 and PC2 | 57.1% 21 TS | 74.3% 5 TS | 54.3% 7 TS | 68.6% 4 TS | |
| PC1, PC2 and PC3 | 80% 15 TS | 74.3% 5 TS | 52.8% 5 TS | 75.7% 6 TS | ||
| Random selection | 74.3% 10 TS | 62.8% 8 TS | 50% 10 TS | 52.8% 2 TS |
| V1→V3 | Method | Input | All Synthetic Samples Together (from #4 1:5, #6, #7) | Samples of #6 | Samples of #4 1:5 | Samples of #7 |
|---|---|---|---|---|---|---|
| Kennard–Stone (Mahalanobis distance) | PC1 and PC2 | 73.2% 29 TS | 61.9% 2 TS | 43.6% 6 TS | 56.3% 14 TS | |
| PC1, PC2 and PC3 | 77.5% 19 TS | 66.2% 9 TS | 56.3% 2 TS | 57.8% 13 TS | ||
| Features | 71.8% 28 TS | 59.2% 2 TS | 52.1% 7 TS | 50.7% 14 TS | ||
| Extremes + Dense cluster (DBSCAN) | PC1 and PC2 | 71.8% 32 TS | 50.7% 9 TS | 47.9% 13 TS | 53.5% 3 TS | |
| PC1, PC2 and PC3 | 71.8% 32 TS | 50.7% 8 TS | 46.5% 11 TS | 64.8% 7 TS | ||
| Random selection | 66.2% 23 TS | 47.9% 9 TS | 42.3% 10 TS | 63.4% 5 TS |
| V1→V4 | Method | Input | All Synthetic Samples Together (from #4 1:5, #6, #7) | Samples of #6 | Samples of #4 1:5 | Samples of #7 |
|---|---|---|---|---|---|---|
| Kennard–Stone (Mahalanobis distance) | PC1 and PC2 | 75.4% 12 TS | 47.7% 10 TS | 63.1% 14 TS | 53.9% 2 TS | |
| PC1, PC2 and PC3 | 64.6% 26 TS | 63.1% 5 TS | 63.1% 14 TS | 53.9% 3 TS | ||
| Features | 69.2% 23 TS | 53.9% 10 TS | 63.1% 14 TS | 64.6% 4 TS | ||
| Extremes + Dense cluster (DBSCAN) | PC1 and PC2 | 64.6% 12 TS | 61.5% 3 TS | 56.9% 3 TS | 70.8% 5 TS | |
| PC1, PC2 and PC3 | 70.8% 22 TS | 61.5% 3 TS | 56.9% 3 TS | 70.8% 5 TS | ||
| Random selection | 67.7% 13 TS | 63.1% 4 TS | 56.9% 3 TS | 64.6% 4 TS |
| V1 + V2 → V3 + V4 | Method | Input | All Synthetic Samples Together (from #4 1:5, #6, #7) | Samples of #6 | Samples of #4 1:5 | Samples of #7 |
|---|---|---|---|---|---|---|
| Kennard–Stone (Mahalanobis distance) | PC1 and PC2 | 76.9% 8 TS | 67.8% 6 TS | 53.9% 7 TS | 69.2% 12 TS | |
| PC1, PC2 and PC3 | 76.9% 11 TS | 58.5% 7 TS | 73.9% 9 TS | 69.2% 12 TS | ||
| Features | 73.2% 8 TS | 55.4% 3 TS | 63.1% 8 TS | 69.2% 12 TS | ||
| Extremes + Dense cluster (DBSCAN) | PC1 and PC2 | 73.2% 30 TS | 61.5% 5 TS | 50.8% 3 TS | 69.2% 12 TS | |
| PC1, PC2 and PC3 | 70.4% 8 TS | 47.7% 11 TS | 47.7% 11 TS | 64.6% 8 TS | ||
| Random selection | 67.7% 8 TS | 58.5% 3 TS | 63.1% 7 TS | 63.1% 9 TS |
| Master–Slave | Prediction Accuracy Without DS Correction | Prediction Accuracy with DS Correction and No. of Transfer Samples (TS) | Method and Synthetic Mixture(s) Used |
|---|---|---|---|
| V1→V2 | 37.1% (CI95%: 20.2–58%) | 80%–15 TS (CI95%: 61.4–92.9%) | Extremes + Dense Cluster (DBSCAN), 3 PCs. 3 mixtures together. |
| V1→V3 | 40.9% (CI95%: 23.6–62.5%) | 77.5%–19 TS (CI95%: 60.2–90.3%) | KS, 3 PCs. 3 mixtures together. |
| V1→V4 | 54.9% CI95%: 36.2–75.4%) | 75.4%–12 TS (CI95%: 58.8–88.6%) | KS, 2 PCs. 3 mixtures together. |
| V1 + V2 →V3 + V4 | 54.9% (CI95%: 36.2–75.4%) | 76.9%–8 TS (CI95%: 59.2–89.5%) | KS, 2 PCs. 3 mixtures together. |
Disclaimer/Publisher’s Note: The statements, opinions and data contained in all publications are solely those of the individual author(s) and contributor(s) and not of MDPI and/or the editor(s). MDPI and/or the editor(s) disclaim responsibility for any injury to people or property resulting from any ideas, methods, instructions or products referred to in the content. |
© 2025 by the authors. Licensee MDPI, Basel, Switzerland. This article is an open access article distributed under the terms and conditions of the Creative Commons Attribution (CC BY) license (https://creativecommons.org/licenses/by/4.0/).
Share and Cite
Cassinerio, M.; Lotesoriere, B.J.; Robbiani, S.; Zanni, E.; Grizzi, F.; Taverna, G.; Dellacà, R.; Capelli, L.M.T. Development of a Calibration Transfer Methodology and Experimental Setup for Urine Headspace Analysis. Chemosensors 2025, 13, 395. https://doi.org/10.3390/chemosensors13110395
Cassinerio M, Lotesoriere BJ, Robbiani S, Zanni E, Grizzi F, Taverna G, Dellacà R, Capelli LMT. Development of a Calibration Transfer Methodology and Experimental Setup for Urine Headspace Analysis. Chemosensors. 2025; 13(11):395. https://doi.org/10.3390/chemosensors13110395
Chicago/Turabian StyleCassinerio, Michela, Beatrice Julia Lotesoriere, Stefano Robbiani, Emanuele Zanni, Fabio Grizzi, Gianluigi Taverna, Raffaele Dellacà, and Laura Maria Teresa Capelli. 2025. "Development of a Calibration Transfer Methodology and Experimental Setup for Urine Headspace Analysis" Chemosensors 13, no. 11: 395. https://doi.org/10.3390/chemosensors13110395
APA StyleCassinerio, M., Lotesoriere, B. J., Robbiani, S., Zanni, E., Grizzi, F., Taverna, G., Dellacà, R., & Capelli, L. M. T. (2025). Development of a Calibration Transfer Methodology and Experimental Setup for Urine Headspace Analysis. Chemosensors, 13(11), 395. https://doi.org/10.3390/chemosensors13110395


