Article

Highly Selective and Stable Electrochemical Sensor for Hydrogen Peroxide—Application in Cosmetics Quality Control

1
Department of Organic Chemistry and Inorganic Chemistry, University of Food Technologies, 26, Maritsa Blvd., 4002 Plovdiv, Bulgaria
2
Laboratory on Biosensors, Centre for Competence PERIMED, University of Plovdiv, 21, Kostaki Peev St., 4000 Plovdiv, Bulgaria
3
Department of Physical Chemistry, University of Plovdiv “Paisii Hilendarski”, 24, Tsar Assen St., 4000 Plovdiv, Bulgaria
*
Author to whom correspondence should be addressed.
Chemosensors 2025, 13(11), 376; https://doi.org/10.3390/chemosensors13110376
Submission received: 28 September 2025 / Revised: 23 October 2025 / Accepted: 23 October 2025 / Published: 25 October 2025
(This article belongs to the Special Issue Nanostructured Materials for Electrochemical Sensing)

Abstract

Nowadays, electrochemical sensors have become a popular topic in cosmetics quality control. A simple and stable electrochemical sensor for hydrogen peroxide (H2O2) was developed on the basis of a rhodium-modified glassy carbon electrode (Rh/GCE). A quick, one-step, reproducible, and cost-effective electrodeposition procedure was applied to modify GCE with Rh nanoparticles. The sensor shows a high selectivity for H2O2 at a low applied potential of −0.1 V (vs. Ag/AgCl, 3 M KCl), with an excellent stability and good repeatability (RSD = 3.2%; n = 5). The modified electrode Rh/GCE demonstrates a high sensitivity of 172.24 ± 1.95 μA mM−1 cm−2 (n = 3), a linear response to H2O2 between 5 and 1000 µM, and a detection limit estimated to be 1.2 µM. Furthermore, Rh/GCE has been successfully used to measure H2O2 concentrations in hair dye and antiseptic solution, yielding satisfactory recovery rates. These findings highlight the potential of the Rh/GCE for the reliable quantitative detection of H2O2 in complex cosmetics matrices.

1. Introduction

Hydrogen peroxide (H2O2) is an active and widely used oxidizing agent with a bleaching and whitening effect, commonly found in household products and personal care items. In the fields of personal care and cosmetics, H2O2 is classified as an antimicrobial agent, a cosmetic biocide, an oral health care agent and an oxidizer [1]. Hydrogen peroxide is the active component in various cosmetics, such as hair dyes, hair lighteners, and oral hygiene products (mouth rinses, dentifrices, tooth-whitening products). Additionally, 3% H2O2 is easily available for purchase as an antiseptic solution.
For decades, H2O2 has been used in the hairdressing industry in hair coloring formulations. Hair bleaching methods are oxidative processes, and H2O2 is the most frequently used oxidant because it is an excellent decolorizing agent for melanin (natural hair pigment). Permanent hair dyes are the most common type of hair dye, producing a long-lasting effect that is resistant to washing. Briefly, the two components—“colorant” (that contains the dye precursors and an alkaline agent) and “developer” (which contains H2O2)—are mixed immediately before the use. Alkaline agents swell the hair cuticles, allowing the coloring molecules to penetrate deeper into the cortex. The dye precursors are oxidized by H2O2 to form quinone diimine intermediates, which then react with coloring couplers to give the final reaction product—large polynuclear structures that become entrapped inside the hair shaft [2,3]. The balance of H2O2 and dye precursors can be adjusted by manufacturers to achieve a lightening, darkening, or matching of the hair’s natural color.
The use of H2O2 in cosmetic products is covered by strict legislation due to its unwanted side effects, including skin irritation, burning, gum irritation, tooth sensitivity, cytotoxicity, and pain conduction in dental pulp stem cells [4], hair dye-induced dermatitis, and even hair loss [3,5]. The European Commission (EC) restricts the amount of H2O2 in cosmetic products—a maximum concentration of 4% H2O2 in products applied to the skin and 12% H2O2 in products applied to the hair [6]. Dyes intended for use on eyelashes are safe when they contain up to 2% H2O2 [6]. H2O2 is an aggressive oxidizer that damages human skin; therefore, a concentration of H2O2 higher than 20% is considered to be highly hazardous. The EC Scientific Committee on Consumer Safety, SCCS, concluded that the use of oral hygiene and tooth-whitening products containing up to 0.1% H2O2 does not pose a risk to consumer health. Products containing more than 0.1% H2O2 should be exclusively administered under the supervision of a qualified dental professional.
Thus, the rapid and reliable detection of H2O2 in cosmetics is of great significance for ensuring human health. For the H2O2 assay, various strategies have been investigated, including titration [7], HPLC [8], spectrophotometry [9], and chemiluminescence [10]. However, these methods require specific, expensive equipment, and involve time-consuming and labor-intensive sample preparation steps.
Electroanalysis is becoming a hot topic in the field of cosmetic quality control [11,12,13,14,15,16,17,18]. Electrochemical sensors are compact, portable devices that enable the fast, precise, and low-cost quantitative detection of the target analytes. These analytical systems offer practical advantages, including simplicity, high sensitivity, extremely low limits of detection (LOD) and quantification (LOQ), wide dynamic range, and the possibility of automated measurements. Thus, the electrochemical sensors serve as a particularly suitable alternative to the traditional analytical techniques (most often titrimetric and spectrophotometric) currently applied in laboratories.
The electrochemical non-enzymatic detection of H2O2 is based on two-electron oxidation (Equation (1)) or reduction (Equation (2)) on the surface of an electrocatalyst:
H 2 O 2 2 H + + O 2 + 2 e
H 2 O 2 + 2 e + 2 H + 2 H 2 O
The main disadvantage of electrochemical sensors based on the electrooxidation of H2O2 is the need for repeated calibration as well as accounting for the co-oxidation of electroactive species present in real samples that affect the response. Electrochemical platforms based on the electroreduction of H2O2 at working potentials around and below 0.0 V (vs. Ag/AgCl) represent a promising alternative, providing a practically interference-free response to target analytes. The potential range from −0.2 V to 0.0 V is optimal for electroanalytical measurements—under these conditions, the quantitative determination of H2O2 is highly selective, since the interference of electrochemically active compounds in real samples is minimized or completely eliminated. At this potential range, the effective electroreduction of H2O2 takes place without the interference of molecular oxygen (O2), since oxygen reduction begins around −0.4 V and progressively accelerates with the application of more negative potential values.
Generally, the analytical performance of the electrode is strongly affected by the intrinsic activity and the number of accessible catalytic sites [19,20]. Therefore, sensors based on nanomaterials have demonstrated superior electrocatalytic performance compared to their conventional counterparts. According to recent comprehensive overviews on non-enzymatic catalysts designed for H2O2 electrochemical detection, developing innovative H2O2 sensing materials with controllable particle size and adjustable surface properties through simple, fast, and eco-friendly preparation processes still remains an important direction and a challenge for future research [21,22].
Since 2010, only a few articles regarding the electrochemical determination of H2O2 in cosmetics and personal care products were found [23,24,25,26,27,28,29,30], revealing a research gap in this field. To the best of our knowledge, there are no reports on the detection of H2O2 in cosmetics using Rh-modified electrodes. The proposed modified electrode Rh/GCE has significant advantages over previously reported H2O2 sensors, both in electrochemical behavior and in real-sample applications. The sensing platform enables single-step fabrication, demonstrates an excellent stability and good reproducibility for H2O2 detection, and provides the accurate measurement of H2O2 levels in real cosmetic and antiseptic samples. The use of Rh/GCE in the presence of dissolved oxygen holds promise for the development of portable electroanalytical devices for the in-field analysis of H2O2, especially for cosmetics quality control.

2. Materials and Methods

2.1. Materials

RhCl3 × nH2O, HCl, H2O2 (30%), NaOH, Na2HPO4.12H2O, NaH2PO4.2H2O, NaNO3, Na2SO4, Na2S2O3, Na-EDTA, KCl, KI, Mg(NO3)2, and (NH4)2MoO4 were purchased from Fluka. K3[Fe(CN)6], K4[Fe(CN)6], and H3PO4 were purchased from Merck KGaA, Darmstadt, Germany. Salicylic acid and glycerol were purchased from Sigma-Aldrich Co. St Louis, USA. Starch was obtained from POCH (Poland). All the reagents used were of analytical grade. Double-distilled water was used to prepare aqueous solutions. Phosphate-buffered solution PBS (0.1 M, pH 7.0) was made of monobasic and dibasic sodium phosphates. The pH was adjusted by adding 0.5 M NaOH.
All the solutions used in the electrochemical studies were prepared immediately before the experiment. The working solution 0.03 M H2O2 was freshly prepared and stored in an ice bath. A solution containing 5 mM K3[Fe(CN)6] and 5 mM K4[Fe(CN)6], dissolved in 0.1 M KCl, was used in the determination of the electrochemical surface area, ECSA.
For the real sample analysis of commercial products, an antiseptic solution (3% H2O2) and a commercial hair dye sample (obtained from a local market) were used.
The working electrode was a disk from glassy carbon with a diameter of the working surface of 3 mm and visible surface area of ca. 7.07 mm2 (Metrohm, Utrecht, The Netherlands).

2.2. Apparatus and Measurements

SEM micrographs and Energy Dispersive Spectroscopy (EDS) studies of Rh/GCE were performed with a JEOL 6390 Scanning Electron Microscope equipped with an INCA (Oxford Instruments, UK) EDS analyser for elemental analysis. The elemental analyses were carried out at a landing voltage of 5 kV.
The electrochemical measurements were performed using EmStat3 (PalmSens BV, Houten, The Netherlands) interfaced with a computer and controlled by PSTrace 5.5 software and an electrochemical workstation Vionic (Metrohm, Utrecht, The Netherlands) controlled by INTELLO software, version 1.6. A conventional three-electrode system was employed comprising a glassy carbon electrode (GCE) modified with rhodium particles as the working electrode, a platinum wire as a counter electrode, and Ag/AgCl (3 M KCl) as a reference electrode. All the electrochemical experiments were carried out under ambient conditions (22–25 °C).
Cyclic voltammetry (CV) and amperometry at a constant potential (Amp.) were used for examination of electrochemical properties of the electrode and H2O2 analysis procedures.
Before the determination of electrochemically accessible surface area, the unmodified glassy carbon electrode was activated by running 3–5 sets of cyclic voltammograms in a solution containing 5 mM K3[Fe(CN)6] and 5 mM K4[Fe(CN)6], dissolved in 0.1 M KCl, at scan rates varying between 50 and 316 mV s−1 until reproducible CVs were obtained.
The experimental data were processed by software package “OriginPro 2015”.

2.3. Electrochemical Deposition of Rhodium onto GCE

An optimized methodology was used for the electrodeposition of rhodium [31]. Briefly, prior to the modification, the GCE surface was carefully polished with 0.05 µm alumina slurry, followed by sonication in double-distilled water for 5 min. After bath sonication, the electrode was rinsed with double-distilled water and allowed to dry at room temperature. Rhodium was electrodeposited onto GCE from electrolyte containing 2% w/v RhCl3 (dissolved in 0.1 M HCl) by means of CV (1 cycle at a scan rate of 100 mV s−1). The electrode surface was seeded with rhodium particles when starting the cycle at −0.3 V, and then the scan went up to 0.9 and returned to −0.3 V. During the electrodeposition process, an average of 8.75 ± 0.15 μg of Rh was deposited onto the GCE surface, as calculated based on the amount of charge that passed, determined from the CVs (between 29.6 and 30.5 μC). The modified Rh/GCE was subsequently rinsed with double-distilled water and employed for the electrochemical studies.

2.4. Reference Method for Determination of H2O2 in Hair-Care Products

The official testing of cosmetic products conducted by any laboratory (national, control, etc.) must follow the European official methods of analysis. We adhered to the Directive 82/434/EEC (page 33), which outlines the official testing requirements for cosmetic products [32].

3. Results and Discussion

3.1. Scanning Electron Microscopy Studies

In Figure 1, rhodium particles electrodeposited onto glassy carbon by means of cyclic voltammetry at different magnifications are depicted. The deposits are mostly quasi-spherical or oval, with a textured surface, and range between 80 and 250 nm in diameter. Smaller particles were ingrown between larger ones. Some structures form clusters of 2 to 6 units, most probably due to the closely placed nucleation sites that merged upon particle growth. The electrodeposits were spread evenly on the substrate surface, with no large bare regions or the formation of overgrown islands. Surface coverage varies between 25 and 30%, with a moderate particle density.
The elemental analysis (EDS) of the electrodeposits (Figure S1b–d) indicates that smaller particles (Figure S1a—blue area) consist of pure rhodium laid over the carbon substrate. The EDS spectra of larger particles (Figure S1a—green area) indicate the presence of trace amounts of oxygen (1.95 ± 0.19 wt.%) along with rhodium deposits set on the glassy carbon support. It is plausible that the presence of oxygen is caused by its chemisorption over the Rh surface, and most probably the smaller particles are also covered with surface oxides that fall below the detection limits of the equipment. On the bare substrate (Figure S1a—purple area), neither oxygen nor rhodium were detected, as elucidated by the energy dispersive spectrum (Figure S1d).

3.2. Electrochemical Characterization

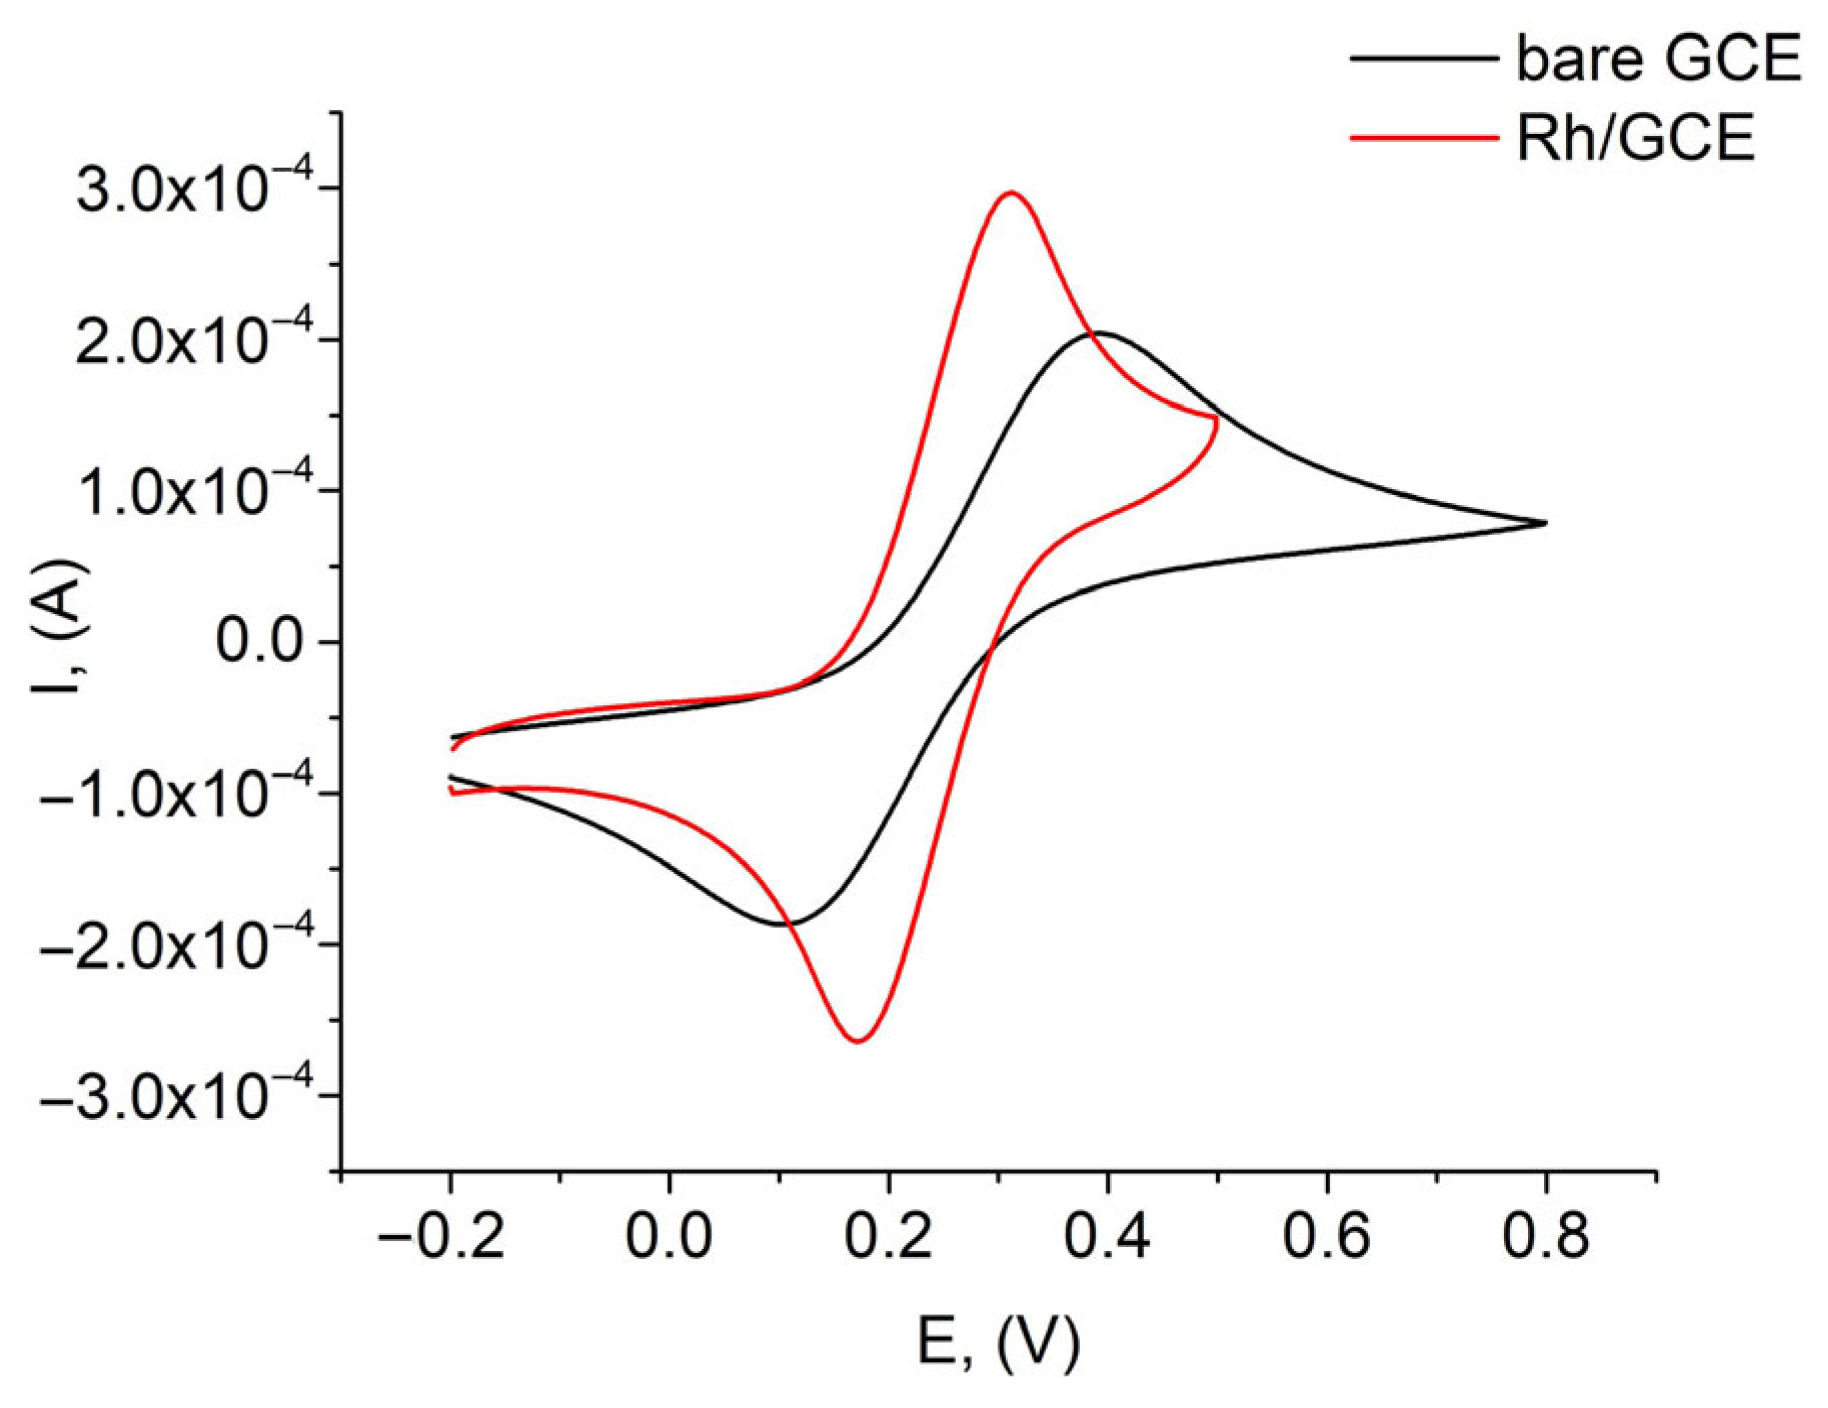
The ferri/ferrocyanide redox probe in 0.1 M KCl has been employed as a model system to study the electrochemical characteristics of the bare GCE and the surface-modified electrode Rh/GCE. The cyclic voltammograms (CVs) registered in the presence of [Fe(CN)6]3−/4− show the characteristics of anodic and cathodic peaks of the reversible probe (Figure 2). A comparison of the measured CVs shows a higher current intensity from the electroactive probe when it was exposed to the Rh/GCE in comparison to the unmodified GCE. The peak-to-peak potential separation (ΔEp) between the anodic and cathodic peaks was found to be 138 mV and 165 mV for the modified and activated bare electrode, respectively, demonstrating a quasi-reversible electrochemistry of the redox process for both the Rh-modified and the bare GCE. Thus, the Rh- modifier of the GCE obviously facilitates to a great extent the electron transfer. The data are fascinating because the increases in the current response and the decreases in ΔEp suggest a remarkable improvement in the electrocatalytic activity. This result can be attributed to the increased surface area and the good conductivity of the metallic structures.
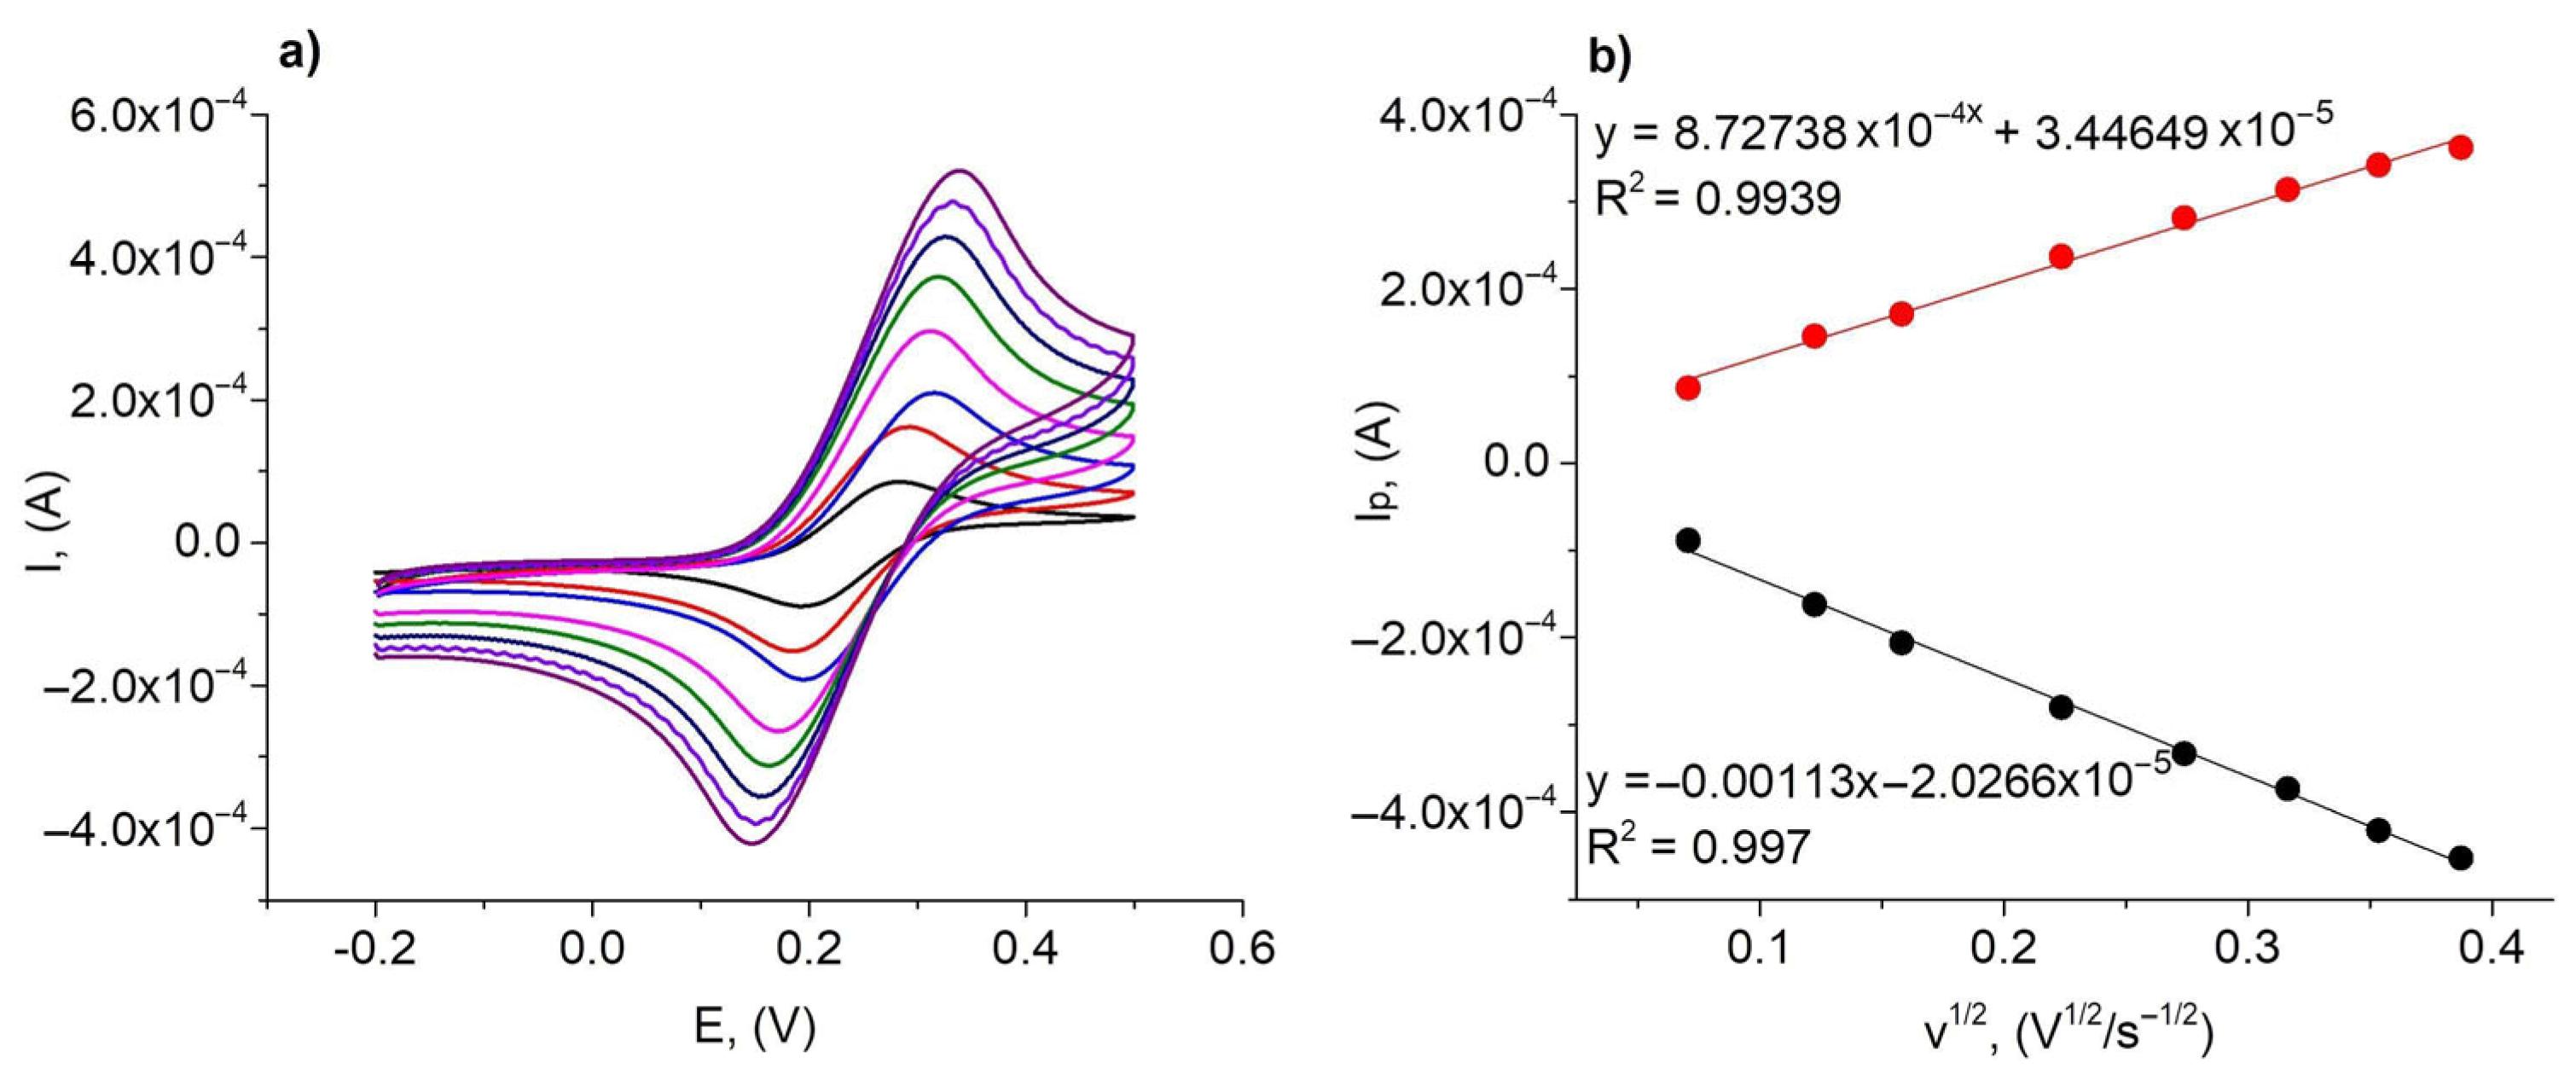
The electroactive surface area for both electrodes was evaluated by performing CVs at different scan rates from 5 to 150 mV s−1 and plotting the cathodic peak current as a function of the square root of the scan rate (Figure 3). The resulting scans for Rh/GCE show that, with increasing scan rates, cathodic peaks shifted towards more positive potentials while the anodic ones went to more negative potentials, respectively (Figure 3a). Based on these results, we performed a linear fit of the anodic ( I p a ) and cathodic ( I p c ) peak currents versus the square root of the scan rate (v1/2) (Figure 3b). The resulting linear equations were calculated to be I p a (µA) = 872.738 v1/2 (V1/2 s−1/2) + 34.4649 (R2 = 0.994) and I p c (µA) = −1130 v1/2 (V1/2 s−1/2) − 20.2661 (R2 = 0.997). These data indicate that the surface reaction at the modified electrode was a diffusion-controlled process.
The linear plot for I p c vs. v 1 / 2 was fitted into the modified Randles–Sevcik Equation (3) to calculate the electroactive surface area of the electrodes:
I p = 0.436 · ( n · F ) 3 / 2 ( R · T ) 1 / 2 · A · C · D 1 / 2 · v 1 / 2
where I p is the peak current (A), v is the scan rate (V s−1), n = 1 (number of electrons involved in the redox reaction), A is the electrode surface area (cm2), D is the diffusion coefficient (D = 7.6 × 10⁻⁶ cm2 s−1), C is the bulk concentration of the redox probe (mol cm−3), F is the Faraday constant (F = 96,480 C mol−1), R is the gas constant (R = 8.314 J mol−1 K−1), and T is the absolute temperature (T = 298 K). The electroactive surface areas for the bare GCE and the Rh/GCE were determined to be 0.193 ± 0.012 and 0.312 ± 0.010 cm2, respectively. The electroactive surface was approximately 1.6 times higher compared to that obtained for the bare GCE.
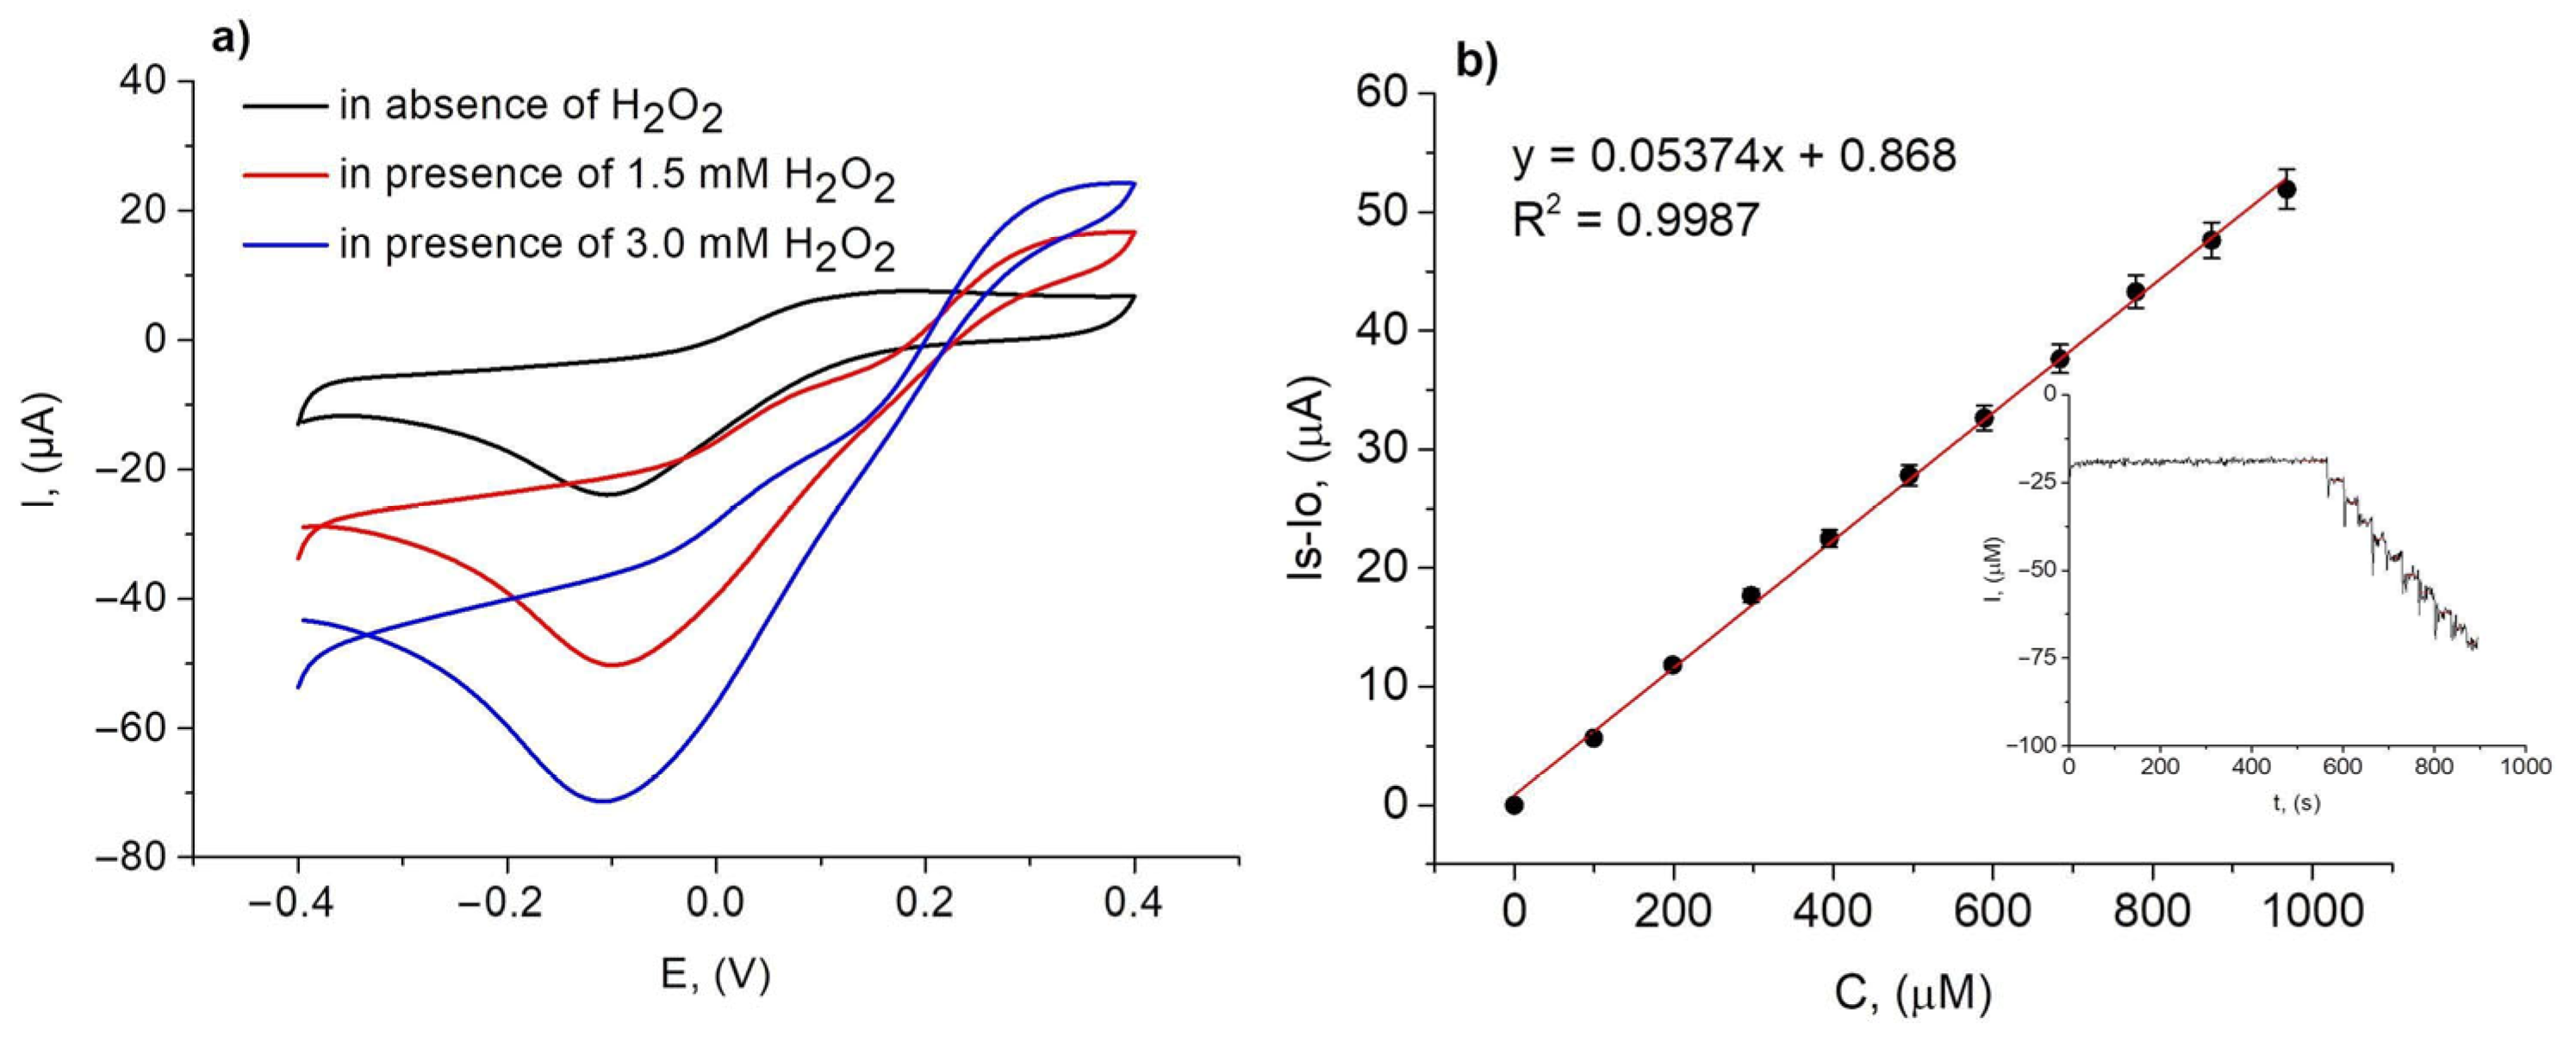
The electrocatalytic properties of the Rh/GCE were examined in 0.1 M PBS (pH 7.0) at a scan rate of 50 mV s−1 using cyclic voltammetry. Figure 4a shows CVs recorded in the supporting electrolyte and in the presence of H2O2. The addition of H2O2 leads to a dramatic change in the voltammetric curve, and an increased cathodic peak was registered. When H2O2 concentration was doubled in the electrolyte, the reduction peak of the analyte became more significant, confirming that the cathodic peak is associated with the H2O2 reduction. These results clearly showed that Rh/GCE can effectively catalyze the H2O2 electrochemical reduction and can be used for quantitative applications.
The amperometric sensing of H2O2 was performed using the hydrodynamic amperometry technique (Figure 4b, inset). We have examined the amperometric response of Rh/GCE to the successive addition of different concentrations of H2O2 at a constant applied potential of −0.1 V. The background current stabilized within 10 s after switching to the detection potential, and the current value was very stable for more than 8 min. As shown in the inset of Figure 4b, a typical stepwise increase in cathodic current was observed in response to H2O2 injections. The increase in the reduction current is linear with the concentration within a wide range between 5 and 1000 µM, and the linear regression equation is I (μM) = 0.05374 (±0.6074 × 10⁻⁴) C (μM) + 0.868 (R2 = 0.9987). From the corresponding calibration curve, a sensitivity of 172.24 ± 1.95 μA mM−1 cm−2 (n = 3) was calculated. The limit of detection (LOD) and limit of quantification (LOQ) were calculated to be 1.2 μM and 4 μM (LOD = 3σ/S and LOQ = 10σ/S, where S is the slope of the calibration curve and σ is the standard deviation of the blank solution).

3.3. Interference Study

The anti-interference capability is an essential factor in assessing the analytical performance of the sensing platform and its practical applicability for cosmetic products. Therefore, to evaluate the specificity and detection capability of the Rh/GCE, we have systematically studied the interference of substances labeled by the manufacturer as components of the hair dye oxidant. According to the information provided, the oxidant contains H2O2, glycerol, salicylic acid, Na-EDTA, and H3PO4.
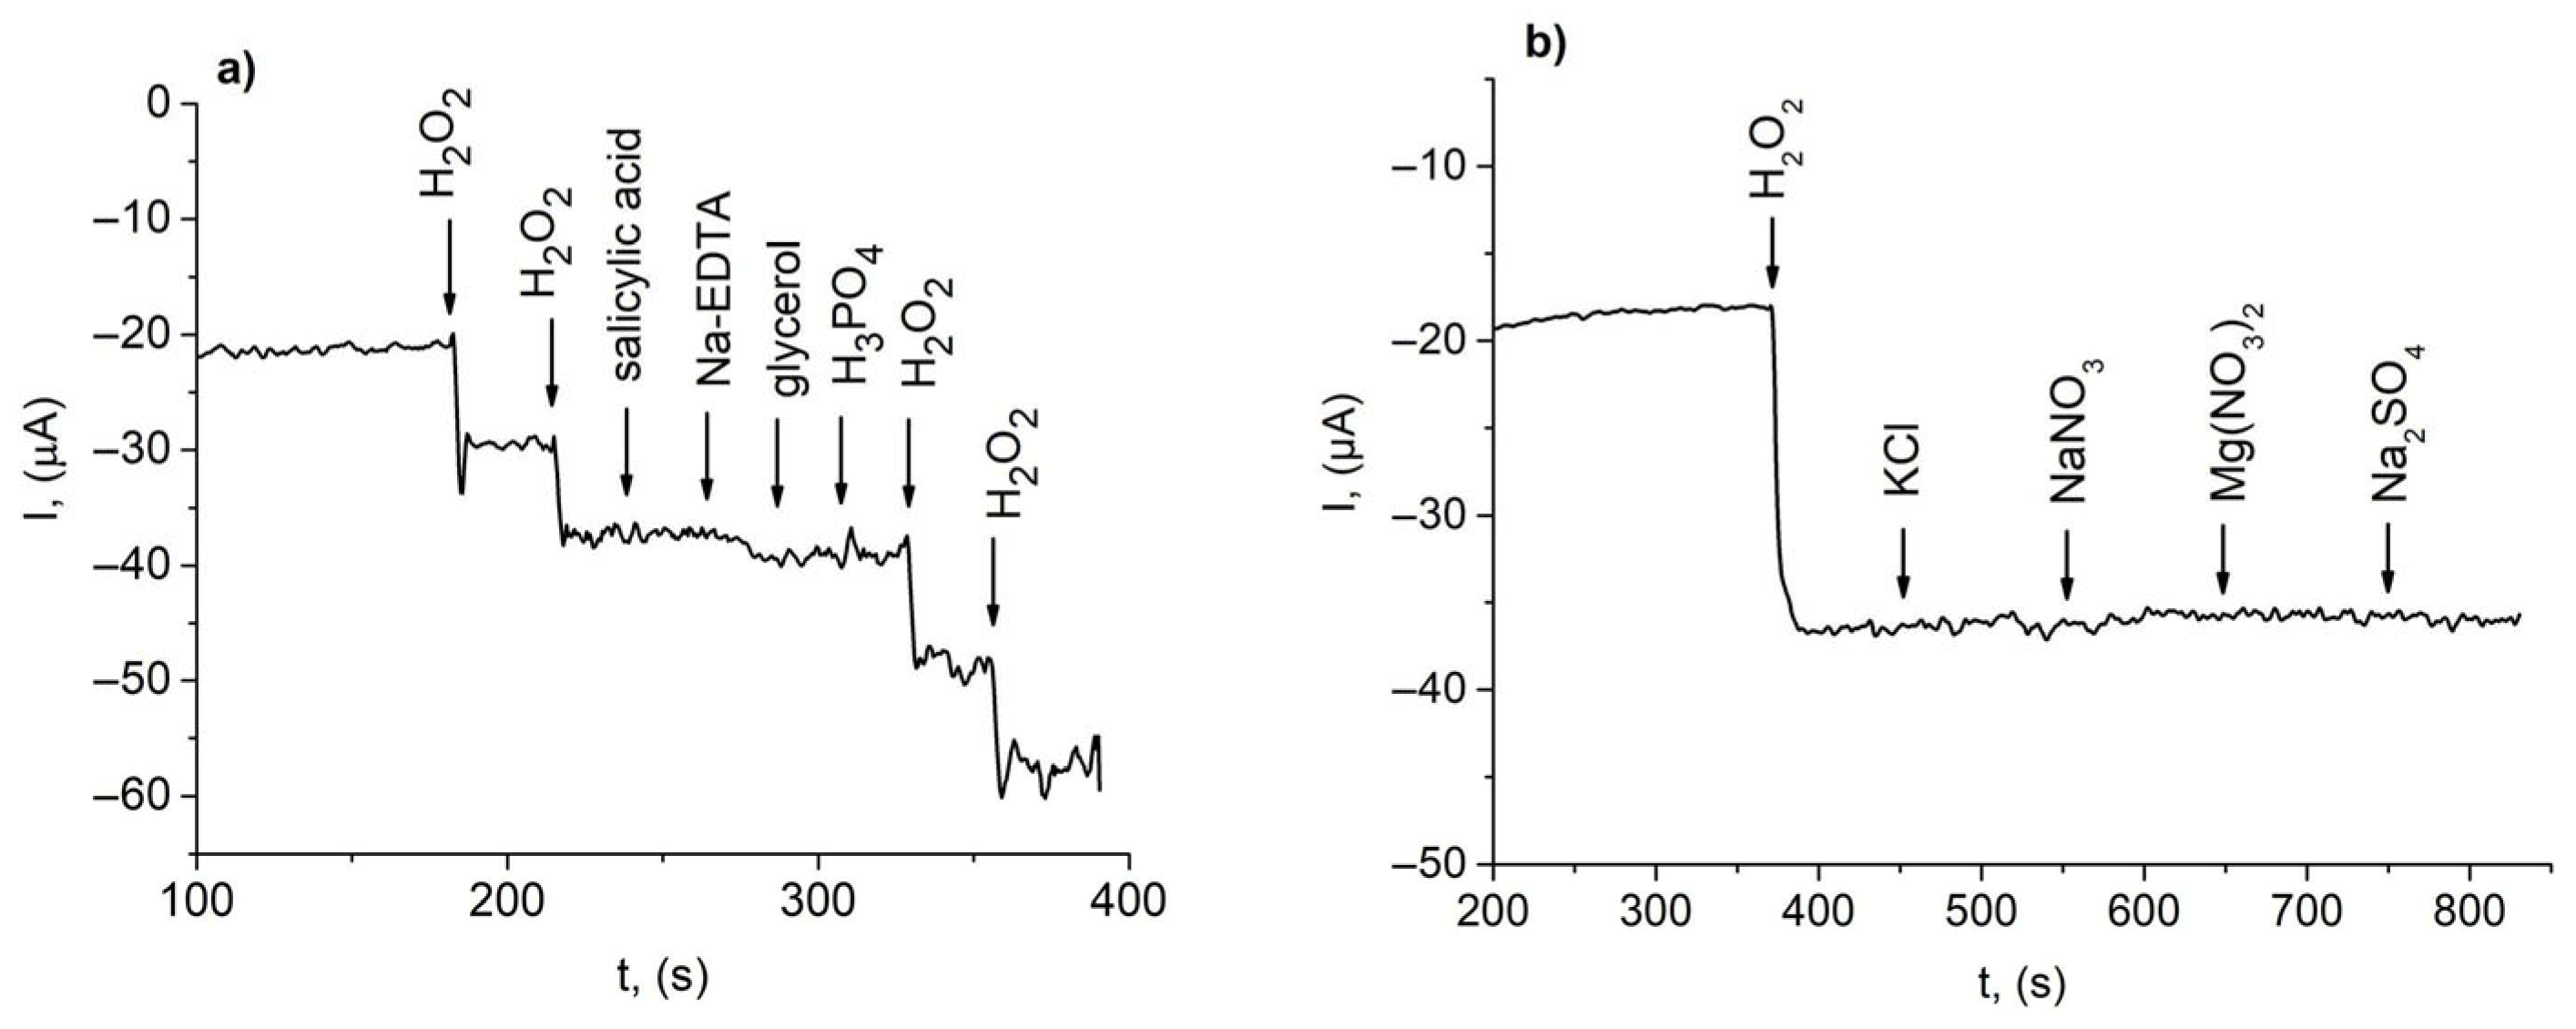
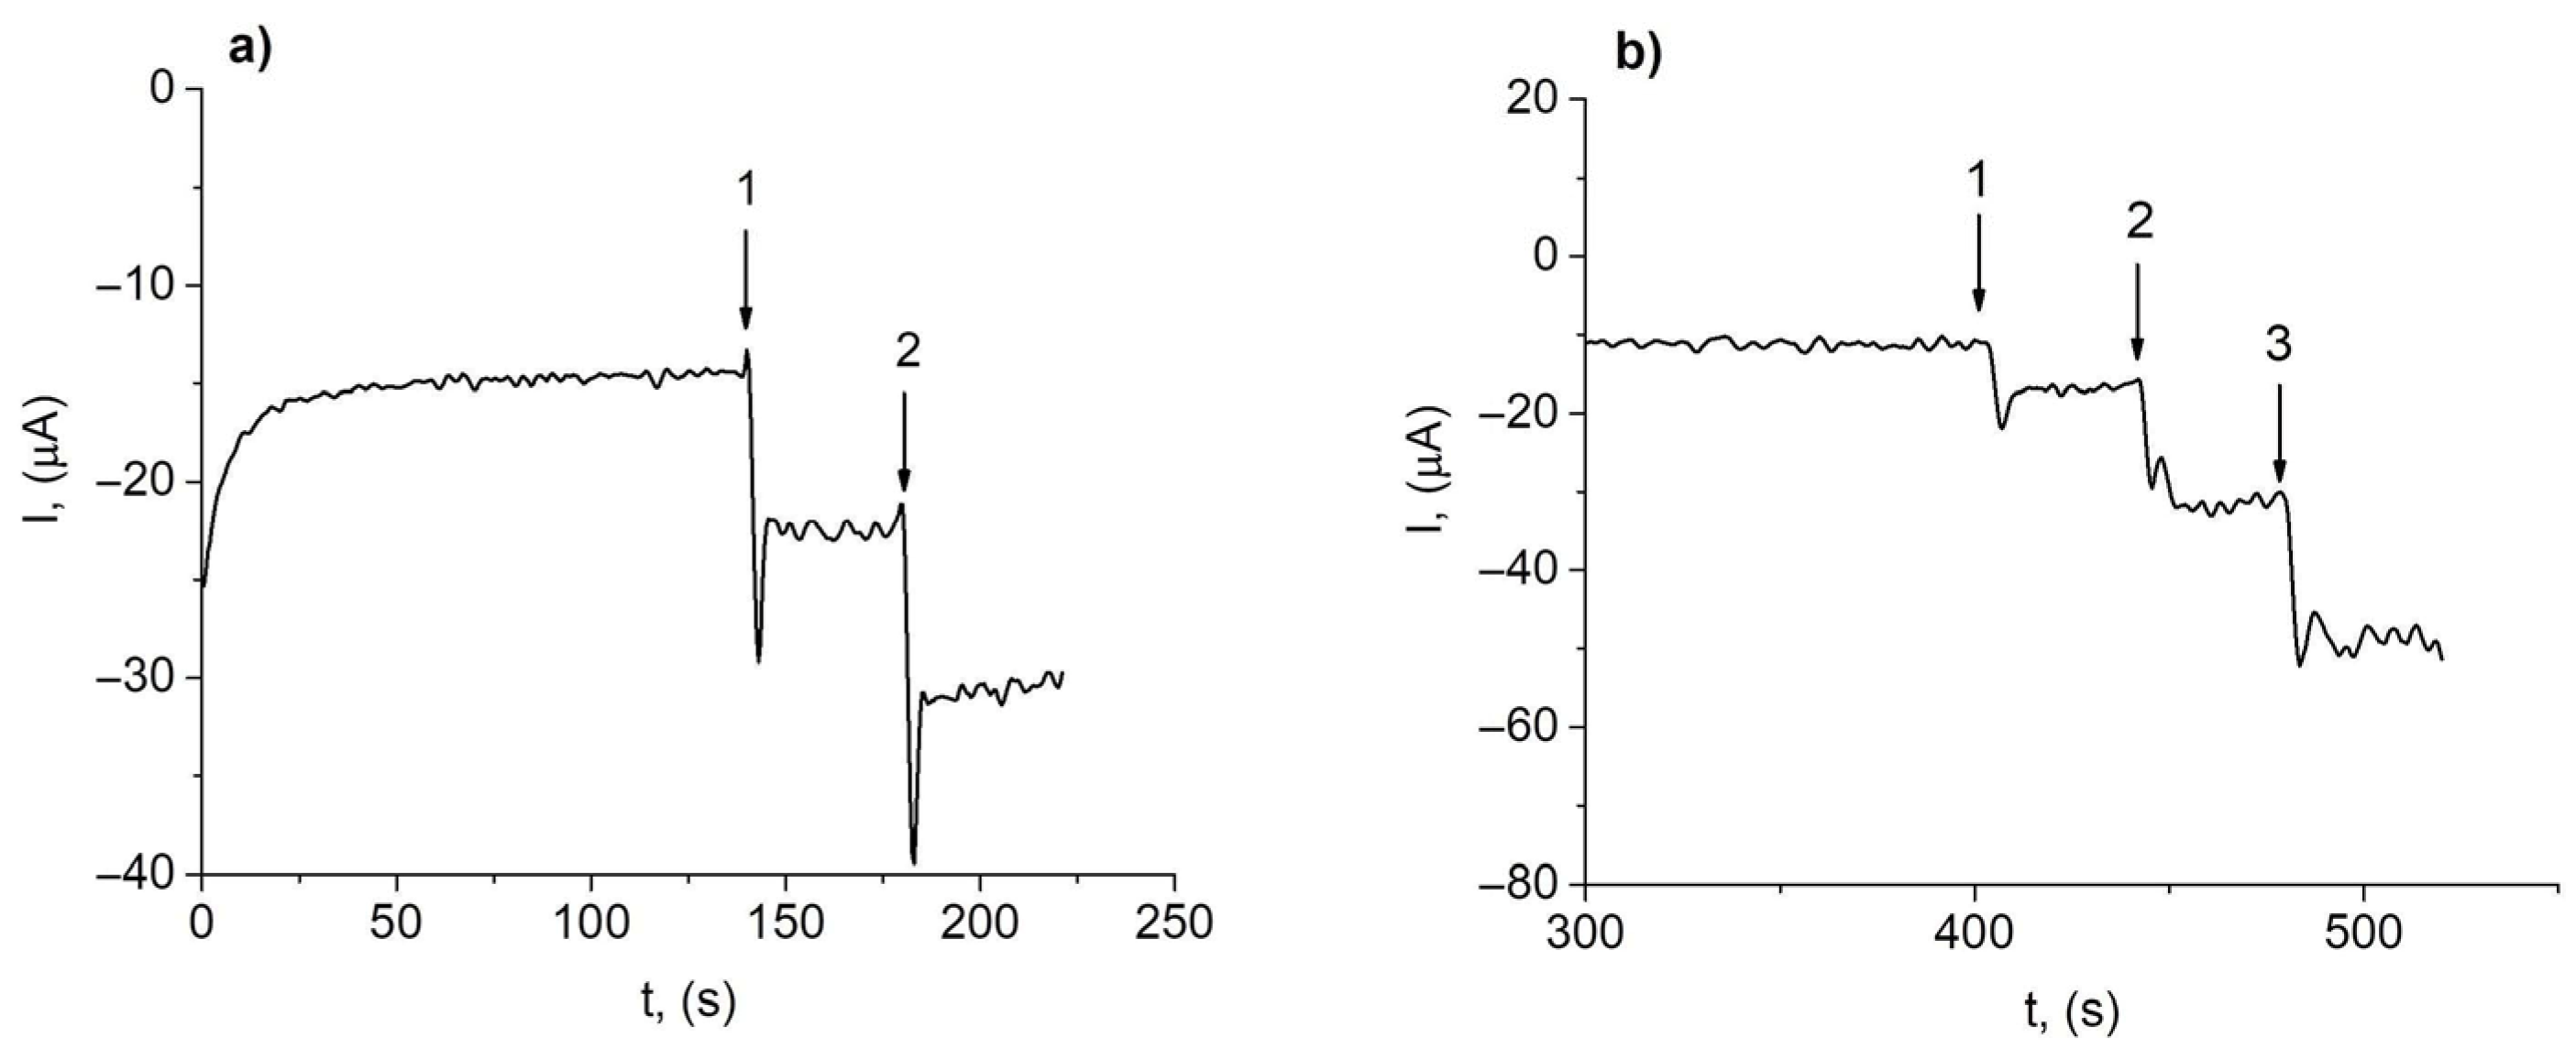
At a constant potential of −0.1 V two injections of H2O2 stock solution were consequently introduced into the electrochemical cell at regular intervals, after which the following were injected in sequence: salicylic acid, Na-EDTA, glycerol, and H3PO4, respectively. The concentrations of these substances in the electrolyte exceeded the concentration of the target analyte (H2O2) by tenfold. Finally, two portions of the H2O2 solution were injected. From the authentic record (Figure 5a) it is evident that the tested substances do not undergo electrochemical processes on Rh/GCE under the given experimental conditions. There was no noticeable current change after the addition of these species; the current response to H2O2 was unaffected and stable, confirming the exceptional selectivity of the proposed platform in the electroreduction of H2O2. Additionally, some common inorganic ions such as K+, Na+, Mg2+, Cl, NO3, and SO42− were also tested, and no alteration of the current intensity was observed (Figure 5b). These mentioned molecules/ions did not interfere with the current response of H2O2. Based on these observations, the fabricated modified electrode can be considered as a highly selective platform toward H2O2 measurement in hair dye oxidant samples.

3.4. Reproducibility, Repeatability, and Stability

In order to examine the reproducibility of the sensor fabrication procedure, three identical electrodes were prepared to detect H2O2 at the same concentration (0.5 mM). The relative standard deviation (RSD) of the current responses for the sensing of H2O2 by the three identically prepared sensors was found to be 4.1%.
The repeatability of amperometric signal of one and the same Rh/GCE was investigated in the presence of 0.5 mM H2O2. The RSD for five independent measurements was calculated to be 3.2%.
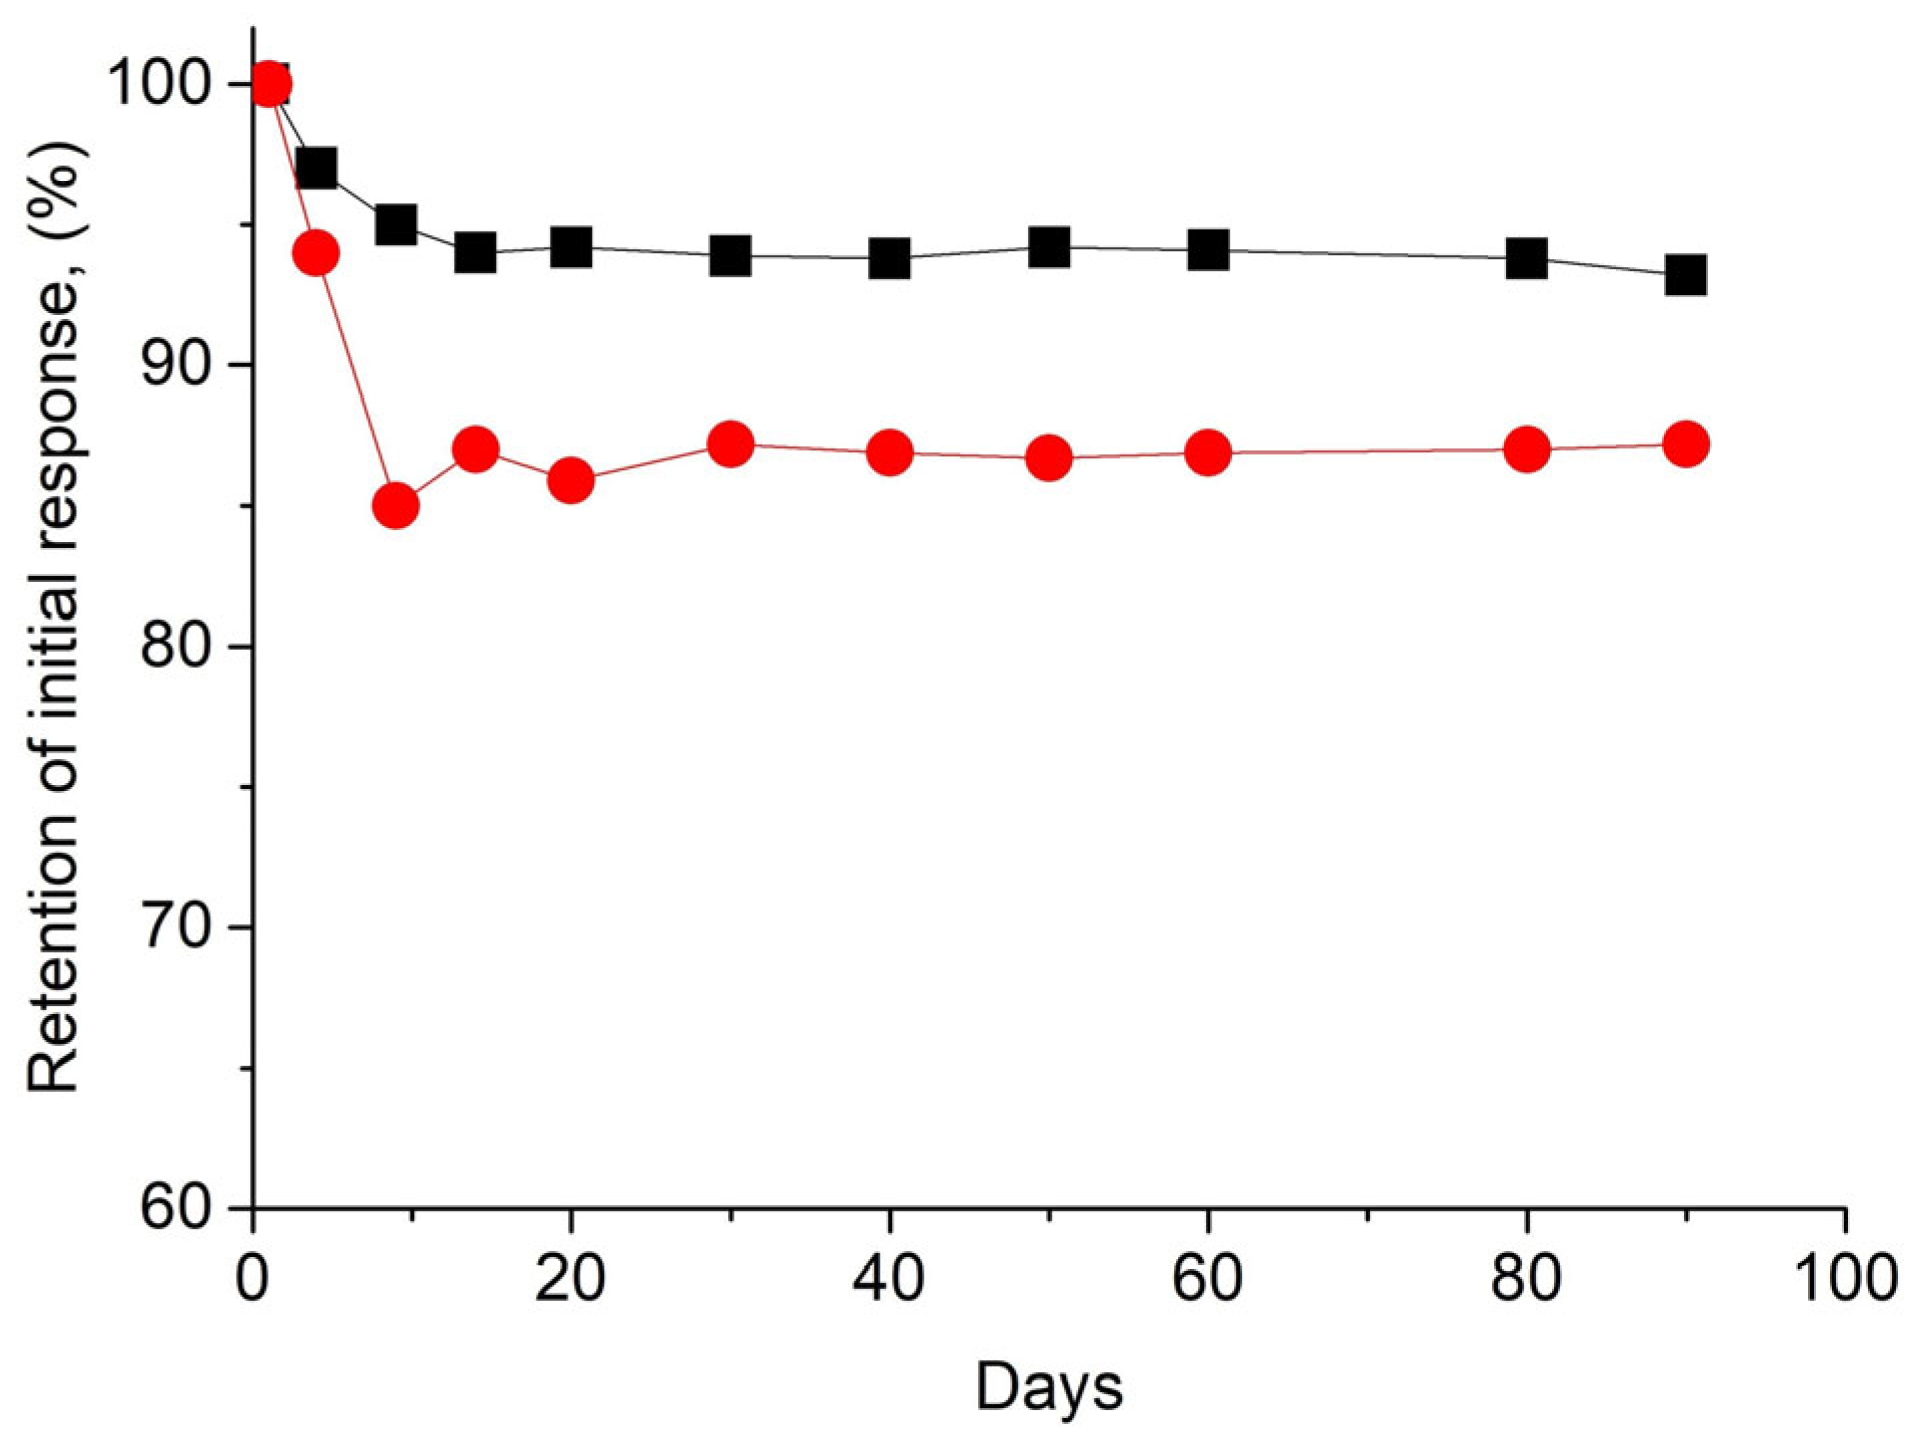
The long-term stability of the proposed modified electrode was also evaluated. Two electrodes of Rh/GCE were stored for 3 months. The residual catalytic activity was monitored by the measurement of the signal in the presence of 0.5 mM H2O2, performed once every 10 days (Figure 6). When the electrode was stored in air at room temperature, a gradual decrease in the signal to 87% of its initial value was recorded within the first 2 weeks, after which the electrode activity remained practically unchanged. When the electrode was stored in double-distilled water, we found a lower decrease in activity. After two weeks of storage, a residual activity of 94% was registered, and it remained virtually unchanged (93%) over the next 3 months. The observed phenomenon is due to the recrystallization processes of the deposited metal phase. The more significant loss of catalytic activity, which registered when the electrode material was stored in air, is most likely caused by the specific adsorption of atmospheric gases, leading to a partial blocking of the active sites on the electrode surface. These data indicate the excellent stability of the rhodium deposits and a high residual activity of the electrode material.

3.5. Application of Rh/GCE for Determination of H2O2 Content in Cosmetic and Medical Products

For the validation of the suitability of the proposed electroanalytical method based on Rh/GCE, the target analyte was determined in the hair dye oxidant sample and pharmaceutical solution sample. First, the modified Rh/GCE was used for the selective quantitative determination of the H2O2 content in a hair dye oxidant. The sample pretreatment included only a dilution: 10 g of the product was dissolved in PBS (pH 7.0) to a total volume of 250 mL before measurement.
The working cell contained 30 mL of supporting electrolyte PBS (pH 7.0). A constant potential of −0.1 V was set on the working electrode (Rh/GCE), and, after establishing a background current, two consecutive equal portions of 60 µL of the sample solution were introduced into the cell. Figure 7a presents the I–t curve recorded in this study. The sensor response after the injection of the real sample is fast and reproducible, proving that the other components of the hair dye oxidant do not affect the signal. The experiment was performed in triplicate (Figure S2). The concentration of H2O2 was found by substituting the current value in the first step in the regression equation obtained for the standard H2O2 solution (Figure 4b). The content of H2O2 in the tested sample was calculated to be 5.91 ± 0.05% (n = 3). Using the same real sample, the electrochemical method was compared to the standard titrimetric method routinely used in laboratory practice. The results of this study using the standard titrimetric method (n = 3) showed that the H2O2 content in the tested sample was 6.11 ± 0.18%. The relative error (RE) was calculated from the ratio as follows:
RE = [100 × (amperometric method − reference method)]/reference method
Relative error RE = −3.27% indicates an excellent agreement between the two methods. These results highlight the potential of Rh/GCE for the rapid, efficient, and accurate detection of H2O2 in complex cosmetics matrices.
The second real sample was a 3.0% medical solution purchased from the local pharmacy. This sample was subjected to dilution as follows: 230 µL was diluted with PBS (pH = 7.0) to a total solution volume of 10 mL. After establishing a background current, portions of the prepared solution were injected into the working cell (30 mL) every 40 s as follows: 150 µL, 400 µL, and 400 µL. Figure 7b presents the authentic record of the electrode signal. From the average value of the registered current in the first step of three independent measurements, and using the calibration curve, we calculated 2.96 ± 0.06% H2O2 content in the studied sample.
Table 1 summarizes the previously reported electrochemical sensors applied for the analysis of cosmetics and the operational parameters for detecting H2O2. As evident from the data, the analytical characteristics reported in the present study are comparable to, or even superior to, those of the existing methods in terms of dynamic range, long-term stability, cost-effectiveness, and the use of a monometallic catalytically active phase instead of more complex composite materials. Moreover, some of these systems involve the detection of H2O2 in highly acidic media such as H2SO4 [24] or alkaline electrolytes such as NaOH [25,29]. Relative to all previous studies, the preparation process of the modified electrode–catalyst Rh/GCE is much simpler. In contrast to some works [25,28,30], the electrode preparation procedure applied here does not use the drop-casting technique. It is well known that the evaporation of a droplet containing suspended nanoparticles forms a ring-like pattern (“coffee ring effect” phenomenon). The uniform distribution of the drop-cast particles across the electrode area negatively affects the sensing performance and reproducibility [33]. Although drop-casting is a simple and quick method for surface modification, it is better suited for proof-of-concept studies. Some researchers have used carbon paste electrodes (CPEs) [25,26]. However, the reproducibility of CPEs is also a challenge. Batch-to-batch variations in the paste (particle size and distribution) can affect the electrochemical behavior and reproducibility between different electrodes. The penetration of the analyte and other components of real samples into the electrode paste causes a progressive loss of linearity and lack of signal repeatability between measurements. In contrast, the proposed fast, single-step electrodeposition procedure has a promising future as a fabrication approach in the field of electrochemical sensors.

4. Conclusions

In this study, a novel stable and precise electrochemical sensing platform was developed by modifying GCE with electrodeposited rhodium particles for the sensitive and selective detection of H2O2 in cosmetics and pharmaceutical samples, surpassing the performance of several previously reported sensors. Among the various types of modified electrodes, Rh/GCE is one of the most attractive sensing materials because of its good electrocatalytic activity, well-defined robust structure, and excellent stability. The fabricated sensor demonstrated an excellent specificity against various interferences, short response time, good reproducibility, accuracy, repeatability, and high stability of the electrode material. Moreover, the electrode preparation procedure is facile, quick, cost-effective, and reproducible. The sensor was applied to real samples containing H2O2, and the obtained results were in excellent agreement with the standard method. Thus, the constructed sensor is easily applicable and offers an economically feasible alternative to the conventional analytical methods, being an attractive strategy for analytical laboratories with minimal research infrastructure.

Supplementary Materials

The following supporting information can be downloaded at https://www.mdpi.com/article/10.3390/chemosensors13110376/s1. Figure S1. SEM micrograph and the corresponding EDS spectra for the determination of phase content. Figure S2. Authentic record of Rh/GCE signal upon addition of injection of 60 µL of real sample (hair dye oxidant); three independent measurements (a, b, c).

Author Contributions

Conceptualization and methodology, T.D.; investigation, T.D., D.H. and N.D.; data collection and analysis, T.D., D.H. and N.D.; writing—original draft preparation, T.D. and D.H.; writing—review and editing, T.D. and N.D.; visualization, T.D. and D.H.; project administration, N.D. All authors have read and agreed to the published version of the manuscript.

Funding

This research received no external funding.

Institutional Review Board Statement

Not applicable.

Informed Consent Statement

Not applicable.

Data Availability Statement

The data presented in this study are available at Zenodo repository with DOI: 10.5281/zenodo.17178006.

Acknowledgments

The support from Centre for Competence “Personalized Innovative Medicine, PERIMED-2 (BG Programme “Research, Innovation and Digitalization for Smart Transformation” 2021–2027, co-financed by EU, grant BG16RFPR002-1.014-0007) is gratefully acknowledged.

Conflicts of Interest

The authors declare no conflicts of interest.

References

  1. Becker, L.C.; Cherian, P.A.; Bergfeld, W.F.; Belsito, D.V.; Hill, R.A.; Klaassen, C.D.; Liebler, D.C.; Marks, J.G., Jr.; Shank, R.C.; Slaga, T.J.; et al. Safety Assessment of Hydrogen Peroxide as Used in Cosmetics. Int. J. Toxicol. 2024, 43, 5S–63S. [Google Scholar] [CrossRef]
  2. Yıldırım, A.; Demir, N.B.; İzgi, B.A.; Erkol, B.N.; Özsu, Ç.; Aydemir, G.E.; Mustafaoğlu, M.; Kızıl, M.; Ayhan, N.; Emen, S. The chemistry mechanism of hair dyes. Middle East J. Appl. Sci. 2022, 8, 173–193. [Google Scholar] [CrossRef]
  3. Seo, J.-A.; Bae, I.-H.; Jang, W.-H.; Kim, J.-H.; Bak, S.-Y.; Han, S.-H.; Park, Y.-H.; Lim, K.-M. Hydrogen peroxide and monoethanolamine are the key causative ingredients for hair dye-induced dermatitis and hair loss. J. Dermatol. Sci. 2012, 66, 12–19. [Google Scholar] [CrossRef]
  4. Chen, C.; Huang, X.; Zhu, W.; Ding, C.; Huang, P.; Li, R. H2O2 gel bleaching induces cytotoxicity and pain conduction in dental pulp stem cells via intracellular reactive oxygen species on enamel/dentin disc. PLoS ONE 2021, 16, e0257221. [Google Scholar] [CrossRef]
  5. Bin Hassan, S.A. Tooth Sensitivity Following Hydrogen Peroxide Bleaching With and Without Ozone: A Randomized Controlled Trial. Pain Res. Manag. 2024, 2024, 2695533. [Google Scholar] [CrossRef]
  6. Scientific Committee on Safety (SCCS). Opinion on Oxidative Hair Dye Substances and Hydrogen Peroxide Used in Products to Colour Eyelashes; Report No. SCCS/1475/12; European Commission: Brussels, Belgium, 2012; pp. 1–21. Available online: http://ec.europa.eu/health/scientific_committees/consumer_safety/docs/sccs_o_111.pdf (accessed on 20 August 2025).
  7. Klassen, N.V.; Marchington, D.; McGowan, H.C.E. H2O2 Determination by the I3 Method and by KMnO4 Titration. Anal. Chem. 1994, 66, 2921–2925. [Google Scholar] [CrossRef]
  8. Gimeno, P.; Bousquet, C.; Lassu, N.; Maggio, A.-F.; Civade, C.; Brenier, C.; Lempereur, L. High-performance liquid chromatography method for the determination of hydrogen peroxide present or released in teeth bleaching kits and hair cosmetic products. J. Pharm. Biomed. Anal. 2015, 107, 386–393. [Google Scholar] [CrossRef] [PubMed]
  9. Sunil, K.; Narayana, B. Spectrophotometric Determination of Hydrogen Peroxide in Water and Cream Samples. Bull. Environ. Contam. Toxicol. 2008, 81, 422–426. [Google Scholar] [CrossRef]
  10. Tsaplev, Y.B. Chemiluminescence determination of hydrogen peroxide. J. Anal. Chem. 2012, 67, 506–514. [Google Scholar] [CrossRef]
  11. Dodevska, T.; Hadzhiev, D.; Shterev, I. Electrochemical sensors for the safety and quality control of cosmetics: An overview of achievements and challenges. J. Electrochem. Sci. Eng. 2024, 14, 3–35. [Google Scholar] [CrossRef]
  12. Aydar Barutçu, S.; Eskiköy Bayraktepe, D.; Yazan, Z.; Polat, K.; Filik, H. Investigation of electrochemical oxidation mechanism, rapid and low-level determination for whitening cosmetic: Arbutin in aqueous solution by nano sepiolite clay. Chem. Pap. 2021, 75, 3483–3491. [Google Scholar] [CrossRef]
  13. Li, Y.; Yang, Q.; Feng, Y.; Ye, B.-C. A robust electrochemical sensor based on N,S-FeNi3/C for simultaneous detection of hydroquinone and arbutin in cosmetics. Microchim. Acta 2023, 190, 150. [Google Scholar] [CrossRef]
  14. Bohari, N.A.; Siddiquee, S.; Saallah, S.; Misson, M.; Arshad, S.E. Electrochemical Behaviour of Real-Time Sensor for Determination Mercury in Cosmetic Products Based on PANI/MWCNTs/AuNPs/ITO. Cosmetics 2021, 8, 17. [Google Scholar] [CrossRef]
  15. Chairunisa, A.; Wahyuni, W.T.; BatuBara, I.; Putra, B.R. A composite of platinum nanoparticles and multiwalled carbon nanotubes modified electrode for sensitive and simultaneous detection of hydroquinone and methylparaben in cosmetic products. Sens. Int. 2025, 6, 100335. [Google Scholar] [CrossRef]
  16. Karimi-Maleh, H.; Darabi, R.; Shabani-Nooshabadi, M.; Baghayeri, M.; Karimi, F.; Rouhi, J.; Alizadeh, M.; Karaman, O.; Vasseghian, Y.; Karaman, C. Determination of D&C Red 33 and Patent Blue V Azo dyes using an impressive electrochemical sensor based on carbon paste electrode modified with ZIF-8/g-C3N4/Co and ionic liquid in mouthwash and toothpaste as real samples. Food Chem. Toxicol. 2022, 162, 112907. [Google Scholar] [CrossRef]
  17. Charoenkitamorn, K.; Siangproh, W.; Chailapakul, O.; Oyama, M.; Chaneam, S. Simple Portable Voltammetric Sensor Using Anodized Screen-Printed Graphene Electrode for the Quantitative Analysis of p-Hydroxybenzoic Acid in Cosmetics. ACS Omega 2022, 7, 16116–16126. [Google Scholar] [CrossRef]
  18. Bounegru, A.V.; Apetrei, C. Development of a Novel Electrochemical Biosensor Based on Carbon Nanofibers–Gold Nanoparticles–Tyrosinase for the Detection of Ferulic Acid in Cosmetics. Sensors 2020, 20, 6724. [Google Scholar] [CrossRef] [PubMed]
  19. Riaz, M.A.; Chen, Y. Electrodes and electrocatalysts for electrochemical hydrogen peroxide sensors: A review of design strategies. Nanoscale Horiz. 2022, 7, 463–479. [Google Scholar] [CrossRef] [PubMed]
  20. Trujillo, R.M.; Barraza, D.E.; Zamora, M.L.; Cattani-Scholz, A.; Madrid, R.E. Nanostructures in Hydrogen Peroxide Sensing. Sensors 2021, 21, 2204. [Google Scholar] [CrossRef] [PubMed]
  21. Liu, J.; Li, M.; Liu, W.; Hao, Z.; Zhang, F.; Pang, H.; Zhang, R.; Zhang, L. Advances in Non-Enzymatic electrochemical materials for H2O2 sensing. J. Electroanal. Chem. 2024, 954, 118060. [Google Scholar] [CrossRef]
  22. Zhou, M.; Sun, H.; Chen, S.; Yang, M.; Dong, R.; Yang, X.; Zang, L. Chemosensors for H2O2 Detection: Principles, Active Materials, and Applications. Chemosensors 2025, 13, 54. [Google Scholar] [CrossRef]
  23. Chiu, M.-H.; Kumar, A.S.; Sornambikai, S.; Chen, P.-Y.; Shih, Y.; Zen, J.-M. Cosmetic Hydrogen Peroxide Detection Using Nano Bismuth Species Deposited Built-in Three-in-One Screen-Printed Silver Electrode. Int. J. Electrochem. Sci. 2011, 6, 2352–2365. [Google Scholar] [CrossRef]
  24. Thangamuthu, R.; Pan, Y.-C.; Chen, S.-M. Electrocatalytic reduction of hydrogen peroxide and its determination in antiseptic and soft-glass cleaning solutions at phosphotungstate-doped-glutaraldehyde-cross-linked poly-l-lysine film electrodes. Sens. Actuat. B 2011, 151, 377–383. [Google Scholar] [CrossRef]
  25. Xu, D.; Li, L.; Ding, Y.; Cui, S. Electrochemical hydrogen peroxide sensors based on electrospun La0.7Sr0.3Mn0.75Co0.25O3 nanofiber modified electrodes. Anal. Methods 2015, 7, 6083–6088. [Google Scholar] [CrossRef]
  26. Benvidi, A.; Nafar, M.T.; Jahanbani, S.; Tezerjani, M.D.; Rezaeinasab, M.; Dalirnasab, S. Developing an electrochemical sensor based on a carbon paste electrode modified with nano-composite of reduced graphene oxide and CuFe2O4 nanoparticles for determination of hydrogen peroxide. Mat. Sci. Eng. C 2017, 75, 1435–1447. [Google Scholar] [CrossRef]
  27. Katic, V.; dos Santos, P.L.; dos Santos, M.F.; Pires, B.M.; Loureiro, H.C.; Lima, A.P.; Queiroz, J.C.M.; Landers, R.; Muñoz, R.A.A.; Bonacin, J.A. 3D Printed Graphene Electrodes Modified with Prussian Blue: Emerging Electrochemical Sensing Platform for Peroxide Detection. ACS App. Mater. Interfaces 2019, 11, 35068–35078. [Google Scholar] [CrossRef] [PubMed]
  28. Atacan, K.; Özacar, M. Construction of a non-enzymatic electrochemical sensor based on CuO/g-C3N4 composite for selective detection of hydrogen peroxide. Mater. Chem. Phys. 2021, 266, 124527. [Google Scholar] [CrossRef]
  29. Mihailova, I.; Gerbreders, V.; Krasovska, M.; Sledevskis, E.; Mizers, V.; Bulanovs, A.; Ogurcovs, A. A non-enzymatic electrochemical hydrogen peroxide sensor based on copper oxide nanostructures. Beilstein J. Nanotechnol. 2022, 13, 424–436. [Google Scholar] [CrossRef]
  30. Gul, E.; Rahman, G.; Wu, Y.; Bokhari, T.H.; Rahman, A.; Zafar, A.; Rana, Z.; Shah, A.; Hussain, S.; Maaz, K.; et al. Amphiphilic Polyoxometalate-CNTs Nanohybrid as Highly Efficient Enzyme-free Electrocatalyst for H2O2 Sensing. New J. Chem. 2022, 46, 16280–16288. [Google Scholar] [CrossRef]
  31. Lazarova, Y.; Dodevska, T. Amperometric sensing of hydrogen peroxide using glassy carbon electrode modified with rhodium. Food Sci. Appl. Biotechnol. 2018, 1, 63–69. [Google Scholar] [CrossRef]
  32. European Commission: Directorate-General for Enterprise and Industry. The Rules Governing Cosmetic Products in the European Union. Volume 2, Cosmetics Legislation—Cosmetic Products—Methods of Analysis—2000 Edition; Catalogue number NB-26-99-966-EN-C; Office for Official Publications of the European Communities: Luxembourg, 2000; ISBN 92-828-8546-1. Available online: https://op.europa.eu/en/publication-detail/-/publication/17655e26-e423-4179-adcc-0bac7d666ebb (accessed on 12 February 2025).
  33. Dodevska, T. Electrochemical Sensors for Bisphenol A Analysis in Foods and Beverages—A New Approach in Food Quality Control. Acta Chim. Slov. 2025, 72, 217–237. [Google Scholar] [CrossRef] [PubMed]
Figure 1. SEM images of Rh particles electrodeposited under potentiodynamic conditions on glassy carbon; magnification: (a) ×20,000; (b) ×100,000.
Chemosensors 13 00376 g001
Figure 2. CVs in [Fe(CN)6] 3−/4− of bare GCE (black) and Rh/GCE (red) at a scan rate of 50 mV s−1.
Chemosensors 13 00376 g002
Figure 3. (a) CVs of Rh/GCE in [Fe(CN)6] 3−/4− at various scan rates, from inner to outer, of 5, 15, 25, 50, 75, 100, 125, and 150 mV s−1; (b) plot of anodic and cathodic peak currents vs. square root of the scan rate.
Chemosensors 13 00376 g003
Figure 4. (a) CVs of Rh/GCE in the absence (black curve) and in the presence of 1.5 mM H2O2 (red curve) and 3.0 mM H2O2 (blue curve); (b) Calibration plot based on chronoamperometry at a constant applied potential of −0.1 V (inset: amperometric response of Rh/GCE to successive additions of H2O2).
Chemosensors 13 00376 g004
Figure 5. Amperometric response of the Rh/GCE upon addition of (a) 0.15 mM H2O2, 0.15 mM H2O2, 1.5 mM salicylic acid, 1.5 mM Na-EDTA, 1.5 mM glycerol, 1.5 mM H3PO4, 0.15 mM H2O2, and 0.15 mM H2O2; (b) 0.35 mM H2O2, 3.5 mM KCl, 3.5 mM NaNO3, 3.5 mM Mg(NO3)2, and 3.5 mM Na2SO4. Electrolyte: PBS (pH 7.0); applied potential of −0.1 V.
Chemosensors 13 00376 g005
Figure 6. Electrode signal presented as a percentage of the initially registered current value in the presence of 0.5 mM H2O2 under different storage conditions: in air at room temperature (red dots) and in double-distilled water (black squares). Measurements were performed at −0.1 V in PBS (pH = 7.0).
Chemosensors 13 00376 g006
Figure 7. Authentic record of Rh/GCE signal upon addition of (a) two injections of 60 µL of real sample (hair dye oxidant); (b) three injections (150 µL, 400 µL, and 400 µL) of real sample (pharmaceutical solution). Applied potential of −0.1 V. Supporting electrolyte PBS (pH = 7.0).
Chemosensors 13 00376 g007
Table 1. Comparison of the analytical parameters of electrochemical non-enzymatic sensors for the determination of H2O2 in cosmetics and pharmaceutical and cleaning products.
Electrode MaterialMethod
(Potential)
ElectrolyteLinear Range
(µM)
LOD
(µM)
StabilityReal SampleRef.
(Year)
SPAgE-BinanoCVPBS
pH 7.0
100–500056.59Hair dyes[23]
(2011)
PLL-GA/PW/GCEAmp.
(−0.3 V *)
0.1 M
H2SO4
2.5–6850
(2 weeks)
Antiseptic solution, soft-contact lens cleaning solution[24]
(2011)
La0.7Sr0.3Mn0.75Co0.25O3/CPEAmp.
(0.6 V *)
0.1 M NaOH0.5–10000.1791.8%
(1 month)
Toothpaste, medical solution[25]
(2015)
RGO/CuFe2O4/CPEAmp.
(−0.15 V *)
PBS
pH 5.0
2–2000.5295.8%
(2 weeks)
Hair dye, mouthwash solution[26]
(2017)
DPV2–10
10–1000
0.064
3DGrE/PBAmp.
(0.0 V *)
PBS
pH 7.4
1–7000.11Mouthwash
solution
[27]
(2019)
CuO/g-C3N4/GCEDPVPBS
pH 7.0
0.5–500.3192%
(2 months)
Makeup
remover
[28]
(2021)
CuO/Cu wireAmp.
(−0.7 V *)
0.1 M
NaOH
10–18001.3495%
(1 month)
Listerine mouthwash[29]
(2022)
POM–CNT/AuAmp.
(−0.7 V *)
0.1 M PBS
pH 5.0
300–13500.590%
(9 weeks)
Hand sanitizer, surface cleaner, contact lens preservation solution[30]
(2022)
Rh/GCEAmp.
(−0.1 V *)
PBS
pH 7.0
5–10001.293%
(3 months)
Hair dye,
medical solution
This work
* Reference electrode, Ag/AgCl; SPAgE-Binano, three-in-one screen-printed electrode assembly containing nano bismuth species-deposited silver as working, pre-oxidized silver as reference, and unmodified silver as counter electrodes; PLL-GA-PW, phosphotungstate-doped glutaraldehyde-cross-linked poly-l-lysine film electrode; 3DGrE/PB, 3D-printed graphene electrode with Prussian blue; CuO/g-C3N4/GCE, copper oxide/graphitic carbon nitride composite/glassy carbon electrode; POM–CNT, polyoxometalate-CNT nanohybrid; DPV, differential pulse voltammetry; CV, cyclic voltammetry; Amp., amperometry.
Disclaimer/Publisher’s Note: The statements, opinions and data contained in all publications are solely those of the individual author(s) and contributor(s) and not of MDPI and/or the editor(s). MDPI and/or the editor(s) disclaim responsibility for any injury to people or property resulting from any ideas, methods, instructions or products referred to in the content.