Article

Microcontact-Printed Flexible Electrodes for Label-Free Electrochemical Detection of Lung Cancer Biomarker

by
Alberto G. Silva-Junior
1,2,
Abdelhamid Errachid
3,
Nadia Zine
3,
Marie Hangouet
3,
Guy Raffin
3,
Michelly C. Pereira
4,
Maria D. L. Oliveira
1,2 and
Cesar A. S. Andrade
1,2,*
1
Programa de Pós-Graduação em Inovação Terapêutica, Universidade Federal de Pernambuco, Recife 50670-901, PE, Brazil
2
Laboratório de Biodispositivos Nanoestruturados, Departamento de Bioquímica, Universidade Federal de Pernambuco, Recife 50670-901, PE, Brazil
3
Institut des Sciences Analytiques (ISA), Université Claude Bernard Lyon 1, 5 rue de la Doua, 69100 Lyon, France
4
Núcleo de Pesquisa em Inovação Terapêutica, Universidade Federal de Pernambuco, Recife 50670-901, PE, Brazil
*
Author to whom correspondence should be addressed.
Chemosensors 2025, 13(11), 377; https://doi.org/10.3390/chemosensors13110377 (registering DOI)
Submission received: 23 August 2025 / Revised: 10 October 2025 / Accepted: 18 October 2025 / Published: 27 October 2025
(This article belongs to the Special Issue Advanced Biosensors for Diagnostic Applications)

Abstract

Lung cancer remains one of the deadliest cancers worldwide, which highlights the urgent need for new diagnostic tools to detect reliable biomarkers. To enable scalable and cost-effective production, we developed reusable PDMS stamps patterned with electrodes to print flexible electrodes on PET substrates using a microcontact printing (µCP) approach. PET was chosen not only for its flexibility but also as a more sustainable alternative to conventional rigid materials. On these electrodes, three sensing platforms were tested for neuron-specific enolase (NSE) detection: APTES-based monolayers, electrospun PVA/alginate nanofibers, and electropolymerized polypyrrole (PPy) films. Voltammetric and fluorescence/AFM analyses confirmed that all three platforms could recognize the target analyte, with the PPy-CdTe configuration showing the strongest signal variation. Impedance spectroscopy further supported this finding, revealing a clear linear correlation between charge transfer resistance (RCT) and NSE concentration. The PPy-CdTe sensor demonstrated high sensitivity and consistent performance for NSE detection, achieving a detection limit (LOD) of 8.05 pg·µL−1 and a quantification limit (LOQ) of 26.84 pg·µL−1.

1. Introduction

Every year, millions of new cases of lung cancer (LC) are detected, rendering it one of the leading causes of cancer-related deaths globally. The aggressive nature of the disease and late identification are the leading causes of its high death rate. Despite progress in oncological studies, early detection of lung tumors remains a clinical challenge. The complexity of the disease and the variability of its early symptoms hinder timely intervention [1]. The global economic impact of LC is substantial, representing billions of dollars in direct medical costs, lost productivity, and the strain on social support systems.
Traditional diagnostic methods for LC, such as imaging techniques (e.g., CT, PET scans) and tissue biopsies, are reliable but come with significant limitations. They are not suitable for inclusion in continuous or early screening programs because of the need for specialist individuals and frequent exposure to ionizing radiation [2]. When therapeutic intervention is most beneficial, these approaches frequently miss cancers in their early stages. Thus, the creation of substitute diagnostic instruments that are less intrusive, easier to use, and capable of identifying LC at an early stage is crucial.
Biosensors are a potent tool for the development of point-of-care diagnostic devices when combined with novel materials and innovative manufacturing processes [3]. In oncology, the ability of biosensors to detect specific biomarkers in biological fluids without the need for invasive samples is highly beneficial. Due to their low cost, sensitivity, and ease of miniaturization, they hold promise as an early detection tool for diseases [4]. When it comes to transforming biological interactions into electrical signals, these devices are highly selective.
Identifying accurate and targeted biomarkers is essential to the functionality of biosensor devices. The enzyme neuron-specific enolase (NSE), which is involved in glycolytic metabolism, is one such biomarker with excellent diagnostic value for LC. Small-cell lung carcinoma has been reliably linked to elevated NSE levels [5]. NSE is an appropriate option for biosensor integration, as it is a soluble and detectable protein that can be efficiently detected in serum. It is used as a biomarker for disease monitoring due to its overexpression in specific subtypes of lung cancer. The integration of NSE into new diagnostic platforms has been the subject of multiple research projects in recent years [6,7]. For instance, Lin and his team developed a calibration-free method to analyze the active concentration of NSE using surface plasmon resonance [8]. The LOD was found to be 1 nM, becoming a valuable and straightforward strategy for specific biomarker detection. Recently, Chen et al. developed a label-free immunoassay based on chemiluminescence-functionalized magnetic mesoporous nanoparticles for the detection of NSE [9]. With advantages such as magnetic separation and mesoporous loading, the proposed method presented an LOD of 2.3 × 10⁻¹⁴ g/mL.
μCP, or microcontact printing, has gained popularity as a patterning approach for producing robust and effective biosensors. With this soft lithography method, functional materials can be accurately placed onto a substrate by using a patterned stamp [10]. The low cost and versatility of μCP make it particularly attractive for large-scale, environmentally friendly manufacturing. μCP ensures high-performance sensing surfaces in electrochemical biosensing by permitting the controlled deposition of biomolecules, conductive polymers, and nanomaterials [11]. Due to its compatibility with a variety of substrates, including flexible materials, it is more versatile in wearable diagnostics and biological devices [12].
Biosensor platforms based on flexible substrates have gained attention for their use at the point of care, ease of preparation, transport, and multiple analysis options. For example, Song and coworkers recently developed a biosensor platform for microRNA-21, which is released in lung cancer, using a flexible substrate prepared on carbon paper modified with graphdiyne and gold nanoparticles [13]. As a result, they obtained an LOD of 32.3 aM, using the assistance of a mobile phone. In another study, Shankar and his team developed an electrochemical biosensor based on a ZrS3@rGO nanocomposite using cotton thread as a flexible substrate [14]. Presenting the cytoskeleton-associated protein 4 (CKAP4) as a lung cancer biomarker, the developed sensor showed a LOD of 6.25 pg·mL−1. Another study by Li created a flexible biosensor based on a nanocomposite-hydrogel with Ag nanocubes [15]. Using SERS and colorimetric analysis, the biomarker hexanal—a new potential biomarker for lung cancer—was detected with noticeable sensitivity, with a LOD of 3.34 × 10⁻¹³ M.
We report on the development of flexible electrochemical biosensors fabricated on polyethylene terephthalate (PET) substrates using μCP. These sensing platforms were designed for the rapid and sustainable detection of NSE. The use of flexible PET substrates offers advantages such as low cost, mechanical resilience, and adaptability to various surfaces, including skin. Combined with μCP, the fabrication process of these electrodes becomes scalable and environmentally conscious. This study highlights a versatile approach with broad implications for multiplexed and accessible biomedical sensing. Further signal enhancement is achieved by incorporating advanced nanomaterials, including cadmium telluride (CdTe) quantum dots, electrospun polymer nanofibers, and conductive polymers such as polypyrrole (PPy). These nanostructures enhance the surface area, improve electron transport, enable specific biorecognition, and optimize analytical performance. This multi-functional integration strengthens the biosensor’s capability to detect NSE at clinically relevant concentrations.

2. Materials and Methods

2.1. Materials

Polyethylene terephthalate (PET) was obtained from GoodFellow Cambridge Limited (Lille, France). SYLGARD 184 polydimethylsiloxane (PDMS) silicone elastomer kit, consisting of a base and a curing agent, was purchased from Merck/Dow Chemical Company (Paris, France). Polyvinyl alcohol (PVA), sodium alginate, iron III nitrate nonahydrate, thiourea, 45–150 μm iron powder, 1-octadecanethiol (ODT), trichloro (1H, 1H, 2H, 2H-tridecafluoro-n-octyl) silane (TFOCS), ethanolamine, 3-mercaptopropyl-trimethoxysilane (MPTS), pyrrole, cadmium telluride quantum dots (CdTe), potassium ferrocyanide, potassium ferricyanide, glutaraldehyde, N-hydroxysuccinimide (NHS), and N-(3-dimethylaminopropyl)-N′-ethylcarbodiimide (EDC) were obtained from Merck/Sigma Aldrich (Paris, France). Neuron-specific enolase (NSE) recombinant antigen (ref: ab78797), polyclonal (ref: ab53025), and monoclonal (ref: ab202227) antibodies (capture and detection, respectively) were obtained from Abcam (France). CYFRA 21-1 recombinant antigen (Ref: MBS537751-0.1 mg) was purchased by My Biosource (Paris, France). Human interleukin 6 (IL-6) was obtained from R&D Systems (Paris, France). Ultrapure deionized water used in the experiments was obtained from an ELGA PURE LABWATER system.

2.2. Fabrication Process of the SU-8 Master Mold and Replica Molding

A design incorporating microelectrodes was used to create silicon masters in the Centro Nacional de Microelectrónica (IBM-CSIC) clean room (Figure S1). The structure height was carved between 10 and 30 μm. Master microstructures with negative superficial structures were created by defining the microstructures on the surface of the microelectrode mold. Using well-established photolithography procedures, the applied masters were made by patterning the surface with a photoresist. When using replica molding for imprinting, this enables the creation of a positive structure in the PDMS surface.
The microelectrode masters, following silicon dicing, were treated with TFOCS to prevent them from permanently attaching to PDMS after curing. Here, a vacuum desiccator was used to create a TFOCS monolayer via vapor deposition on the surface of the silicon master for 2 h. Following that, silicon masters were baked at 110 °C for 25 min to remove silane excess. Then, the silicon masters were silanized and prepared for molding into replicas.
The replica molding technique was used to create PDMS duplicates from the silicon mold. Figure S2 shows the stepwise fabrication of the PDMS stamp. The mold was composed of two parts: a magnetic part and another containing the electrode patterns. After mixing the curing agent and PDMS at a 10:1 (w/w) ratio, the mixture was poured over the silicon mold. The remaining air bubbles in the polymer mixture were subsequently eliminated by degassing the PDMS, which was cured for 30 min at 80 °C. The finished outcome from this process was a polymerized and rigid PDMS. The exact process was performed for the magnetic layer, where 7.5 g of iron powder was mixed and homogenized with an equal volume of prepolymer, then added to the PDMS containing the electrode patterns. The PDMS was separated from the master once it had cooled to room temperature, revealing the electrode design on its surface and inside, as well as the magnetic component for use in electrode manufacturing.

2.3. Electrode Fabrication Through Microcontact Printing

The electrodes were initially prepared by cutting the PET sheets into 10 cm diameter circles using a ROLAND GS 24 Cutter and CutStudio software. Subsequently, to increase gold adhesion, the PET was pretreated with MPTS in a desiccator for 1 h. Finally, a gold coating was carried out for 180 s using physical vapor deposition (PVD). Subsequently, the magnetic stamp was functionalized with 2 mM 1-octadecanethiol (ODT) prepared in absolute ethanol for 10 min and then dried using nitrogen. The PDMS stamp with the electrode design was immersed in a solution of ODT (2 mM) prepared in absolute ethanol for 20 min. Afterwards, the stamp was dried with nitrogen and introduced into the INNOSTAMP 40 equipment, where the functionalized magnetic stamp and the gold-coated PET were placed in an automated process that resulted in conformal contact with the PDMS on the PET substrate. The printing involved stamp-substrate contact for 2 min and a pressure of approximately 1800 N. The entire µCP process using INNOSTAMP 40 is illustrated in Figure S3. Following this, the substrate is functionalized with ODT and then undergoes a wet etching treatment.
The self-assembled monolayer (SAM) of ODT acted as a mask, protecting the gold with the electrode pattern. Conversely, the unprotected gold was removed by a solution composed of 45 mM ferric nitrate and 75 mM thiourea. Figure S3 shows the activity of ferric nitrate and thiourea as a function of time, as well as the finished PET electrodes and their dimensions. A 10-min period is sufficient for obtaining well-defined gold electrodes. As seen in Figure S4, the electrode dimension. Additionally, another advantage of µCP is that it enables the scalable production of electrodes on low-cost, readily available, and recyclable substrates, such as PET.

2.4. Immunosensor Platform Assembly Process and Bioactivity Assays

Initially, flexible and miniaturized gold electrodes produced using the µCP technique underwent plasma cleaning to remove ODT residues from the electrode. Subsequently, three sensing platform strategies were used: electrospun nanofibers (PVA/Alg-CdTe nanofiber), APTES self-assembled monolayers (APTES-CdTe), and an electropolymerized polypyrrole (PPy-CdTe) layer. A schematic representation of the developed platforms is shown in Figure 1.
PVA/alginate nanofibers were produced by electrospinning using a Spraybase instrument. A 16% PVA and 2% alginate formulation prepared in deionized water was homogenized at a 3:1 ratio, followed by the addition of CdTe quantum dots (100 µL). The inclusion of CdTe QDs was intended to increase the electroactive surface area and enhance electron transfer between the polymeric network and the electrode interface, as further confirmed by the electrochemical characterization. The solution was then inserted into a 25 mL syringe and coupled to an infusion pump with a fixed flow rate of 60 µL/h. The voltage used 15 kV was supplied by a high-voltage source. The syringe was then inserted into a needle with an internal diameter of 0.5 mm. For nanofiber formation, a grounded electrode was connected to a metal collector covered with aluminum foil, where the electrodes were placed. The nanofibers were collected at a fixed distance of 15 cm between the needle tip and the collector. These parameters were optimized to obtain uniform, bead-free nanofibers. The electrospinning process was performed at 21 ± 2 °C under controlled humidity. Due to its hydrophilic nature, PVA is extremely unstable in aqueous solutions. After obtaining the nanofiber-coated electrodes, the nanofibers were cross-linked to stabilize them after contact with water and other solvents The electrodes were incubated in an acetone solution containing 1% ethanol, 2% glutaraldehyde, and 1 M HCl for one minute. This reaction promoted covalent bonding through the formation of acetal ring that took place between the hydroxyl groups of PVA and aldehyde groups of glutaraldehyde. The electrodes were then thoroughly cleaned with deionized water to remove unreacted reagents [16]. The surface was activated using 2 µL EDC/NHS coupling agents (0.4 M and 0.1 M, respectively) to convert carboxyl groups from the QD–PVA/alginate network into active esters, favoring amide bond formation with the amine groups of the antibody. Finally, 2 µL of the anti-NSE antibody (10 µg·µL−1, prepared in phosphate buffer pH 7.4) was incubated on the surface of the polymeric platform for 30 min, ensuring uniform coverage across the nanofiber network.
The polypyrrole (PPy) layer was produced via electropolymerization using cyclic voltammetry (CV). Initially, 25 mM pyrrole was prepared in 0.5 M HCl (15 mL) and homogenized using an ultrasonic bath, followed by 10 min of magnetic stirring to ensure complete monomer dispersion. Three CV cycles were applied between −0.4 V and +1.4 V at a scan rate of 50 mV·s−1, resulting in a homogeneous and adherent black polymeric film. The presence of the PPy layer increased conductivity and provided reactive nitrogen sites for further functionalization. Then, 2 µL of the EDC NHS-activated CdTe (1:1) was adsorbed, followed by 2 µL of the anti-NSE antibody incubation (10 µg·µL−1, 30 min). Then, the electrode was rinsed with deionized water to remove unbound antibodies.
Finally, for the APTES-modified gold electrodes, the surface was pretreated in 1% KOH to generate hydroxyl groups, facilitating silane coupling. Next, 2% APTES prepared in toluene was used to functionalize the electrode immobilization area (~3 mm in diameter), with a 2 µL drop applied onto the electrode. After that, the electrodes were heated to 100 °C for 15 min in an oven to stabilize the self-assembled monolayer that had formed. Then, 2 µL of CdTe was adsorbed to the electrode and activated with 2 µL of EDC NHS (0.4 M and 0.1 M, respectively). This was followed by 2 µL of anti-NSE amine antibody (10 µg·µL−1), incubated for 30 min at 4 °C. The controlled temperature preserved the antibody’s tertiary structure and binding activity. All electrodes were fabricated in triplicate under identical conditions to assess reproducibility. The combination of polymeric matrices and CdTe QD incorporation significantly improved charge transfer kinetics and biomolecule loading capacity, which is directly reflected in the electrochemical response discussed in the following section. CdTe QDs were employed in minimal amounts as a key to immobilize the antibody. The fabrication and handling steps were performed under controlled laboratory conditions, following standard safety procedures to minimize exposure to hazards. CdTe QDs were incorporated because of their well-known ability to increase the effective surface area, provide functional groups for biomolecule immobilization, and facilitate charge transfer at the electrode interface. On our platform, they primarily functioned as nanostructured scaffolds to immobilize anti-NSE antibodies in a more oriented and accessible manner [16], rather than for direct biological or in vivo applications. It is worth noting that several strategies have been reported to mitigate the risks associated with Cd-based quantum dots, such as encapsulation within biocompatible polymers or silica shells [17] or substitution by less toxic alternatives such as carbon dots or graphene quantum dots [18]. In future work, we plan to explore these approaches, particularly the replacement of CdTe QDs with more biocompatible nanomaterials, to advance our understanding of other biomedical and sensor applications.
Through interaction studies of the PPy-CdTe, APTES-CdTe, and PVA/Alg-CdTenanofiber platforms against the NSE antigen, which was prepared in PBS pH 7.4 at varying concentrations (1 pg to 100 pg·µL−1), the bioactivity of the developed biosensors was assessed. The biosensors were adsorbed to the working electrode, which had been functionalized with the sensor platform, for 10 min, and subsequent electrochemical analysis was then performed. The sensors were stable for one week in refrigerated storage, presenting a standard deviation of up to 9%.

2.5. Optical, Topographical, and Physicochemical Analyses

An Agilent Cary 630 FTIR spectrometer (Agilent Technologies, Rowville, Australia) with a diamond attenuated total reflectance (ATR) accessory was used to perform Fourier transform infrared (FTIR) spectroscopy of the nanostructured material. Spectra were obtained over the 4000–650 cm−1 range at a resolution of 2 cm−1, under room temperature conditions.
The hydrophilicity of the produced µCP electrodes, PPy layer, and nanofiber surface was examined using a sessile drop contact angle test at room temperature. This was accomplished by assembling the µCP gold electrodes with nanostructure platforms onto the sample holder and automatically dripping 3 μL of deionized water onto the electrode surface. As soon as the droplets stabilized (5 s), pictures of the droplets on the functionalized electrode surface were taken. To determine the average contact angle, the experiment was run five times for each platform.
The thermogravimetric analyzer (TGA) (Q50 series, TA instruments (Guyancourt, France)) was used to investigate the thermal behavior of electrospun nanofibers with various ratios, with a heating rate of 10 °C/min in the 20–1000 °C range under a nitrogen environment at a flow rate of 90 mL/min.

2.6. Electrochemical Characterization

Electrochemical analyses were performed using a PalmSens 4 potentiostat. The experiments were conducted in an electrochemical cell produced by ISA for electrochemical analysis, as seen in Figure S5. A three-electrode setup submerged in a solution of 10 mM K4[Fe(CN)6]/K3[Fe(CN)6] (1:1, v/v) made in phosphate-buffered saline (PBS) at pH 7.4 was used for electrochemical experiments. A platinum wire served as the counter electrode, the microcontact printed electrodes served as the working electrode, and a silver/silver chloride (Ag/AgCl) electrode saturated with 3 M KCl served as the reference electrode.
CV was performed with a potential range of 0.7 V to −0.4 V and a scan rate of 50 mV.s−1, aiming to determine the anodic (iPA) and cathodic (iPC) peak currents. EIS impedance spectra were recorded over a frequency range from 100 mHz to 100 kHz and a sine wave potential amplitude of 25 mV. EIS data were explored and adjusted, primarily charge transfer resistance (RCT) values, using PSTrace 5.9 software with OriginPro 9 to obtain values corresponding to the Randles equivalent circuit. All experiments in this work were performed in triplicate and with a relative standard deviation (RSD) of ±5%. Additionally, the electrode-to-electrode variation has an RSD of less than ±5%.

3. Results and Discussion

3.1. Morphological and Fluorescence Characterization

3D AFM images are presented in Figure 2. Furthermore, to obtain comprehensive roughness data, measures including average roughness (Ra) and root mean square roughness (RMS) were employed. The surface of the gold electrode (Figure 2a), produced by microcontact printing on the PET substrate, presents a homogeneous and well-defined pattern characteristic of the microstructure transfer process, with a maximum height of 10.4 nm. The image reveals continuous regions of metal film deposition, with flat areas and low relative roughness, indicating good adhesion of the gold to the support polymer (Ra = 0.53 nm; RMS = 0.77 nm). This behavior is crucial for ensuring reproducibility in sensor applications, as the quality of the gold layer directly impacts the immobilization of biomolecules and the subsequent electrochemical response.
As seen in Figure 2b, the surface formed by the electrospun PVA/alginate nanofibers exhibits a highly intertwined morphology with continuous fibers, with a mean height of 57 nm. A porous, interconnected three-dimensional network is observed, which contributes to increased surface area and, consequently, enhances the platform’s functionalization potential (Ra = 2.95 nm; RMS = 4.25 nm). This structure favors the transport of target molecules and the diffusion of electrolytes.
Next, an enlarged view of the nanofibers electrodeposited on gold is shown (Figure 2c). The nanofibers exhibit good adhesion to the conductive substrate, forming a hybrid coating that combines the high surface area of the polymer with metallic conductivity. The topography shows fibers covering the metallic surface, creating regions of intimate contact between the gold and the polymer matrix, revealing Ra = 2.95 nm and RMS = 4.25 nm. This hybrid configuration favors both the anchoring of bioactive molecules and the mechanical and electrical stability of the platform. The PPy film electrodeposited on gold has a maximum height of 48 nm, forming a continuous and adherent layer (Figure 2d). The morphology reveals a typical granular structure and roughness that significantly increases the electrode’s active surface area, favoring electronic kinetics and surface functionalization. The relatively thin thickness helps maintain electrochemical sensitivity while ensuring mechanical stability and film integrity (Ra = 4.29 nm; RMS = 5.65 nm).
Studies integrating biomolecular interactions have improved with the sensitive and versatile use of fluorescence, particularly when evaluating the affinity between antigens and antibodies. The method significantly expands our understanding of the immobilization, recognition, and detection stages by enabling direct visualization of these events on the surface of biosensors. Fluorescence was added as a supplementary technique to the biosensors designed for this study to confirm the existence of the biocomponent and track the specificity of immunological recognition.
To confirm the formation of antigen–antibody complexes on the proposed sensor devices, Alexa Fluor® 594-conjugated anti-NSE detection antibody was utilized. Fluorescence measurements demonstrated that the biosensors were capable of binding both the labeled antibody and the target analyte. The resulting fluorescence images (Figure 3) revealed distinct emission profiles depending on the surface modification strategy employed. A modest fluorescence signal was seen on the APTES-modified surface, primarily toward the edges of the sensing area. APTES requires the presence of a small percentage of water to achieve hydrolysis and subsequent silanol condensation. In our experiments, controlled humidity during the procedure allowed partial hydrolysis in toluene, enabling covalent attachment of APTES to the surface. In this sense, silanization with APTES can present reproducibility challenges, which may explain the less pronounced performance of this platform compared to the others. This implies low immobilization efficiency or uneven surface coverage, which could be triggered by inadequate biomolecular anchoring or a lack of available amine groups. The nanofiber-based sensor, on the other hand, demonstrated a noticeably stronger and more uniform fluorescence throughout the sensor surface, suggesting efficient and extensive biomolecule attachment. Additionally, the intense fluorescence around the borders suggests excellent surface reactivity and retention of good biological activity. Likewise, there were noticeable hotspots scattered around the surface of the PPy-coated platform, which displayed strong fluorescence emissions. This implies that the conductive polymer’s porous and electroactive properties not only provide effective immobilization but also offer the potential for a more stable biomolecular connection.

3.2. Wettability and ATR-FTIR Measurements

The contact angle (Figure S6) was used to measure surface wettability, enabling the assessment of topographical and chemical changes following the functionalization of gold electrodes produced by microcontact printing on a PET substrate. With CA values of 83.7° (left) and 83.4° (right), the freshly prepared gold surface (Figure S6a) exhibited a prominently hydrophobic character, consistent with the low surface energy and nonpolar nature of clean gold [19].
Functionalization with APTES monolayers (Figure S6b) resulted in a significant reduction in the contact angle to 56.0° (left) and 53.7° (right), demonstrating an increase in moderate hydrophobicity to a more hydrophilic character, attributed to the presence of protonatable amine groups and silane chains that increase surface polarity [20]. Due to the high concentration of hydroxyl and carboxyl groups in PVA and alginate, which promote interactions with water molecules, the surfaces coated with PVA/Alginate nanofibers had contact angles of 44.3° (left) and 47.6° (right) (Figure S6c), indicating increased hydrophilicity [21]. The coating with electrodeposited polypyrrole exhibited a very hydrophilic surface, resulting in a substantial reduction in the contact angle, which was measured at 25.4° (left) and 14.4° (right) (Figure S6d). This behavior is linked to polypyrrole’s characteristic roughness and conductive character, as well as the presence of nitrogenated groups that increase the surface energy [22]. The trend of clean gold electrode > APTES > PVA/alginate nanofibers > PPy suggests that surface topography and chemical modification work in accordance with modulate wettability, which has a direct impact on the anti-NSE antibody immobilization procedures and the functionality of the developed biosensors.
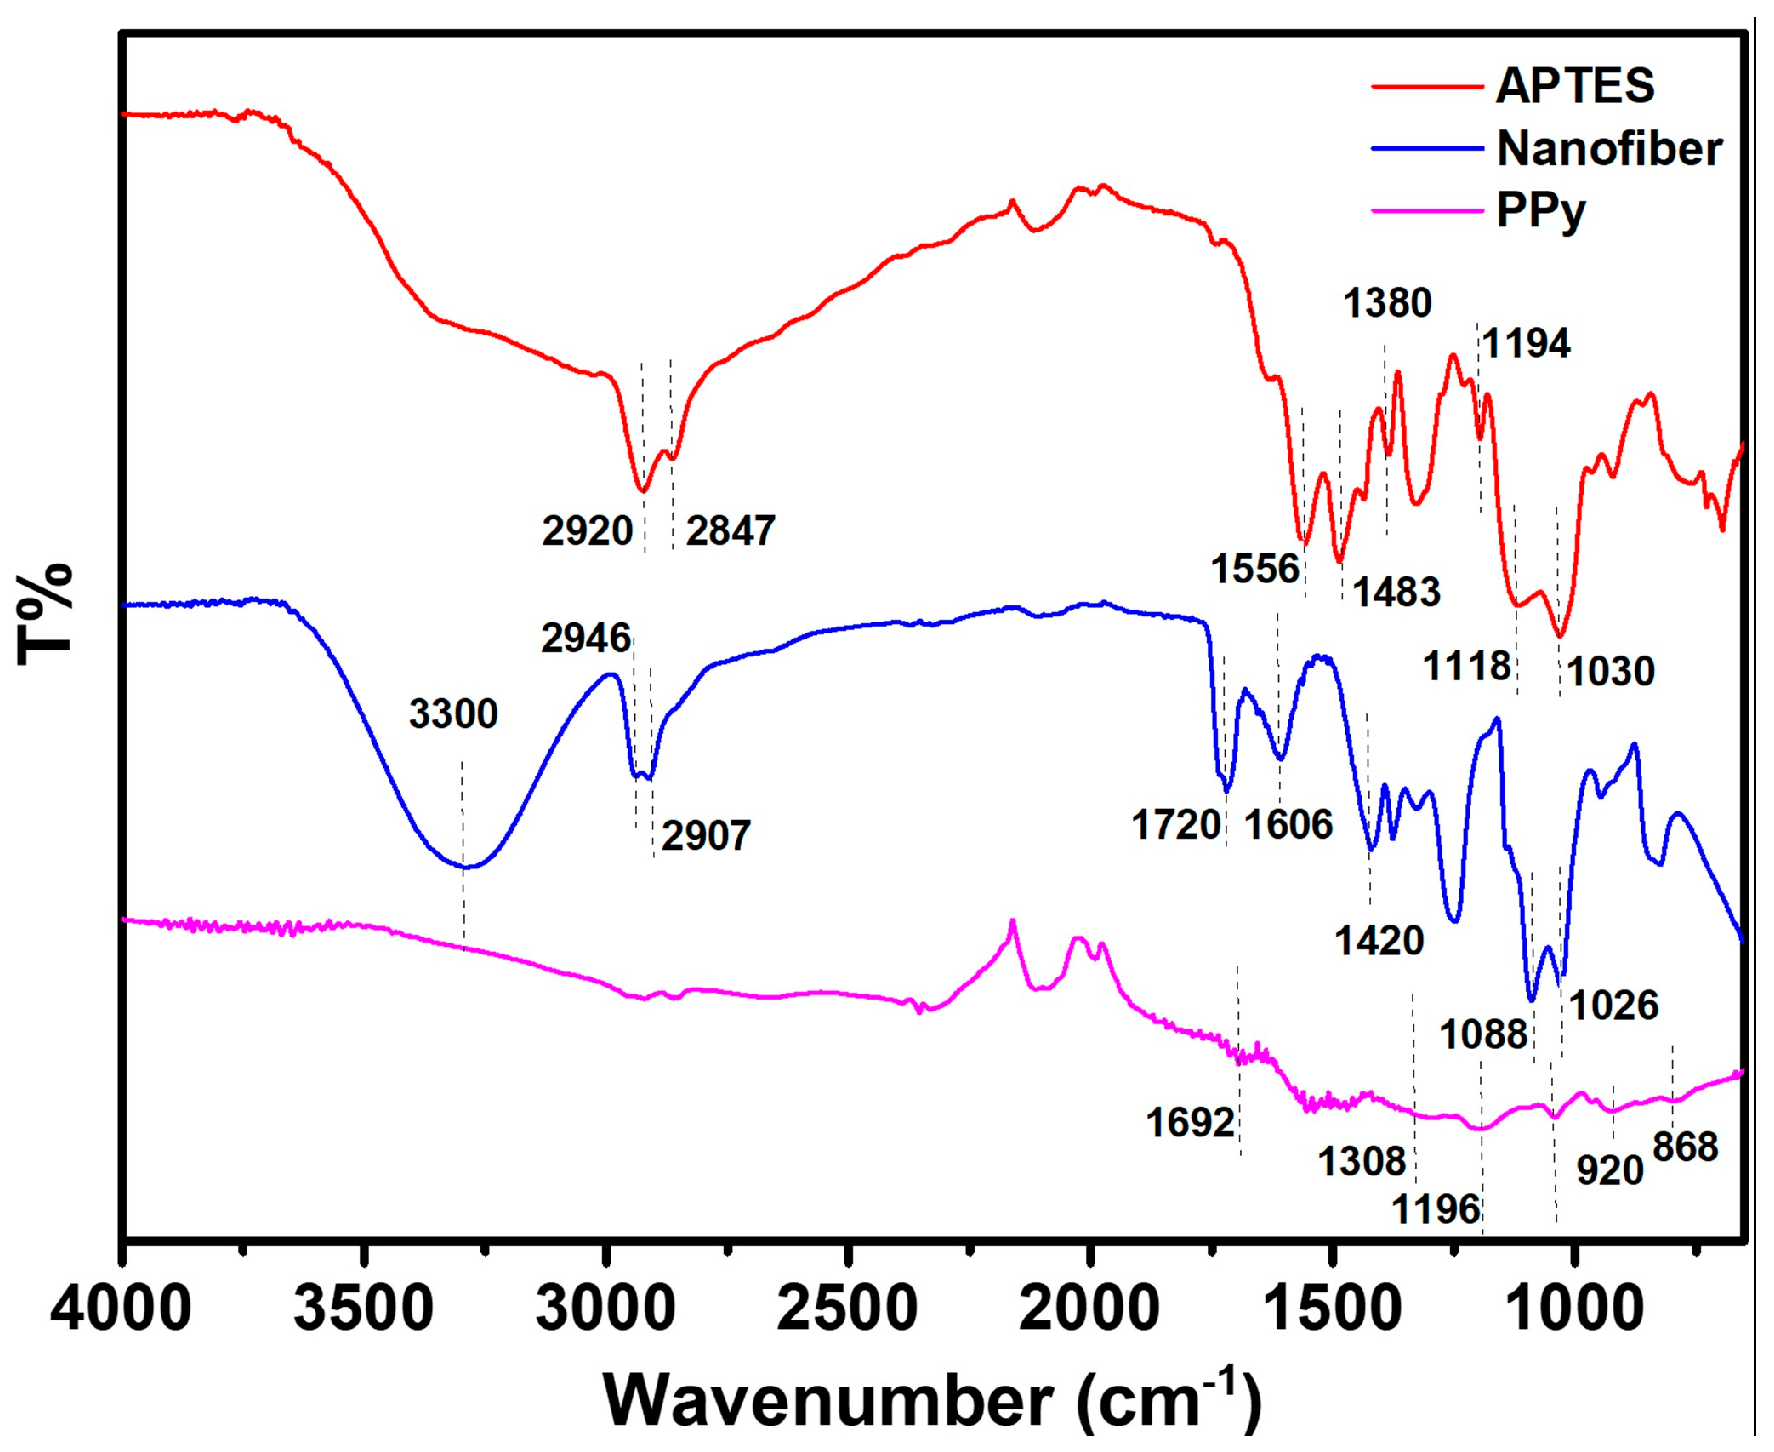
The FTIR spectra of the APTES, nanofiber, and PPy-modified gold-coated PET surface are shown in Figure 4. The Si-O-Si longitudinal optical (Si-O-Si LO) and transverse optical (Si-O-Si TO) stretching modes are represented by the band peaks at approximately 1118 cm−1 and 1040 cm−1, respectively [23]. CH2 stretching and NH2 bending are attributed to the bands in the 2800–2980 cm−1 and 1400–1600 cm−1 regions, respectively [24]. Additionally, it was found that unhydrolyzed ethoxy moieties in APTES (–OCH2CH3) give rise to a vibrational mode at about 1199 cm−1 [25]. Regarding the PPy layer, FTIR data showed peaks at 793 and 920 cm−1, which were attributed to C-H wagging [26]. The C=N and C-N bonds are represented by the peaks that appear at 1692 and 1308 cm−1, respectively [27]. Moreover, FTIR spectrum analysis indicates that PPy is present for C-H vibrations at 1238 cm−1 and 1037 cm−1, whereas C-H stretching is observed at 867 cm−1 [28].
For the FTIR of the PVA/alginate blended nanofibers, particular -OH peaks that extend to around 3300 cm−1 were observed. This provides compelling evidence in favor of the suggestion that the hydroxyl groups of PVA and alginate could form a hydrogen bond. Consequently, adding PVA may increase the electrospinnability of alginate by moderating the interaction between its macromolecules [29]. At 1420 cm−1, symmetric -COO appears. Furthermore, the CH2 and -CHO spectra are located at 2946 and 2907 cm−1, respectively [30]. At wavenumber 1720 cm−1, the FTIR test result displays the C─O stretching of the carbonyl group [31]. The C-O stretching asymmetry functional groups of the alginate-PVA fibers are located at 1606 cm [32]. The C─O stretching function also reveals wavenumbers of 1026, 1088, and 1256 cm. The CH2 bending and wagging vibrations are represented by the absorption bands seen at 937 and 836 cm−1, respectively [33].

3.3. XRD and TGA Analysis

Figure S7 shows the X-ray diffractograms for PVA powder (green line), alginate powder (red line), and nanofibers obtained from the PVA/alginate blends (black line). The PVA diffractogram exhibits a characteristic diffraction peak at approximately 2θ ≈ 19.5°, associated with its semicrystalline phase. This phase is attributed to the ordered packing of the polymer chains and the presence of crystalline regions stabilized by intramolecular hydrogen bonds [34]. Sodium alginate exhibits an essentially amorphous profile, as evidenced by the broad band centered in the 13–14° range and a less pronounced peak at approximately 2θ ≈ 40°, indicating a semi-crystalline structure, in agreement with data previously reported for anionic polysaccharides [35].
Regarding PVA/alginate nanofibers (black line), a notable expansion of the PVA characteristic peak and a significant decrease in intensity are noted, suggesting that the material’s degree of crystallinity has decreased following the electrospinning procedure. This reduction in crystallinity is frequently attributed to the interaction between the carboxylate groups of alginate and the hydroxyl groups of PVA, which supports a higher amorphous proportion and a less orderly reorganization of the polymer [29]. The fibers’ rapid solidification can also enhance this effect during electrospinning, which reduces the time available for crystalline domains to form.
Thermogravimetric analysis (TGA) was employed to investigate the thermal stability of PVA/alginate nanofibers before and after the crosslinking process using a 2% glutaraldehyde solution. In the uncrosslinked material (Figure S8a), the thermal profile showed three main mass loss events. The first, at around 140 °C, corresponds to a loss of 3.6%, attributed to the evaporation of physically absorbed water that is weakly bound to the polymer matrix [36]. The second, more pronounced event, occurs between 260 and 530 °C, with a loss of 85.4%, and is associated with the simultaneous degradation of the PVA and alginate chains by cleavage of glycosidic bonds and dihydroxylation [37]. The final residue, approximately 2.5% at 750 °C, represents the remaining stable carbonaceous fraction.
A decrease in mass loss is seen in the first stage following crosslinking (Figure S8b) (9.4% at around 140 °C), suggesting a lower absorbed water content. This could be because free hydrophilic groups are reduced following the formation of covalent bonds via glutaraldehyde [38]. The first degradation stage shifts slightly to higher temperatures, resulting in a total loss of 86.8% up to approximately 500 °C. This suggests that the chemical entanglement of the polymer chains has increased thermal resilience. Since crosslinking modifies matrix carbonization, the final residue (1.0% at 750 °C) is marginally less than that of the non-crosslinked material. These results demonstrate that crosslinking not only reduces hygroscopicity but also enhances the composite’s thermal resistance, a desirable property for biosensor applications that operate in diverse environmental conditions.

3.4. Electrochemical Investigation of the Biosensing Platform

CV provides comprehensive information on surface changes and redox activity, rendering it a practical technique for assessing the functionalization of biosensor devices. CV tracks variations in the anodic (iPA) and cathodic (iPC) current peaks during the analyte detection and assembly procedure [39]. Electrochemical impedance spectroscopy (EIS) was also used to analyze the sensor platform’s interfacial characteristics at different stages of modification. Nyquist plots were used to depict the collected data; the real axis (Z′) shows the system’s overall resistance to current flow, while the imaginary axis (-Z″) is associated with the capacitance and charge storage processes at the electrode/solution interface. The experimental spectra were fitted using the Randles equivalent circuit, which allowed for the quantitative extraction of key electrochemical properties, particularly double-layer capacitance (CDL), charge transfer resistance (RCT), solution resistance (Rs), and Warburg impedance (Zw) [40].
Following the µCP procedure to obtain the electrodes, they were heated to 120 °C for 10 min to facilitate ODT removal. To improve wettability and enhance the immobilization of sensor components, plasma treatment was employed to clean the electrode and introduce -OH groups [41]. The viability of the µCP electrodes was examined electrochemically using three distinct immunosensing platforms for NSE detection following the manufacture and cleaning procedures. APTES monolayers, PVA/alginate nanofiber, and electropolymerized PPy platforms are the biosensors’ primary structural elements.
The biosensors assembly process was first analyzed using CV, as shown in Figure 5. Both anodic and cathodic peaks are well-defined on the clean electrode (black voltammogram). Both peaks on the nanofibers (Figure 5b) and APTES platform (Figure 5a) close after the first layer is formed. This action results from the self-assembled monolayer and polymer fibers, which partially block the current flow. The conductivity of the Ppy conductive layer, which is attributed to its strong electron affinity and a σ-π system that promotes electron mobility within the polymer structure, led to peaks rising on the PPy platform [42] (Figure 5c).
The Randles–Sevcik equation was used to calculate the active area [43]: I p = K . n 3 / 2 A D 1 / 2 u 1 / 2 C , where A is the electrode surface area in cm2, D is the diffusion coefficient in cm2 s−1 (7.20 × 10⁻⁶ cm2), K is the constant (2.69 × 10⁵), C is the probe molecule in the bulk solution (10−6 mol cm−3), and u is the scan rate in V/s (0.050 V s−1). As a result, the APTES, polymer nanofiber, and PPy-modified gold electrode’s surface area was found to be 0.0473 cm2, 0.0284 cm2, and 0.0996 cm2, respectively. The electroactive area obtained for the three platforms reveals the essential differences associated with the physicochemical nature of the layers obtained. The Ppy-modified electrode presented the most significant area (0.0996 cm2), reflecting its high intrinsic conductivity, porous structure, and ease of electron transport, which facilitate access to the surface by redox ions. The APTES-modified platform (0.0473 cm2) presented a smaller active area, a result expected from the formation of a silane monolayer that, although promoting stable functionalization, imposes diffusion barriers and lower conductivity. The lower result for the nanofiber-modified platform (0.0284 cm2) may be attributed to the densification facilitated by the crosslinking procedure, which is necessary to stabilize the fibers in an aqueous solution. Although essential for preserving the nanofiber’s structural integrity, the crosslinking process decreases porosity and charge mobility at the interface, restricting analyte access to the conductive surface and consequently reducing the effective electroactive area.
Following antibody immobilization using EDC NHS coupling agents, the neutrally and positively charged NHS ester converted the terminal carboxylic groups of the QD-CdTe, facilitating the transfer of the redox probe to the electrode surface and thus leading to an increase in the IPA and IPC peaks (Figure 5, red voltammogram).
The immobilization of sensor platform components was also confirmed by EIS studies (Figure S9). Since they are directly proportional to the concentration of material bound to the working electrode surface, charge transfer resistance (RCT) values were selected as the primary parameter for assessing sensor assembly and determining the target analyte [44]. By analyzing RCT values, EIS best reflects a pattern associated with CV, where all platforms displayed decreased RCT following receptor immobilization, as seen on the Randles equivalent circuit for the sensor platforms in Table S1. In this sense, one can say that CV and EIS are comparable, as they are often used together to analyze sensor assembly processes [45]. The inclusion of QD-CdTe in the sensing matrix was strategically designed to enhance the electrochemical performance of the biosensor. Their semiconductor nature provides discrete energy levels that facilitate charge transfer between the polymeric film and the electrode surface, thereby improving the signal-to-noise ratio and sensitivity. Moreover, the QDs introduce carboxylic groups on the surface, which increase the available sites for covalent antibody immobilization through EDC/NHS chemistry. Comparative analyses between QD-modified and QD-free platforms confirmed that the quantum dots significantly improved the electron transfer resistance profile and signal linearity, thus justifying their incorporation in the final sensing architecture [18,46,47,48].

3.5. Bioanalytical Performance of the Biosensor

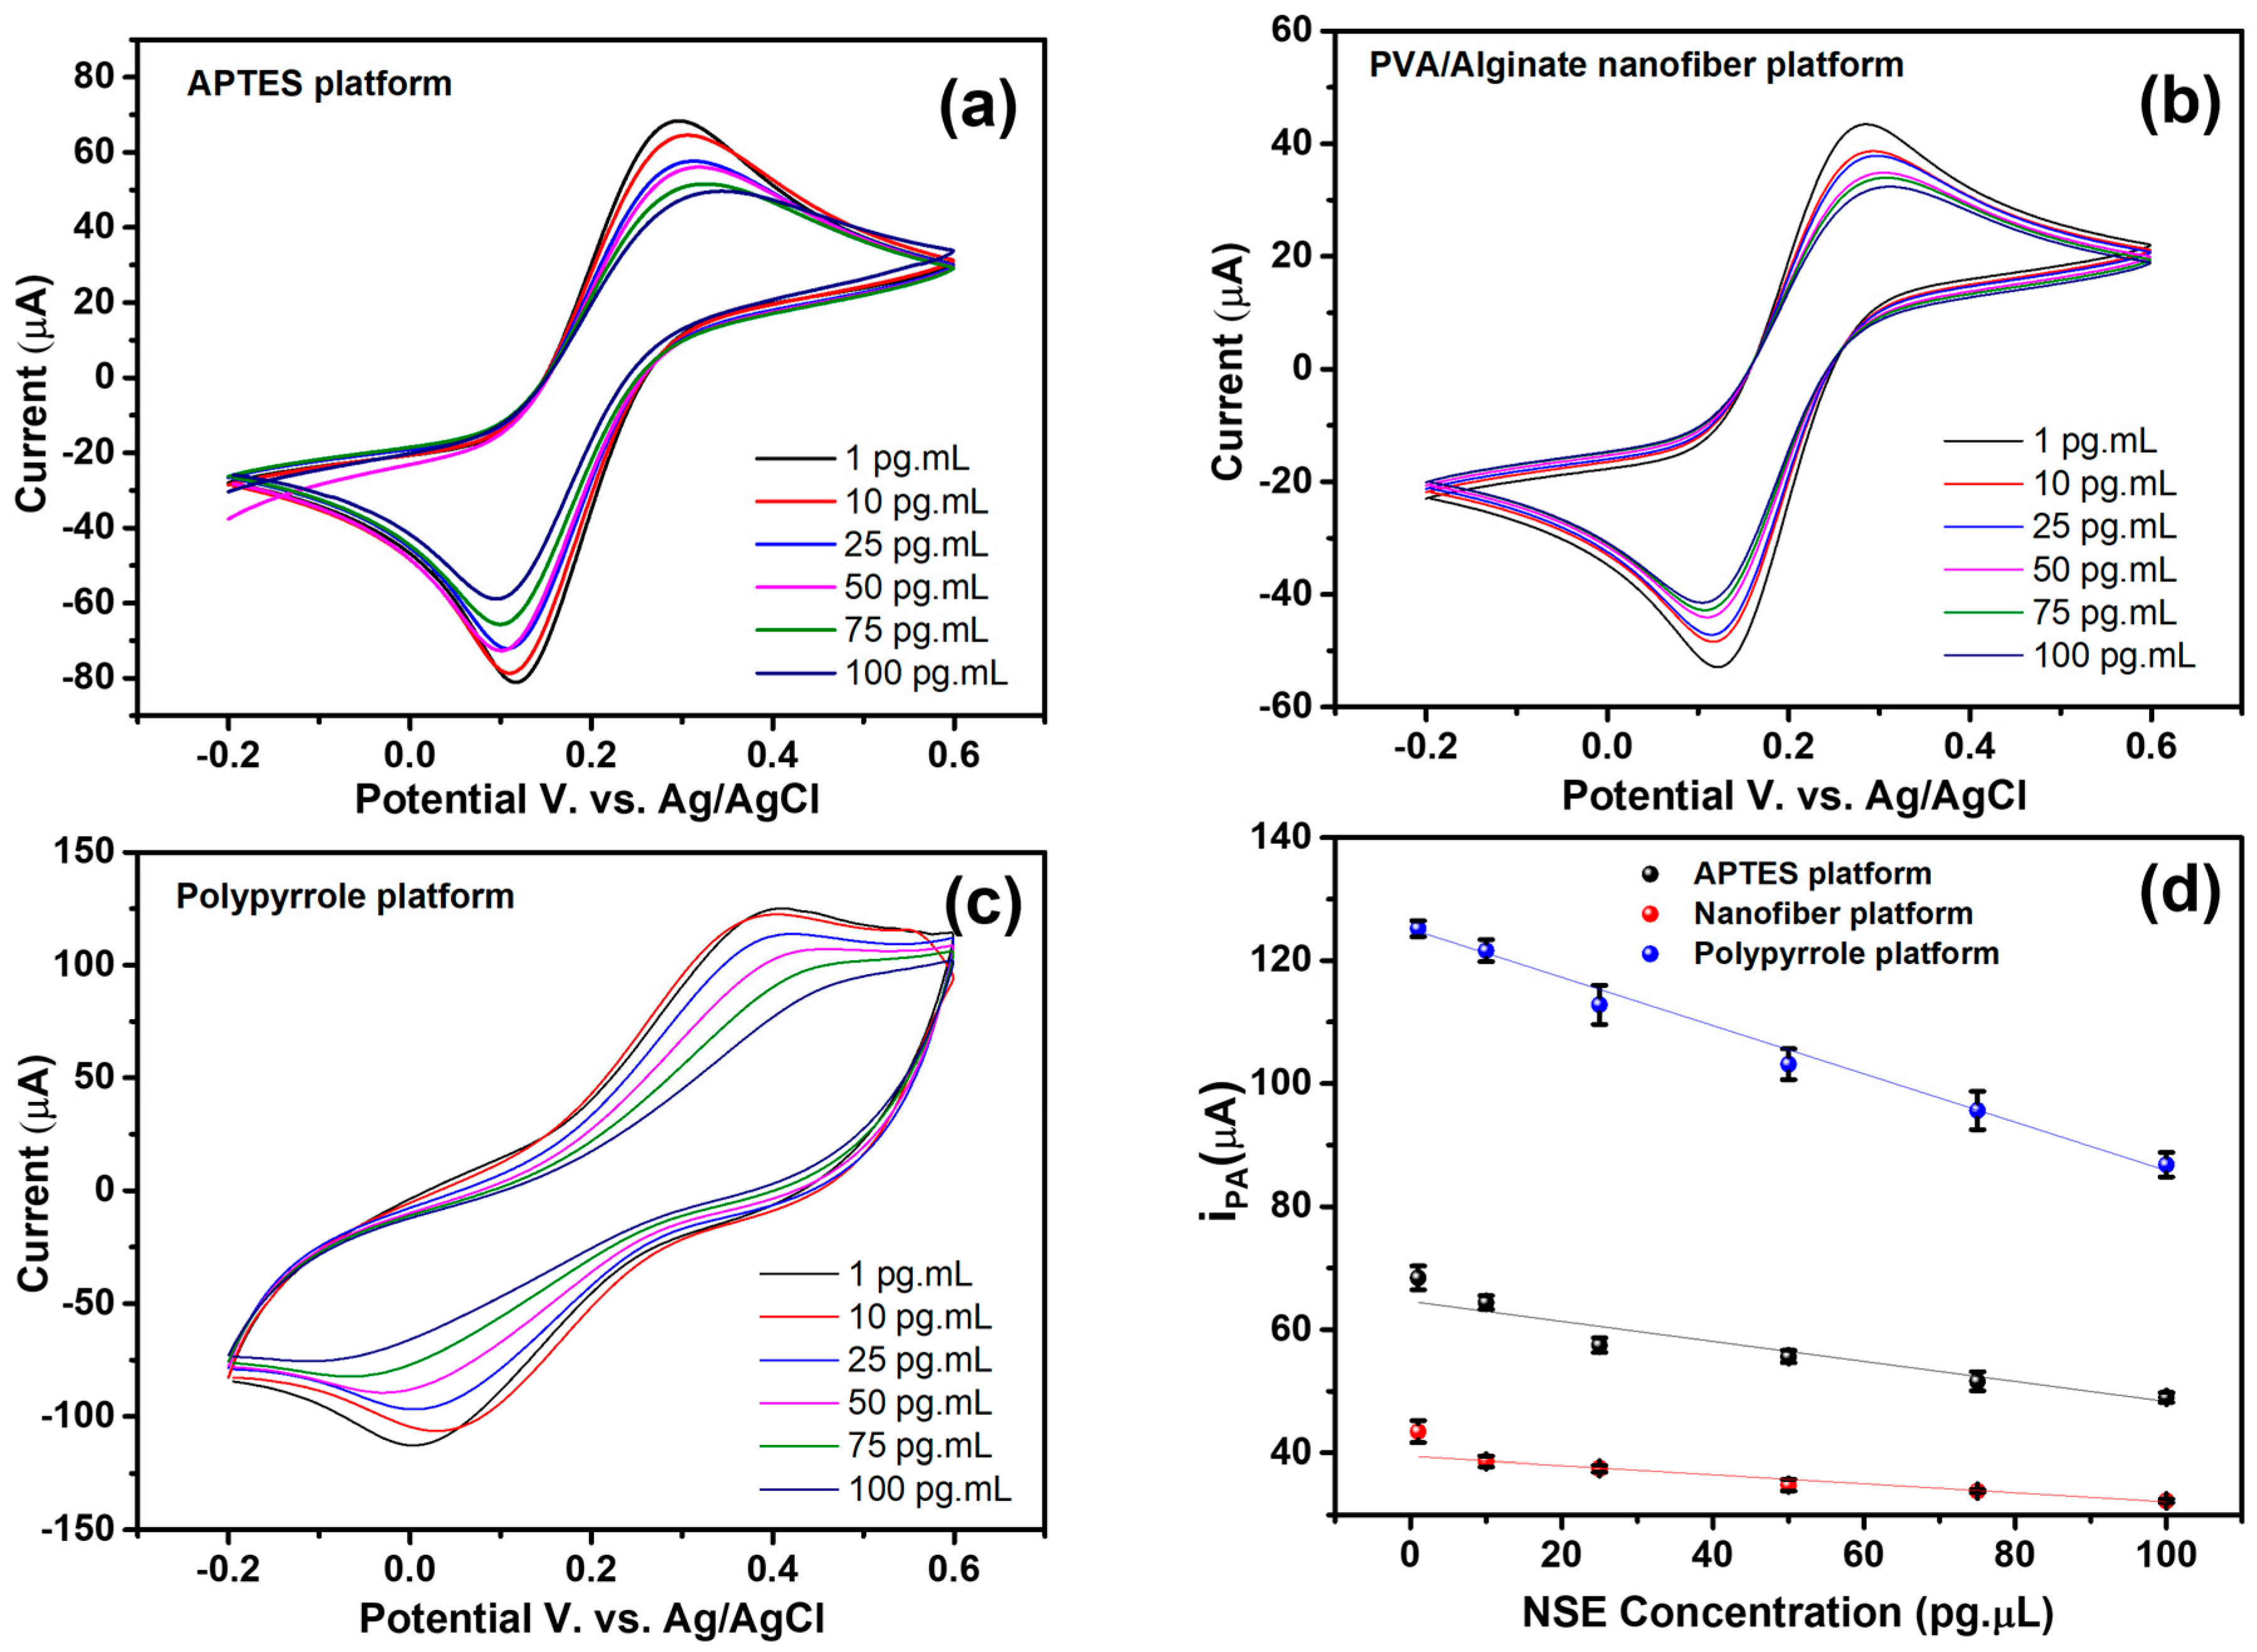
CV responses for identifying the NSE antigen are displayed in Figure 6a–c for APTES, nanofiber, and PPy platforms, respectively. Therefore, for the three sensor platforms under evaluation, an increase in the concentration of the target analyte was followed by a proportionate decrease in the voltammetric response and an increase in resistance for the impedimetric analysis. All platform options responded sensitively to low analyte concentrations. The platform featuring the conductive polymer PPy (Figure 6c) provided the most promising response for clinical applications. The polymer expanded the electrochemical reaction between different concentrations and improved conductivity, while also enhancing the contact surface between the analyte and the bioreceptor immobilized on the platform.
Figure 6d demonstrates the inverse relationship between the anodic peak current and the NSE biomarker concentration for the three platforms analyzed. This behavior is consistent with the gradual blockage of the active electrode surface due to the accumulation of the antigen–antibody complex, which reduces electron transfer [49]. The PPy-modified electrode exhibited the highest anodic currents at all concentrations, in addition to the best linearity (R2 = 0.99, y = −0.392x + 125.13), suggesting high conductivity and efficiency in biomolecular immobilization. The APTES platform exhibited an intermediate response (R2 = 0.90, y = −0.162x + 64.59), which is consistent with its good chemical stability but has lower intrinsic conductivity. Nanofibers exhibited the lowest currents, with R2 = 0.93 (y = −0.073x + 39.41), possibly due to their more porous structure, which increases the surface area but introduces greater resistance to charge transfer. The method’s sensitivity for NSE identification is supported by the linear trend observed across all platforms, and its significant R2 values indicate good reproducibility. The most promising material for electrochemical transduction, according to our data, is PPy; however, the other surfaces offer complementary possibilities that could be investigated based on their future applications.
Furthermore, the degree of antigen recognition by each designed sensing platform was evaluated by calculating the percentage of the anodic current variation’s relative deviation (ΔI) following CV analysis in the recognition of NSE [50]: Δ I % =   I b I a I b × 100 , where Ib is the anodic peak for the PPy-CdTe, APTES-CdTe, and PVA/Alg-CdTenanofiber sensing layer, and Ia is the peak current after the identification of NSE that led to antigen–antibody complexes. Results demonstrated a correlation between the target antigen and ΔI values as the concentration increased, as indicated in Table 1.
Based on the analysis of the voltammetric data, the PPy-CdTe-based sensor platform demonstrated superior performance compared to the others, as evidenced by higher anodic peak currents and a high linearity of response as a function of analyte concentration. These results indicate that the combination of polypyrrole with CdTe quantum dots enhances electrical conductivity and favors the efficient immobilization of recognition biomolecules, resulting in greater system sensitivity. Given this performance, the PPy-CdTe platform was selected for the subsequent characterization step using electrochemical impedance spectroscopy (EIS), aiming to evaluate the charge transfer mechanisms in more detail and assess the feasibility of its application in high-performance sensor devices.
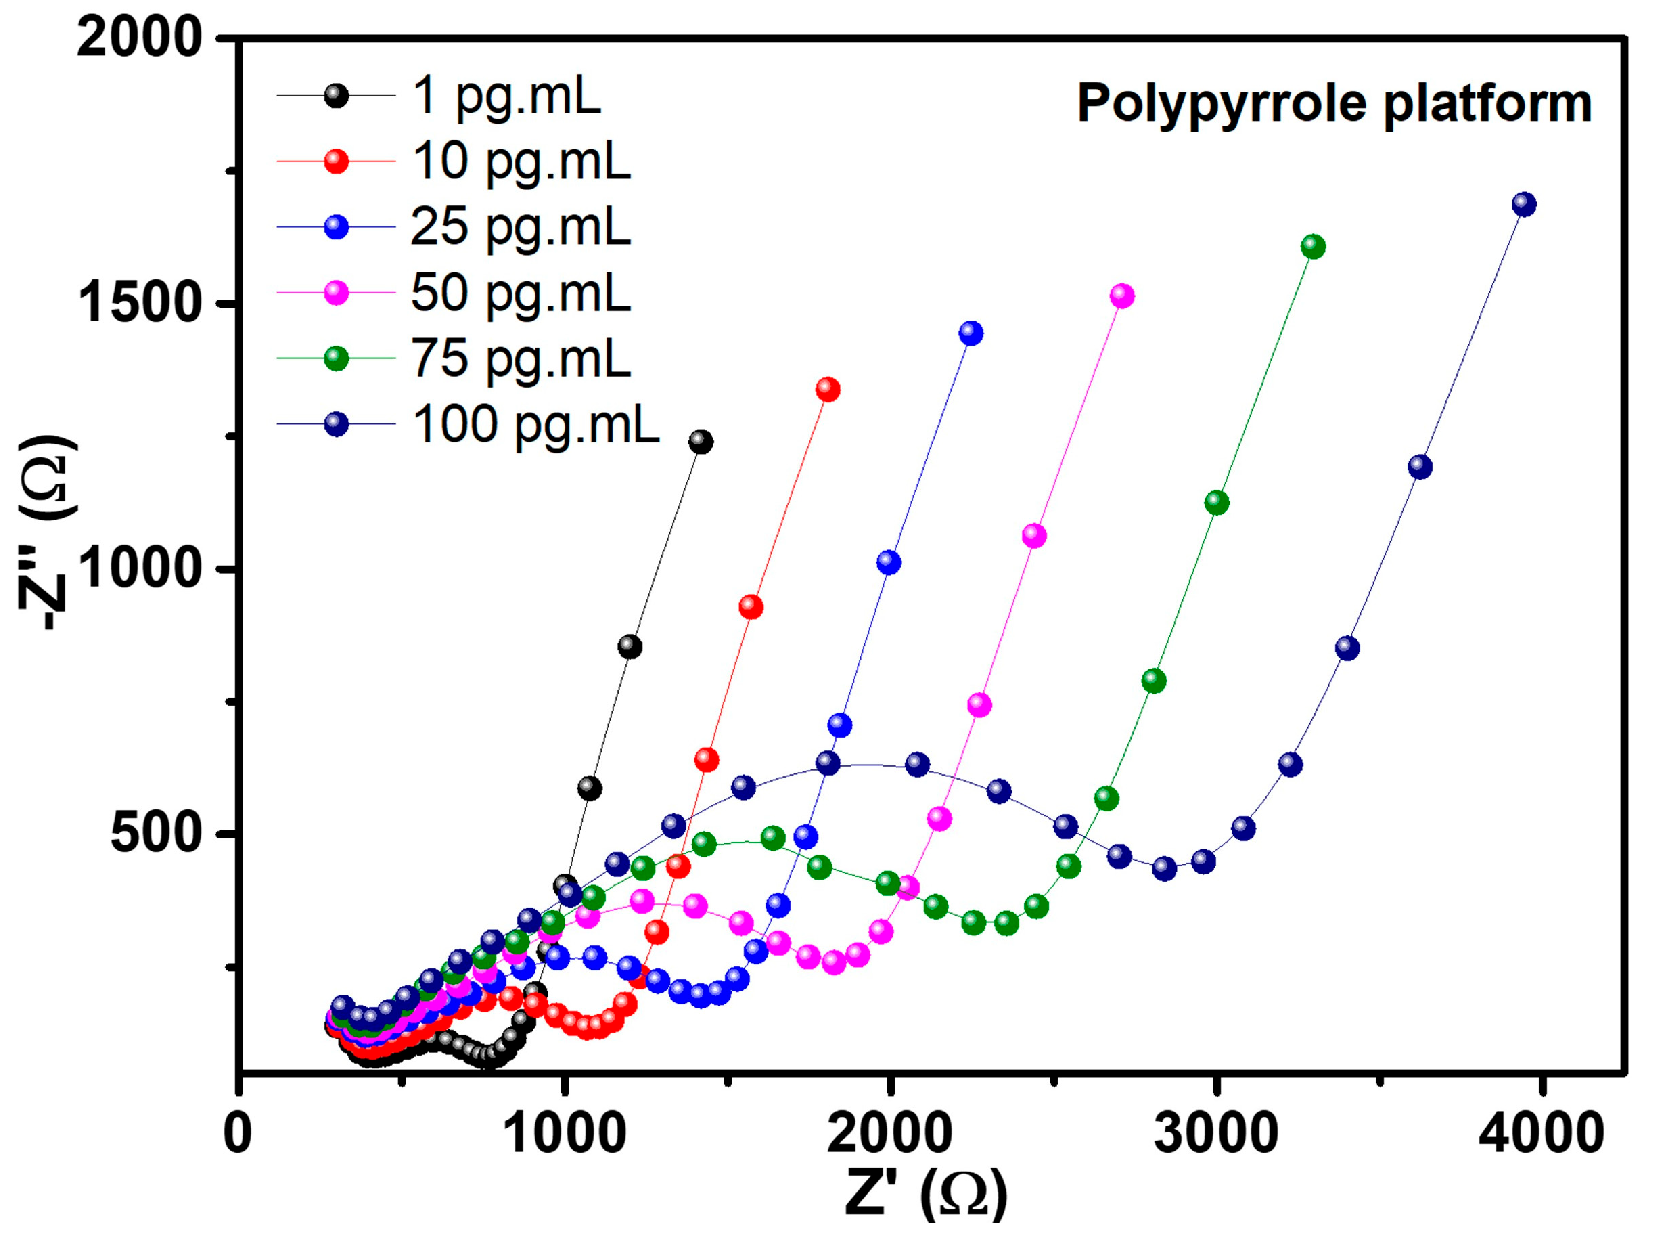
The behavior of electrochemical resistance to different concentrations of the NSE antigen for PPy-CdTe platform is shown by impedimetric measurements. Figure 7 illustrates the positive correlation between these responses and rising analyte concentration. The resulting Nyquist plots revealed that the PPy-CdTe platform demonstrated the best response, with greater sensitivity to the NSE antigen and a linear response. When exposed to analyte samples, RCT and CPE values progressively increase, as shown in Table 2.
The CPE represented the electrical double layer for a non-ideal capacitor, such as the one obtained by the platforms. This behavior may be associated with greater disorganization of the interface or increased surface heterogeneity, a typical characteristic of porous conductive films that, when adsorbing biomolecules, change the charge distribution and non-ideal capacitance of the electrode/solution interface [51]. The Randles equivalent circuit data for fitted impedance results are shown in Table 2.
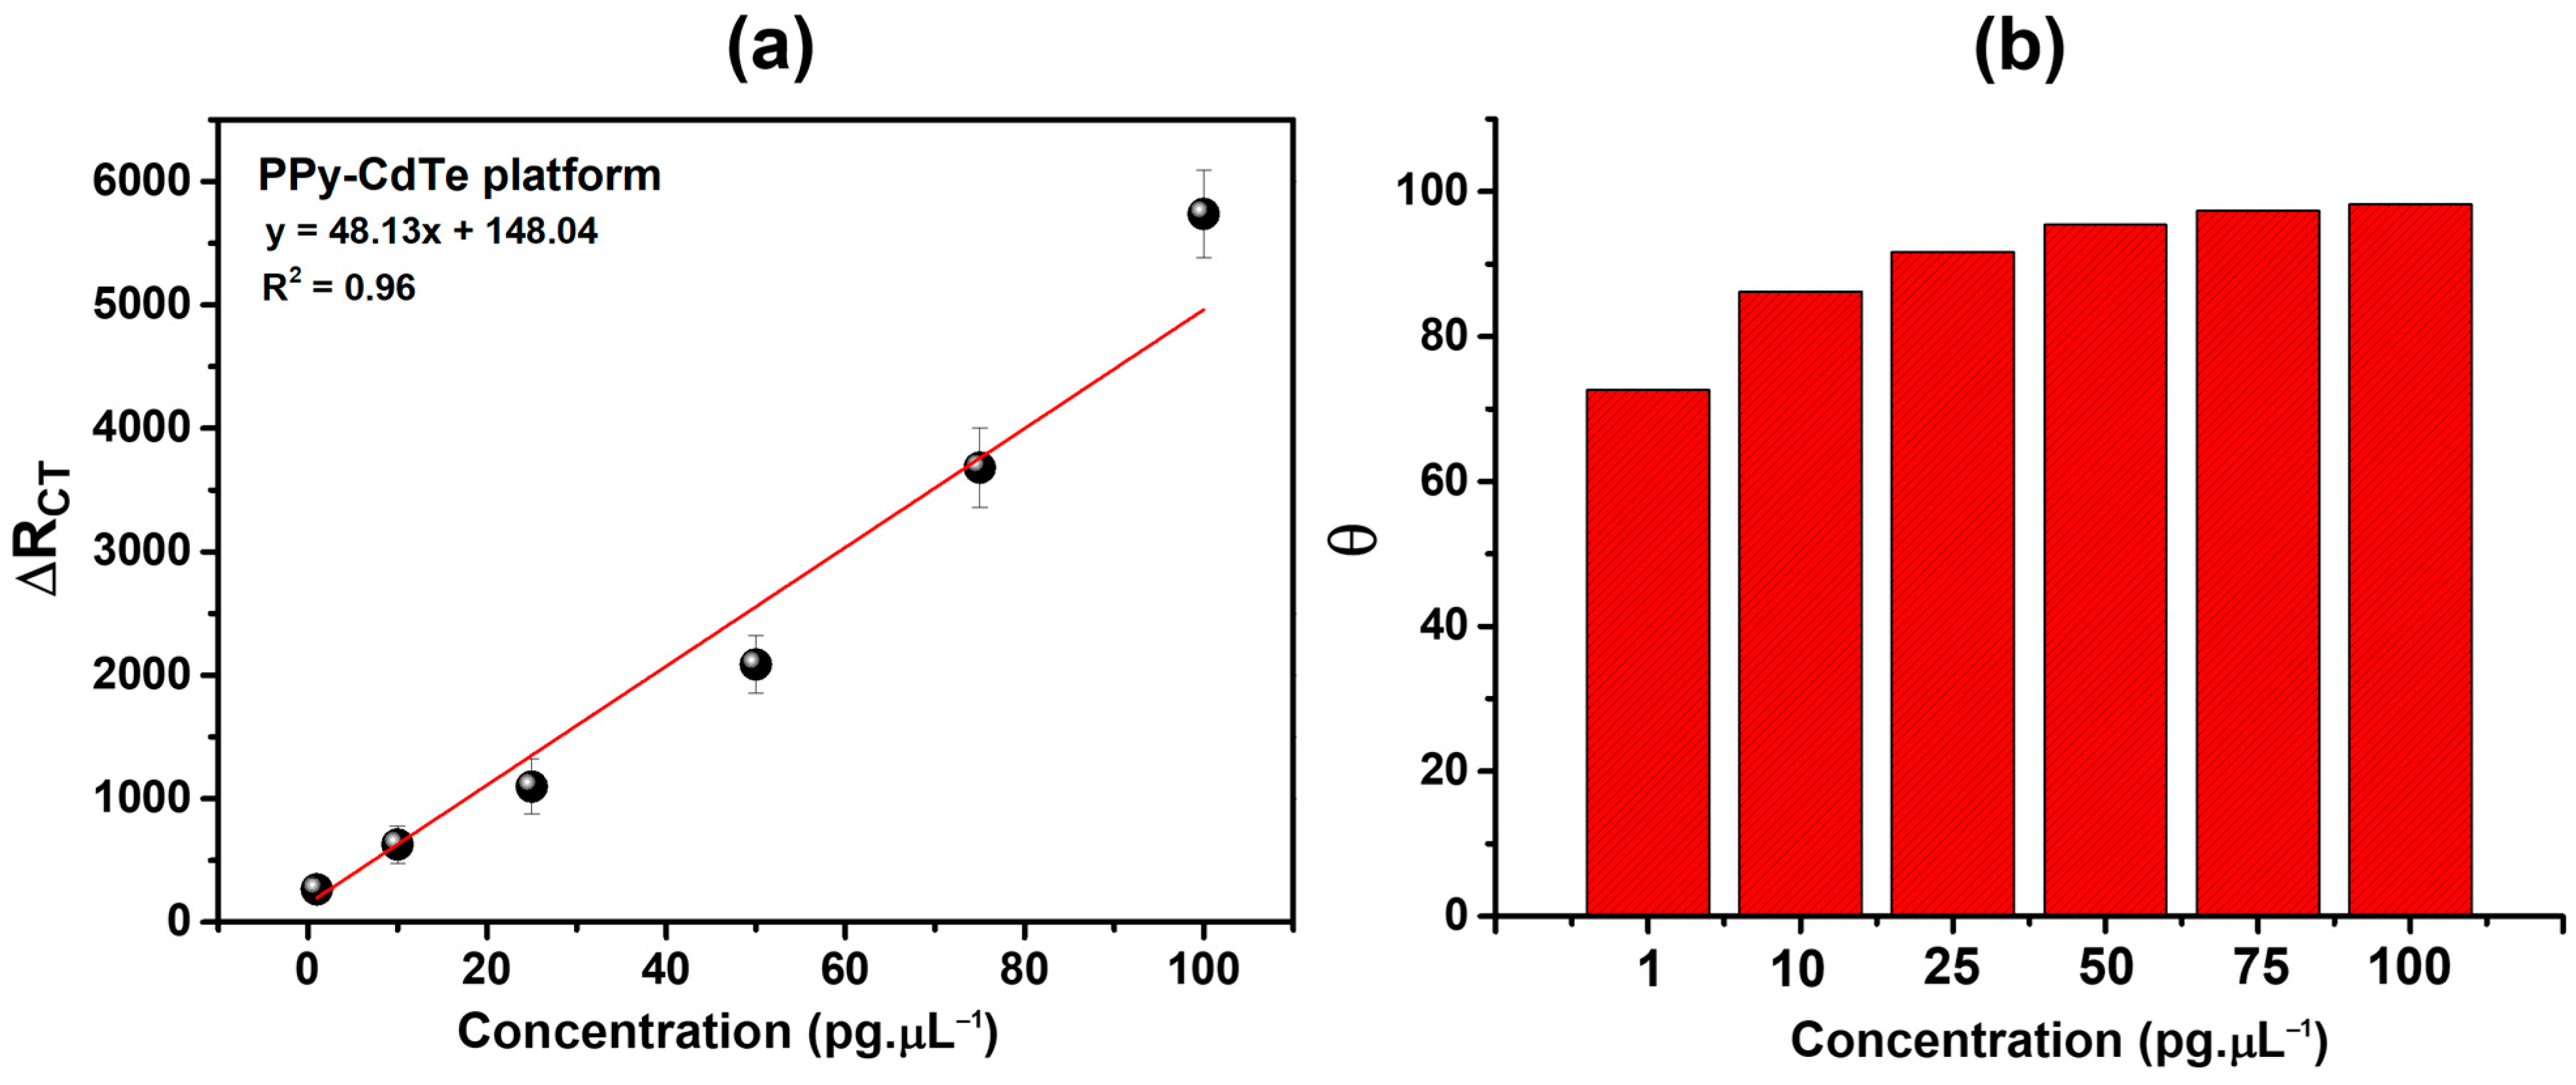
Furthermore, the relative variation in the RCTRCT) was assessed: Δ R C T   % =   R C T   ( a n t i g e n )     R C T   ( i m m u n o s e n s o r )   R C   T   ( i m m u n o s e n s o r )     × 100 , where RCT(antigen) is the RCT value after NSE recognition and RCT(immunosensor) is the sensing platform’s electrochemical resistance. The PPy-CdTe sensing platform exhibited a coefficient of determination (R2) of 0.97, as shown in Figure 8a, where ΔRCT values increased in proportion to the analyte concentration. The limit of quantification (LOQ = 10σ/S) and the limit of detection (LOD = 3σ/S) must be determined to characterize the sensitivity of biosensor platforms. These parameters are found using the analytical curve and are usually computed by dividing the slope of the curve (S) by the standard deviation of the blank response (σ). The LOQ is the lowest concentration of the analyte that can be measured with a reasonable level of accuracy and repeatability. At the same time, the LOD is the lowest concentration that can be detected but may not be quantified precisely [52]. The ability of the sensor platform to detect small amounts of the target analyte is demonstrated by low LOD and LOQ values. As a result, the Ppy-CdTe-based sensor platform presented an LOD and LOQ of 8.05 and 26.84 pg·µL−1, respectively. Thus, the values obtained indicate that this platform can reliably detect NSE from approximately 8 pg·µL−1 and perform accurate quantification above 27 pg·µL−1. Considering this, these measurements reinforce the analytical performance of the proposed methodology, making it more practically applicable to real samples.
NSE is typically found in the sera of healthy individuals at concentrations below 3–12 ng·mL−1, while elevated levels above 20 ng·mL−1 are commonly associated with lung cancer and other neuroendocrine tumors [53,54]. In this context, the LOD obtained with our platform (8.05 pg·µL−1, or 0.008 ng·µL−1) is several orders of magnitude lower than the physiological cutoff values used in clinical practice. This result demonstrates that the sensor is highly sensitive and capable of detecting NSE at concentrations well below those expected in both healthy and pathological conditions. Although our study focused on proof-of-concept validation and the comparative evaluation of different sensor platforms, the very low LOD highlights the potential of this approach for clinical translation, as it ensures the device can efficiently operate within the clinically relevant range of NSE concentrations.
As an additional metric to assess the level of biological recognition by the PPy-CdTe sensing platform, the degree of surface covering (θ) was used as follows [55]: θ % = 1   R C T   i m m u n o s e n s o r   R C T a n t i g e n   ×   100 , where RCT(immunosensor) is the RCT for each developed sensing platform and RCT(antigen) is the RCT values from NSE following interaction with the biosensor. At all NSE concentrations, the biodevices demonstrated a significant response (Figure 8b), with θ values increasing in a direct relationship to the analyte concentration. At 1 and 100 pg·µL−1, the sensor achieved θ = 0.72 (72%) and θ = 0.98 (98%), respectively. The PPy-CdTe-based sensor platform demonstrated a high degree of recognition of the target analyte, evidenced by the progressive increase in surface coating on the functionalized electrode. This behavior suggests high affinity between the modified surface and the analyte, reflecting an efficient interaction process that maximizes the occupation of available active sites. The increased degree of coating directly implies greater blockage of the conductive surface, which tends to impact charge transfer and, consequently, the electrochemical response of the system. These results reinforce the effectiveness of PPy-CdTe as an effective immobilization matrix, improving sensor sensitivity, and indicate significant potential for applications requiring accurate detection at low concentrations.
To further evaluate the selectivity of the developed biosensing platform, a comparative assay was performed using two additional biomarkers commonly associated with lung cancer, CYFRA 21-1 and interleukin-6 (IL-6) [56]. Both analytes were prepared under the same conditions and at a concentration of 1 pg, allowing a direct comparison with the response obtained for NSE.
The selectivity and specificity of the biosensor toward NSE were investigated in the presence of common serum components and potential interfering biomarkers. The measurements were performed using a simulated physiological matrix containing bovine serum albumin (0.6 mM), glucose (5 mM), and uric acid (0.3 mM) prepared in PBS pH 7.4 [57,58]. As shown in Figure S10a,b, the RCT of the PPy–CdTe platform increased markedly upon exposure to NSE, from 0.12 ± 0.01 kΩ (bare platform) to 0.40 ± 0.02 kΩ after target recognition. In contrast, when the biosensor was exposed to non-specific biomarkers such as CYFRA 21-1 and IL-6, the RCT values remained nearly unchanged (0.18 ± 0.03 and 0.17 ± 0.05 kΩ, respectively), indicating minimal interference. The relative standard deviation (RSD) for repeated measurements was ±3.4%, while the electrode-to-electrode variation exhibited an RSD below ±5.0%, demonstrating the excellent reproducibility and stability of the proposed system. These results confirm the specific affinity between the immobilized anti-NSE antibodies and their corresponding antigen, validating the biosensor’s selectivity even in the presence of typical biological interferents.
Recent advances in flexible biosensors for NSE have been achieved. For instance, Aydin developed a flexible electrode using an indium-tin oxide-PET (ITO-PET) electrode for detecting NSE in serum using EIS analysis [59]. The poly(glycidyl methacrylate) polymer provided functional groups for antibody immobilization, revealing a LOD of 9.1 fg/mL. In addition, Mehta and coworkers developed a label-free flexible immunosensor for NSE using polydopamine and carbon nanotubes [60]. A LOD of 120 pM was obtained using differential pulse voltammetry (DPV). In a recent work, Zu and team produced a boron–nitrogen co-doped graphene-based antenna immunosensor for NSE detection. A flexible poly(dimethylsiloxane) substrate was used for assembling the platform, where their sensor presented a LOD of 10.99 fg·mL−1 [61].
While these studies demonstrate remarkable sensitivity, they often rely on costly nanomaterials or complex surface modifications that can limit large-scale application. In contrast, our work introduces a microcontact printing approach to fabricate patterned electrodes directly on PET substrates, combining flexibility, reproducibility, and eco-friendly processing. The use of PPy–CdTe films further ensured robust electrochemical performance without the need for multiple modification steps. This strategy provides a scalable and sustainable alternative, positioning our platform as a promising candidate for practical NSE detection and for adaptation to other clinically relevant biomarkers. Regarding real samples, at this stage, we aimed to establish the feasibility of NSE detection on innovative electrode configurations. In future work, we intend to build upon the most promising platform identified here (PPy-CdTe) and expand the evaluation to include reproducibility tests, stability studies, interference analysis, and validation with clinical samples.

4. Conclusions

This study successfully demonstrated the development of flexible electrodes fabricated on PET substrates through the µCP technique, highlighting a scalable and reproducible approach for biosensor manufacturing. The use of reusable PDMS stamps with electrode patterns enabled consistent production, distinguishing it as a cost-effective and sustainable strategy for sensor development. In addition, using PET as the substrate further contributes to the eco-friendly character. Three distinct sensing platforms were established on the flexible electrodes to standardize their performance for NSE detection: an APTES-modified surface, electrospun PVA/alginate nanofibers, and electropolymerized PPy films, all further functionalized with CdTe quantum dots. Voltammetric analyses revealed that all configurations were able to recognize the target biomarker, confirming the robustness of the proposed electrode design. However, the PPy–CdTe platform demonstrated the highest sensitivity, with a marked improvement in ΔI response. To further evaluate the most promising configuration, impedance spectroscopy was performed on the PPy–CdTe electrodes, revealing a clear linear correlation between NSE concentration and the charge-transfer resistance (RCT). From this analysis, a detection limit of 8.05 pg·µL−1 and a quantification limit of 26.84 pg·µL−1 were obtained, highlighting the system’s sensitivity. Overall, the outcomes presented herein demonstrate that microcontact-printed flexible PET electrodes are a versatile and environmentally conscious tool for biosensing. The integration of conducting polymers with semiconductor nanomaterials has been shown to enhance analytical performance, enabling the precise and reliable detection of target analytes at clinically relevant concentrations. These results not only validate the potential of the PPy–CdTe platform for NSE monitoring but also set a goal for broader applications for other biomarkers of clinical interest. Our study focused on proof-of-concept demonstrations of sensing capability rather than on the complete analytical validation required for clinical application. Moreover, the device was designed as a single-use sensor, which reduces the relevance of reusability and long-term stability issues. The fabrication method employed here, primarily through µCP, ensures good reproducibility in electrode preparation. However, a quantitative evaluation of batch-to-batch variation was beyond the scope of the present manuscript. In future work, this platform can be adapted for multiplex detection, enabling the simultaneous identification of multiple lung cancer biomarkers. Such an approach would significantly enhance diagnostic accuracy and clinical relevance. Additionally, integrating the sensor with portable point-of-care devices could facilitate rapid and low-cost testing in non-laboratory settings, particularly in low-income countries. Overall, our study opens promising pathways toward practical and sustainable biosensing technologies.

Supplementary Materials

The following supporting information can be downloaded at: https://www.mdpi.com/article/10.3390/chemosensors13110377/s1, Figure S1: Silicon SU8 master mold. Figure S2: Manufacturing process of polydimethylsiloxane (PDMS) stamps with electrode patterns. Figure S3: Schematic representation of the production process of electrodes on flexible substrates using INNOSTAMP 40. Figure S4: Electrode production during wet etching treatment (a) and its dimensions (b). Figure S5: Electrochemical cell. (a) Bottom view, (b) top and front view (c) of the electrochemical cell, the arrow indicates the location of the flexible electrode produced by the µCP technique. (d) Assembled electrochemical cell with counter (black) and reference (blue) electrodes in the solution of 10 mM K4[Fe(CN)6]/K3[Fe(CN)6] (1:1, v/v). Figure S6: Water contact angle measurements for the µCP gold electrode (a) and sensor platform based on APTES (b), polymer nanofiber (c) and polypyrrole (d). Figure S7: X-ray diffractograms (XRD) of the samples: PVA powder (green line), alginate powder (red line), and PVA/Alginate nanofibers (black line). (a) Comparative experimental diffractograms, highlighting the differences in the diffraction peaks associated with the crystallinity of each material. (b) Diffractogram of the PVA/Alginate nanofiber with reference standards (colored vertical lines) obtained from a crystallographic database, used to identify the present phases. Figure S8: TGA results for the electrospun PVA/alginate nanofibers before (a) and after crosslinking (b). Figure S9: Nyquist diagrams of each biosensor assembly step: (a) APTES platform, (b) PVA/alginate nanofiber and (c) Ppy platform. Figure S10: Nyquist plot (a) and RCT (b) for the selectivity study with interfering molecules; Table S1: Randles equivalent circuit for the elements of the sensor platforms.

Author Contributions

A.G.S.-J.: writing—original draft, methodology, investigation, formal analysis, data curation. A.E.: conceptualization, supervision, methodology, writing—review and editing, project administration, funding acquisition, visualization, formal analysis, supervision, validation, data curation. N.Z.: conceptualization, supervision, methodology, writing—review and editing, project administration, visualization, formal analysis, supervision, validation. M.H.: investigation, resources, data curation. G.R.: investigation, resources, data curation. M.D.L.O.: conceptualization, supervision, visualization, methodology, writing—review and editing, project administration, funding acquisition. M.C.P.: supervision, resources, visualization. C.A.S.A.: conceptualization, supervision, methodology, writing—review and editing, data curation, project administration, funding acquisition. All authors have read and agreed to the published version of the manuscript.

Funding

The authors are grateful for the support from the Brazilian National Council for Scientific and Technological Development (CNPq) (grant number 304678/2021-0 and 304680/2021-4), Foundation for the Support of Science and Technology of the State of Pernambuco (FACEPE) (grant numbers APQ-0425-2.01/22 and APQ-0384-2.01/19) and the Coordination for the Improvement of Higher Education Personnel (CAPES) (grant number 88881.878936/2023-01—CAPES/COFECUB).

Institutional Review Board Statement

Not applicable.

Informed Consent Statement

Not applicable.

Data Availability Statement

The data presented in this study is available on request from the corresponding author.

Conflicts of Interest

The authors declare no conflicts of interest.

References

  1. Thandra, K.C.; Barsouk, A.; Saginala, K.; Aluru, J.S.; Barsouk, A. Epidemiology of Lung Cancer. Contemp. Oncol. 2021, 25, 45. [Google Scholar] [CrossRef]
  2. Gierada, D.S.; Black, W.C.; Chiles, C.; Pinsky, P.F.; Yankelevitz, D.F. Low-Dose Ct Screening for Lung Cancer: Evidence from 2 Decades of Study. Radiol. Imaging Cancer 2020, 2, e190058. [Google Scholar] [CrossRef]
  3. Bhatia, D.; Paul, S.; Acharjee, T.; Ramachairy, S.S. Biosensors and Their Widespread Impact on Human Health. Sens. Int. 2024, 5, 100257. [Google Scholar] [CrossRef]
  4. Hasan, M.R.; Ahommed, M.S.; Daizy, M.; Bacchu, M.S.; Ali, M.R.; Al-Mamun, M.R.; Saad Aly, M.A.; Khan, M.Z.H.; Hossain, S.I. Recent Development in Electrochemical Biosensors for Cancer Biomarkers Detection. Biosens. Bioelectron. X 2021, 8, 100075. [Google Scholar] [CrossRef]
  5. Tian, Z.; Liang, C.; Zhang, Z.; Wen, H.; Feng, H.; Ma, Q.; Liu, D.; Qiang, G. Prognostic Value of Neuron-Specific Enolase for Small Cell Lung Cancer: A Systematic Review and Meta-Analysis. World J. Surg. Oncol. 2020, 18, 116. [Google Scholar] [CrossRef]
  6. Mehta, D.; Gupta, D.; Kafle, A.; Kaur, S.; Nagaiah, T.C. Advances and Challenges in Nanomaterial-Based Electrochemical Immunosensors for Small Cell Lung Cancer Biomarker Neuron-Specific Enolase. ACS Omega 2024, 9, 33–51. [Google Scholar] [CrossRef] [PubMed]
  7. Sanjayan, C.G.; Ravikumar, C.H.; Balakrishna, R.G. Perovskite QD Based Paper Microfluidic Device for Simultaneous Detection of Lung Cancer Biomarkers—Carcinoembryonic Antigen and Neuron Specific Enolase. Chem. Eng. J. 2023, 464, 142581. [Google Scholar] [CrossRef]
  8. Lin, C.; Wang, Y.; Peng, T.; Liu, P.; Liang, Y.; Kang, W.; Yu, X.; Song, Y.; Shentu, X. Absolute Quantification of Neuron-Specific Enolase Based on Surface Plasmon Resonance. SLAS Discov. 2025, 30, 100205. [Google Scholar] [CrossRef]
  9. Chen, W.; Hu, S.; Zhou, B.; Ren, Y.; Xue, Y.; Yang, R. Label-Free Immunoassay Based on Chemiluminescence-Functionalized Magnetic Mesoporous Nanoparticles for Rapid Detection of Neuron-Specific Enolase. Microchim. Acta 2025, 192, 638. [Google Scholar] [CrossRef] [PubMed]
  10. He, S.; Feng, S.; Nag, A.; Afsarimanesh, N.; Han, T.; Mukhopadhyay, S.C. Recent Progress in 3D Printed Mold-Based Sensors. Sensors 2020, 20, 703. [Google Scholar] [CrossRef] [PubMed]
  11. Abbasi, A.D.; Hussain, Z.; Yang, K.-L. Aptamer-Based Gold Nanoparticles–PDMS Composite Stamps as a Platform for Micro-Contact Printing. Biosensors 2022, 12, 1067. [Google Scholar] [CrossRef] [PubMed]
  12. Li, H.; Zhang, H.; Luo, W.; Yuan, R.; Zhao, Y.; Huang, J.-A.; Yang, X. Microcontact Printing of Gold Nanoparticle at Three-Phase Interface as Flexible Substrate for SERS Detection of MicroRNA. Anal. Chim. Acta 2022, 1229, 340380. [Google Scholar] [CrossRef]
  13. Song, Y.; Ya, Y.; Cen, X.; Tang, D.; Shi, J.; Wu, Y.; Luo, H.; Huang, K.-J.; Tan, X.; Yan, F. Multiple Signal Amplification Strategy Induced by Biomarkers of Lung Cancer: A Self-Powered Biosensing Platform Adapted for Smartphones. Int. J. Biol. Macromol. 2024, 264, 130661. [Google Scholar] [CrossRef] [PubMed]
  14. Shankar, S.; Kumar, Y.; Sharma, N.; Chandra, R.; Kumar, S. Disposable Zirconium Trisulfide-Reduced Graphene Oxide Modified Conducting Thread Based Electrochemical Biosensor for Lung Cancer Diagnosis. Bioelectrochemistry 2024, 160, 108801. [Google Scholar] [CrossRef]
  15. Li, J.; Liu, S.; Aligayev, A.; Jiang, H.; Muhammad; Wang, S.; Yu, X.; Tao, J.; Wang, J.; Jastrzębska, A.; et al. Dual-Mode SERS and Colorimetric Sensor for Lung Cancer VOC-Biomarker Detection Using Hydrogel Patches. Chem. Eng. J. 2025, 523, 168343. [Google Scholar] [CrossRef]
  16. Ullah, S.; Hashmi, M.; Hussain, N.; Ullah, A.; Sarwar, M.N.; Saito, Y.; Kim, S.H.; Kim, I.S. Stabilized Nanofibers of Polyvinyl Alcohol (PVA) Crosslinked by Unique Method for Efficient Removal of Heavy Metal Ions. J. Water Process Eng. 2020, 33, 101111. [Google Scholar] [CrossRef]
  17. Bechu, A.; Liao, J.; Huang, C.; Ahn, C.; McKeague, M.; Ghoshal, S.; Moores, A. Cadmium-Containing Quantum Dots Used in Electronic Displays: Implications for Toxicity and Environmental Transformations. ACS Appl. Nano Mater. 2021, 4, 8417–8428. [Google Scholar] [CrossRef]
  18. Santos, L.G.T.; Silva-Junior, A.G.; Costa, M.P.; Avelino, K.Y.P.S.; Lucena-Silva, N.; Andrade, C.A.S.; Oliveira, M.D.L. Nanostructured Genosensor Platform Based on Polypyrrole Film and Graphene Quantum Dots for the Detection of High-Risk HPV. J. Pharm. Biomed. Anal. 2025, 263, 116920. [Google Scholar] [CrossRef]
  19. Yang, X.M.; Zhong, Z.W.; Diallo, E.M.; Wang, Z.H.; Yue, W.S. Silicon Wafer Wettability and Aging Behaviors: Impact on Gold Thin-Film Morphology. Mater. Sci. Semicond. Process. 2014, 26, 25–32. [Google Scholar] [CrossRef]
  20. Vashist, S.K.; Lam, E.; Hrapovic, S.; Male, K.B.; Luong, J.H.T. Immobilization of Antibodies and Enzymes on 3-Aminopropyltriethoxysilane-Functionalized Bioanalytical Platforms for Biosensors and Diagnostics. Chem. Rev. 2014, 114, 11083–11130. [Google Scholar] [CrossRef]
  21. Yang, J.M.; Yang, J.H.; Tsou, S.C.; Ding, C.H.; Hsu, C.C.; Yang, K.C.; Yang, C.C.; Chen, K.S.; Chen, S.W.; Wang, J.S. Cell Proliferation on PVA/Sodium Alginate and PVA/Poly(γ-Glutamic Acid) Electrospun Fiber. Mater. Sci. Eng. C 2016, 66, 170–177. [Google Scholar] [CrossRef]
  22. Mahmoodian, M.; Pourabbas, B.; Mohajerzadeh, S. Effect of Anionic Dopants on Thickness, Morphology and Electrical Properties of Polypyrrole Ultra-Thin Films Prepared by in Situ Chemical Polymerization. Thin Solid Films 2015, 583, 255–263. [Google Scholar] [CrossRef]
  23. Siva, N.; Gunda, K.; Singh, M.; Norman, L.; Kaur, K.; Mitra, S.K. Applied Surface Science Optimization and Characterization of Biomolecule Immobilization on Silicon Substrates Using (3-Aminopropyl) Triethoxysilane (APTES) and Glutaraldehyde Linker. Appl. Surf. Sci. 2014, 305, 522–530. [Google Scholar] [CrossRef]
  24. Pasternack, R.M.; Rivillon Amy, S.; Chabal, Y.J. Attachment of 3-(Aminopropyl)Triethoxysilane on Silicon Oxide Surfaces: Dependence on Solution Temperature. Langmuir 2008, 24, 12963–12971. [Google Scholar] [CrossRef] [PubMed]
  25. Tan, G.; Zhang, L.; Ning, C.; Liu, X.; Liao, J. Preparation and Characterization of APTES Films on Modification Titanium by SAMs. Thin Solid Films 2011, 519, 4997–5001. [Google Scholar] [CrossRef]
  26. Kharat, H.J.; Kakde, K.P.; Savale, P.A.; Datta, K.; Ghosh, P.; Shirsat, M.D. Synthesis of Polypyrrole Films for the Development of Ammonia Sensor. Polym. Adv. Technol. 2007, 18, 397–402. [Google Scholar] [CrossRef]
  27. Arora, K.; Chaubey, A.; Singhal, R.; Singh, R.P.; Pandey, M.K.; Samanta, S.B.; Malhotra, B.D.; Chand, S. Application of Electrochemically Prepared Polypyrrole–Polyvinyl Sulphonate Films to DNA Biosensor. Biosens. Bioelectron. 2006, 21, 1777–1783. [Google Scholar] [CrossRef]
  28. Mohamad, R.; Jamil, N.A.; Wee, M.F.M.R.; Mohamed, M.A.; Azam, M.A.; Hamzah, A.A.; Menon, P.S. Deposition of Polypyrrole-Carboxylated Multi-Walled Carbon Nanotube Nanohybrid Thin Film for Surface Plasmon Resonance Sensor. Int. J. Nanoelectron. Mater. 2023, 16, 305–315. [Google Scholar] [CrossRef]
  29. Islam, M.S.; Karim, M.R. Fabrication and Characterization of Poly(Vinyl Alcohol)/Alginate Blend Nanofibers by Electrospinning Method. Colloids Surf. A Physicochem. Eng. Asp. 2010, 366, 135–140. [Google Scholar] [CrossRef]
  30. Jayasekara, R.; Harding, I.; Bowater, I.; Christie, G.B.Y.; Lonergan, G.T. Preparation, Surface Modification and Characterisation of Solution Cast Starch PVA Blended Films. Polym. Test. 2004, 23, 17–27. [Google Scholar] [CrossRef]
  31. Aloma, K.K.; Sukaryo, S.; Fahlawati, N.I.; Dahlan, K.; Oemar, S. Synthesis of Nanofibers from Alginate-Polyvinyl Alcohol Using Electrospinning Methods. Macromol. Symp. 2020, 391, 1900199. [Google Scholar] [CrossRef]
  32. Rafiq, M.; Hussain, T.; Abid, S.; Nazir, A.; Masood, R. Development of Sodium Alginate/PVA Antibacterial Nanofibers by the Incorporation of Essential Oils. Mater. Res. Express 2018, 5, 35007. [Google Scholar] [CrossRef]
  33. Fahmy, A.; Badry, R.; Mabied, A.F.; Wassel, A.R.; Khafagy, R.M.; Ibrahim, M.A. Application of Electrospun Polyvinyl Alcohol/Sodium Alginate Nanofibers as Biosensor. J. Inorg. Organomet. Polym. Mater. 2025, 1–21. [Google Scholar] [CrossRef]
  34. Mansur, H.S.; Oréfice, R.L.; Mansur, A.A.P. Characterization of Poly(Vinyl Alcohol)/Poly(Ethylene Glycol) Hydrogels and PVA-Derived Hybrids by Small-Angle X-Ray Scattering and FTIR Spectroscopy. Polymer 2004, 45, 7193–7202. [Google Scholar] [CrossRef]
  35. Helmiyati; Aprilliza, M. Characterization and Properties of Sodium Alginate from Brown Algae Used as an Ecofriendly Superabsorbent. IOP Conf. Ser. Mater. Sci. Eng. 2017, 188, 12019. [Google Scholar] [CrossRef]
  36. Sionkowska, A. Current Research on the Blends of Natural and Synthetic Polymers as New Biomaterials: Review. Prog. Polym. Sci. 2011, 36, 1254–1276. [Google Scholar] [CrossRef]
  37. Ozturk, M.K.; Nergis, B.; Candan, C. Thermal Analysis of PVA Nanofibrous Membranes. IOP Conf. Ser. Mater. Sci. Eng. 2018, 460, 12048. [Google Scholar] [CrossRef]
  38. Qin, X.; Dou, G.; Jiang, G.; Zhang, S. Characterization of Poly (Vinyl Alcohol) Nanofiber Mats Cross-Linked with Glutaraldehyde. J. Ind. Text. 2012, 43, 34–44. [Google Scholar] [CrossRef]
  39. Yamada, H.; Yoshii, K.; Asahi, M.; Chiku, M.; Kitazumi, Y. Cyclic Voltammetry Part 1: Fundamentals. Electrochemistry 2022, 90, 102005. [Google Scholar] [CrossRef]
  40. Saxena, R.; Srivastava, S. An Insight into Impedimetric Immunosensor and Its Electrical Equivalent Circuit. Sens. Actuators B Chem. 2019, 297, 126780. [Google Scholar] [CrossRef]
  41. Lee, J.-Y.; Park, E.-J.; Lee, C.-J.; Kim, S.-W.; Pak, J.J.; Min, N.K. Flexible Electrochemical Biosensors Based on O2 Plasma Functionalized MWCNT. Thin Solid Films 2009, 517, 3883–3887. [Google Scholar] [CrossRef]
  42. Lucena, R.P.S.; Silva-Junior, A.G.; Frías, I.A.M.; Gil, L.H.V.; Cordeiro, M.T.; El Salhi, A.E.; Andrade, C.A.S.; Oliveira, M.D.L. Microcontact Printing of Lectin Self-Assembled Monolayers for Arbovirus Detection. Biotechnol. Prog. 2025, 41, e70008. [Google Scholar] [CrossRef] [PubMed]
  43. Ekici, R.; Bozdoğan, B.; Denkbaş, E.B. Development of Electrochemical Biosensor Platforms for Determination of Environmental Viral Structures. Appl. Sci. 2022, 12, 12971. [Google Scholar] [CrossRef]
  44. Brett, C.M.A. Electrochemical Impedance Spectroscopy in the Electrochemical Sensors and Biosensors. Molecules 2022, 27, 1497. [Google Scholar] [CrossRef] [PubMed]
  45. Pajkossy, T. Voltammetry Coupled with Impedance Spectroscopy. J. Solid State Electrochem. 2020, 24, 2157–2159. [Google Scholar] [CrossRef]
  46. Couto, M.T.T.; Silva Júnior, A.G.; Avelino, K.Y.P.d.S.; Gil, L.H.V.G.; Cordeiro, M.T.; Oliveira, M.D.L.; Souza de Andrade, C.A.A.S. Development of Optical and Electrochemical Immunodevice for the Dengue Virus Detection. Anal. Methods 2024, 16, 3539–3550. [Google Scholar] [CrossRef]
  47. Tabish, T.A.; Hayat, H.; Abbas, A.; Narayan, R.J. Graphene Quantum Dots-Based Electrochemical Biosensing Platform for Early Detection of Acute Myocardial Infarction. Biosensors 2022, 12, 77. [Google Scholar] [CrossRef]
  48. Tabish, T.A.; Hayat, H.; Abbas, A.; Narayan, R.J. Graphene Quantum Dot-Based Electrochemical Biosensing for Early Cancer Detection. Curr. Opin. Electrochem. 2021, 30, 100786. [Google Scholar] [CrossRef]
  49. Nunez, F.A.; de Oliveira, V.L.; Remuzgo, C.; Silva, M.R.d.A.; Daher, I.; Oliveira, J.R.; Silva, T.L.; Cunha-Neto, E.; Kalil, J.; Santos, K.S.; et al. Electrochemical Immunosensor for Antibody Recognition against SARS-CoV-2 B-Cell Epitope: Impact of RBD Mutations on Antigen–Antibody Binding. J. Mater. Chem. B 2025, 13, 9925–9936. [Google Scholar] [CrossRef] [PubMed]
  50. Dantas, H.B.; Silva-Junior, A.G.; Silva, N.L.C.L.; Errachid, A.; Oliveira, M.D.L.; Andrade, C.A.S. Genosensor Based on Polypyrrole and Dendrimer-Coated Gold Nanoparticles for Human Papillomavirus Detection. Biochem. Eng. J. 2025, 213, 109551. [Google Scholar] [CrossRef]
  51. Avelino, K.Y.P.S.; Silva-junior, A.G.; Pitta, M.G.R.; Errachid, A.; Oliveira, M.D.L.; Andrade, A.S. Nanoimmunosensor for the Electrochemical Detection of Oncostatin M Receptor and Monoclonal Autoantibodies in Systemic Sclerosis. Talanta 2023, 256, 124285. [Google Scholar] [CrossRef] [PubMed]
  52. Moulahoum, H.; Ghorbanizamani, F. The LOD Paradox: When Lower Isn’t Always Better in Biosensor Research and Development. Biosens. Bioelectron. 2024, 264, 116670. [Google Scholar] [CrossRef]
  53. Genet, S.A.A.M.; Visser, E.; van den Borne, B.E.E.M.; Soud, M.Y.-E.; Belderbos, H.N.A.; Stege, G.; de Saegher, M.E.A.; Eduati, F.; Broeren, M.A.C.; van Dongen, J.; et al. Correction of the NSE Concentration in Hemolyzed Serum Samples Improves Its Diagnostic Accuracy in Small-Cell Lung Cancer. Oncotarget 2020, 11, 2660–2668. [Google Scholar] [CrossRef]
  54. Liu, C.-C.; Wang, H.; Wang, J.-H.; Wang, L.; Geng, Q.-R.; Chen, X.-Q.; Lu, Y. Serum Neuron-Specific Enolase Levels Are Upregulated in Patients with Acute Lymphoblastic Leukemia and Are Predictive of Prognosis. Oncotarget 2016, 7, 55181–55190. [Google Scholar] [CrossRef]
  55. Silva Junior, A.G.; Frias, I.A.M.; Lima-neto, R.G.; Franco, O.L.; Oliveira, D.L.; Andrade, C.A.S. ELECTROCHEMICAL DETECTION OF GRAM-NEGATIVE BACTERIA THROUGH MASTOPARAN-CAPPED MAGNETIC NANOPARTICLE. Enzyme Microb. Technol. 2022, 160, 110088. [Google Scholar] [CrossRef]
  56. Autsavapromporn, N.; Duangya, A.; Klunklin, P.; Chitapanarux, I.; Kranrod, C.; Jaikang, C.; Monum, T.; Tokonami, S. Combined Serum IL-6 and CYFRA 21-1 as Potential Biomarkers for Radon-Associated Lung Cancer Risk: A Pilot Study. Biomedicines 2025, 13, 2145. [Google Scholar] [CrossRef]
  57. Avelino, K.Y.P.S.; dos Santos, G.S.; Frías, I.A.M.; Silva-Junior, A.G.; Pereira, M.C.; Pitta, M.G.R.; de Araújo, B.C.; Errachid, A.; Oliveira, M.D.L.; Andrade, C.A.S. Nanostructured Sensor Platform Based on Organic Polymer Conjugated to Metallic Nanoparticle for the Impedimetric Detection of SARS-CoV-2 at Various Stages of Viral Infection. J. Pharm. Biomed. Anal. 2021, 206, 114392. [Google Scholar] [CrossRef] [PubMed]
  58. Behera, S.; Mohanty, P.; Dash, P.P.; Mohapatra, P.; Shubhadarshinee, L.; Behura, R.; Barick, A.K.; Mohapatra, P.; Jali, B.R. Selective Binding of Bovine Serum Albumin (BSA): A Comprehensive Review. Biointerface Res. Appl. Chem. 2023, 13, 555. [Google Scholar] [CrossRef]
  59. Aydın, M. An Ultrasensitive Immunosensor Based on Tri-Armed Star Poly(Glycidyl Methacrylate) Polymer-Coated ITO-PET Electrode for Detection of Neuron-Specific Enolase in Human Serum. Int. J. Environ. Anal. Chem. 2020, 100, 492–506. [Google Scholar] [CrossRef]
  60. Mehta, D.; Thakur, N.; Nagaiah, T.C. Label-Free Assessment of Neuron-Specific Enolase via Polydopamine over a Carbon-Nanotube-Based Flexible Immunosensor. ACS Appl. Bio Mater. 2024, 7, 4702–4709. [Google Scholar] [CrossRef] [PubMed]
  61. Zu, J.; Xuan, X.; Zhang, W.; Li, M.; Jiang, D.; Li, H. Wireless Gold/Boron–Nitrogen-Codoped Graphene-Based Antenna Immunosensor for the Rapid Detection of Neuron-Specific Enolase. Anal. Chem. 2024, 96, 6826–6835. [Google Scholar] [CrossRef] [PubMed]
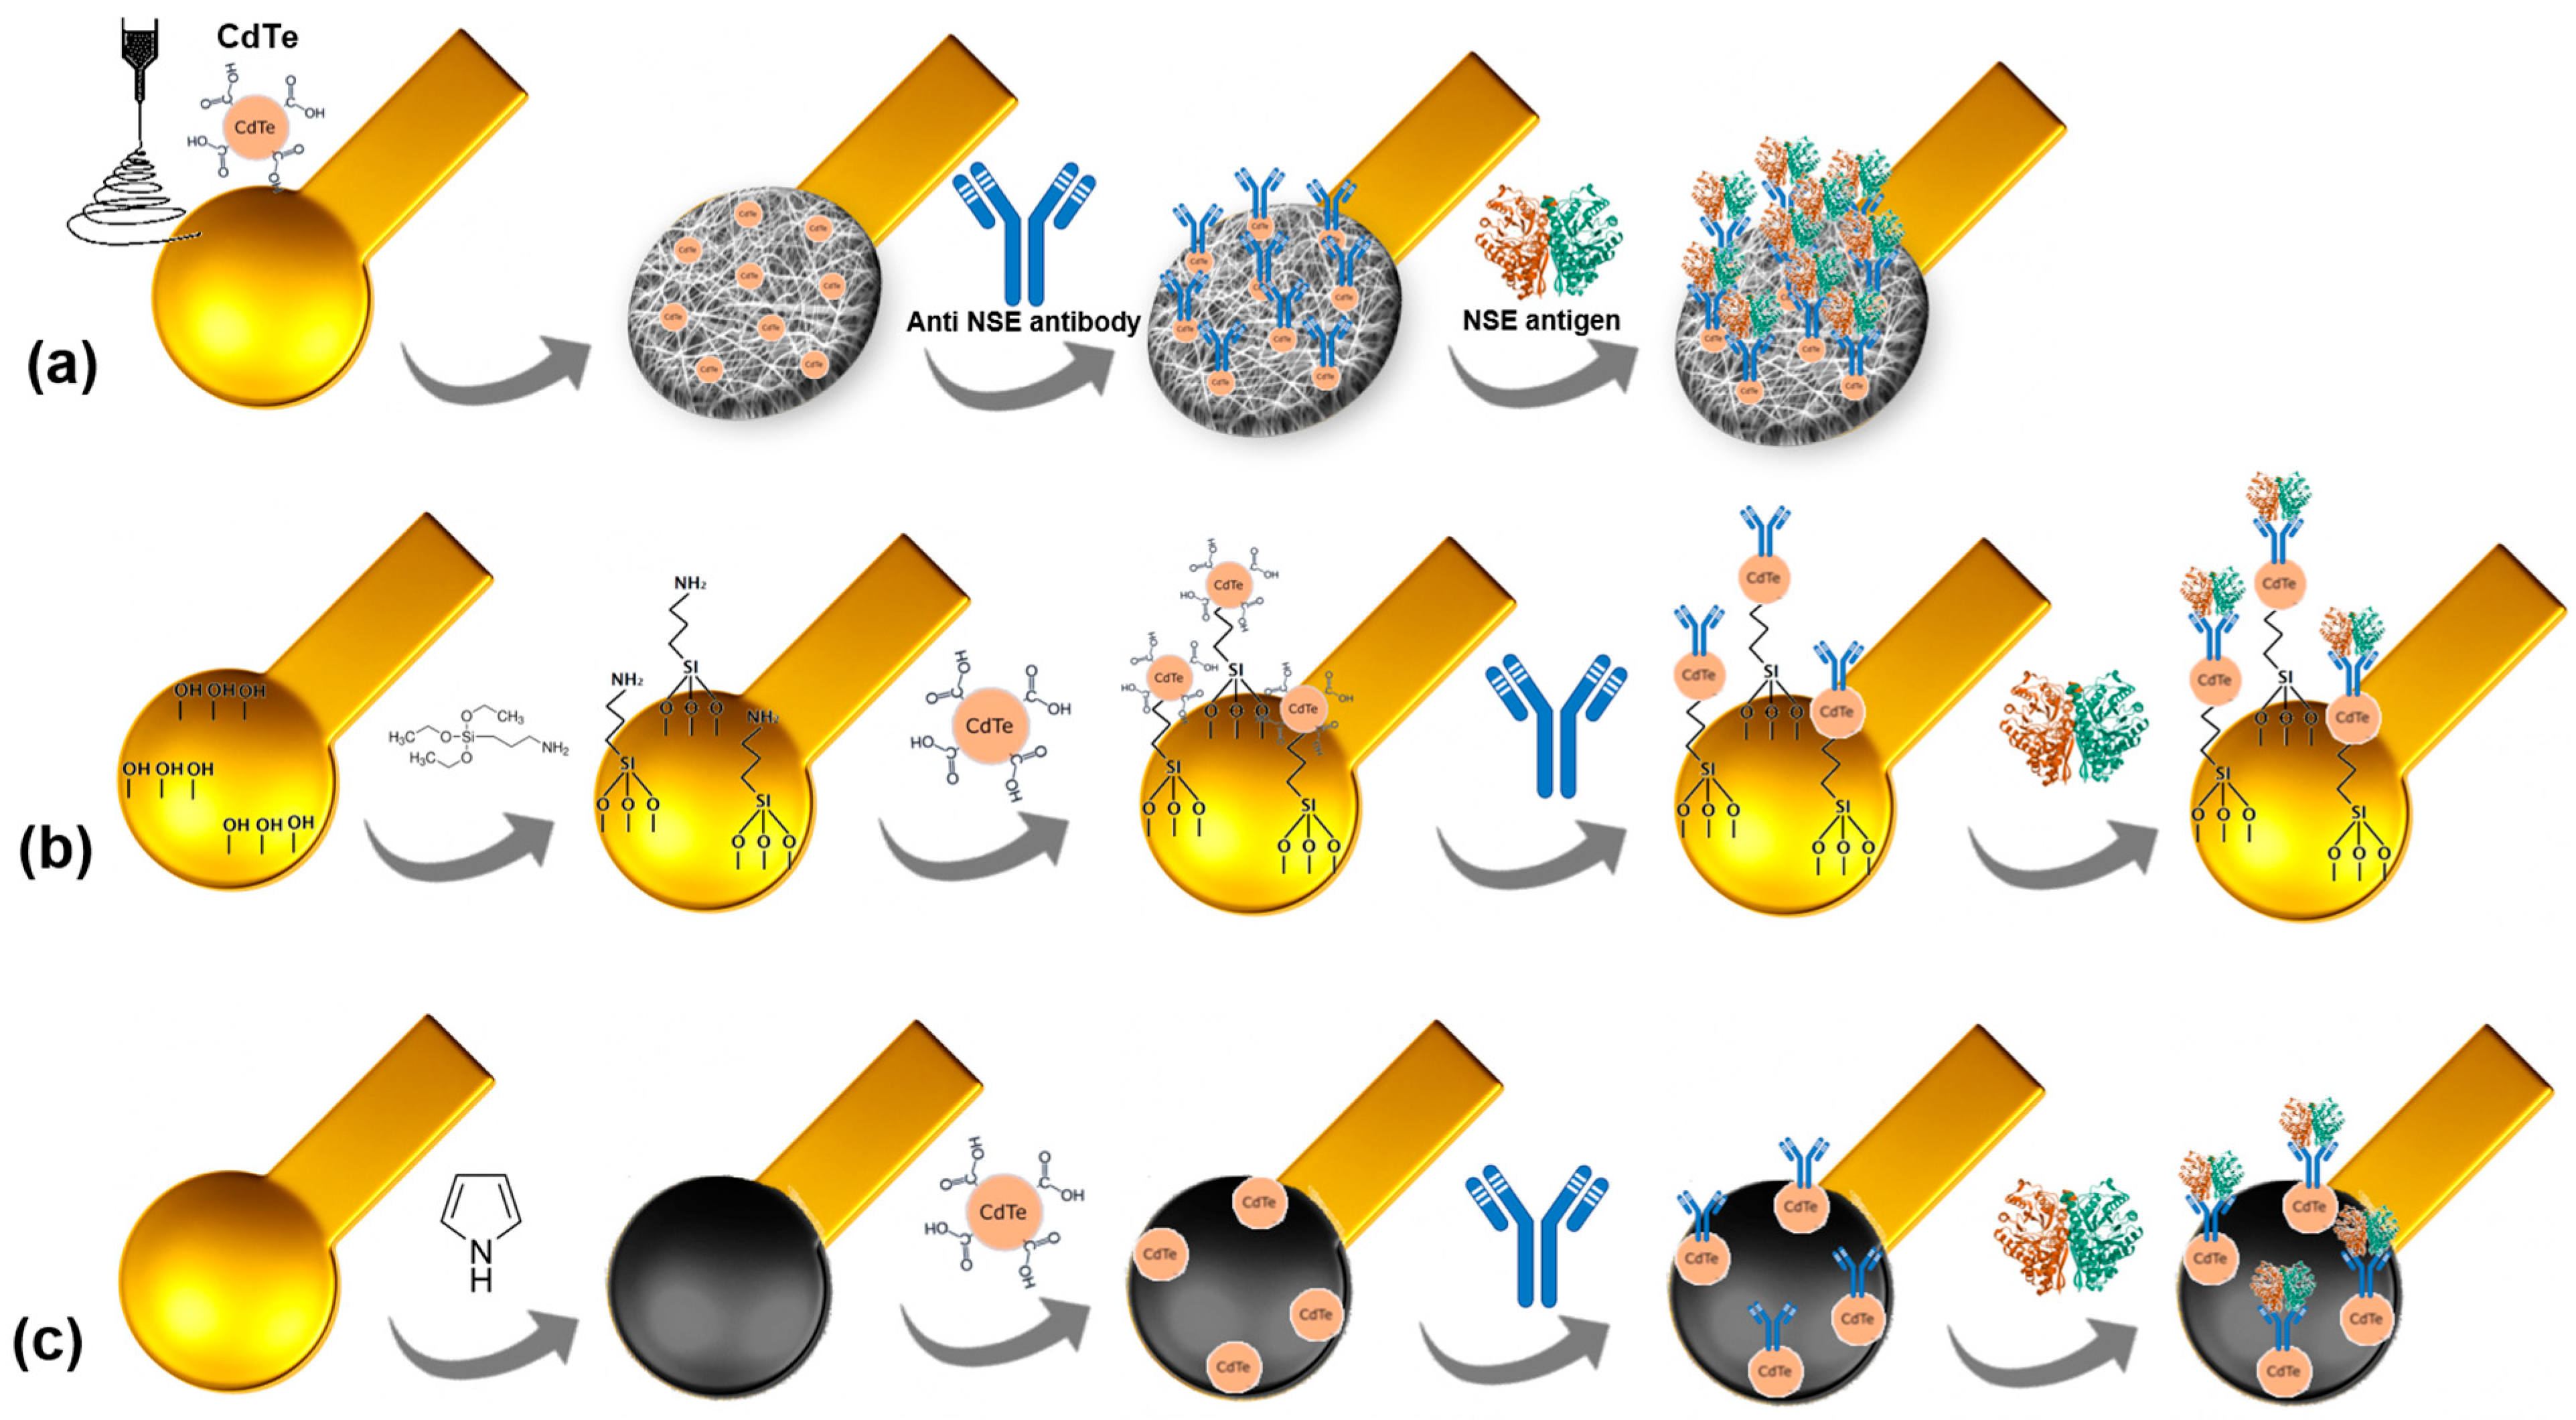
Figure 1. Schematic representation of the stepwise assembly process of the PVA/alginate nanofibers (a), APTES monolayers (b), and electropolymerized polypyrrole (c) sensor platforms.
Chemosensors 13 00377 g001
Figure 2. 3D AFM images of the µCP gold electrode (a), surface of electrospun nanofibers (b), electrospun nanofiber platform (c), and polypyrrole platform (d).
Chemosensors 13 00377 g002
Figure 3. Fluorescence analyses of sensor platforms: APTES (a), PVA/alginate nanofibers (b), and polypyrrole (c) labeled with anti-NSE Alexa fluor 594.
Chemosensors 13 00377 g003
Figure 4. ATR-FTIR spectra obtained at different steps of the sensor building on µCP gold electrode.
Chemosensors 13 00377 g004
Figure 5. Cyclic voltammograms of each biosensor assembly step: (a) APTES platform, (b) PVA/alginate nanofiber, and (c) Ppy platform.
Chemosensors 13 00377 g005
Figure 6. Cyclic voltammograms obtained from the biosensor biorecognition process of the NSE antigen. (a) APTES platform, (b) PVA/alginate nanofiber, and (c) Ppy platform. (d) Relationship between anodic peak current and target analyte concentration.
Chemosensors 13 00377 g006
Figure 7. Nyquist diagram from the biorecognition process of NSE antigen by the Ppy platform.
Chemosensors 13 00377 g007
Figure 8. ΔRCT% (a) and θ (b) as a function of different concentrations.
Chemosensors 13 00377 g008
Table 1. Amperometric anodic shift for the assembling steps of the APTES, nanofiber, and PPy platforms after exposure to NSE.
Analyte Concentration (pg·µL−1)Platform IPA (µA)IPA (µA)I (%)
APTES platform 75.77
1 68.4 ± 0.669.72 ± 0.24
10 64.42 ± 0.9414.97 ± 1.12
25 57.48 ± 0.3024.13 ± 0.62
50 55.63 ± 0.9226.58 ± 0.71
75 51.60 ± 1.1331.89 ± 1.24
100 49.01 ± 0.9635.33 ± 1.06
Nanofiber platform 44.91
1 43.44 ± 0.453.27 ± 0.50
10 38.64 ± 0.1913.96 ± 0.28
25 37.5 ± 0.0816.49 ± 0.11
50 34.84 ± 0.3322.42 ± 0.19
75 33.86 ± 0.2424.60 ± 0.09
100 32.28 ± 0.1428.12 ± 0.21
PPy platform 158.52
1 125.19 ± 0.9221.02 ± 0.83
10 121.61 ± 1.3523.68 ± 0.70
25 112.8 ± 1.2829.29 ± 1.11
50 103.15 ± 1.4634.92 ± 0.99
75 95.61 ± 0.9439.68 ± 0.87
100 86.80 ± 0.8545.24 ± 0.76
Table 2. Values of the equivalent circuit elements from fitted impedance results.
Modified ElectrodeAnalyte Concentration (pg·µL−1)RCT (kΩ)CPE (µT)RS (kΩ)ZW (kσ)
Ppy platform1 pg·µL−10.402 ± 0.02120.96 ± 0.490.587 ± 0.0051.009 ± 0.006
10 pg·µL−10.801 ± 0.03237.02 ± 0.640.553 ± 0.0161.133 ± 0.012
25 pg·µL−11.318 ± 0.01946.25 ± 0.850.502 ± 0.0140.824 ± 0.018
50 pg·µL−12.405 ± 0.03858.18 ± 0.940.307 ± 0.0171.009 ± 0.016
75 pg·µL−14.159 ± 0.04568.82 ± 0.520.244 ± 0.0071.008 ± 0.015
100 pg·µL−16.421 ± 0.05972.09 ± 0.710.326 ± 0.0091.001 ± 0.009
Disclaimer/Publisher’s Note: The statements, opinions and data contained in all publications are solely those of the individual author(s) and contributor(s) and not of MDPI and/or the editor(s). MDPI and/or the editor(s) disclaim responsibility for any injury to people or property resulting from any ideas, methods, instructions or products referred to in the content.