Abstract
Globally, waterborne viral infections significantly threaten public health. While current European Union regulations stipulate that drinking water must be devoid of harmful pathogens, they do not specifically address the presence of enteric viruses in water used for irrigation or food production. Traditional virus detection methods rely on molecular biology assays, requiring specialized personnel and laboratory facilities. Here, we describe an electrochemical sandwich enzyme-linked immunomagnetic assay (ELIME) for the detection of the hepatitis A virus (HAV) in water matrices. This method employed screen-printed electrodes as the sensing platform and utilized commercially available pre-activated magnetic beads to provide a robust foundation for the immunological reaction. The ELIME assay demonstrated exceptional analytical performance in only 185 min achieving a detection limit of 0.5 genomic copies per milliliter (g.c./mL) and exhibiting good reproducibility with a relative standard deviation (RSD) of 7% in HAV-spiked drinking and processing water samples. Compared with the real-time RT-qPCR method described in ISO 15216-1, the ELIME assay demonstrated higher sensitivity, although the overall linearity of the method was moderate. These analytical attributes highlight the potential of the ELIME assay as a rapid and viable alternative for HAV detection in water used for agriculture and food processing.
1. Introduction
The hepatitis A virus (HAV), a non-enveloped, single-stranded positive-sense RNA virus within the Picornaviridae family, is the causative agent of acute viral hepatitis and is responsible for numerous cases and outbreaks globally [1,2]. HAV is primarily spread via the fecal–oral route, either through direct contact with infected individuals or through the ingestion of contaminated food (such as bivalve shellfish and soft fruits) or water [3,4]. The prevalence of foodborne and waterborne viral diseases represents a substantial public health challenge worldwide. A comprehensive review of HAV prevalence across various water matrices—including untreated and treated wastewater, surface water, groundwater, and drinking water—reported an overall prevalence of 16.7%, with the highest prevalence in untreated wastewater (31.4%) and the lowest in drinking water (0.3%) [5].
Currently, European Union legislation on water intended for human consumption (EU Dir. 2020/2184) depends on fecal indicator bacteria (FIB) for microbiological safety, which is more straightforward to measure compared with the full range of pathogens that pose health risks [6]. However, FIB does not adequately indicate the presence of pathogenic viruses. Similarly, regulations on microbial contamination in food products and hygiene in primary production (Reg. EC 2073/2005, 853/2004, 852/2004, and subsequent amendments) mandate the use of water deemed “suitable for human consumption” or “clean water”, yet lack specific microbiological criteria for enteric viruses in waters used for food production or irrigation [7,8,9]. Public health management strategies for hepatitis A emphasize pre-exposure vaccination for high-risk groups; education on good personal hygiene, particularly hand hygiene; and the provision of adequate sanitation and housing. Countries with high income levels and robust sanitary conditions typically exhibit low infection rates. Understanding the environmental sources of HAV is critical for controlling the disease. Studies have identified HAV in foods, treated and untreated wastewater, and various aquatic environments [10,11,12].
The gold standard for the quantitative detection of HAV in food and bottled water is reverse transcription-quantitative real-time PCR (RT-qPCR), supported by an internationally validated method (ISO 15216-1:2017) [13,14]. However, while real-time RT-qPCR is sensitive and effective, this technique has some significant limitations [15]. In particular, to ensure high sensitivity of detection, molecular methods require the use of matrix-specific concentration procedures, both to optimize viral recovery from samples and to remove PCR inhibitors that may negatively affect the efficiency of polymerization. This often implies the need for multi-step sample preparation procedures, which may significantly affect both sample turnaround and laboratory capacity. Further to this, to minimize the risk of sample cross-contamination and molecular reagents contamination and ensure quality of results, appropriate working environments are required for molecular methods, therefore limiting their use to laboratory environments, with few applications in the field or production lines. More recently, progress in the available molecular solutions has reduced some of these limitations [16]. The introduction and progressive diffusion of digital and digital droplet PCR, which show higher tolerance to inhibitors deriving from complex matrices [17], have reduced the need for laborious inhibitors’ removal treatment and, thanks to their independence from calibration curves for target quantification, have improved the precision and accuracy of viral quantification. The use of other nucleic acid amplification technologies such as loop-mediated isothermal amplification (LAMP), which performs DNA synthesis in isothermal conditions (e.g., also in a simple water or heat block), has improved both the turnaround time and the portability of molecular methods in non-laboratory settings, with a potential for on-site use [18]. Further improvements to the molecular detection of viruses in food and water matrices are expected with the progressive implementation of viability assays [19], exploitation of CRISP technology [20], and combination of molecular assays with artificial intelligence tools [21]. On the other hand, immunoassays, based on the enzyme-linked immunosorbent assay (ELISA), have been known for decades for their easiness, high throughput, and ability to detect specific antigens through targeted antibodies [20,21,22]. ELISA tests are generally more cost-effective than PCR, making them suitable for high-throughput screening, and allowing for the rapid testing of large sample numbers though sensitivity issues precluded extensive use beyond clinical diagnostics [15,23]. Screen-printed electrodes (SPE) have been linked to recent improvements in sensitivity. SPEs are used as a signal transducer for the detection of the enzymatic product of the enzyme conjugated with the antigen or antibody, depending on the format used to highlight the immunological chain formed, as well as a support for the construction of the immunological chain. The advantages of the association of electrochemical detection in ELISA over conventional optical detection are reported in a 2007 review [22]. The development of electrochemical immunosensors has significantly advanced thanks to the practical and creative fusion of various signal-amplified components with enzyme catalysis.
Furthermore, the introduction of magnetic supports—such as secondary antibody-modified microparticles and nanoparticles—has demonstrated in more recent times how immunoassays can be made more sensitive and repeatable even when dealing with complicated matrices [23]. Additionally, the magnetic particles demonstrate their exceptional benefits in the pre-concentration and isolation of targets from intricate biological materials. To increase the sensitivity of electrochemical immunosensors and support their use in clinical, food, and environmental fields, enzyme catalysis can be seamlessly combined with these amplification methods [24]. Alkaline phosphatase (AP) and horseradish peroxidase (HRP) are two of the most often employed enzyme reporters among the many enzymes used as markers in immunoassays. However, several inherent issues, including a non-specific staining response, activity inhibition by Cu+ ions, high background from the electrochemical reduction in the H2O2 substrate, and the inability to use voltammetric methods (except for amperometry) [25] for electrochemical detection, may affect the application of HRP. As a reporter enzyme for signal amplification, however, AP has garnered a lot of interest because of its superior qualities, including high catalytic activity, a large turnover number, and a broad range of electrochemical techniques for the detection, such as differential pulse voltammetry (one of the most sensitive electrochemical techniques) [26,27].
Compared with traditional ELISA or electrochemical immunosensors, the ELIME (enzyme-linked immunosorbent magnetic electrochemical) method offers a larger surface-to-volume ratio due to magnetic particles and improved sensitivity of electrochemical detection over spectrophotometric analysis [28,29,30].
This study highlights the advantages of ELIME over real-time PCR and ELISA, demonstrating the sensitivity and reliability of the electrochemical sandwich ELIME technique, which employs commercially preactivated magnetic beads for HAV detection in processing water samples [31]. Our findings reveal significant benefits of this method compared with the real-time RT-qPCR protocol outlined in ISO 15216-1 [32], presenting promising results in analytical performance comparisons.
2. Materials and Methods
2.1. Reagents
Unless otherwise specified, chemical reagents were obtained from Merck® (Bari, Italy). Goat Anti-Mouse IgG magnetic beads were purchased from New England BioLabs® (Hitchin, UK) and stored at +4 °C. Anti-Mouse IgG was covalently coupled to a ~0.5 µm diameter and 1 μm nanoporous paramagnetic microparticle; 1 mL suspension in PBS Buffer (pH 7.4), 0.05% Tween 20, 0.1% BSA, and 0.05% NaN3 contains 3.65 × 10¹⁰ particles. The primary monoclonal hepatitis A virus antibody (MAbI) clone M5112922 used in this study was provided by Fitzgerald® (Crossville, TN, USA), with 1000 μg/mL in 10 mM PBS, pH 7.2, with 0.1% NaN3, whereas the primary monoclonal hepatitis A virus antibody labelled with alkaline phosphatase (MAbI-AP) clone 7E7 was supplied by Pantec® (Milano, Italy) in 10 mM PBS, pH 7.2, with 0.1% NaN3. Both Abs were stored at −20 °C.
The viral standard for the hepatitis A virus was purchased from Mediagnost® (Reutlingen, Germany). Information provided by the supplier, concerning the amount of HAV virus in the sample, indicated that the suspension contained 4.8 × 10⁶ genome copies (g.c.)/mL (measured by real-time RT-qPCR according to ISO 15216-1:2017) [14] and 100 International Unit (UI)/mL. The hepatitis A virus strain HM175/18f (American Type Culture Collection, ATCC VR-1402), used for spiking drinking water samples, was provided by the Istituto Superiore di Sanità (ISS) at a concentration of 7.5 × 10⁸ g.c./mL (measured by real-time RT-qPCR). For virus production, HAV HM-175/18f was replicated in Frp3 cells (non-human primate cell line derived from fetal kidney) cultured in minimum essential medium with Earle’s salts (MEM) supplemented with 1% glutamine, 2% non-essential amino acids, and 2% FBS. The virus was incubated in 5% CO2 at 37 °C with daily checks of modifications of the cell monolayer. The cell culture medium and supplements were provided by EuroClone (Milan, Italy). The viral suspension was prepared by three freeze and thaw lysis cycles of infected monolayers, clarified using low-speed centrifugation (800× g) to remove residual cell debris, then divided in aliquots and kept at −80 °C for long-term storage and at −20 °C during experiments.
The buffers used for the experiments were the following: solution A (washing magnetic beads solution), 50 mM sodium phosphate buffer (PB), pH 7.4, containing 100 mM KCl and 0.05% (v/v) of Tween 20; solution B (store magnetic beads solution), 50 mM PB buffer, pH 7.4, containing 0.1% BSA and 0.02% NaN3; solution C (extraction solution), 100 mM Tris, 50 mM Gly, and 0.1% of beef extract, pH 9.5 (TGBE buffer).
2.2. Materials
2.2.1. Screen-Printed Electrodes (SPEs)
Screen-printed electrodes were produced by a screen printer DEK 245 (DEK, Weymouth, UK) on polyvinyl chloride (PVC) strips with eight printed sensors each. The inks were from Acheson (Mezzago, Milan, Italy). The SPE included three electrodes: graphite for working and counter electrodes and silver/silver chloride (Ag/AgCl) for the reference electrode. The diameter of the working electrode was 0.3 cm, with an apparent geometric area of 0.07 cm2 [33,34].
2.2.2. Filters
Zeta Plus™ 1MDS discs (CUNO, 3M Company, CUNO, 3M Company, Meriden, CT, USA), 47 mm, 0.45 μm pore size, were used in this study. Filters were characterized by an electropositive, charge-modified, cellulose medium double open-ended (flat nitrile gasket) configuration. The filters used electrokinetic adsorption to capture and concentrate waterborne viruses.
2.2.3. Instrumentations
Electrochemical measurements were performed at room temperature, using a computer-controlled system, AUTOLAB model GPSTAT-12 with GPES software (Ecochemie, Utrecht, The Netherlands). Differential pulse voltammetry (DPV) measurements were carried out in the potential range from 0 to 600 mV with a pulse width of 50 ms, a pulse amplitude of 70 mV, and a scan speed of 100 mV/s.
2.3. Methods
2.3.1. ELIME Assay
In this work, an enzyme-linked immuno-magnetic electrochemical assay (ELIME), with a sandwich format, was developed. Goat Anti-Mouse IgG magnetic beads (10 μL) were first washed twice in 50 mM PBS, pH 7.4, by using an external magnet to allow easy separation. They were coated, then, with primary monoclonal hepatitis A virus antibody (MAbI) in 50 mM carbonate buffer, pH 9.6, shaking for 45 min at room temperature, separated with the magnet, and washed again twice with solution A. The coated beads were resuspended in 3% BSA in 50 mM carbonate buffer, pH 9.6, shaking for 45 min at room temperature, washed again twice with solution A, and resuspended in solution B. The beads were stored at +4 °C overnight, separated, and washed twice with solution A. HAV in 50 mM PBS, pH 7.4, containing 0.1% BSA was added. After shaking for 45 min at room temperature, the beads were washed twice with solution A. An alkaline phosphatase (AP) labeled anti-HAV monoclonal antibody (MAb-AP) in 50 mM PBS, pH 7.4, was used to complete the immunological chain constituted by HAV and MAbI, immobilized directly on the beads, to reveal the sandwich complex format.
The beads were shaken for 45 min at room temperature, washed twice with solution A, and resuspended in 50 mM PBS, pH 7.4. After the immunochemical steps, the beads were localized onto the surface of SPEs with the aid of a magnet. The enzyme-substrate 1-naphthyl-phosphate (1-NPP) in 0.97 diethanolamine (DEA) buffer, pH 9.8, containing 1 mM MgCl2 and 100 mM KCl was added to measure the electroactive product (Figure 1).
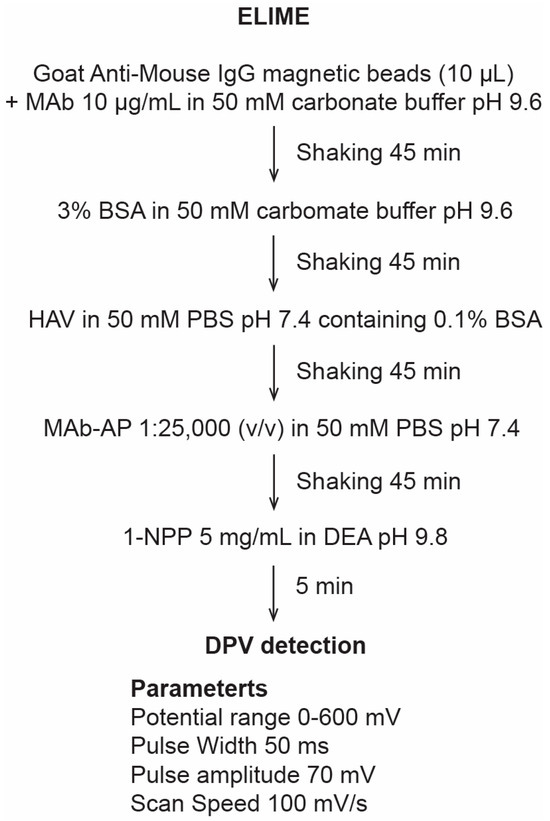
Figure 1.
Protocol used in the ELIME detection.
2.3.2. Spiking of Drinking Water and Water for Vegetable Processing
Drinking water was collected from the public water system of Rome, Italy. Vegetable processing water was collected from an industrial setting performing the processing of ready-to-eat leafy vegetables and included water taken after its use for vegetable washing. One hundred mL of drinking water and vegetable processing water were spiked with different concentrations of HAV (strain HM175/18f) at concentrations ranging between 0 (level 0) and ~10.000 g.c./mL (level 9). The exact inoculum value (and the expected value for quantification by real-time RT-qPCR and ELIME assay) was confirmed through analysis of the highest concentration of the HAV suspension used for spiking.
2.3.3. Sample Concentration for HAV Detection
The concentration method for HAV was obtained by a modification of an organic solvent-based method taken from the literature [8,9] and the reference ISO method for HAV detection in food and water samples (ISO 15216-1:2017) [14,35]. Samples were filtered on the wrinkled side of the Zeta Plus™ 1MDS disc using an EZ-Stream® vacuum laboratory pump (Merck Millipore, Rome, Italy). Viruses adsorbed on the filter were eluted and recovered using 40 mL of solution C, spinning at 35–40 rpm for 15 min. After adjusting the pH to 7.0 ± 0.2 with HCl 5 N, the suspension was divided into two aliquots of equal volume, for ELIME assay detection and real-time RT-qPCR analysis. The aliquot intended for real-time RT-qPCR was concentrated according to ISO 15216-1:2017 [14] and centrifuged at 4000× g for 15 min using Amicon Ultra centrifugal filter devices ultracel 100 KDa (Merck Millipore, Rome, Italy), and the viral concentrate was eluted with 0.5 mL of sterile PBS (Figure 2).
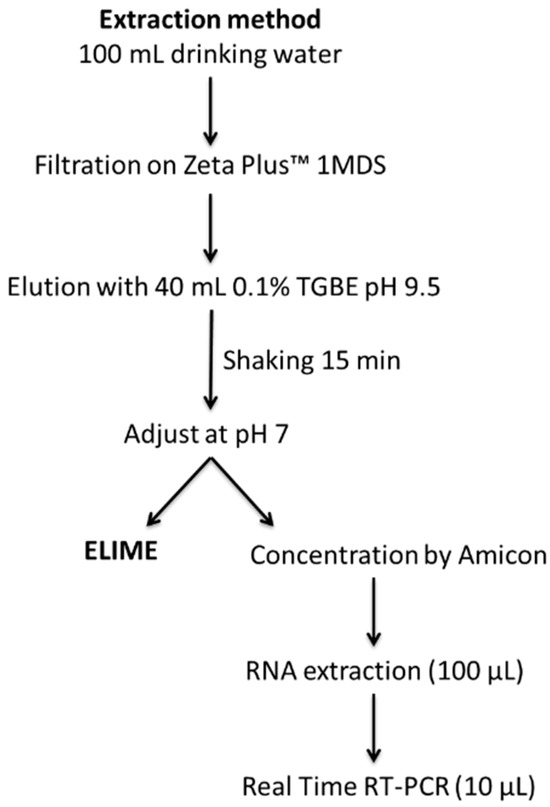
Figure 2.
Extraction method for HAV from drinking water and water for vegetable processing.
In order to underline the reproducibility of the analysis for HAV concentrations near the LOD, 10 aliquots of drinking water sample were spiked with 0.7 g.c./mL, and the extraction method was applied.
2.3.4. RNA Extraction and Real-Time RT-qPCR Protocol
Nucleic acid extraction was performed using the NucliSens extraction kit and the MiniMag semi-automatic platform (bioMerieux, Paris, France) according to the manufacturer’s instructions. Eluted RNA (100 μL) was stored at −80 °C until molecular analysis. Real-time RT-qPCR was conducted using the amplification conditions, primers, probes, and reagents reported in the annexes of the ISO 15216 method [14,31,35,36]. Briefly, for the assay the RNA UltraSense One-Step qRT-PCR System kit (Life Technologies, Carlsbard, CA, USA) was used. A 25 μL reaction mixture was prepared with 5 μL of RNA, reverse primer (900 nM), forward primer (500 nM), and probe (250 nM). For each sample, duplicate reactions were carried out on a 7700 Sequence Detection System (Applied Biosystems, Waltham, MA, USA). The following amplification conditions were applied: 55 °C for 60 min for reverse transcription and 95 °C for 5 min for RT inactivation followed by 95 °C for 15 s, 60 °C for 60 s, and 65 °C for 60 s (45 cycles). For standard curve construction, tenfold dilutions of a quantified plasmid containing the target sequence were used (range 101–105 copies/μL); quantifications were considered acceptable if standard curves displayed a slope between −3.1 and −3.6 and an R2 ≥ 0.98 [35].
2.3.5. Calibration Curve for Immunosensor
The dose–response curve of the ELIME was constructed by fitting experimental data with a nonlinear four-parameter logistic calibration plot, as shown in the equation [33,37]
in which a and y0 are the asymptotic maximum and minimum values, x0 is the IC50, and b is the slope. Each value of current I (μA) was normalized using the formula [33]
with being the average value of the current at minimum concentration of HAV and being the average value of the current at the maximum concentration of HAV.
The LOD, Equation (3), and the limit of quantification (LOQ), Equation (4), were calculated as follows [33,37]:
where SB is the signal measured in the absence of HAV and SD is the standard deviation of the blank (10 replications). The obtained values were introduced in the logistic equation, and the relative concentrations were extrapolated.
YLOD = SB + 3 SD
YLOQ = SB + 10 SD
3. Results and Discussion
3.1. ELIME Optimization
In this paper, a rapid system for HAV detection, based on ELIME assay, was evaluated. The system was based on the use of Goat Anti-Mouse IgG magnetic beads as a solid support for the immunochemical chain, using an array of eight screen-printed electrodes (SPEs) as sensing platforms. An alkaline phosphatase-labelled anti-HAV monoclonal antibody (MAb-AP) was used as an electroactive reporter and to complete the immunological chain formed by HAV and primary monoclonal antibody against HAV (MAbI), immobilized directly on magnetic beads to reveal the sandwich complex. A general schematization of the ELIME functioning is depicted in Figure 3.
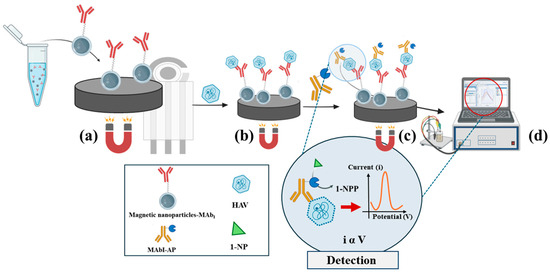
Figure 3.
General schematic of ELIME functioning. (a) Immobilization of Goat Anti-Mouse IgG magnetic nanoparticles (MN-MAb1) on SPE, (b) antigen–antibody interaction, (c) immunocomplex detection using Mab-AP, and (d) electrochemical detection using DPV.
The magnetic beads were kept on SPEs with the support of a magnet, and the enzyme-substrate 1-naphthyl-phosphate (1-NPP) was added to measure the electroactive product. For this goal, the analytical parameters were optimized. To establish the best conditions for the sandwich ELIME, different dilutions of MAbI were tested using a fixed concentration of HAV (10−8 UI/mL), 3% dry milk (DM) as a blocking agent, and MAb-AP diluted 1:10,000 (v/v) in PBS with incubation times of 45 min (parameters from previous studies) [21] (Figure 4). The maximum electrochemical signals were observed at a concentration of 10 μg/mL MAbI, whereas no further current increase was observed at higher concentrations.
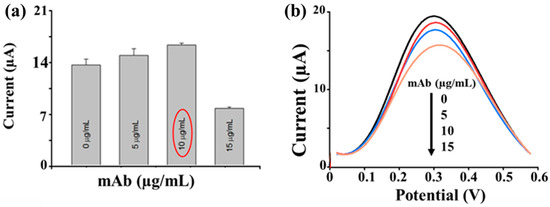
Figure 4.
Mab1 optimization. (a) The effect of the MAbI concentration on the signal. Protocol: 3% dry milk (DM); [MAbI] 0, 5, 10, and 15 μg/mL; [HAV] 10−8 UI/mL; [MAb-AP] 1:10,000 (v/v) in PBS; and 5 mg/mL 1-NPP; in red circle the selected concentration is underlined. (b) The DPV measurement potential range 0–600 mV, the pulse width of 50 ms, pulse amplitude of 70 mV, and a scan rate of 100 mV/s.
Different blocking agents were evaluated to reduce non-specific adsorption onto the surface of coated beads. Three percent bovine serum albumin (BSA), 3% dry milk (DM), and 1% polyvinyl alcohol (PVA) were tested by adding MAb-AP diluted 1:5000, 1:10,000, and 1:25,000 (v/v) in PBS with no other bioreagent. The experimental results (Figure 5) revealed that 3% BSA was the most effective blocking agent for MAb-AP diluted 1:25,000 (v/v) in PBS from the stock solution.
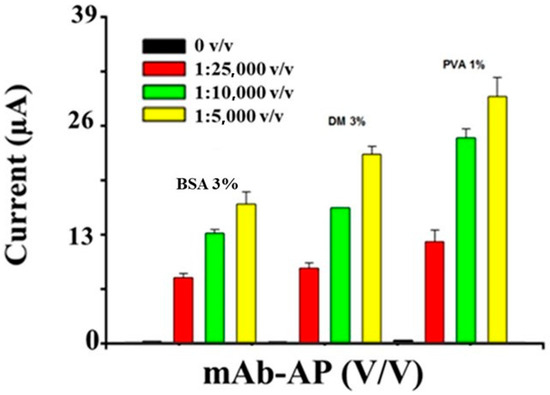
Figure 5.
Study of the blocking reagent at different concentrations of MAb-AP. Three percent BSA, 3% DM, and 1% PVA; [MAb-AP] 1:5000, 1:10,000, and 1:25,000 (v/v) in PBS; 5 mg/mL 1-NPP; DPV measurement potential range 0–600 mV; pulse width of 50 ms; pulse amplitude of 70 mV; and scan rate of 100 mV/s.
A layer-by-layer electrochemical (LbL-EC) characterization of the primary modification step of the SPE surface was conducted at this stage. Cyclic voltammetry (CV) and electrochemical impedance spectroscopy (EIS) were employed as complementary techniques for this characterization. Visual inspection reveals a progressive increase in peak-to-peak separation with decreasing electron transport efficiency as the bare screen-printed electrode (SPE) is modified and with each subsequent modification step. This observation is corroborated not only by the CV results but also by the EIS experiments, which show a progressively increasing charge transfer resistance (Rct) (Figure 6).
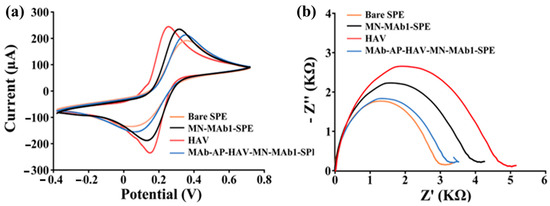
Figure 6.
Electrochemical LbL-EC of ELIME assembly. (a) cv voltammograms and (b) EIS spectra. At least three experiments for each curve were conducted.
3.2. Analytical Performances in Buffer and Real Sample Solution
After optimizing the antibody concentration and the blocking agent, a calibration curve was constructed using the HAV strain HM175 (Figure 7). This ELIME assay achieved a detection limit (LOD) of 0.5 g.c./mL and an LOQ of 0.7 g.c./mL for the quantitative determination of HAV.
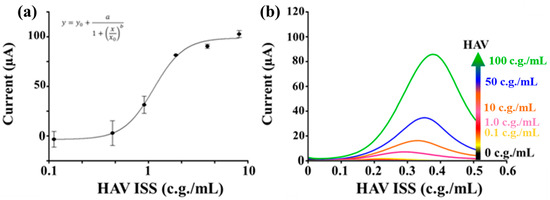
Figure 7.
Calibration curve for HAV. [MAbI] 10 μg/mL, 3% BSA, [HAV] 0–10 g.c./mL, [MAb-AP] 1:25,000 (v/v), and 5 mg/mL 1-NPP. DPV measurement potential range 0–600 mV, pulse width of 50 ms, pulse amplitude of 70 mV, and a scan rate of 100 mV/s. (a) 4-parameter logistic calibration curv. Parameters: a = 96.53, b = −3.03, x0 = 0.89, y0 = −0.18. LOD = 0.5 g.c./mL, RSD% 7%. (b) DPV measures used for the calibration curve.
To investigate the applicability of the proposed methods for practical analysis, the immunosensor was used to evaluate the detection of different concentrations of HAV spiked in drinking water samples and in washing water used for ready-to-eat vegetable processing. The results were compared with those obtained by the standard real-time RT-qPCR analysis (ISO 15216-1:2017) [14], which is typically used to estimate the presence of HAV in food and water samples. To compare the results of the two methods (ELIME and RT-qPCR), a correlation was established on the HM175/18f strain supplied by ISS between the units used in ELIME (IU/mL) and those used in RT-qPCR (g.c./mL), revealing that 1 UI/mL = 2 × 10⁶ g.c./mL with R2 = 0.997.
In experimentally contaminated water samples, the ELIME assay detected HAV at the lowest spiking level 1 in both types of water samples (Table 1 and Table 2), demonstrating a greater sensitivity than the ISO 15216-1 method [14] and validating a detection limit of 0.5 g.c./mL (roughly equivalent to 0.5 viruses/mL, given the correspondence between a genome and a viral particle). The linearity of the results was modest, particularly in vegetable washing water, where organic and disinfectant residues reduced the efficiency of both the ELIME and PCR analysis. However, the underestimation of the viral concentration in the spiked samples did not negatively affect the overall ELIME sensitivity.

Table 1.
Assessment of the ELIME assay on drinking water. The results were compared with RT-qPCR on the same samples.

Table 2.
Assessment of the ELIME assay on vegetables rinsing water. The results were compared with RT-qPCR on the same samples.
To test the reproducibility of the proposed assay and the extraction method, 0.7 g.c./mL was added to 10 aliquots of drinking water, and the extraction procedure was applied. The results showed a satisfactory reproducibility with RSD% equal to 14%.
3.3. Comparison of the Performance and Cost–Benefit Analysis
The ELIME sensor’s performance herein was compared with earlier HAV sensors reported in the literature and detailed in Table 3. Indeed, examples of this technology are already present in the literature; for example, Micheli and her coworkers implemented an ELIME for detecting the hepatitis A virus (HAV), utilizing polydopamine-modified magnetic nanobeads. This ELIME system demonstrated a detection limit of 1·10−11 IU/mL and a working range of 10−10 to 5·10−7 IU mL−1. In addition, a promising low cross-reactivity with Coxsackie B4 was found with an assay average relative standard deviation (RSD) of less than 5% for same-day tests and 7% for different-day tests. Another interesting biosensor for HAV detection is the one proposed by Antipchik et al. (2022). Their sensor employs a synthetic recognition element created through molecular imprinting technology, forming a molecularly imprinted polymer (MIP) that recognizes the HAV envelope protein E2 (E2-MIP). This MIP sensor, when tested in human plasma, showed a promising detection limit of 4.6 × 10⁻⁴ ng/mL for HCV-MPs. However, analytical performance characterization was limited to the sensitivity in real samples, and important parameters such as cross-reactivity, storage stability, and reusability were not investigated. We compared the performances of our device also with the DNA-based biosensors proposed by Manzano and his coworkers (2018). This device demonstrated a LOD of 0.65 pM with comparable outcomes to nRT-PCR (LOD limit of 6.4 fg/µL). The analytical performance of the proposed ELIME method is of paramount importance, particularly considering its straightforward assembly and an anticipated cost of approximately five times lower than that of the alternatives. Additionally, it is important to mention that the characteristics of the ELIME assay described in this study tackle some critical issues related to the microbiological control of water sources used for food production purposes as it allows monitoring on production lines, reduces costs and, therefore, supports a more extensive application of controls. Therefore, this ELIME should be considered a crucial advancement tool for HAV detection in complex real samples.

Table 3.
Comparison of ELIME sensor’s performance with earlier HAV sensors, reported in the literature.
4. Conclusions
Currently, spectrophotometric ELISA and qPCR are the primary methods for diagnosing HAV infections in humans and monitoring the virus in food, respectively. Notably, serological testing for HAV, commonly used to investigate abnormal liver function, may face challenges in accurately diagnosing acute infection, particularly when IgG testing is inconclusive or low-level anti-HAV IgM results are observed.
In this study, we present a robust analytical method as an alternative to real-time RT-qPCR for detecting HAV in water samples. The developed ELIME assay effectively identified HAV in both drinking water and vegetable rinsing water, demonstrating high comparability to conventional reference methods. These findings highlight its potential application in agricultural contexts, such as the monitoring of irrigation water, and in food processing environments for real-time checks in washing systems, where viruses detached from treated vegetables may remain suspended and pose a risk of cross-contamination to subsequent batches. Furthermore, due to its straightforward design, this method can be adapted for the detection of a wide range of environmentally significant pathogens by simply substituting the analyte-specific bioreceptor.
Author Contributions
Formal analysis, investigation, data curation, writing–original draft preparation, C.D.; data curation and writing–review and editing, R.C.; visualization and resources, A.C.; conceptualization, resources, and visualization, D.M.; visualization and resources, L.C.; visualization and resources, G.L.R.; conceptualization, methodology, validation, formal analysis, resources, data curation, writing–review and editing, supervision, and project administration, E.S.; conceptualization, methodology, validation, formal analysis, resources, data curation, writing–review and editing, supervision, and project administration, L.M. All authors have read and agreed to the published version of the manuscript.
Funding
This research received no external funding.
Institutional Review Board Statement
Not applicable.
Informed Consent Statement
Not applicable.
Data Availability Statement
Data are contained within the article.
Conflicts of Interest
The authors declare no conflicts of interest.
References
- Van Damme, P.; Pintó, R.M.; Feng, Z.; Cui, F.; Gentile, A.; Shouval, D. Hepatitis A virus infection. Nat. Rev. Dis. Primer 2023, 9, 51. [Google Scholar] [CrossRef] [PubMed]
- Wang, X.; Ren, J.; Gao, Q.; Hu, Z.; Sun, Y.; Li, X.; Rowlands, D.J.; Yin, W.; Wang, J.; Stuart, D.I.; et al. Hepatitis A virus and the origins of picornaviruses. Nature 2015, 517, 85–88. [Google Scholar] [CrossRef] [PubMed]
- Fallucca, A.; Restivo, V.; Sgariglia, M.C.; Roveta, M.; Trucchi, C. Hepatitis a Vaccine as Opportunity of Primary Prevention for Food Handlers: A Narrative Review. Vaccines 2023, 11, 1271. [Google Scholar] [CrossRef] [PubMed]
- Shata, M.T.M.; Hetta, H.F.; Sharma, Y.; Sherman, K.E. Viral hepatitis in pregnancy. J. Viral Hepat. 2022, 29, 844–861. [Google Scholar] [CrossRef] [PubMed]
- Chatziprodromidou, I.P.; Dimitrakopoulou, M.-E.; Apostolou, T.; Katopodi, T.; Charalambous, E.; Vantarakis, A. Hepatitis A and E in the Mediterranean: A systematic review. Travel Med. Infect. Dis. 2022, 47, 102283. [Google Scholar] [CrossRef]
- Tiwari, A.; Ahmed, W.; Oikarinen, S.; Sherchan, S.P.; Heikinheimo, A.; Jiang, G.; Simpson, S.L.; Greaves, J.; Bivins, A. Application of digital PCR for public health-related water quality monitoring. Sci. Total Environ. 2022, 837, 155663. [Google Scholar] [CrossRef]
- Pérez-Lavalle, L.; Carrasco, E.; Valero Diaz, A. Microbiological criteria: Principles for their establishment and application in food quality and safety. Ital. J. Food Saf. 2020, 9, 8543. [Google Scholar] [CrossRef]
- Goh, S.G.; Saeidi, N.; Gu, X.; Vergara, G.G.R.; Liang, L.; Fang, H.; Kitajima, M.; Kushmaro, A.; Gin, K.Y.-H. Occurrence of microbial indicators, pathogenic bacteria and viruses in tropical surface waters subject to contrasting land use. Water Res. 2019, 150, 200–215. [Google Scholar] [CrossRef]
- Hounkpe, E.C.; Sessou, P.; Farougou, S.; Dotche, I.; Daube, G.; Delcenserie, V.; Azokpota, P.; Korsak, N. Hygiene practices of food of animal origin operators in primary schools in the Mono Department of Benin. A cross-sectional study. Heliyon 2023, 9, e17135. [Google Scholar] [CrossRef]
- Gerba, C.P. Environmentally Transmitted Pathogens. In Environmental Microbiology; Elsevier: Amsterdam, The Netherlands, 2015; pp. 509–550. [Google Scholar] [CrossRef]
- Gholizadeh, O.; Akbarzadeh, S.; Ghazanfari Hashemi, M.; Gholami, M.; Amini, P.; Yekanipour, Z.; Tabatabaie, R.; Yasamineh, S.; Hosseini, P.; Poortahmasebi, V. Hepatitis A: Viral Structure, Classification, Life Cycle, Clinical Symptoms, Diagnosis Error, and Vaccination. Can. J. Infect. Dis. Med. Microbiol. 2023, 2023, 4263309. [Google Scholar] [CrossRef]
- Takuissu, G.R.; Kenmoe, S.; Ebogo-Belobo, J.T.; Kengne-Ndé, C.; Mbaga, D.S.; Bowo-Ngandji, A.; Ndzie Ondigui, J.L.; Kenfack-Momo, R.; Tchatchouang, S.; Kenfack-Zanguim, J.; et al. Occurrence of Hepatitis A Virus in Water Matrices: A Systematic Review and Meta-Analysis. Int. J. Environ. Res. Public Health 2023, 20, 1054. [Google Scholar] [CrossRef] [PubMed]
- Cuevas-Ferrando, E.; Martínez-Murcia, A.; Pérez-Cataluña, A.; Sánchez, G.; Randazzo, W. Assessment of ISO Method 15216 to Quantify Hepatitis E Virus in Bottled Water. Microorganisms 2020, 8, 730. [Google Scholar] [CrossRef] [PubMed]
- ISO 15216-1:2017; Microbiology of the Food Chain—Horizontal Method for Determination of Hepatitis A Virus and Norovirus Using Real-Time RT-PCR—Part 1: Method for Quantification. ISO: Geneva, Switzerland, 2017.
- Fabiani, L.; Pucci, E.; Delibato, E.; Volpe, G.; Piermarini, S.; De Medici, D.; Capuano, F.; Palleschi, G. ELIME assay vs Real-Time PCR and conventional culture method for an effective detection of Salmonella in fresh leafy green vegetables. Talanta 2017, 166, 321–327. [Google Scholar] [CrossRef] [PubMed]
- Chandran, S.; Gibson, K.E. Improving the Detection and Understanding of Infectious Human Norovirus in Food and Water Matrices: A Review of Methods and Emerging Models. Viruses 2024, 16, 776. [Google Scholar] [CrossRef]
- Hindson, C.M.; Chevillet, J.R.; Briggs, H.A.; Gallichotte, E.N.; Ruf, I.K.; Hindson, B.J.; Vessella, R.L.; Tewari, M. Absolute quantification by droplet digital PCR versus analog real-time PCR. Nat. Methods 2013, 10, 1003–1005. [Google Scholar] [CrossRef]
- Jeon, S.B.; Seo, D.J.; Oh, H.; Kingsley, D.H.; Choi, C. Development of one-step reverse transcription loop-mediated isothermal amplification for norovirus detection in oysters. Food Control 2017, 73, 1002–1009. [Google Scholar] [CrossRef]
- Elizaquível, P.; Aznar, R.; Sánchez, G. Recent developments in the use of viability dyes and quantitative PCR in the food microbiology field. J. Appl. Microbiol. 2014, 116, 1–13. [Google Scholar] [CrossRef]
- Wang, W.; Wang, B.; Li, Q.; Tian, R.; Lu, X.; Peng, Y.; Sun, J.; Bai, J.; Gao, Z.; Sun, X. Ultrasensitive Detection Strategy of Norovirus Based on a Dual Enhancement Strategy: CRISPR-Responsive Self-Assembled SNA and Isothermal Amplification. J. Agric. Food Chem. 2024, 72, 4415–4425. [Google Scholar] [CrossRef] [PubMed]
- MacLean, A.R.; Gunson, R. Automation and standardisation of clinical molecular testing using PCR.Ai—A comparative performance study. J. Clin. Virol. 2019, 120, 51–56. [Google Scholar] [CrossRef]
- Kumar, H.; Dhalaria, R.; Guleria, S.; Cimler, R.; Prerna, P.; Dhanjal, D.S.; Chopra, C.; Sethi, N.; Pathera, A.K.; Kala, D.; et al. Immunosensors in food, health, environment, and agriculture: A review. Environ. Chem. Lett. 2024, 22, 2573–2605. [Google Scholar] [CrossRef]
- Arduini, F.; Micheli, L.; Moscone, D.; Palleschi, G.; Piermarini, S.; Ricci, F.; Volpe, G. Electrochemical biosensors based on nanomodified screen-printed electrodes: Recent applications in clinical analysis. TrAC Trends Anal. Chem. 2016, 79, 114–126. [Google Scholar] [CrossRef]
- Li, X.-M.; Yang, X.-Y.; Zhang, S.-S. Electrochemical enzyme immunoassay using model labels. TrAC Trends Anal. Chem. 2008, 27, 543–553. [Google Scholar] [CrossRef]
- Wignarajah, S.; Chianella, I.; Tothill, I.E. Development of Electrochemical Immunosensors for HER-1 and HER-2 Analysis in Serum for Breast Cancer Patients. Biosensors 2023, 13, 355. [Google Scholar] [CrossRef] [PubMed]
- Volpe, G.; Draisci, R.; Palleschi, G.; Compagnone, D. 3,3′,5,5′-Tetramethylbenzidine as electrochemical substrate for horseradish peroxidase based enzyme immunoassays. A comparative study. Analyst 1998, 123, 1303–1307. [Google Scholar] [CrossRef]
- Chen, C.; La, M.; Yi, X.; Huang, M.; Xia, N.; Zhou, Y. Progress in Electrochemical Immunosensors with Alkaline Phosphatase as the Signal Label. Biosensors 2023, 13, 855. [Google Scholar] [CrossRef] [PubMed]
- Delibato, E.; Volpe, G.; Romanazzo, D.; De Medici, D.; Toti, L.; Moscone, D.; Palleschi, G. Development and Application of an Electrochemical Plate Coupled with Immunomagnetic Beads (ELIME) Array for Salmonella enterica Detection in Meat Samples. J. Agric. Food Chem. 2009, 57, 7200–7204. [Google Scholar] [CrossRef][Green Version]
- Corradini, A.; Cecchini, M.; Trevisani, M. A Rapid Enzyme-Linked Immunomagnetic Electrochemical (ELIME) Assay for the Detection of Escherichia coli O26 in Raw Milk. Food Anal. Methods 2020, 13, 1366–1370. [Google Scholar] [CrossRef]
- Fabiani, L.; Delibato, E.; Volpe, G.; Piermarini, S.; De Medici, D.; Palleschi, G. Development of a sandwich ELIME assay exploiting different antibody combinations as sensing strategy for an early detection of Campylobacter. Sens. Actuators B Chem. 2019, 290, 318–325. [Google Scholar] [CrossRef]
- Micheli, L.; Fasoli, A.; Attar, A.; Donia, D.T.; Divizia, M.; Amine, A.; Palleschi, G.; Salazar Carballo, P.A.; Moscone, D. An ELIME assay for hepatitis A virus detection. Talanta 2021, 234, 122672. [Google Scholar] [CrossRef]
- Masago, Y.; Konta, Y.; Kazama, S.; Inaba, M.; Imagawa, T.; Tohma, K.; Saito, M.; Suzuki, A.; Oshitani, H.; Omura, T. Comparative Evaluation of Real-Time PCR Methods for Human Noroviruses in Wastewater and Human Stool. PLoS ONE 2016, 11, e0160825. [Google Scholar] [CrossRef]
- Cancelliere, R.; Di Tinno, A.; Cataldo, A.; Bellucci, S.; Kumbhat, S.; Micheli, L. Nafion-based label-free immunosensor as a reliable warning system: The case of AFB1 detection in cattle feed. Microchem. J. 2023, 191, 108868. [Google Scholar] [CrossRef]
- Celio, L.; Ottaviani, M.; Cancelliere, R.; Di Tinno, A.; Panjan, P.; Sesay, A.M.; Micheli, L. Microfluidic Flow Injection Immunoassay System for Algal Toxins Determination: A Case of Study. Front. Chem. 2021, 9, 626630. [Google Scholar] [CrossRef] [PubMed]
- Hofmeister, M.G.; Foster, M.A.; Teshale, E.H. Epidemiology and Transmission of Hepatitis A Virus and Hepatitis E Virus Infections in the United States. Cold Spring Harb. Perspect. Med. 2019, 9, a033431. [Google Scholar] [CrossRef] [PubMed]
- Wu, R.; Meng, B.; Corredig, M.; Griffiths, M.W. Rapid Detection of Hepatitis A Virus in Foods Using a Bioluminescent Assay in Real-Time (BART) and Reverse Transcription Loop-Mediated Isothermal Amplification (RT-LAMP) Technology. Food Environ. Virol. 2023, 15, 144–157. [Google Scholar] [CrossRef] [PubMed]
- Guerrero, S.; Agüí, L.; Yáñez-Sedeño, P.; Pingarrón, J.M. Design of electrochemical immunosen-sors using electro-click chemistry. Application to the detection of IL-1β cytokine in saliva. Bioelectrochemistry 2020, 133, 107484. [Google Scholar] [CrossRef]
- Antipchik, M.; Reut, J.; Ayankojo, A.G.; Öpik, A.; Syritski, V. MIP-based electrochemical sensor for direct detection of hepatitis C virus via E2 envelope protein. Talanta 2022, 250, 123737. [Google Scholar] [CrossRef]
- Manzano, M.; Viezzi, S.; Mazerat, S.; Marks, R.S.; Vidic, J. Rapid and label-free electrochemical DNA biosensor for detecting hepatitis A virus. Biosens. Bioelectron. 2018, 100, 89–95. [Google Scholar] [CrossRef]
Disclaimer/Publisher’s Note: The statements, opinions and data contained in all publications are solely those of the individual author(s) and contributor(s) and not of MDPI and/or the editor(s). MDPI and/or the editor(s) disclaim responsibility for any injury to people or property resulting from any ideas, methods, instructions or products referred to in the content. |
© 2024 by the authors. Licensee MDPI, Basel, Switzerland. This article is an open access article distributed under the terms and conditions of the Creative Commons Attribution (CC BY) license (https://creativecommons.org/licenses/by/4.0/).