1. Introduction
Wireless sensor networks (WSNs) have emerged as an alternative technology that facilitates bridging internet-based communication, computing infrastructure, and remote-sensing devices [
1]. WSNs have been designed for data collection, processing, and transmission in a collaborative manner, with a focus on energy efficiency and scalability [
2]. WSNs can be categorized into five types, according to the physical environment: terrestrial, underground, underwater, mobile, and multimedia [
3,
4]. They are capable of being deployed in hostile and harsh conditions (e.g., rain, snow, wind, thunder, etc.). The deployment of the WSN type, as well as the communication technology (e.g., IEEE 802.11 protocol, low-power wide-area network (LPWAN), ZigBee, Wibree, and so on [
4,
5]) used in WSNs, are selected according to the application and environment conditions. These include, for example, on land for human existence detection in the case of disasters [
6], underwater for optimal placement of a set of autonomous underwater vehicles [
7], and underground for health monitoring at mines [
8], among others. Typically, a WSN consists of a group of wireless sensor nodes that communicate wirelessly to monitor any physical phenomenon or an environmental condition in a wide range of civilian and military applications. Ideally, each sensor node is small and has low power consumption, containing a power supply, a micro-controller, a wireless receiver and a transceiver, digital and analog interfaces, and memory for wireless communications. These nodes are designed to operate independently, configuring themselves in a network without the need for established communications infrastructure. The sensor nodes collect data from the environment and transmit sensor readings to other nodes or a communications gateway. The gateway receives data from the sensor nodes and makes sensor data available through a user interface. Sensor data can be made available through the internet for remote sensor network reading and management [
2,
9,
10].
However, WSNs have several design constraints and tradeoffs to consider, including a short communication range, security, scalability, reliability, limited processing and memory resources, and limited access to energy sources in each sensor node [
3,
4,
11,
12,
13]. WSNs have gained considerable attention in recent years, particularly with the advances in Micro-Electro-Mechanical Systems (MEMS), nanotechnology, and sensing and communications technologies, which have facilitated the development of small, low-power, and low-cost sensors [
14,
15,
16,
17] and their application in a wide range of civilian and military applications, such as indoor environment monitoring of air quality [
18] and outdoor environmental management over a large area in real time [
19], control of industrial processes, such as manufacturing, maintenance, and logistics [
20], body-sensor networks to monitor the health of patients in hospitals [
21], monitoring soil moisture, temperature, and other environmental conditions for efficient irrigation and crop management in agriculture [
22], surveillance and security applications, such as monitoring noise levels and detecting intruders [
2], architectural heritage monitoring [
23], navigation, from safety and diagnostic tools to entertainment and business services [
24], and military operations, such as battlefield surveillance, enemy intrusion detection, border-fencing monitoring, and Nuclear, Biological, and Chemical (NBC) detection, among others [
13,
25], in which chemical warfare agents (CWAs) are included.
Intentional use of CWAs against animals, plants, civilians, and military forces is an increasing world-wide risk in the 21st century [
26]. CWAs are among the most toxic compounds ever produced, especially those classified as chemical nerve agents (CNAs), such as Sarin gas. Because CNAs are very dangerous to human life, accurate monitoring systems and fast mitigation responses are crucial. Mitigation responses include chemical nerve agent detection, evacuation, and decontamination of the affected areas. These procedures are usually managed by a rescue team (specially trained personnel) that works in extremely life-hazardous scenarios, which pose substantial challenges due to the complexity of the operations [
27]. In these complex scenarios, the use of unmanned aerial or ground vehicles (UAVs and UGVs, respectively) combined with WSNs is gaining attention because of their inherent characteristics [
28,
29], such as the easy deployment of sensor nodes, their improved safety for humans, and their low maintenance costs. The UAV can also act as the communications gateway.
Most WSNs do not integrate optical fiber sensors (OFSs) and do not take advantage of their intrinsic properties, such as their small size, light weight, resistance to harsh environments and electromagnetic interference, remote sensing capacity, real-time monitoring capacity, biocompatibility, flexible integration with other technologies, and so on [
30]. On the other hand, the integration of OFSs in WSNs avoids the use of all-optical-fiber-sensors network (OFSN) technology, wherein extensive lengths of fiber optic cable are necessary for connecting all of the sensors in pre-defined positions to create an optical fiber network (OFN), which can be expensive and impractical. Based on the above, the integration of OFSs in WSNs introduces benefits and new capabilities for the design, development, and implementation of advanced hybrid-sensing systems [
30,
31,
32,
33], not only for acquiring information remotely regarding physical parameters (e.g., pressure, acceleration, temperature, or vibration) but also to measure biological, chemical, or magnetic parameters. Some research groups are focused on the integration of OFSs with WSNs [
8,
31,
32,
33], whose sincere effort is paving the way for the integration of these two technologies, as described below. The work described in [
8] proposes a WSN integrated with OFSs, such as Fiber Bragg Gratings (FBGs), the Brillouin and Raman optical time-domain reflectometer (OTDR), and Fabry–Pérot interferometers (FPIs), to detect and localize sources of damage, such as strain vibration, temperature, and humidity changes, for underground mining monitoring. The work described in [
31] proposes and demonstrates a hybrid WSN integrated with an intrinsic optical fiber (OF) pH sensor for process monitoring in an Amesh network structure; the versatility and flexibility of this approach make it suitable for a wide range of industrial scenarios. In [
32], a mobile WSN integrated with an OFS module and a ZigBee protocol was proposed and demonstrated. The OFS module consists of two OFSs for physical and chemical detection, a temperature sensor based on FBGs and an intrinsic OF pH sensor, respectively. This work shows the potential for extension to other OFS concepts. The work described in [
33] proposes a WSN for real-time monitoring of subsurface deformation composed of three modules: (1) a sensing module, which comprises various sensor nodes based on FBGs for measuring strain in the borehole; (2) a transmission module based on the 4G/5G cellular network; and (3) a cloud module, which processes and analyzes the data to output the vertical strain deformation and then compares this value with historical data and sends alerts when pre-defined thresholds are exceeded. Despite several advantages of WSN and OFS technologies, as well as the constant development in both areas, the integration and application of these two technologies in major industries is not a usual situation. Therefore, this is an active field of investigation with great potential for research with application in a wide range of fields, such as healthcare, civil engineering, defense, and so on.
In this paper, we present in detail the design and implementation of the hardware and software of a wireless sensor node that includes a micro-controller (MCU), a radio frequency (RF) transceiver, an antenna, a rechargeable battery, a voltage regulator, and four sensing devices. The wireless sensor node can determine the geographical coordinates of the sensor node; measure the altitude, temperature, and accelerations in the
x-
y-
z axes; and detect the presence of a harmful chemical agent by using a sensor head implemented with a hetero-core fiber optic structure coated with stacked material layers. In addition, we also present the wireless communication protocol and software of the wireless sensor node formed by the gateway and the sensor nodes. For the purpose of demonstrating (i) that the proposed sensor head has potential application for chemical agent measurement (in this case, Di-Methyl Methyl Phosphonate (DMMP) vapor in the air) and (ii) the feasibility of integrating this sensor head into the proposed wireless sensor node, the experimental characterization in a laboratory environment was performed, involving a highly sensitive Optical Fiber Refractive Index Sensor (OFRIS) supporting the surface plasmon resonance (SPR) effect. The experimental results indicate the feasibility of detecting DMMP vapor in the air using the proposed optical sensor head, which can be integrated with electronics and software to create a wireless sensor node. The proposed wireless sensor node, also called SensorQ, is proposed for the detection of CWAs, including, in this work, DMMP as a simulant of Sarin gas.
Table 1 summarizes previous work related to WSNs integrated with OFSs and this work.
To the best of our knowledge, this is the first time that the hetero-core fiber optic structure supporting the SPR phenomenon for DMMP detection is integrated into a wireless sensor node to harness the advantages of both worlds. We strongly believe that the resulting device has the potential to be integrated into a WSN for chemical warfare agent (CWA) detection in the following years for armed forces’ use.
The remainder of this manuscript is organized as follows.
Section 2 provides the wireless sensor node design.
Section 3 describes wireless sensor node electronics.
Section 4 describes the proposed sensor head.
Section 5 provides the wireless communication protocol of the WSN formed by the gateway and sensor nodes.
Section 6 describes the wireless sensor node software.
Section 7 presents the user interface.
Section 8 presents the experimental results in a laboratory environment regarding wireless communications and the sensor head. Finally,
Section 9 provides a conclusion to this work.
2. Wireless Sensor Node
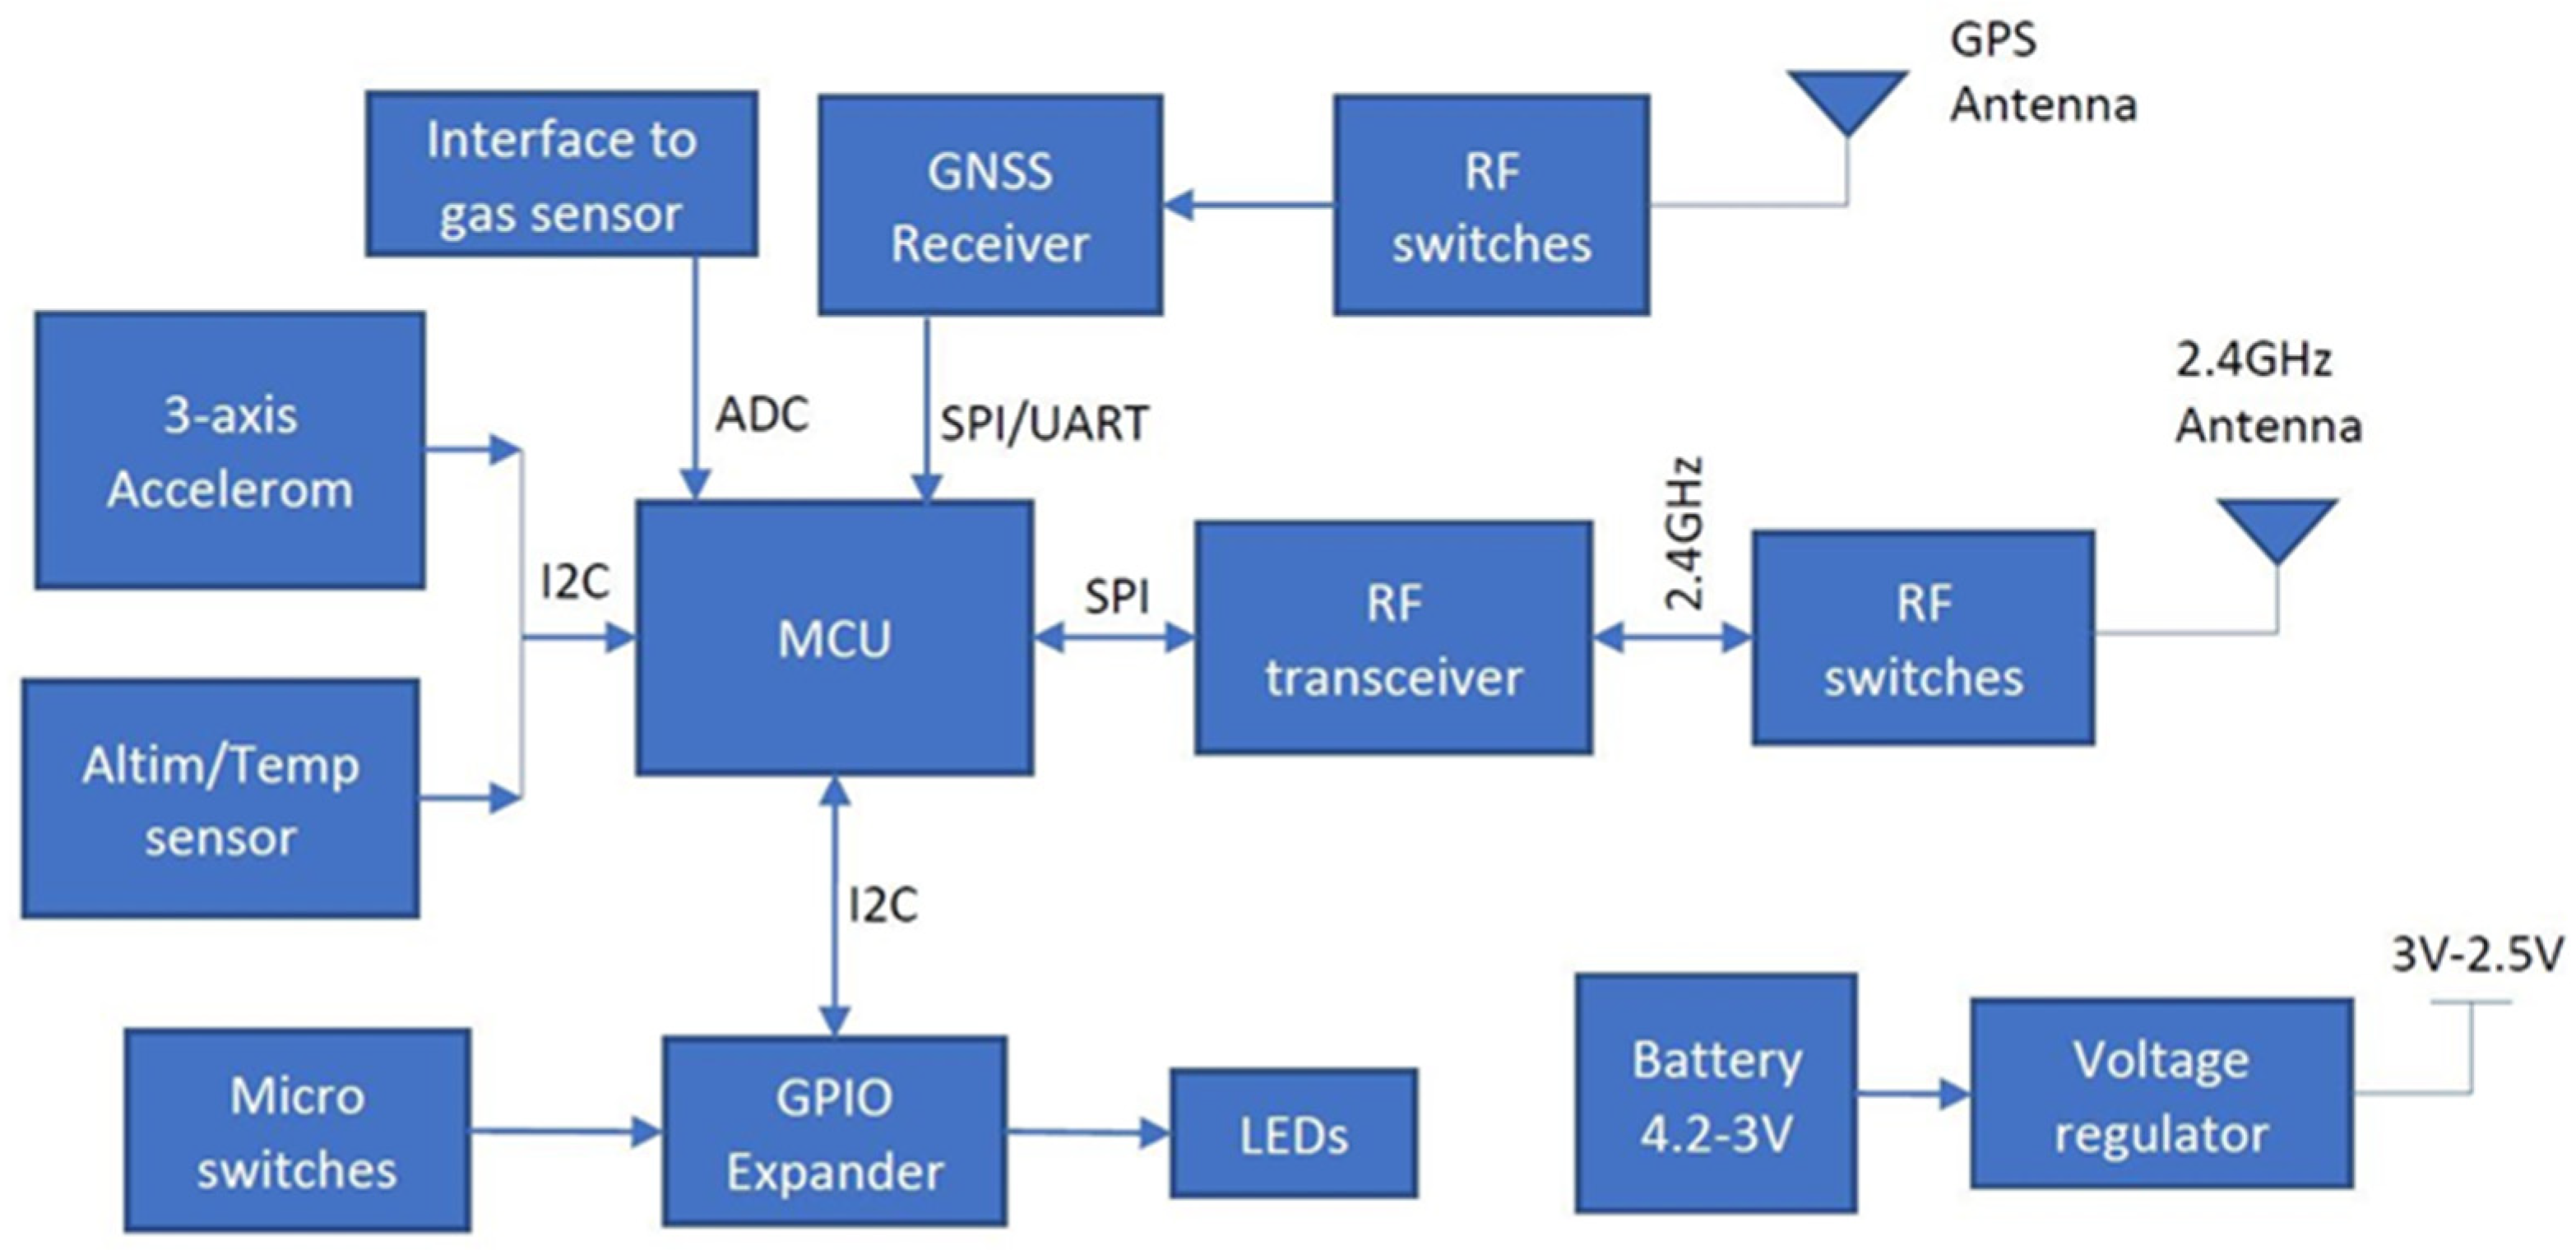
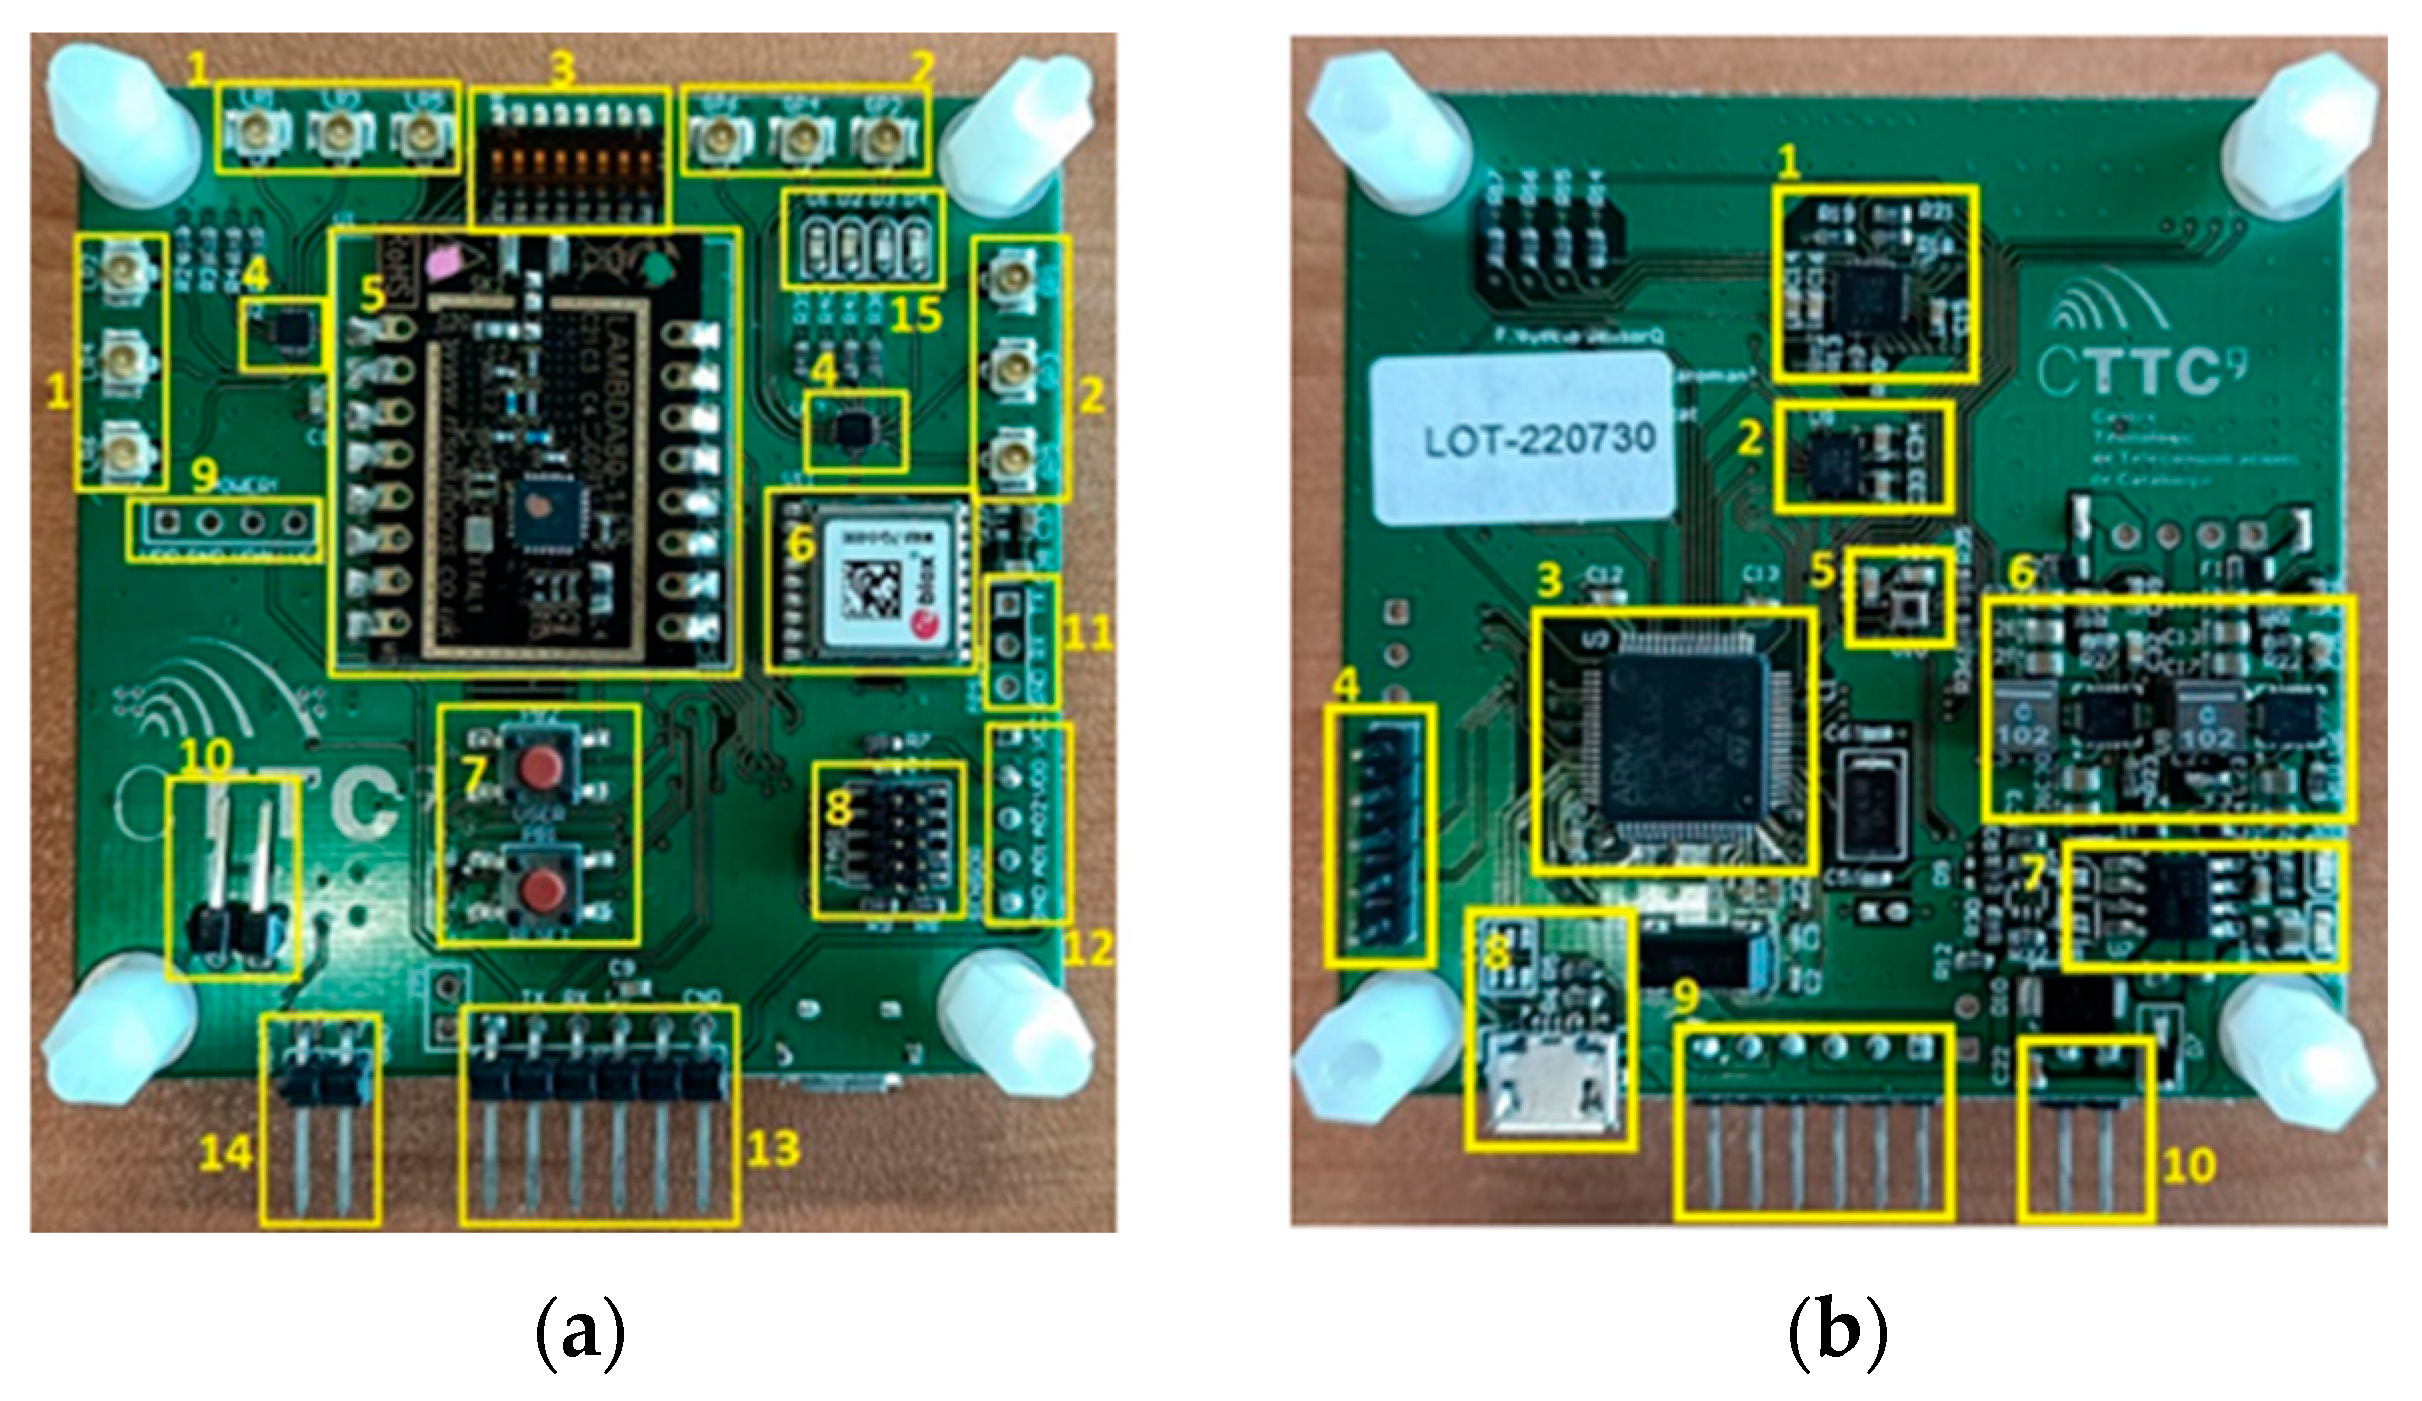
The proposed wireless sensor node for chemical agent detection has the hardware architecture shown in
Figure 1. The sensor node is mainly composed of a micro-controller unit (MCU), an RF transceiver and an antenna for wireless communications operating at 2.4 GHz, a global navigation satellite system (GNSS) for reception, a rechargeable battery, a voltage regulator, and four sensing devices to acquire several physical parameters, which are the following: a GNSS receiver to determine the geographical coordinates of the sensor node; an altimeter to measure the altitude and temperature surrounding the sensor node; a 3-axis accelerometer to measure the accelerations in the
x-y-z axes; and a chemical agent sensor head implemented with fiber optics to detect the presence of harmful chemicals. In this work, the chemical compound used is DMMP.
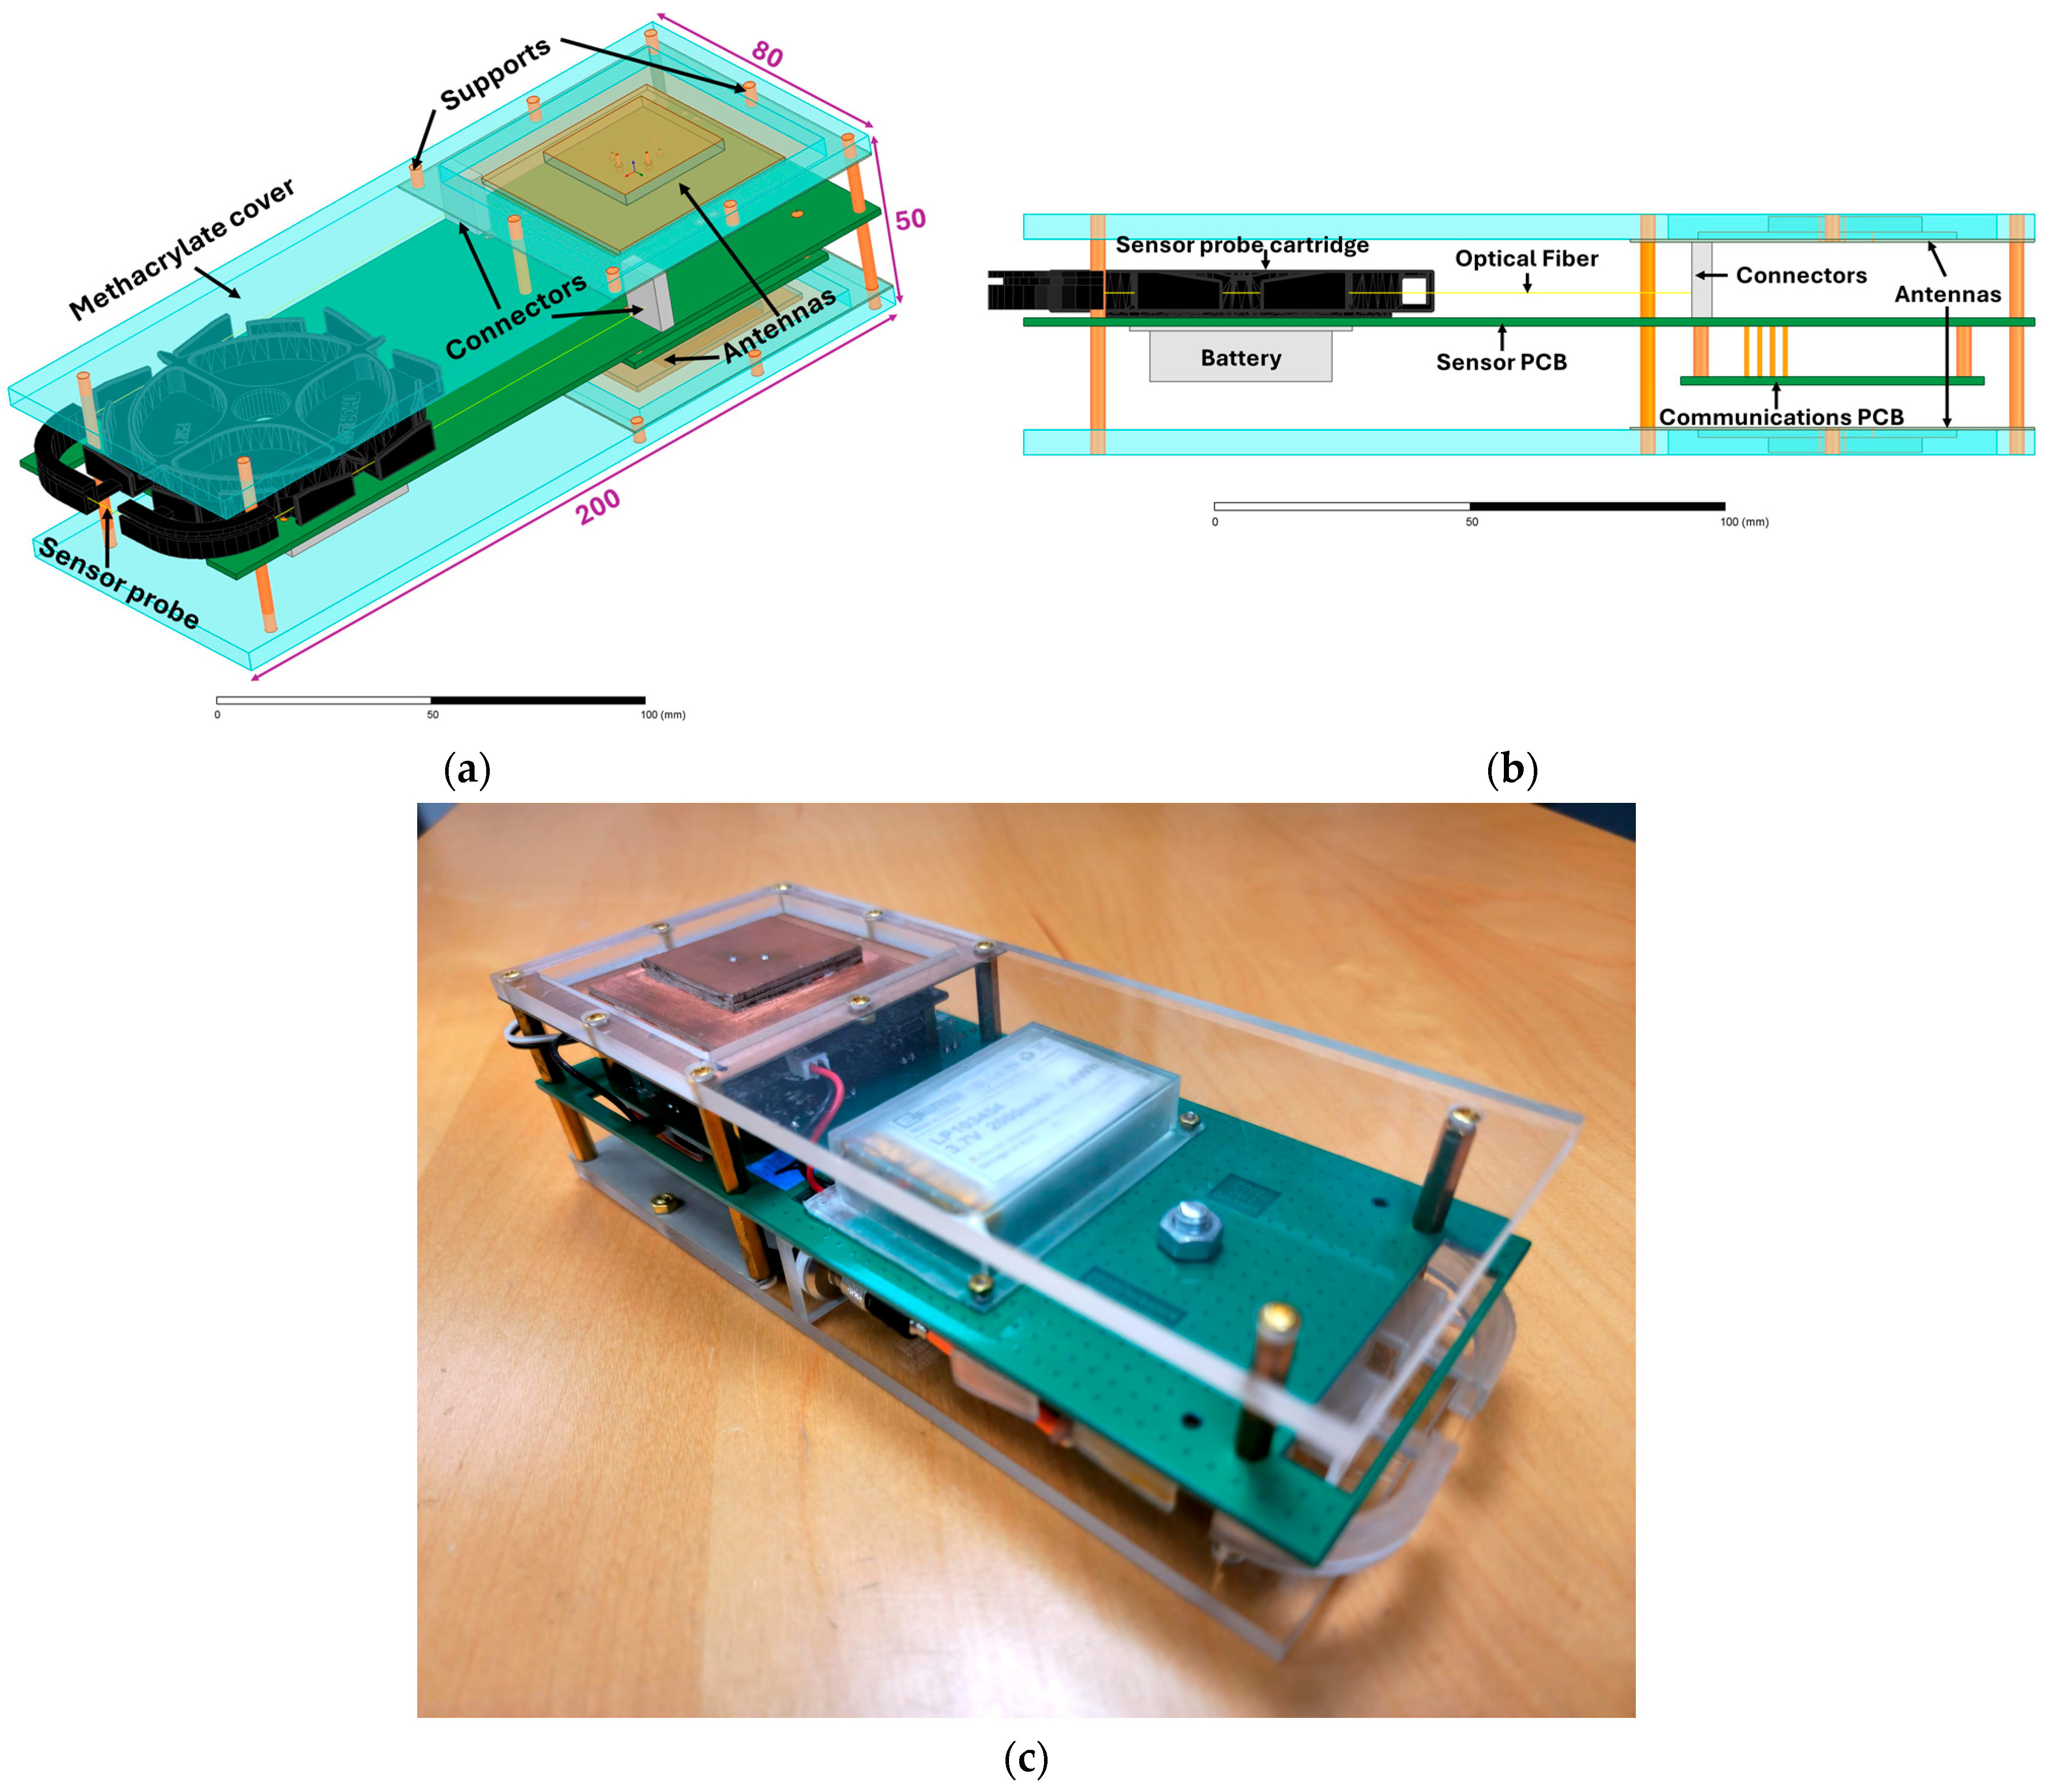
A 3D model of the wireless sensor node prototype is shown in
Figure 2a, and a lateral view of the design is shown in
Figure 2b, highlighting its main components. A photograph of the fabricated and packaged wireless sensor node is shown in
Figure 2c. The final dimensions and weight of the proposed prototype are 200 × 80 × 60 mm and 422.055 g, respectively. The weight and size of the wireless sensor node fully integrated with the OFS module by components/sections are provided in
Table 2. The sensor node is equipped with a low-cost sensor, which consists of a hetero-core optical fiber structure used to increase sensor sensitivity and maintain the robustness of the sensor to support the SPR effect for the detection of the chemical compound DMMP. The fiber cartridge is 3D-printed for reduced complexity and cost [
34].
The sensor node communicates using the globally available 2.4 GHz band by means of the Long-Range (LoRa) physical layer, which provides a long communication range while robustly withstanding interference, the Doppler effect, and multi-path propagation [
35,
36].
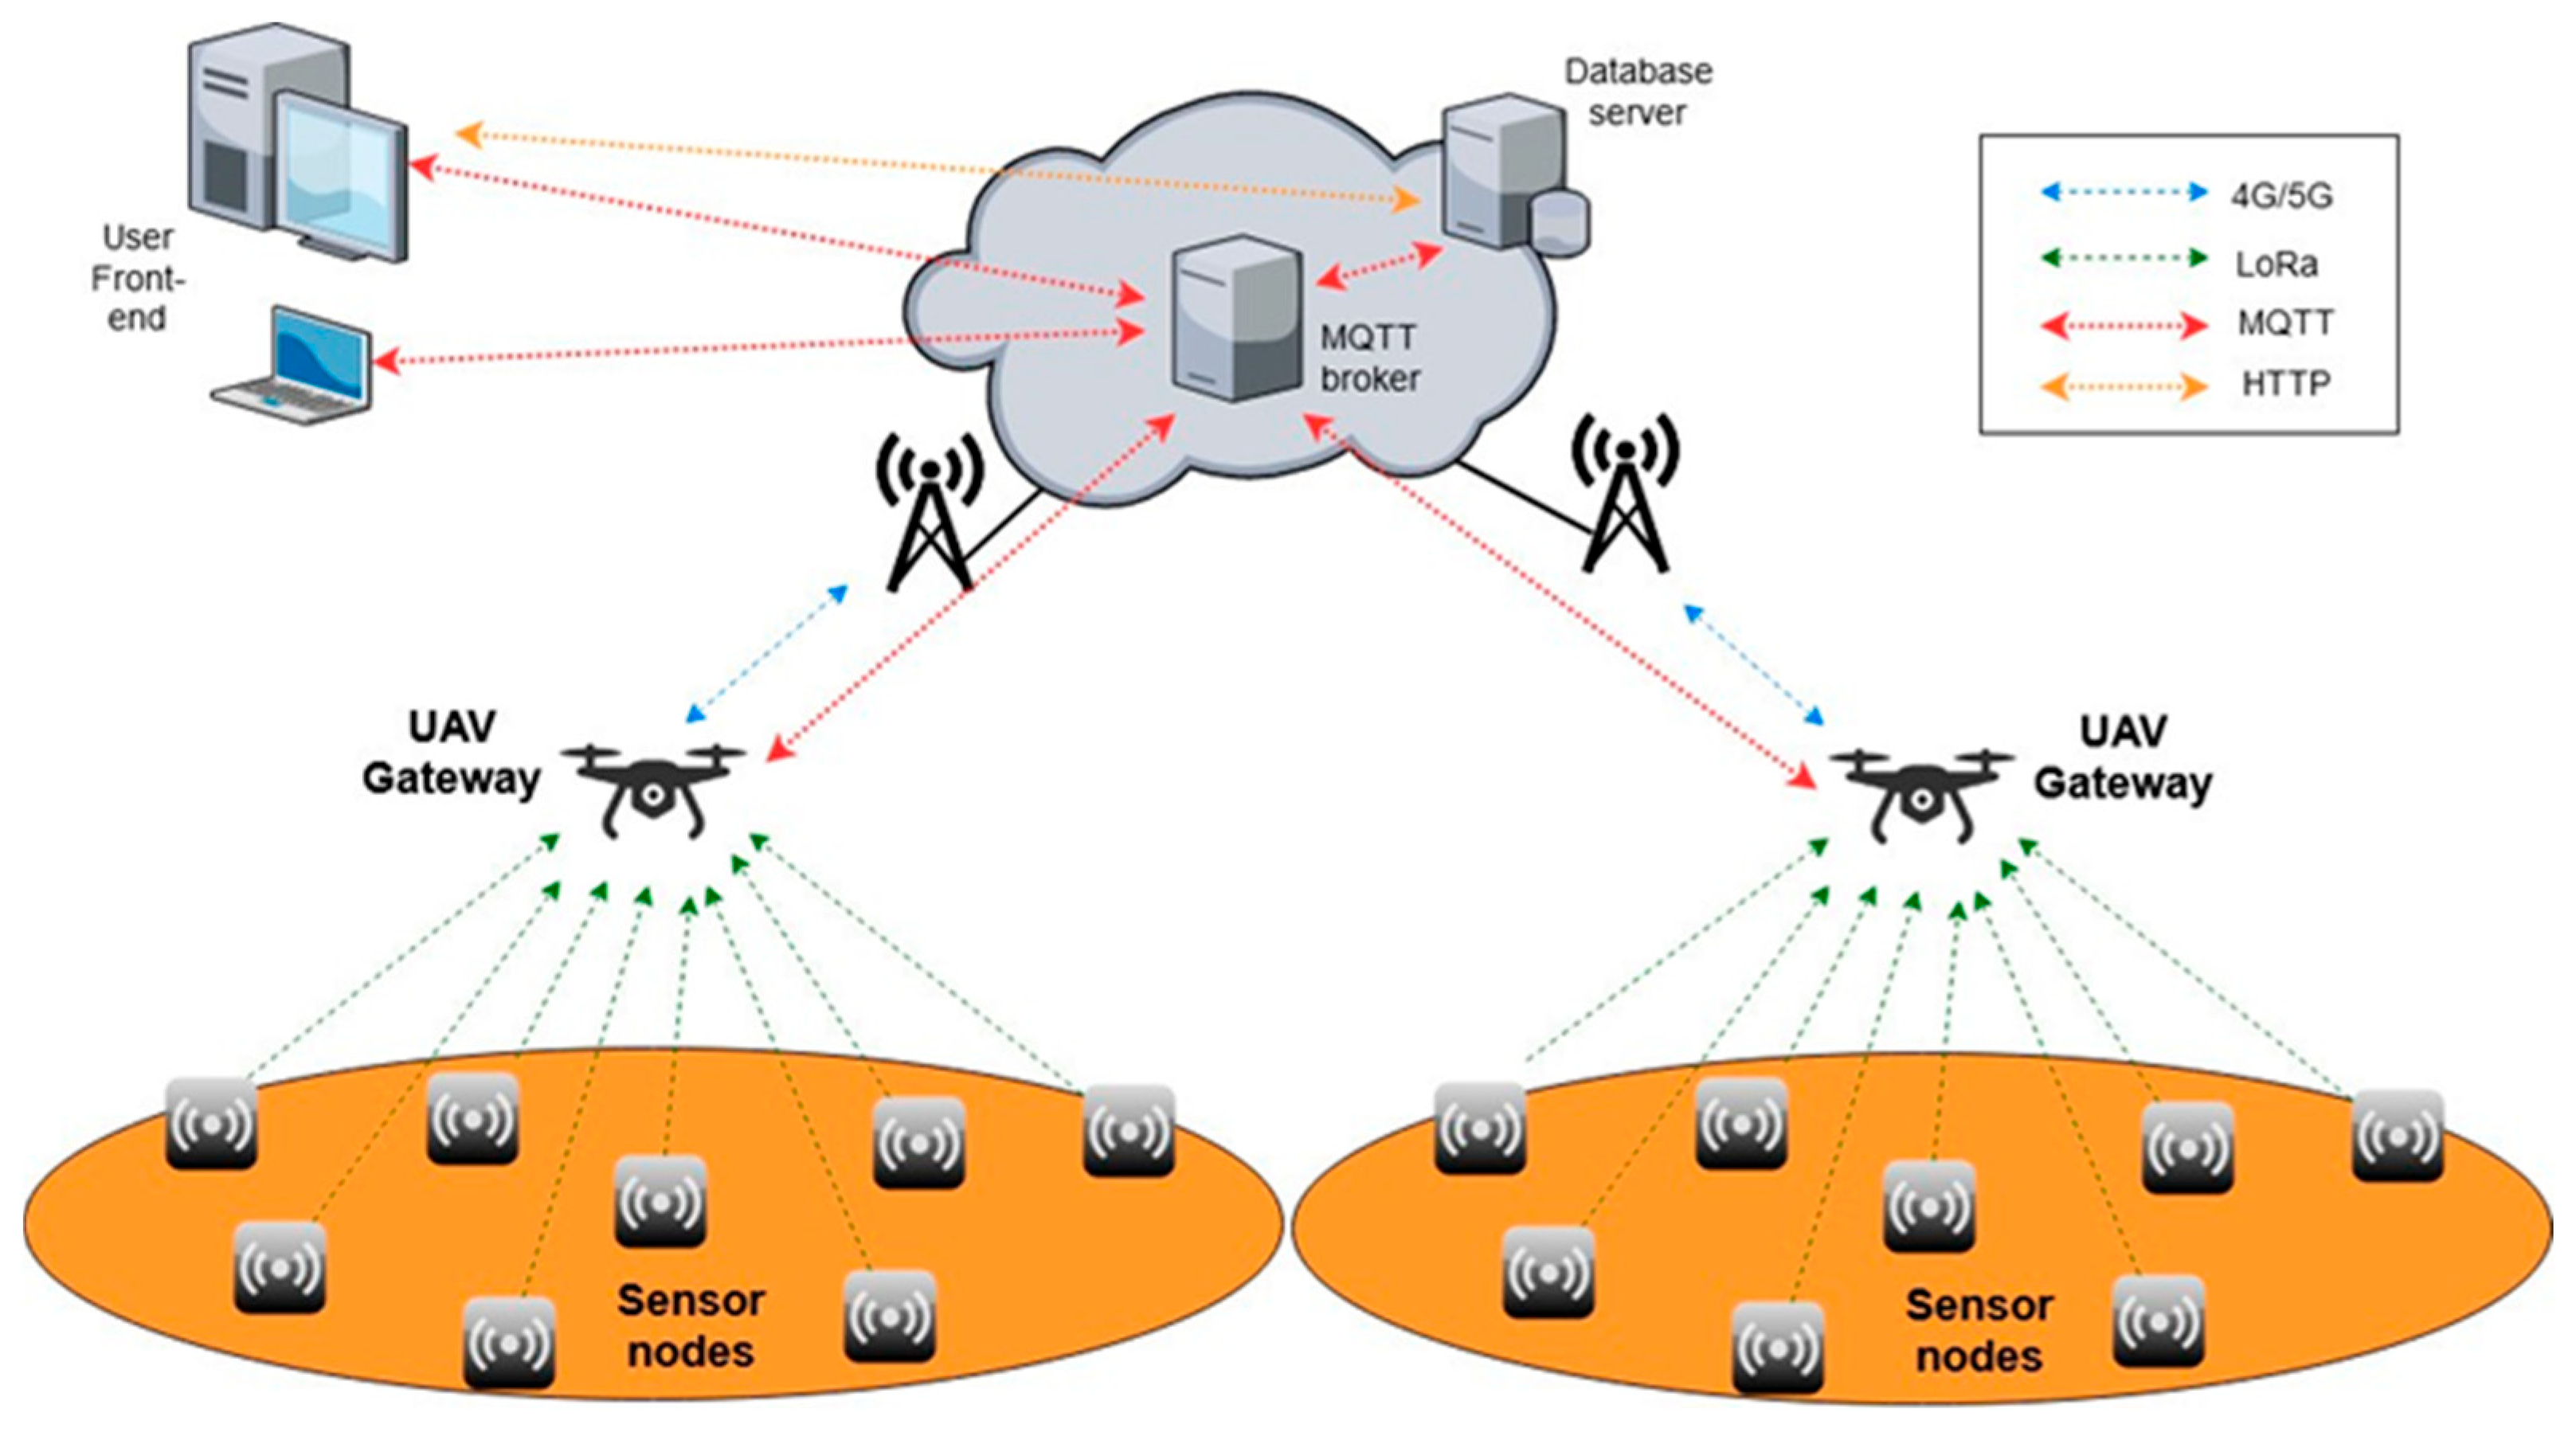
The WSN architecture of the proposed SensorQ system that uses the wireless sensor node described in this work is represented in
Figure 3. The system is composed of several sensor nodes, one gateway mounted onboard an unmanned aerial vehicle (UAV), a database server allocated in the Cloud, and a front-end user interface (FEUI). The lower part of
Figure 3 represents the sensor nodes deployed randomly across the geographical area that is being monitored. Just above the sensor nodes, the UAV equipped with the gateway flies at a certain altitude and speed.
The gateway and those sensor nodes that exist within the radio coverage range of the gateway form a UAV-assisted WSN in a star topology, allowing for a single-hop link between the gateway and each sensor node. This WSN occupies a circular area of radius R where the UAV is located at the center. As the geographical position of the UAV changes, the sensor nodes within the gateway coverage are different. We assume that the gateway does not know the exact position of the sensor nodes and they are not aware of either the trajectory of the UAV nor the number of sensor nodes in their proximity.
To guarantee that the gateway collects data from all sensor nodes, the trajectory of the UAV must be properly designed to cover all of the areas where the sensor nodes are located. All sensor nodes operate in a low-power listening (LPL) mode [
37] that minimizes their energy consumption while listening to the radio channel. As the UAV moves to a new geographical position, the gateway periodically sends a request to initiate the transfer of measurement data from the sensor nodes to the gateway. Those sensor nodes that receive the request will switch from LPL into active mode and transmit measurement data to the gateway, which collects the data, stores them locally in memory, and forwards the data to the database server.
The gateway is connected to the Internet through a 4G/5G cellular interface and operates as a transparent bridge by forwarding measurement data to the Cloud-based database server where data are stored. The front-end user interface is a web application that allows for the visualization of measurements collected in real-time and off-line by reading measurements from the database server. In addition, the front-end user interface facilitates the configuration of the communication protocol between the gateway and the sensor nodes.
4. Sensor Head Design
The proposed sensor head has potential application for chemical agent measurement, including, in this case, Di-Methyl Methyl Phosphonate (DMMP) vapor in the air. To test the feasibility of integrating this sensor head into the proposed wireless sensor node, an experimental characterization in a laboratory environment was performed to prove the concept, which involved a highly sensitive Optical Fiber Refractive Index Sensor (OFRIS) supporting the surface plasmon resonance (SPR) effect.
A fiber optic surface plasmon resonance (FO-SPR) sensor is a highly sensitive sensor using SPR principles combined with optical fiber technology; therefore, the proposed sensor takes advantage of the intrinsic properties of the surface plasmon resonance (SPR) phenomenon (such as high sensitivity, label-free monitoring, and rapid detection, among other well-known properties of optical fiber sensors (such as biocompatibility, electromagnetic immunity, real-time detection, remote sensing, flexible integration with other technologies, etc.)). Surface plasmons (SPs) are oscillations of free electrons at the interface between a metal (usually gold or silver) and a dielectric (such as gases or liquid). By varying the angle at which the polarized light (usually p-polarized) hits the metal-dielectric interface, it can transfer energy to the electrons, causing them to resonate. In this phenomenon, changes in the refractive index near the metal’s surface have a profound effect. SPR sensors based on Multimode-Fiber–Single-Mode Fiber–Multimode-Fiber or MMF-SMF-MMF (also known as hetero-core fiber optic structure) offer significant advantages over conventional MMF-SPR sensors, primarily because they are more sensitive, have better signal-to-noise ratios, are more stable, and have higher resolutions. SMF in the sensor design reduces noise and dispersion by filtering out higher-order modes, leading to more accurate and reliable SPR measurements. As a result, MMF-SMF-MMF-based SPR sensors are highly effective for a wide range of high-precision sensing applications [
39,
40,
41]. Fiber optic SPR gas sensors offer a combination of high sensitivity, selectivity, remote-sensing capability, minimal interference, real-time monitoring, a compact design with low-cost, easiness to fabricate, and mass-fabrication compatibility. These advantages make them superior to many other types of gas sensors for various applications, particularly in challenging environments where traditional sensors might fail or be impractical.
The proposed fiber optic SPR sensor head is prepared using an MMF-SMF-MMF structure and assembled using a fusion splicer, where we sandwiched a 10 mm section of SMF. With this structure, there is no need to peel off the cladding, which makes the sensor more robust. We then deposited titanium (Ti) and gold (Au) layers for the excitation of the SPR phenomenon using a 1 nm Ti layer as an adhesive layer, followed by 60 nm of Au. Additionally, we deposited 1 nm of Ti and 30 nm of ZnO; this last layer is used for sensing DMMP on the SMF fiber part of the sensor, as shown in
Figure 7. For the deposition of thin Ti and Au films, we used thermal and electron beam deposition technique. The thickness of the film was monitored with a conventional quartz–crystal thickness monitor; to produce the thin ZnO film, we used the atomic layer deposition (ALD) technique. We used a graded-index multimode fiber (MMF) (GI, core/cladding diameter of 62.5/125 µm) as a leading-in and leading-out fiber, and we inserted the Single-Mode Fiber (SMF) (SM450, core/cladding diameter 4.5/125 µm) to make the MMF-SMF-MMF sensor structure, as shown in
Figure 7.
It is important to mention that the morphological and structural properties of the thin metal films used in the FO-SPR sensor are interesting topics to investigate, but they are beyond the scope of this work. However, a brief description is given here. The morphological and structural properties of the thin metal films used in the FO-SPR sensors influence the performance of the device, e.g., the sensitivity and detection accuracy of the SPR sensor is drastically affected by the roughness of the metal surface [
42,
43]. Also, it has already been shown that physical and chemical properties as well as applications of the film strongly depend on the deposition method and deposition conditions [
44]. For our proposal, we selected Ti to improve the surface properties of the SMF cladding owing to its low density, biocompatibility, high resistance to corrosion, and structural/mechanical properties [
45]. In addition, it supports the excitation of surface plasmons [
46] and overcomes the drawbacks of using chromium (such as surface defects and lack of phase detection) when used as an adhesive layer [
44]. Depending on the thickness of the Ti Layer, it can be used for bimetallic-type SPR sensors or as an adhesive, as in the present work. It is important to note that as the thickness of the intermediate layer is increased, the deposition of the upper layer become less uniform. Therefore, it can be said that a Ti layer that is less than 5 nm thick will work well as an adhesive layer with moderately low roughness [
47]. On the other hand, although thin silver (Ag) layers produce a sharp dip and consequently have higher sensitivity compared to using Au layers, we selected Au as an active layer because it provides better stability in the chemical environment. Based on the above, Ti and Au were deposited using a thermal evaporation unit one by one on the SMF cladding. Evaporation for both layers was performed in the same environmental conditions and with same element current, vacuum pressure, and temperature. Only the deposition time was varied for the deposition of different thicknesses of both metal layers. Owing to the geometry of the fiber optic structure, the combined Ti and Au layers are diametrically opposed. However, a stable SPR is experimentally observed with this selected fabrication method, as shown in other previous work [
39,
40,
41,
48,
49].
5. Wireless Communication Protocol
Recent research on media access control (MAC) protocols for massive data collection scenarios [
50,
51,
52] use the frame-slotted ALOHA protocol and its variants to manage the access of many nodes, either fixed or mobile, that are interrogated on demand and generate burst traffic. Examples of massive data collection scenarios based on frame-slotted ALOHA are found in RFID, which are typically used to create a real-time inventory of items in warehouses.
In recent years, low-power wide-area networks (LPWAs) [
53] have emerged to provide wireless connectivity to devices that have to transmit few data with low data rates at long distances and consume minimal energy through the device. The LoRa modulation technique was developed by Semtech for the deployment of LPWA [
54] in the unlicensed sub-GHz bands: 869 MHz in Europe and 915 MHz in North America. The term “LoRa WAN” refers to the complete specification of the LPWA technology based on LoRa, which includes the physical layer and MAC layer protocols, while the term “LoRa” refers only to the specification of the physical layer.
Recent research has used the LoRa physical layer at 2.4 GHz for the deployment of long-range WSNs [
35,
36]. The work in [
35] evaluates the communication range of LoRa at 2.4 GHz in three different scenarios (free space, indoor, and urban) at different spreading factors and bandwidths. The results show a maximum range of 133 km in free space, 74 m indoors, and 443 m in outdoor urban scenarios. While the maximum data rate that can be achieved is 253.91 kbit/s, the data rate at the maximum communication range is 0.595 kbit/s in the three scenarios. The work in [
36] presents a WSN for aquatic environmental monitoring based on LoRa at 2.4 GHz. The authors proposed a MAC protocol based on TDMA with adaptive spreading factors at the physical layer, and they evaluated the performance of the protocol in terms of packet delivery rate, delay, and energy consumption. They also measured the communication range over the water surface in line-of-sight (LOS) and non-LOS conditions.
In the rest of this section, the wireless communication protocol of the WSN formed by the gateway and the sensor nodes is described. Because both the gateway and sensor nodes are energy-constrained devices, the protocol has been designed to minimize the energy consumption of the sensor nodes and the data collection time, which is defined as the time elapsed since the gateway sent a request until it receives measurement data from all of the sensor nodes within the gateway-coverage area.
We have considered a wireless sensor network in star topology to facilitate the exchange of packets in one single hop between the gateway and each sensor node. In comparison with the mesh topology, the star topology simplifies and reduces the cost and power consumption of the nodes. Because sensor nodes do not have to receive, decode, and forward packets to other nodes, i.e., routing is not required, the overall delay and energy consumption of the network can be reduced, and, furthermore, the protocol stack can be simplified to just a physical layer and a media access control (MAC) layer.
The physical layer uses the unlicensed 2.4 GHz band for Industrial, Scientific, and Medical (ISM) applications. The 2.4 GHz band is globally available, and the radio regulations in this band do not impose any duty-cycling limits (i.e., a maximum percentage of time during which a node can occupy a channel), which provides flexibility for the design of the MAC layer. We have selected the LoRa [
55] physical layer at 2.4 GHz developed by Semtech, which offers high sensitivity and robustness against interference, the Doppler effect, and multi-path propagation. The LoRa physical layer uses a proprietary spread-spectrum-modulation scheme that is based on Chirp Spread Spectrum (CSS) modulation combined with frequency modulation. It allows us to receive very weak signals, with power levels even below the noise floor, thus facilitating long-range communications at low data rates. The packets at the physical layer contain a preamble (between 8 and 65,535 symbols), a header (8 symbols, only included in an explicit format), a payload (between 1 and 255 bytes), and an optional 16-bit Cyclic Redundancy Check (CRC) code. In an explicit format, the packet header specifies the payload length in bytes and the coding rate and determines if the packet includes CRC.
The sensitivity and the raw data rate of the LoRa physical layer vary according to the spreading factor (SF) and the bandwidth (BW) selected. The SF can take any integer value between 5 and 12, the BW can be 1625 kHz, 812 kHz, 406 kHz, or 203 kHz, and the coding rate can be 4/5, 4/6, 4/7, or 4/8. The sensitivity decreases when lowering the SF and increasing the bandwidth. The maximum sensitivity (−130 dBm) is achieved with SF = 12 and BW = 203 kHz. On the other hand, the raw data rate ranges from 595 bps (with B = 203 kHz and SF = 12) to 253.91 kbps (with B = 1625 kHz and SF = 5). Therefore, if the sensor nodes are very close to the gateway, then we can use the lowest SF and a high data rate; however, if a large radio coverage range is needed, then we must use the highest SF and a low data rate.
The MAC layer is deployed on top of the physical layer to coordinate access to the wireless channel shared among sensor nodes. The MAC layer determines when the sensor nodes are powered on to transmit, listen, or receive. Thus, the design of the MAC layer plays an important role in the energy consumption needed for communications. MAC protocols can be classified into reservation-based and random-access protocols depending on how they organize transmissions among network nodes. In reservation-based protocols, a network coordinator assigns resources (e.g., the time slot and frequency channel) to each node, thus ensuring that they do not collide when transmitting data packets. This approach is complex to implement and requires that the network coordinator has knowledge of the network topology. On the contrary, random-access protocols are based on contention, which means that nodes can transmit without central coordination. This approach simplifies the implementation of the protocol, but when two or more nodes transmit simultaneously, the data packets may collide. Collisions lead to re-transmissions, which may cause congestion and increase the energy consumption and the data collection time.
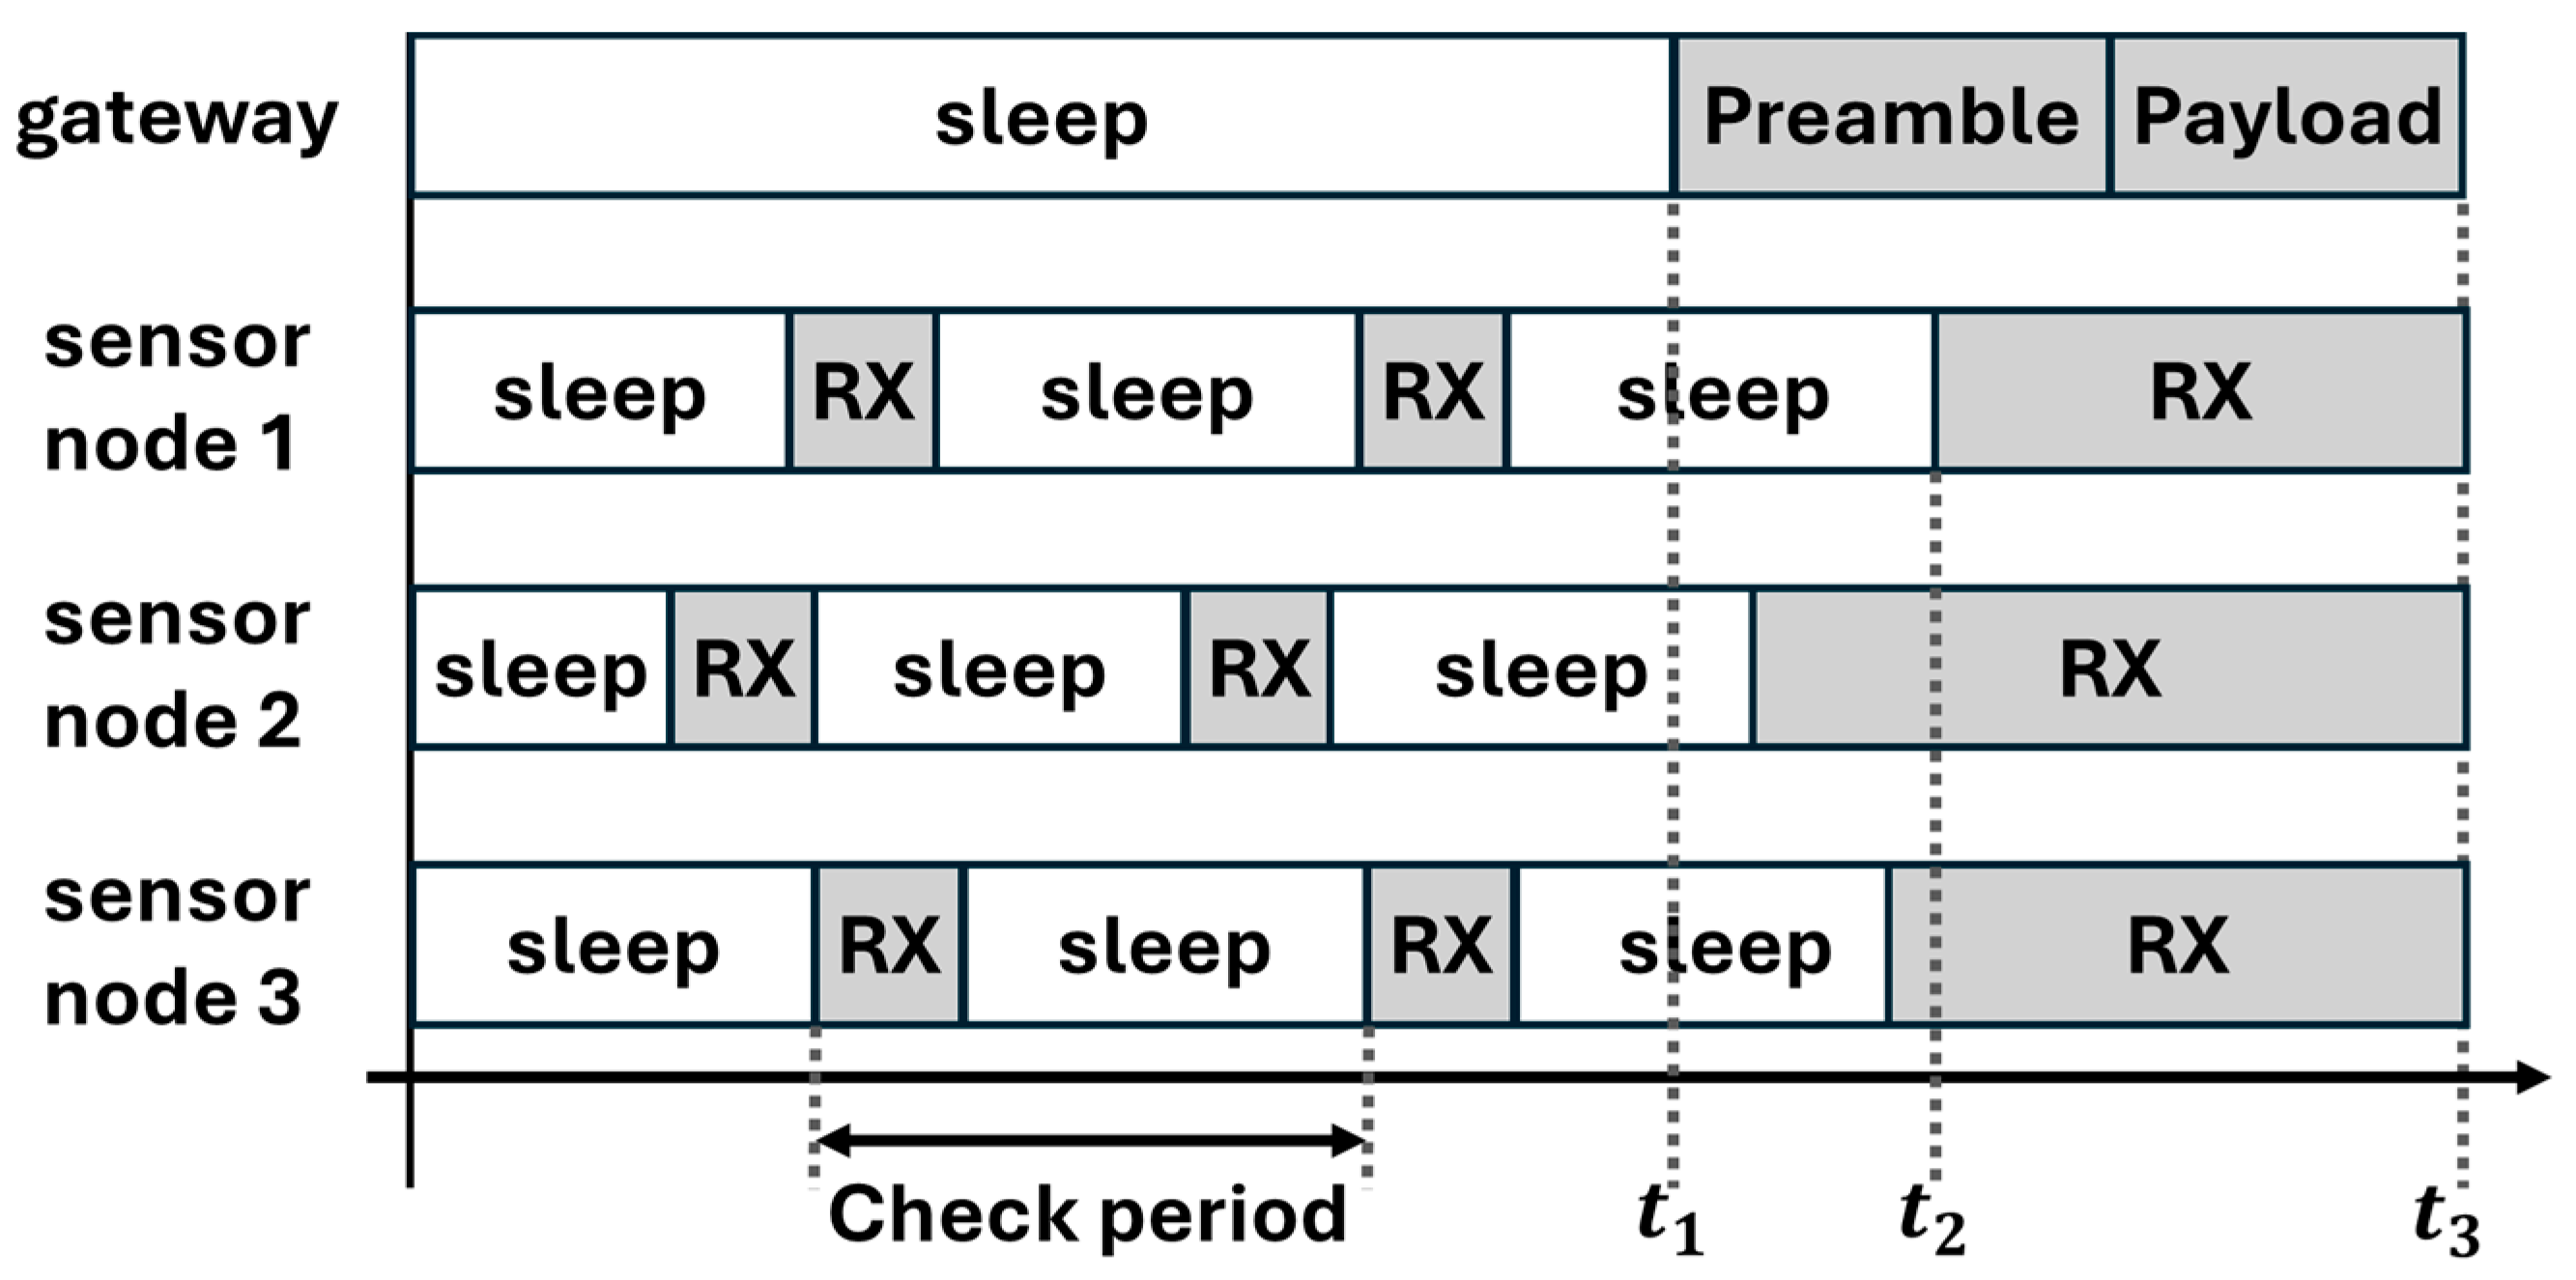
We have selected the frame-slotted ALOHA protocol due to its simplicity and because it is typically used in data collection scenarios where scalability, reliability, and low-energy-consumption requirements are key (e.g., a radio frequency identification system (RFID)). By default, sensor nodes are in low-power listening mode, in which their radio transceiver sleeps and periodically wakes up for a short time, called the wake-up interval, to listen to the channel. If the radio transceiver detects a preamble, it remains in reception mode until a complete packet is received or a predefined time-out expires.
The time between the beginning of two consecutive wake-up intervals (Rx) is called the check period (Tci). To ensure that sensor nodes receive packets sent by the gateway, the packets must include a long preamble that overlaps with at least one wake-up interval; thus, the length of the packet preamble must be equal to or greater than one check period. Furthermore, it is mandatory that all sensor nodes use the same values of wake-up intervals and check periods.
Figure 8 shows an example of three sensor nodes in low-power listening mode. At time t
1, the gateway starts transmitting a packet formed by a preamble and a payload. At time t
2, sensor node 1 detects the preamble and keeps receiving until the end of the packet payload at time t
3. When the sensor nodes receive a request packet from the gateway, they enter the data collection process to transmit measurement data to the gateway by following the rules of frame-slotted ALOHA.
As depicted in
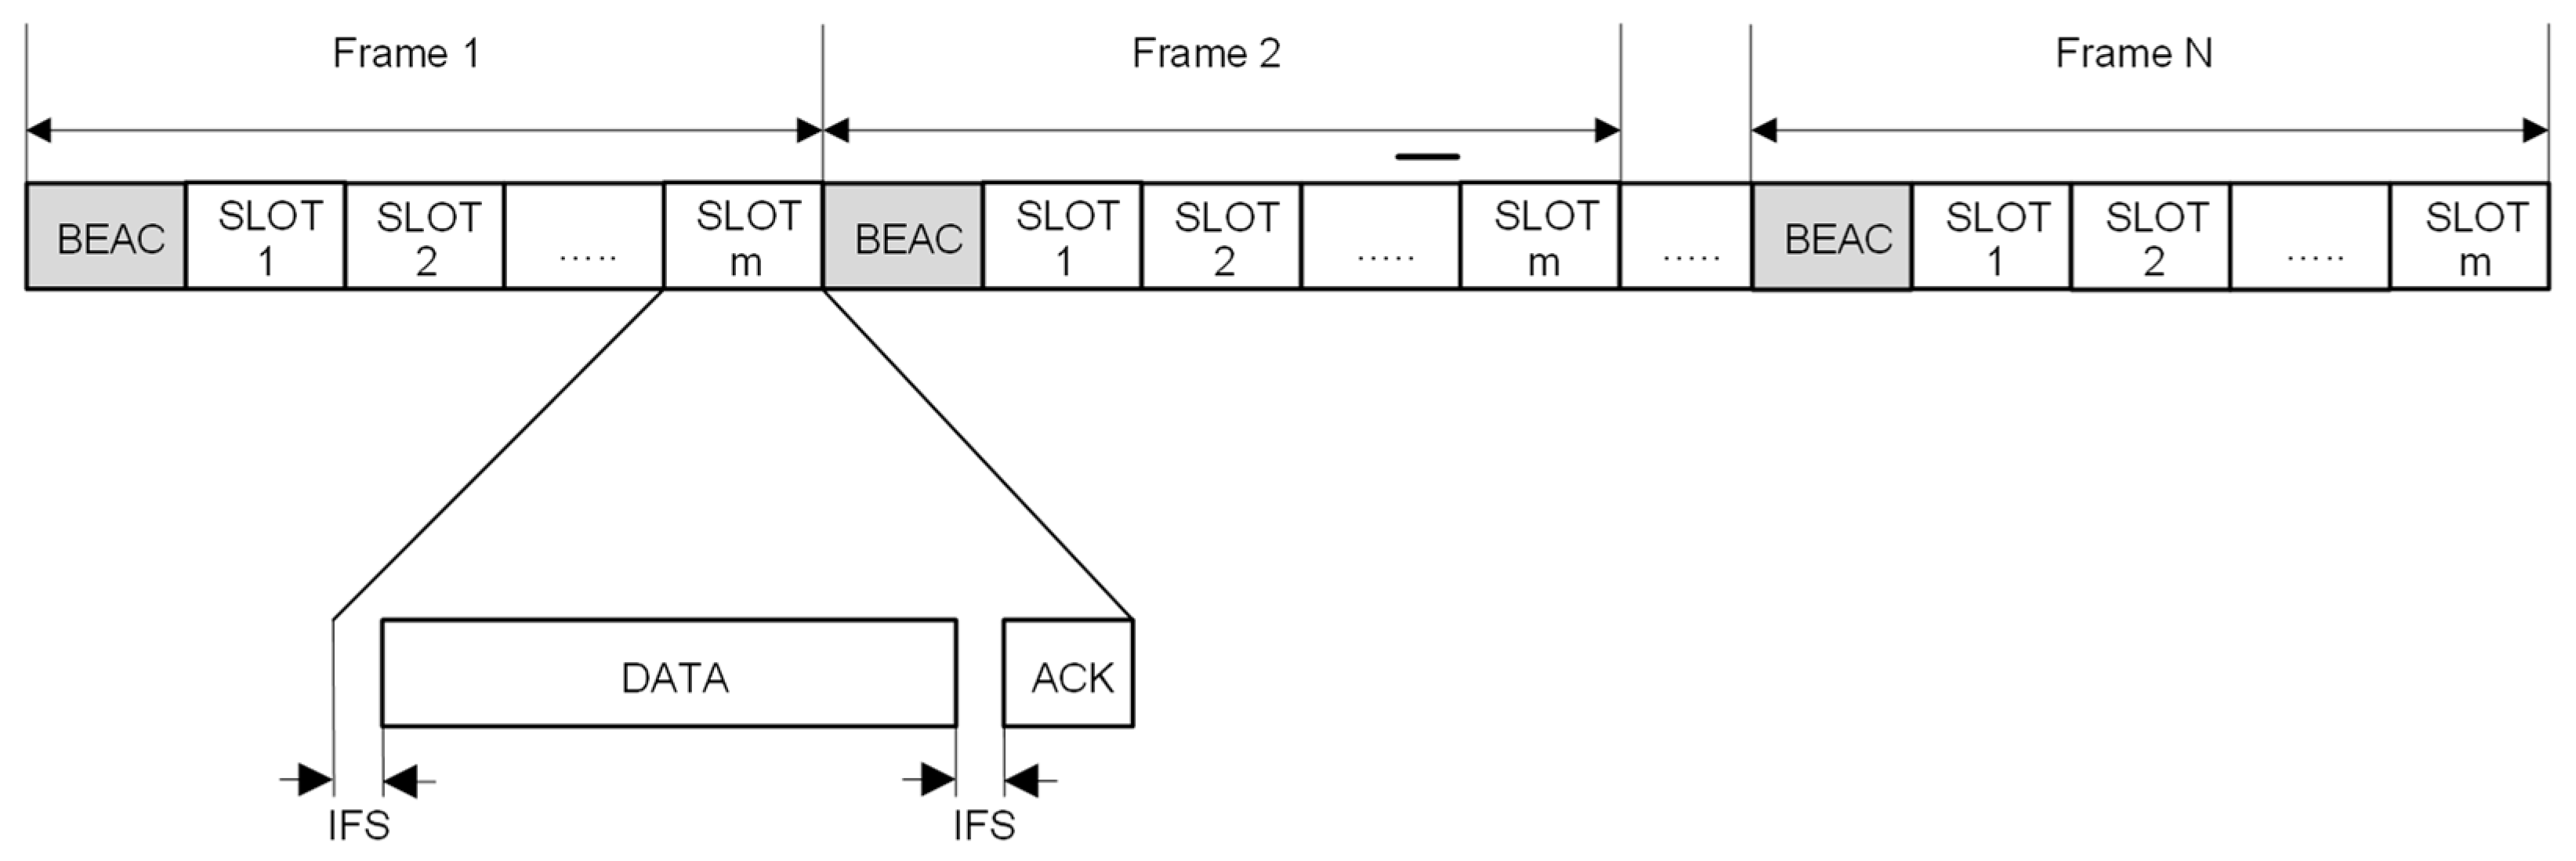
Figure 9, time is divided into a sequence of frames that repeat until data from all sensor nodes have been successfully collected by the gateway. Each frame is divided into several contention slots and starts with a beacon packet sent by the gateway to inform it about the duration of a slot and the number of slots in the current frame. The duration of a slot is adjusted to fit one data packet sent by a sensor node and an acknowledgement packet (ACK) with the necessary guard times, called Inter-Frame Spaces (IFS), to compensate for propagation and processing delays and the time required to switch the radio transceivers between reception and transmission. The sensor nodes are synchronized in every frame after decoding the beacon packet sent by the gateway.
At the beginning of each frame, those sensor nodes that must transmit one or more data packets to the gateway randomly select one slot and transmit one data packet in that frame. The selection of the slot number (between 1 and m) by each sensor node is made at random using a uniform distribution to ensure that all of the slots have the same probability of being selected. A given slot in any frame can be empty when no sensor node has transmitted in that slot; successful when a single sensor node has transmitted in that slot; or in a state of collision when two or more sensor nodes have transmitted. The gateway responds with an ACK to each data packet decoded successfully. Based on the result of each slot, those sensor nodes that have succeeded in transmitting all of their data packets will enter low-power listening mode and stop contending in subsequent frames.
Contrarily, those sensor nodes for which the data packets have collided in the current frame, or that have more data packets to transmit, wait until the next frame starts and repeat the process. The data collection process terminates when the gateway detects that all of the slots of a frame are empty, i.e., the sensor nodes have transmitted all of their data packets to the gateway.
The packets at the MAC layer contain a header (6 bytes) and a payload. The MAC header includes the packet type (8 bits), a sequence number (8 bits), the source node identifier (16 bits), and the destination node identifier (16 bits). The identifiers of the source node and the destination node are used to identify, respectively, the node that has sent the packet and the node where the packet is addressed. The packet type determines whether the packet is a request packet, a beacon packet, a data packet, or an ACK. The format and length of the payload depend on the packet type. For example, the length of the beacon packet payload is 2 bytes (i.e., 1 byte for the slot duration and 1 byte for the number of slots per frame), and the length of the data packet payload is 22 bytes to encode the measurement data. The sequence number is a counter that is incremented by 1 each time a packet has been successfully transmitted. Therefore, if a number n of consecutive packets are received with the same sequence number, if it is necessary to respond to those packets (e.g., with an ACK), the receiver node will respond to each of the N packets, but it will only process the first of the N packets received.
The communication between the gateway, the Cloud-based database server, and the front-end user interface is implemented with the Message-Queuing Telemetry Transport protocol (MQTT). MQTT is a lightweight application-layer protocol based on a publish–subscribe mechanism that works on top of the TCP/IP protocols at the transport and network layers. MQTT is designed for memory- and energy-constrained devices in Machine-to-Machine (M2M) networks and Internet-of-Things (IoT) applications. It defines two types of network entities: a server, named MQTT broker, and several clients.
The MQTT broker is responsible for the exchange of messages between multiple clients connected to the broker. The broker receives messages sent by the clients and forwards the messages to the appropriate clients.
In MQTT, the information is organized in a hierarchy of predefined topics. Each topic is associated with a type of information or data flow. When a client has a new message to distribute, it publishes the message on a certain topic, and the broker forwards the message to those clients that have subscribed to that topic. Each client can both send and receive messages by publishing and subscribing, and a client does not need to know the identification or location of other clients. If the broker receives a message on a topic to which there are no clients subscribed, the broker discards the message unless the publisher designated that message as retained. Then, when a client subscribes to a topic for which the broker has a retained message, the broker immediately sends the retained message to the client.
As shown in
Figure 3, the gateway, the database server, and the front-end user interface work as MQTT clients that exchange messages through an MQTT broker installed on a Cloud server. All messages are encoded in JavaScript Object Notation (JSON), which is a lightweight format that is easy for humans to read and write and for devices to parse and generate. The message types and the topics to which each client publishes and subscribes are detailed in
Table 6. When the gateway collects a set of measurements from the sensor nodes of the UAV-assisted WSN, the gateway publishes a new message on the topic measures/gateway_id, as gateway_id is the identification of the gateway. The front end and the database server subscribe to the topic measures/gateway_id to receive the measurements collected by the gateway.
The gateway subscribes to the topic config/gateway_id to receive configuration parameters published by the front-end user interface and subscribes to the topic query/gateway_id to receive commands published by the front end in order to start the acquisition of measurements from sensor nodes.
6. Wireless Sensor Software
The software architecture of the sensor node, depicted in
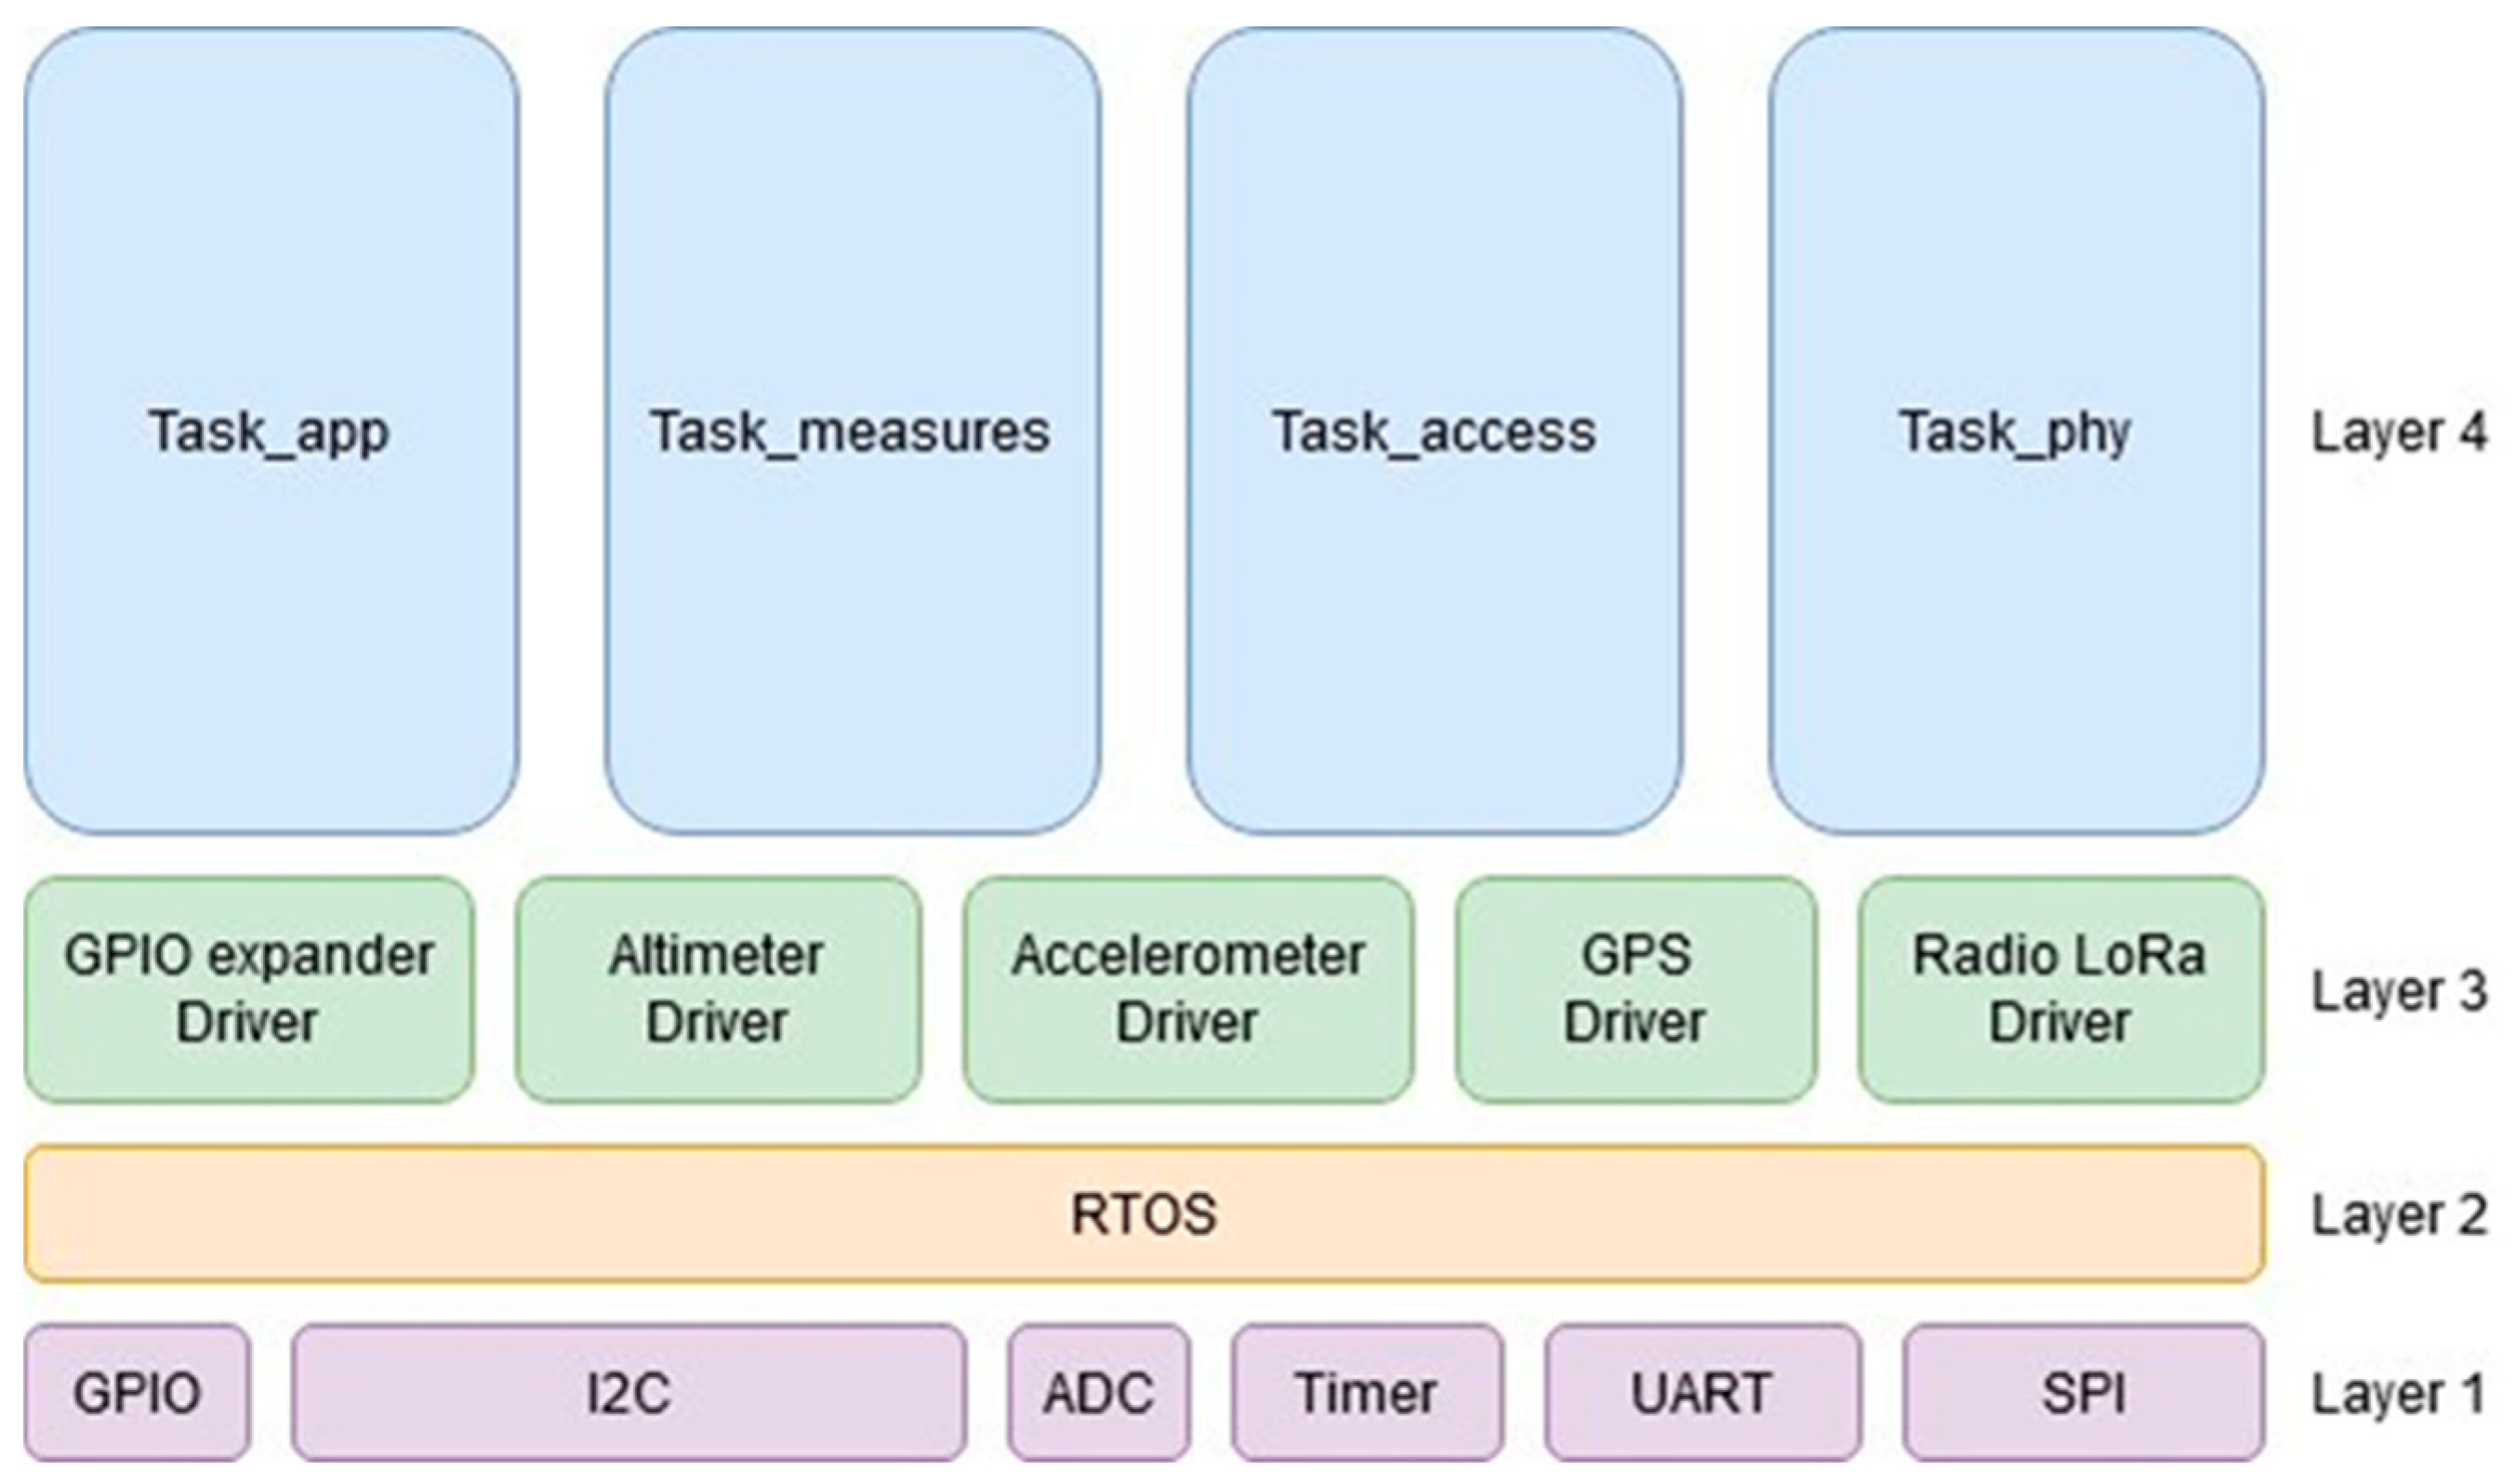
Figure 10, is composed of four inter-related layers. Layer 1, named the Hardware Abstraction Layer (HAL), functions as an interface between the internal peripherals of the micro-controller, i.e., the GPIO, I2C, ADC, Timer, UART, and SPI. Layer 2 is a Real-Time Operating System (RTOS) that facilitates the execution of multiple threads, with each thread dedicated to one task of the micro-controller. Every thread can be scheduled to a specific period, and those threads that are non-periodic can also be easily scheduled, allowing for a response to events in minimal time. Layer 3 contains the drivers that facilitate the access of the micro-controller to the external devices, i.e., the GPIO expander, the altimeter, the accelerometer, the GNSS receiver, and the LoRa radio transceiver. Each driver supports the configuration of the external device and the exchange of data between the micro-controller and the external device by using internal peripherals and several resources provided by the RTOS, e.g., semaphores, events, queues, etc. Layer 4, named the Application Layer, contains four tasks that run in parallel, named Task_app, Task_measures, Task_access, and Task_phy. The functionalities performed by each task of the application layer are described next.
Task_app: this is the main task of the sensor node software. This task communicates with the Task_measures to acquire the measurement data and with the Task_access for wireless communications with the gateway. The Task_app oversees the determination of the state of the sensor node, i.e., in motion or in a fixed position, by monitoring the values of acceleration in the 3 axes. The Task_app configures the accelerometer to detect motion and “free fall”, e.g., when the sensor node is dropped from the UAV. When it detects that the sensor node has been in a fixed position (i.e., constant acceleration in the 3 axes), it performs four operations. Firstly, it determines the position of the sensor node on the ground with respect to the direction of the gravitational force by using the value of the acceleration in the 3 axes. Secondly, it selects the elements of the GNSS antenna and the 2.4 GHz antenna that point upward in order to maximize, respectively, the signal level in relation to satellite reception and the wireless communication range with the gateway. Thirdly, it determines the geographical position and altitude of the sensor node. Fourthly, it switches the radio transceiver into low-power listening mode, and it periodically acquires measurements from the sensing devices.
Task_measures: this task oversees reading the measurements acquired by the sensing devices connected to the micro-controller (i.e., altimeter, accelerometer, GNSS receiver, chemical agent sensor, etc.). The measurement data are stored in global variables shared with the Task_app. The read and write access to these shared variables is managed using a mutex provided by RTOS. For the evaluation of the UAV-assisted WSN using the prototypes of the sensor node developed in this work, each sensor node prototype acquires real measurements of latitude, longitude, 3-axis accelerations, altitude, temperature, and battery voltage; however, the gas concentration is filled with random values.
Task_access: this task implements the MAC layer of the wireless communication protocol between the sensor node and the gateway. When the radio transceiver is in low-power listening mode, if the Task_access receives a request packet from the gateway, it prepares a data packet with the measurement data (i.e., gas presence, concentration, latitude, longitude, altitude, acceleration in the X-Y-Z axes, temperature, battery voltage, and received signal strength indicator of the request packet). This task relies on a periodic timer of the micro-controller that generates a hardware interruption at the beginning of each slot of the frame. Every time a beacon packet is decoded, this task initializes the timer, and it randomly selects one of the slots of the frame and sends the data packet to the Task_phy when the selected slot starts. The selection of the slot number is based on a pseudo-random number generator (PRNG) implemented in the micro-controller. The seed for the PRNG is obtained by reading the noise level at the input of an ADC.
Task_phy: this task implements the physical layer of the wireless communication protocol between the sensor node and the gateway. It is responsible for the configuration of the radio transceiver, the transmission and reception of packets, and the management of errors in communications. When transmitting packets to the radio channel, the Task_phy receives packets from the Task_access and forwards them to the radio transceiver. When receiving packets, the Task_phy reads the packets from the radio transceiver and forwards them to the Task_access. The software of the sensor node has been implemented in C with the ARM Mbed OS open-source Real-Time Operating System.
Figure 10.
Wireless sensor node software architecture based on four inter-related layers (L1–L4): L1 is for the Hardware Abstraction Layer, L2 is for the Real-Time Operating System, L3 is for the drivers to access other devices, and L4 is for the Application Layer.
Figure 10.
Wireless sensor node software architecture based on four inter-related layers (L1–L4): L1 is for the Hardware Abstraction Layer, L2 is for the Real-Time Operating System, L3 is for the drivers to access other devices, and L4 is for the Application Layer.
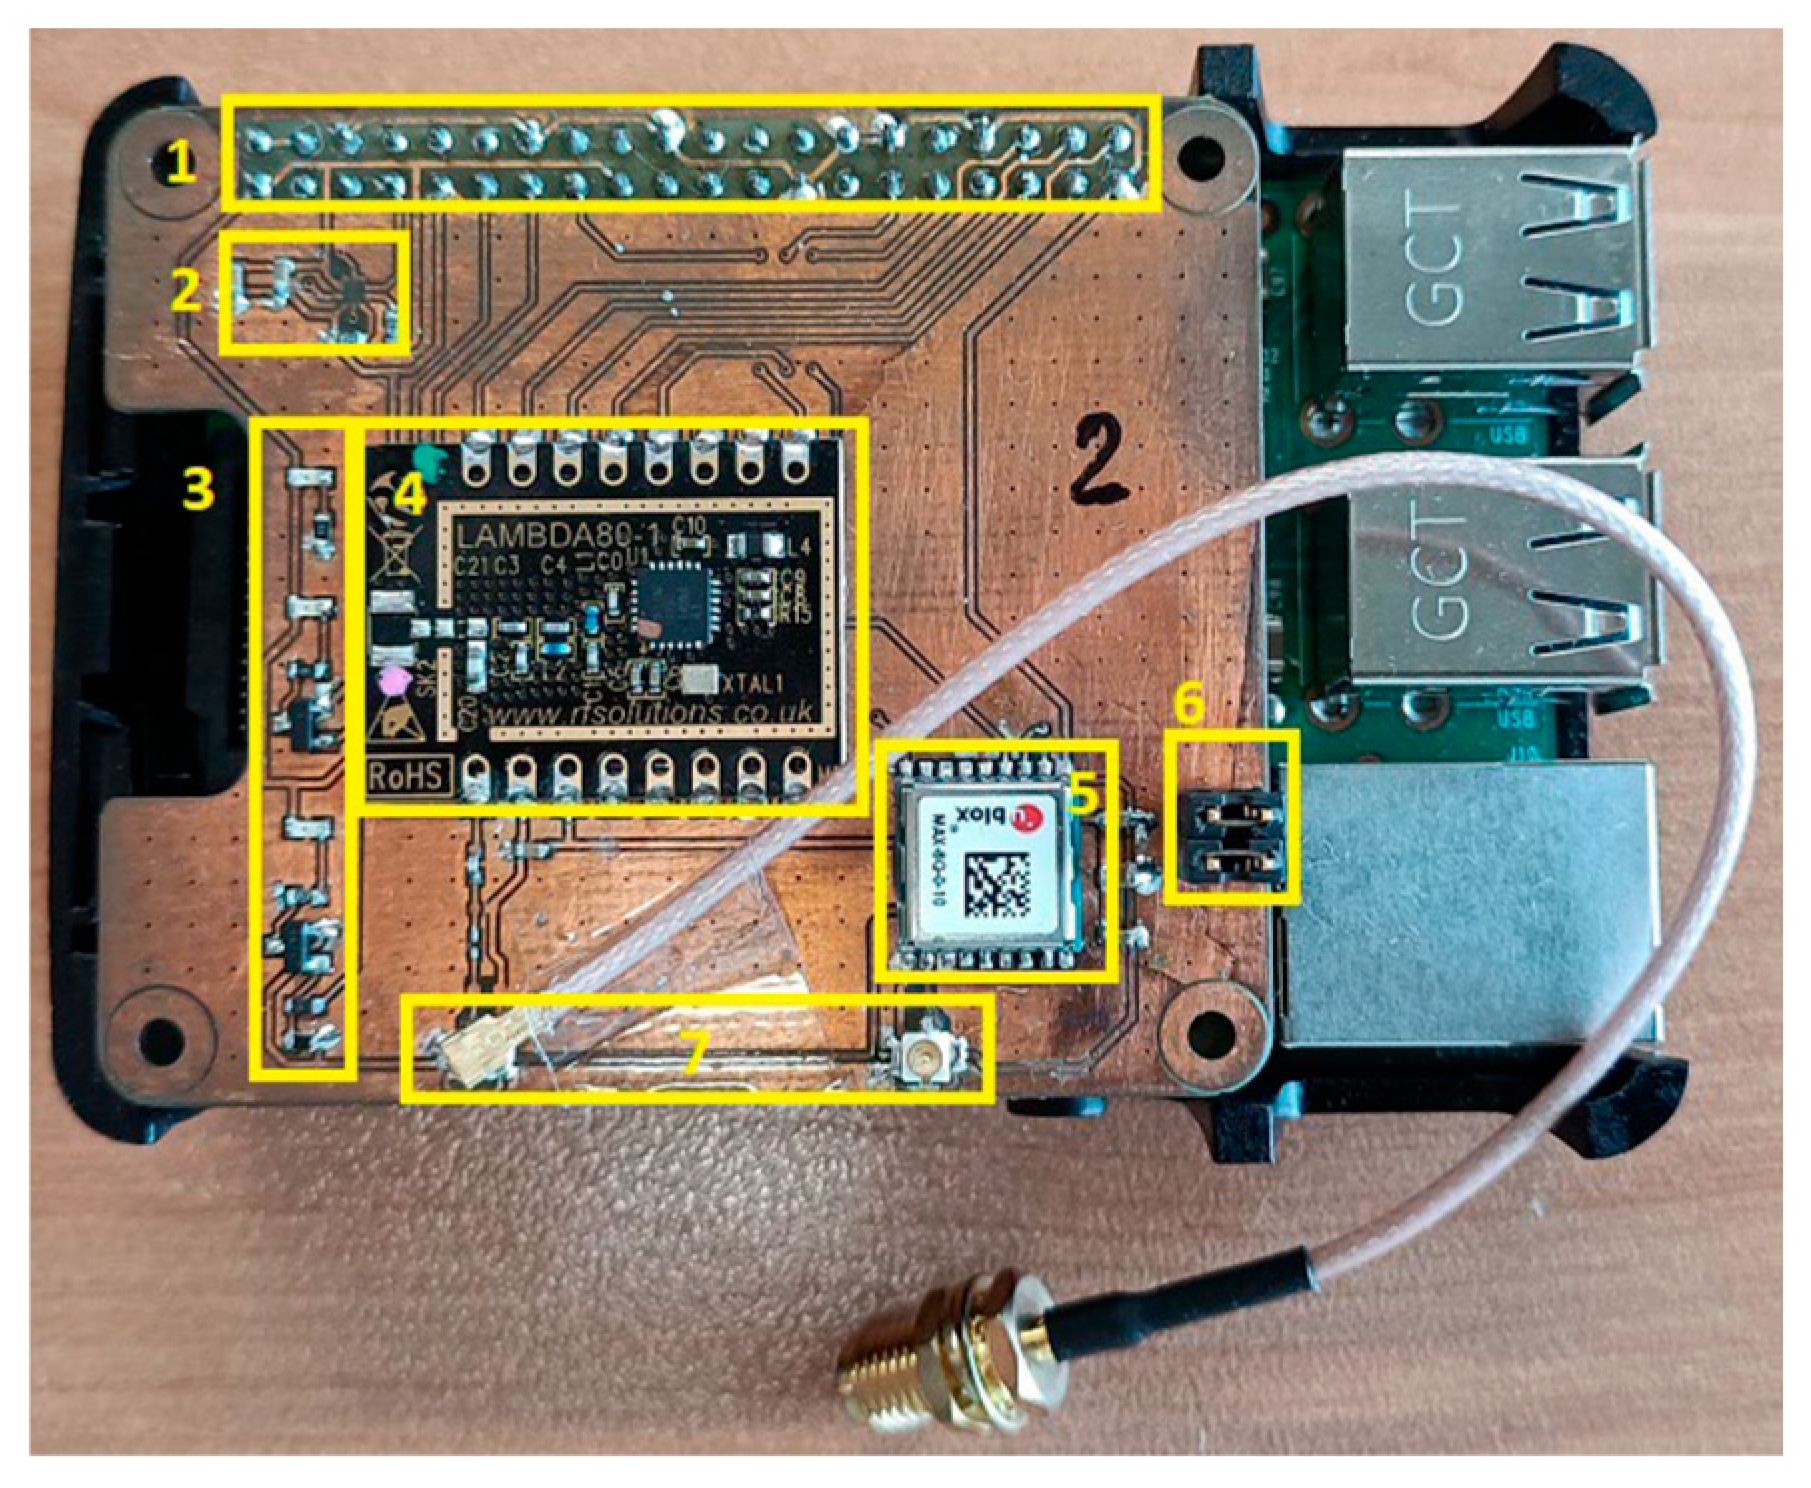
The software architecture of the gateway, depicted in
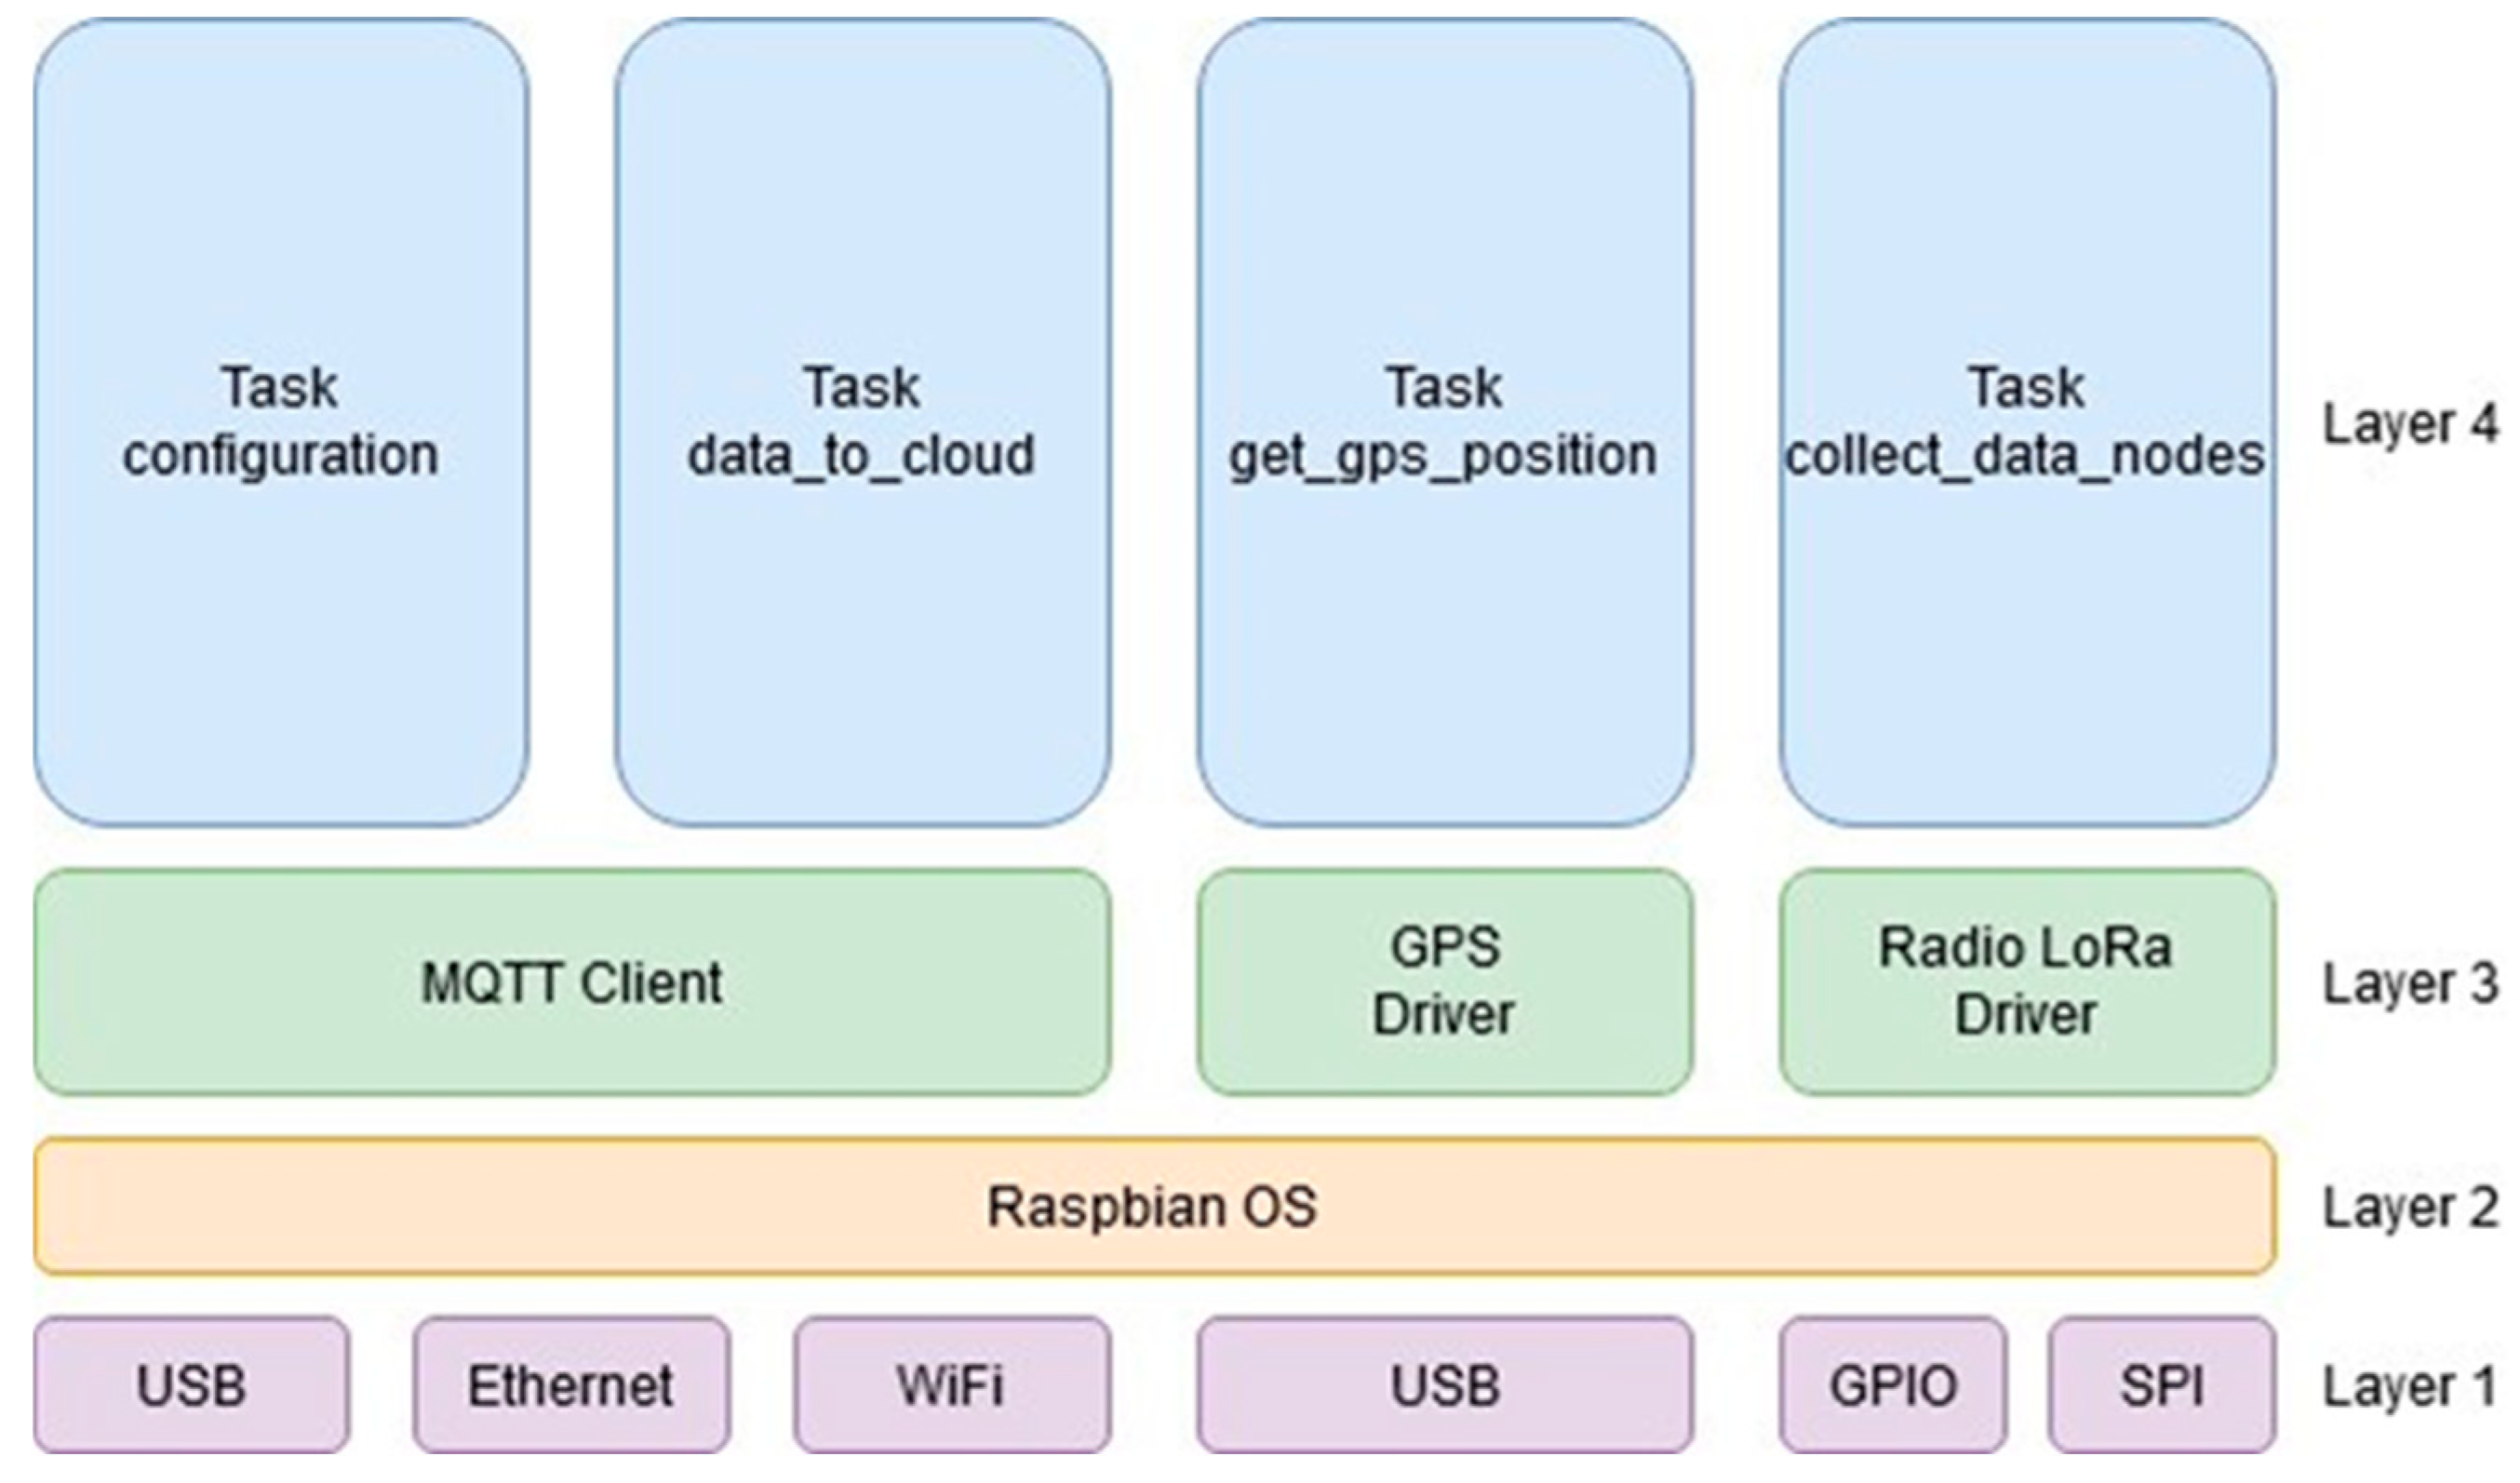
Figure 11, is composed of four interrelated layers. Layer 1 functions as an interface with the different peripherals of the Raspberry PI, i.e., GPIO, USB, Ethernet, Wi-Fi, UART, and SPI. Layer 2 is the Raspbian operating system supported by the Raspberry PI. Layer 3 contains an MQTT client, a GNSS receiver driver, and a LoRa radio transceiver driver. The MQTT client enables the gateway to connect to an MQTT broker, publish messages, and subscribe to topics. The GNSS receiver driver facilitates reading geographical positions provided by another application called gpsd, which is responsible for receiving and decoding the NMEA frames sent by the GNSS receiver. The LoRa radio transceiver driver allows us to configure the radio transceiver and transmit and receive packets. Layer 4 contains four tasks that run in parallel, named Task_configuration, Task_data_to_cloud, Task_get_gps_position, and Task_collect_data_nodes. The functionalities performed by each task are described next.
Task_configuration: this task is responsible for receiving the gateway configuration parameters entered through the front-end user interface. It connects to the MQTT broker and subscribes to the topic config/gateway_id. When a new configuration message is received, this task automatically updates the gateway parameters.
Task_data_to_cloud: this task is responsible for sending measurement data to the Cloud. It connects to the MQTT broker and publishes a new measurement message on the topic measures/gateway_id each time that the Task_collect_data_nodes receive a data packet from a sensor node. The transfer of packets between both tasks is performed through a queue.
Task_get_gps_position: this task oversees reading the geographical coordinates of the gateway sent by the gpsd application. The coordinates are stored in global variables shared with the Task_data_to_cloud. The read and write access to the shared variables is managed with a mutex.
Task_collect_data_nodes: this task oversees collecting measurement data sent by the sensor nodes. It connects to the MQTT broker and subscribes to the topic query/gateway_id. When a new query message is received from the front-end user interface, this task sends a request packet to the sensor nodes and performs the data collection process by following the rules of the MAC layer. When the Task_collect_data_nodes receive a data packet sent by a sensor node, it forwards the data to the Task_data_to_cloud. The code of layer 3 and layer 4 in the gateway software architecture has been implemented in Python.
Figure 11.
Wireless software architecture of the gateway based on four inter-related layers (L1–L4): L1 is for the interface with different peripherals, L2 is for the Raspbian operating system of the Raspberry Pi, L3 is for the MQT client, a GNSS receiver, and a Lora radio transceiver driver, and L4 is for the parallel running tasks.
7. User Interface
For the implementation of the user interface and the database server, we have deployed an Ubuntu 18.04 virtual machine on the Google Cloud platform. In this virtual machine, we have installed the InfluxDB 2.7.10 and the Node-RED software 20.x tools as well as an MQTT broker based on the open-source Mosquitto broker.
InfluxDB is a database manager developed by Influxdata, San Francisco, California, USA that allows for the creation and management of temporary databases. InfluxDB facilitates remote read and write access to database content using SQL and the HTTP protocol. Node-RED3 is a software tool developed by IBM for prototyping, management, and connection of IoT devices in a simple way. It is formed by a canvas, called Flow, where various types of graphically interconnected nodes are placed. It includes different types of nodes with diverse functionalities, such as communications (e.g., MQTT, TCP, UDP, HTTP, etc.), access to databases (e.g., SQL), parsing of data formats (e.g., JSON, YAML, CSV, HTML, etc.), controls for creating user interfaces (e.g., buttons, drop-down lists, temporary charts, maps, etc.), and blocks for creating specific functions designed in JavaScript.
The database server consists of an application implemented with Node-RED and an InfluxDB database. It is allocated on the virtual machine deployed in the Cloud. The Node-RED application contains an MQTT client that connects to the MQTT broker and subscribes to the topic measures/gateway_id. Every time it receives a measurement message sent by the gateway, the Node-RED application extracts the data fields from the message (in JSON format) and sends these data to InfluxDB for storage in the database. The front-end user interface consists of an application implemented with Node-RED. It includes a dashboard for the configuration of the gateway and another dashboard for on-line visualization of measurements collected by the sensor nodes. The front-end user interface contains an MQTT client that connects to the MQTT broker and publishes configuration and query messages on the topics config/gateway_id and que-ry/gateway_id, respectively. The MQTT client of the front-end user interface subscribes to the topic measures/gateway_id to receive measurement messages sent by the gateway.
The configuration dashboard allows for the introduction of several parameters that configure the data collection process and the wireless communications interface of the gateway at 2.4 GHz. The dashboard includes buttons to trigger the transmission of configuration and query messages to the gateway.
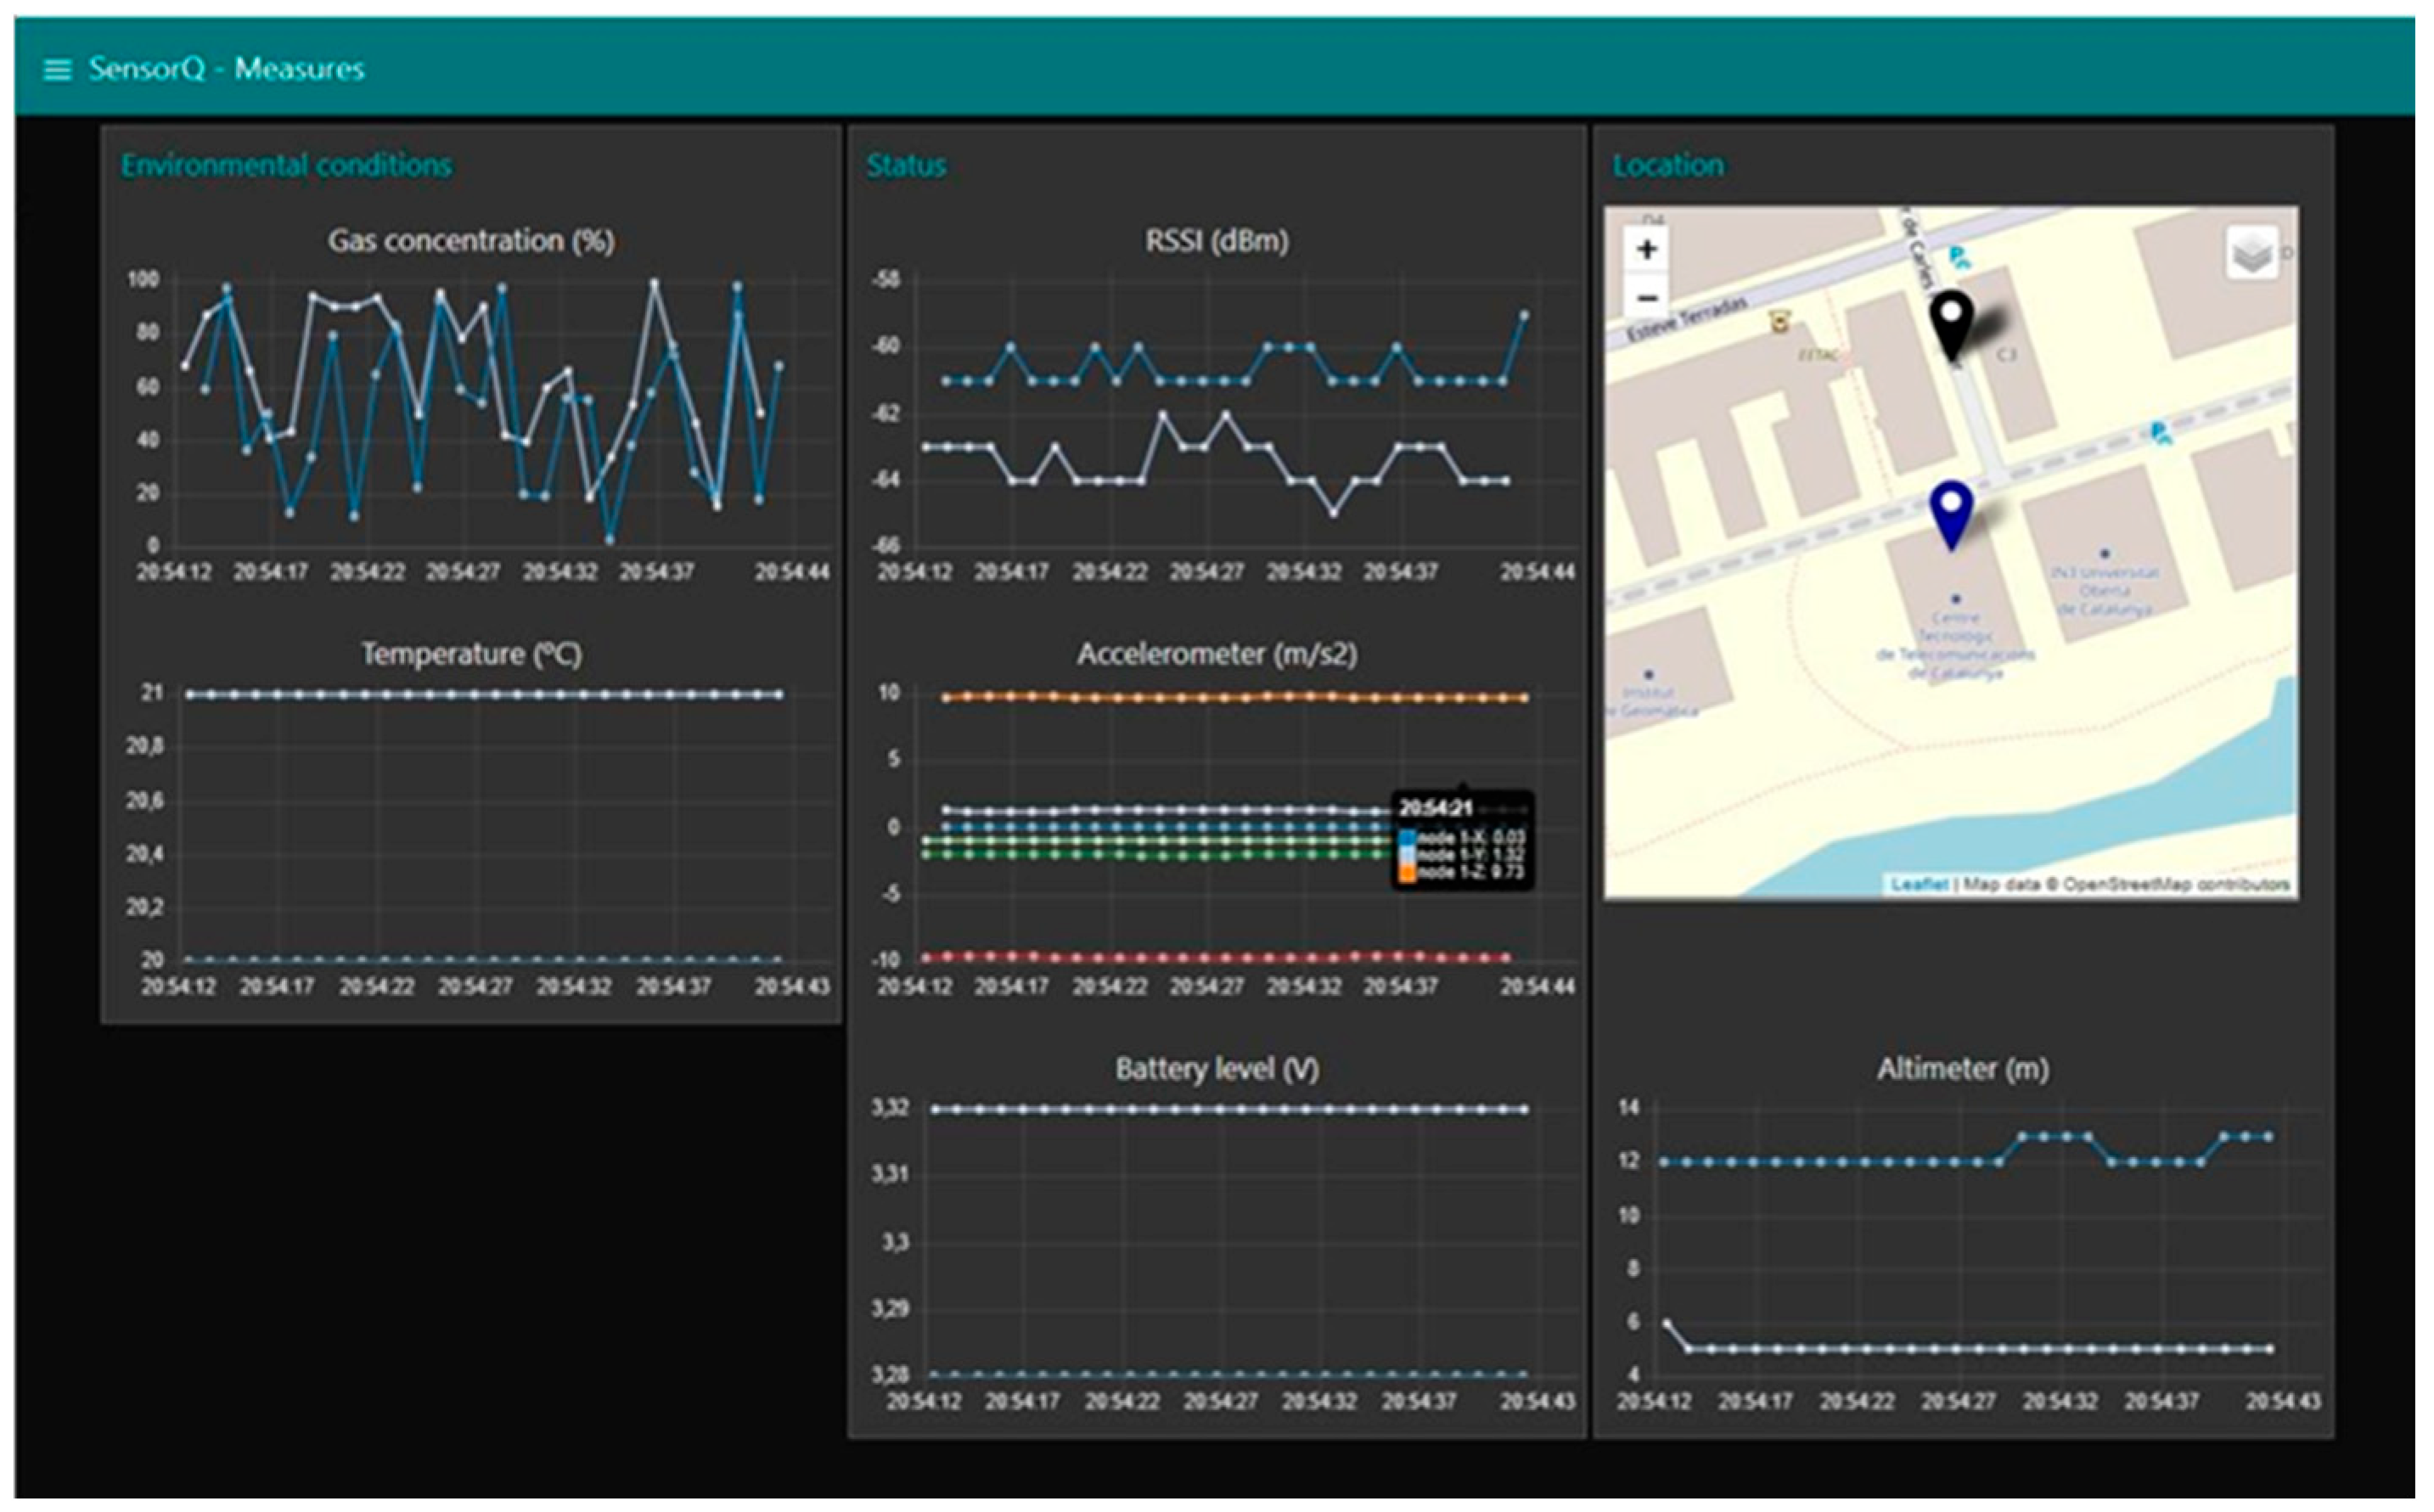
Figure 12 shows a screenshot of the configuration dashboard. The measurements dashboard shows various temporal plots with the measurements collected from sensor nodes. In addition, it shows the geographical position of the gateway and the sensor nodes on an OpenStreetMaps map.
Figure 13 shows a screenshot of the measurements dashboard with data collected from two sensor node prototypes, which include real measurements of the latitude, the longitude, accelerations in the 3 axes, the altitude, the temperature, the battery voltage, and the RSSI. In the screenshot in
Figure 13, the gas concentration levels are random values that were generated by the sensor node prototypes.
8. Results
We have conducted an experimental evaluation of the SensorQ wireless sensor node in a laboratory environment using prototypes of the gateway and sensor nodes. Firstly, we validated and evaluated the performance of the wireless sensor node in terms of data collection time. Then, we validated the operation of the plasmonic sensor by focusing on the intensity (resonance dip) changes observed in the reflected signal when the sensing region was exposed to DMMP. A proof-of-concept study in a laboratory environment was performed involving a highly sensitive Optical Fiber Refractive Index Sensor (OFRIS) supporting the surface plasmon resonance (SPR) effect coated by a material sensitive to DMMP. The experimental results indicate the feasibility of detecting DMMP vapor in the air using the proposed optical sensor head. The proposed wireless sensor node, also called SensorQ, is proposed for the detection of CWAs; herein, we are focused on DMMP as a simulant of Sarin gas. It is important to point out that this type of experimental work involving DMMP has to be carried out in very specific and well-controlled facilities due to the highly toxic nature of the DMMP gas. It requires mobilization and field work of personnel in the special facility, a cell design that fits into the lab equipment, and the engineering of special feedthrough connections to make the experiment feasible and to avoid contamination. The nature of the experiment is an important aspect of the present work that should not be neglected.
8.1. Wireless Communications
The test set-up is composed of ten prototypes of the sensor nodes and one prototype of the gateway. The gateway and the set of sensor nodes are placed on two different tables at an approximate distance of 5 m with clear line of sight between the sensor nodes and the gateway. The gateway is connected to the 4G cellular network of Vodafone in Spain. The database server and the MQTT broker are deployed on the Google Cloud platform. The experiments are controlled from the front-end user interface, which sends a query message to the gateway to trigger a new data collection process from the sensor nodes. When the gateway receives a query message through the 4G interface, the gateway sends a request packet through the 2.4 GHz interface to the sensor nodes. The sensor nodes operate in low-power listening mode, and when they receive a request packet from the gateway, each sensor node contends to transmit measurement data to the gateway. Once a sensor node has successfully transmitted all of its data to the gateway, it goes back to the low-power listening mode, where it remains until the next request packet. The low-power listening mode is configured with a check period of 500 ms and a wake-up interval of 5 ms.
The SX1280 radio transceivers of the gateway and sensor nodes are configured with the LoRa physical layer parameters summarized in
Table 7. The packets are composed of a preamble (eight symbols), a header (eight symbols), a payload (between 1 and 255 bytes), and a 16 bit CRC. The payload contains a MAC header (6 bytes) and several payload fields, which depend on the packet type. The beacon packet contains the slot duration (1 byte) and the number of slots per frame (1 byte) of the frame-slotted ALOHA. The data packet contains the measurement data (22 bytes) that a sensor node sends to the gateway.
To adjust the slot duration to fit one data packet and one ACK packet, we have used the SX1280 calculator tool provided by Semtech to calculate the effective data rates and the time on air for each packet type (i.e., the packet transmission time), which depend on the packet length, the coding rate, the bandwidth, and the spreading factor. In each slot, we have considered a guard time IFS of 100 µs between the data and the ACK packets to compensate for clock drifts and the switching times of the SX1280 radio transceiver between transmission and reception modes (60 µs), and vice versa (45 µs).
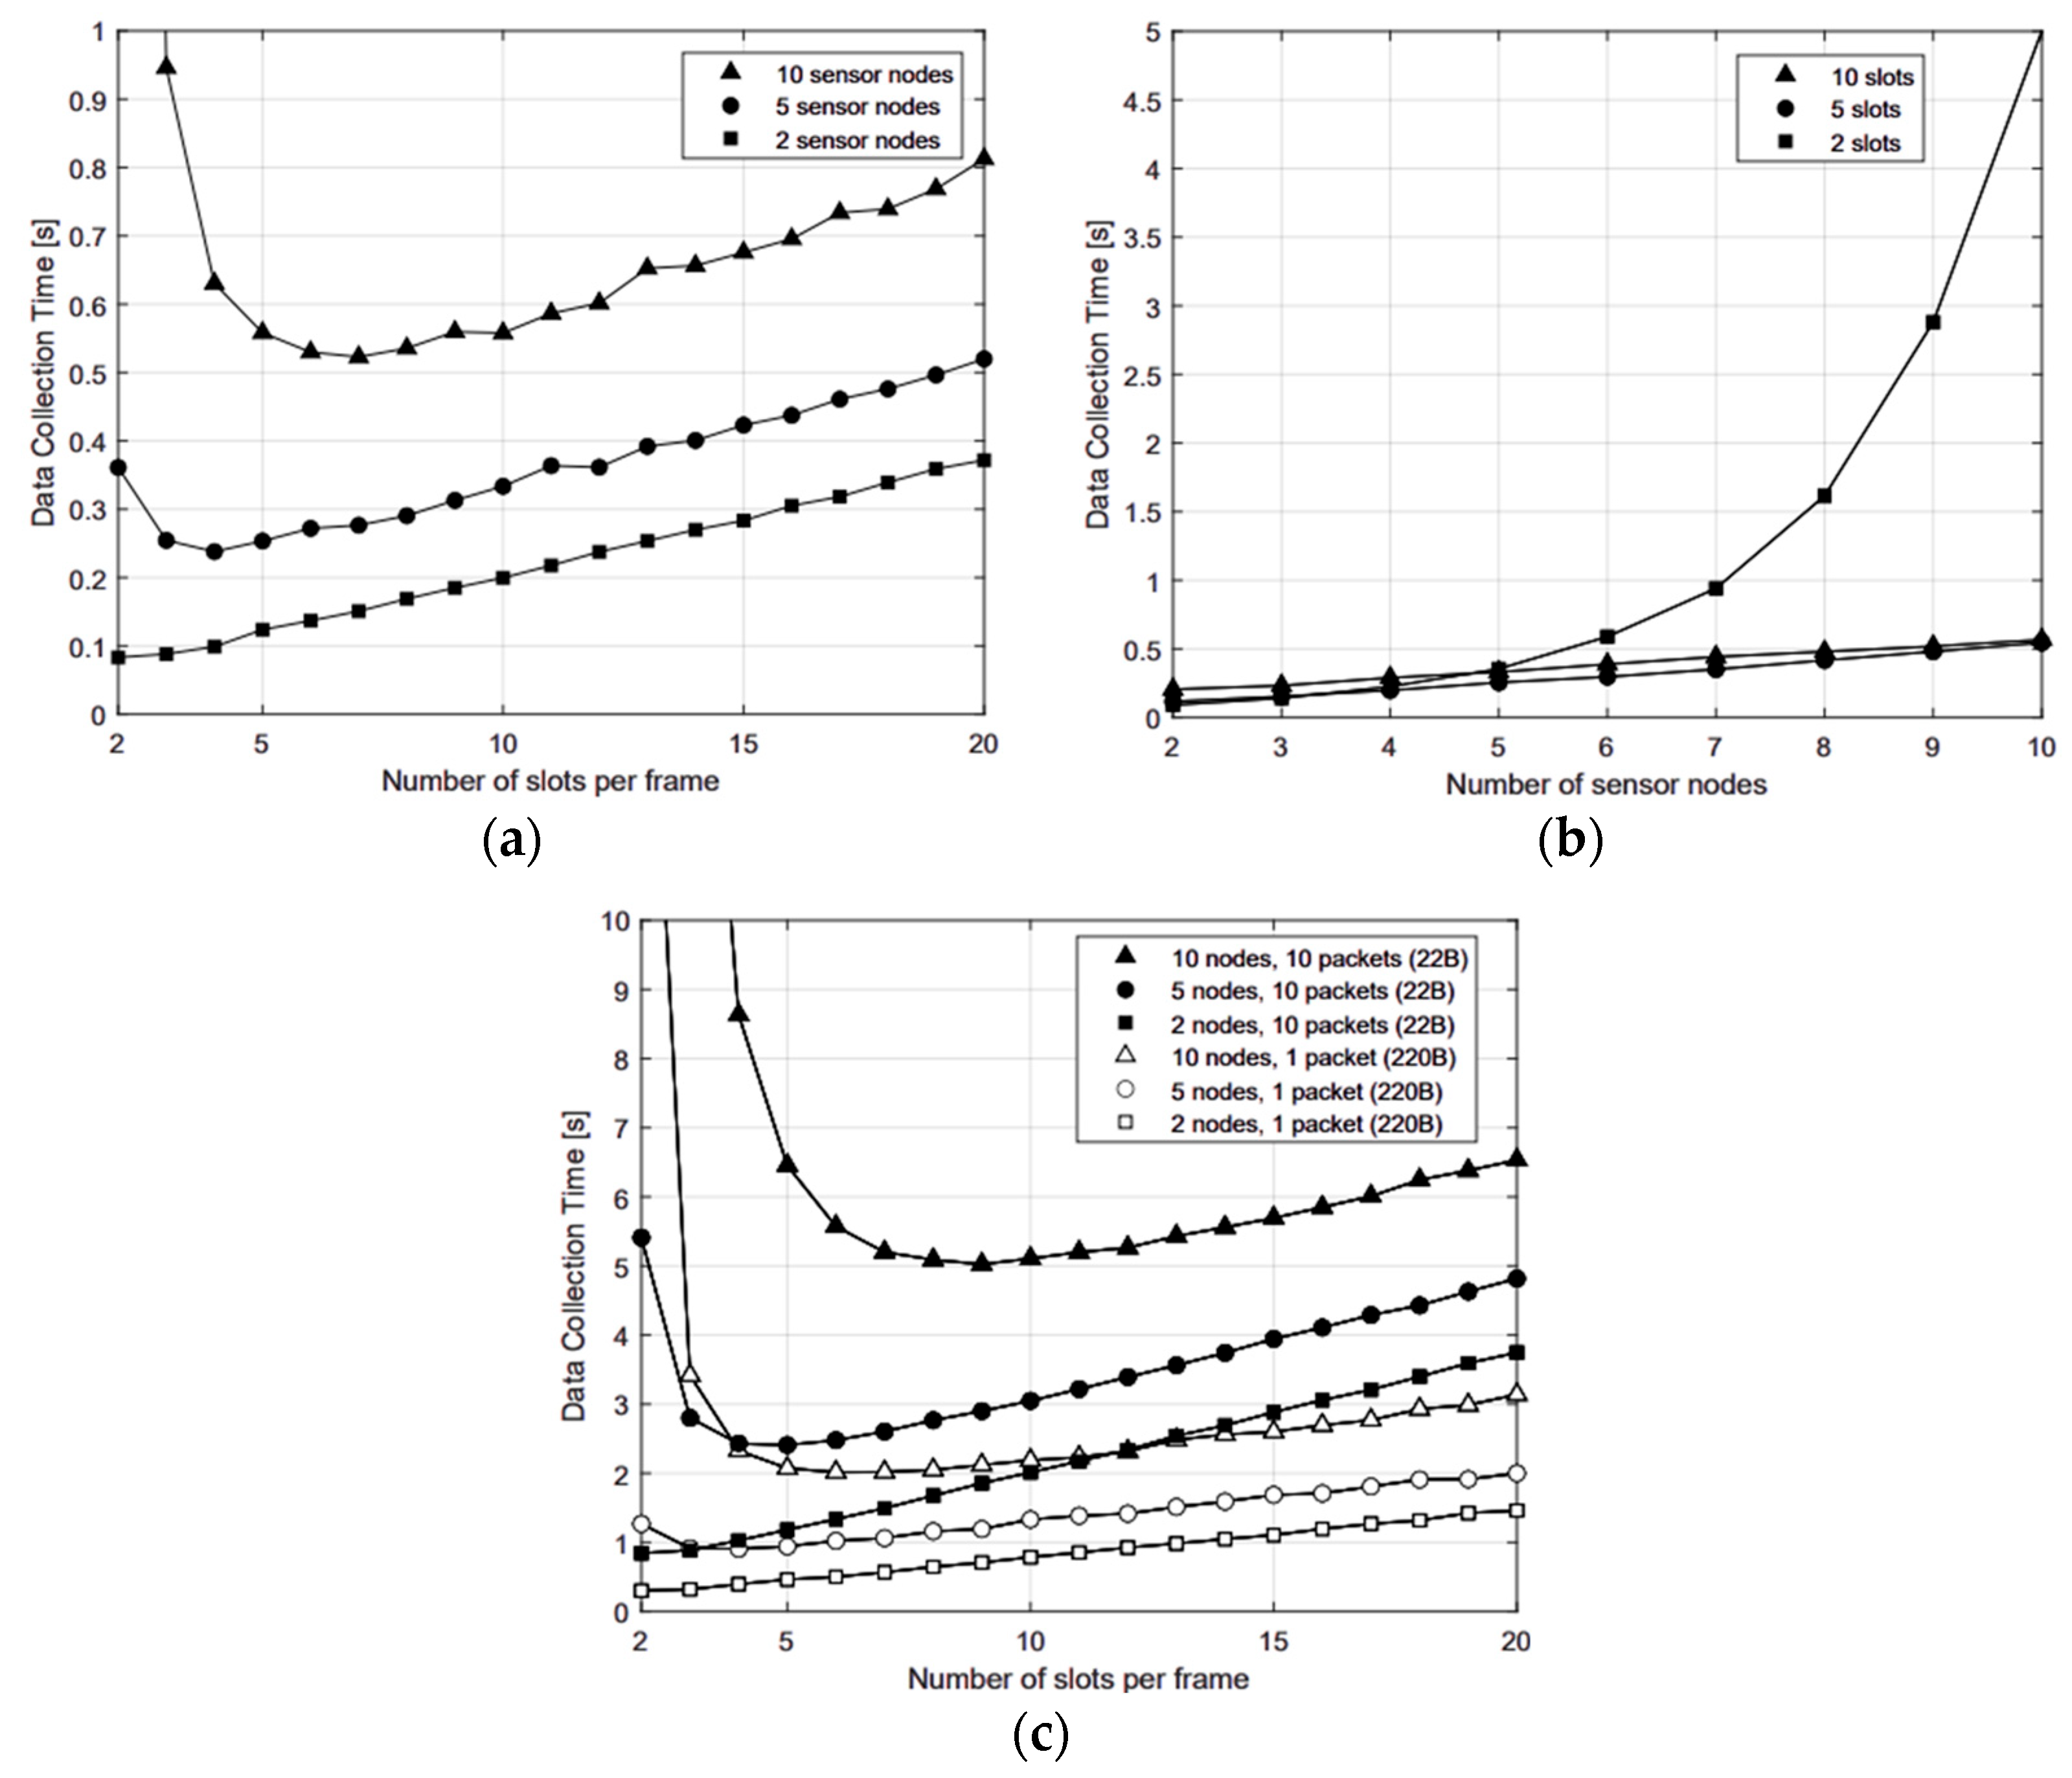
We have performed several experiments to evaluate the data collection time in two different scenarios. Each experiment was repeated 100 times to calculate the average value of the data collection time. In the first scenario, we considered that each sensor node has one single measurement from every sensing device to send to the gateway, which fits into one data packet of 22 bytes. In the second scenario, we considered that each sensor node has ten measurements (220 bytes) to send to the gateway, which can be fragmented into ten data packets of 22 bytes or encapsulated in one data packet of 220 bytes. In the first scenario, each sensor node sends one data packet of 22 bytes every time that the gateway sends a request to the sensor nodes. The average data collection time for this scenario is represented in
Figure 14a as a function of the number of slots per frame (from 2 to 20 slots) considering 2, 5, and 10 sensor nodes and a spreading factor of six. The results in
Figure 14a show that the data collection time has a minimum value at a certain number of slots per frame, which represents the optimal point of operation. The minimum value can be found when the number of slots per frame is close to the number of sensor nodes that transmit data to the gateway. Therefore, the number of slots must be adjusted according to the expected number of sensor nodes that exist within the coverage area of the gateway in order to minimize the data collection time. If we assume that the average number of sensor nodes per unit area is known (nodes/km
2), and we also know the radius of the surfaces covered by the UAV gateway flying at different heights, then the number of sensor nodes can be easily estimated, and thus the number of slots per frame can be adjusted by the gateway.
As it can be observed, when the number of slots is below the optimum, the data collection time rapidly increases. Indeed, the shorter the number of slots, the higher the probability of collision, the more frames needed to complete the data collection process, and thus the higher the data collection time. When the number of slots per frame increases above the optimum, the data collection time increases almost linearly with the number of slots. Indeed, although the average number of frames needed to complete a data collection process may tend to a constant value when the number of slots increases, a higher number of slots per frame leads the gateway to listen during longer data packets of 22 bytes (or one data packet of 220 bytes). All of the results are presented for SF-6 time periods in each frame yielding greater data collection time and optimized energy consumed by the gateway.
The average data collection time is represented in
Figure 14b as a function of the number of sensor nodes (from 2 to 10 sensor nodes) considering 2, 5, and 10 slots per frame and a spreading factor of six. As it can be observed, the data collection time increases with the increasing number of sensor nodes. Indeed, the larger the number of sensor nodes, the higher the probability of collision, and thus the greater the data collection time. This occurs especially when the number of slots is below the optimum point of operation of the protocol. For example, with two slots per frame, the data collection time rapidly increases when the number of sensor nodes is above five. In the second scenario, each sensor node has ten measurements (220 bytes) stored in memory every time that the gateway requests new measurements to the sensor nodes. We have considered two different strategies to send these 220 bytes, as follows: (i) fragmented, in which each sensor node sends 10 data packets of 22 bytes to the gateway, and (ii) non-fragmented, in which each sensor node sends one single data packet of 220 bytes to the gateway. The average data collection time is represented in
Figure 14c for both strategies as a function of the number of slots per frame (from 2 to 20 slots) considering 2, 5, and 10 sensor nodes and a spreading factor of six.
As it can be observed, the data collection time is longer when data are fragmented into 10 data packets of 22 bytes. This is because the number of frames needed to resolve the contention with multiple data packets is much higher than when only one data packet of 220 bytes is sent by each sensor node. The results show that there is also an optimum number of contention slots per frame that minimizes the data collection time with both strategies. Again, the minimum data collection time can be found when the number of slots per frame is very close to the number of sensor nodes that transmit data to the gateway, regardless of the number of data packets to be sent.
If the number of slots per frame is above that optimum number, then the data collection time increases linearly, and it is faster when data are fragmented into 10 data packets of 22 bytes. This is because the number of frames is much higher when data are fragmented. Consequently, to minimize the data collection time, if the sensor nodes must periodically acquire and store several measurements in memory before the gateway sends a request, the measurement data in each sensor node should be encapsulated in long data packets instead of using fragmentation into short packets. The duration of the slots of frame-slotted ALOHA will be enlarged accordingly to fit longer data packets.
8.2. Sensor Head Results
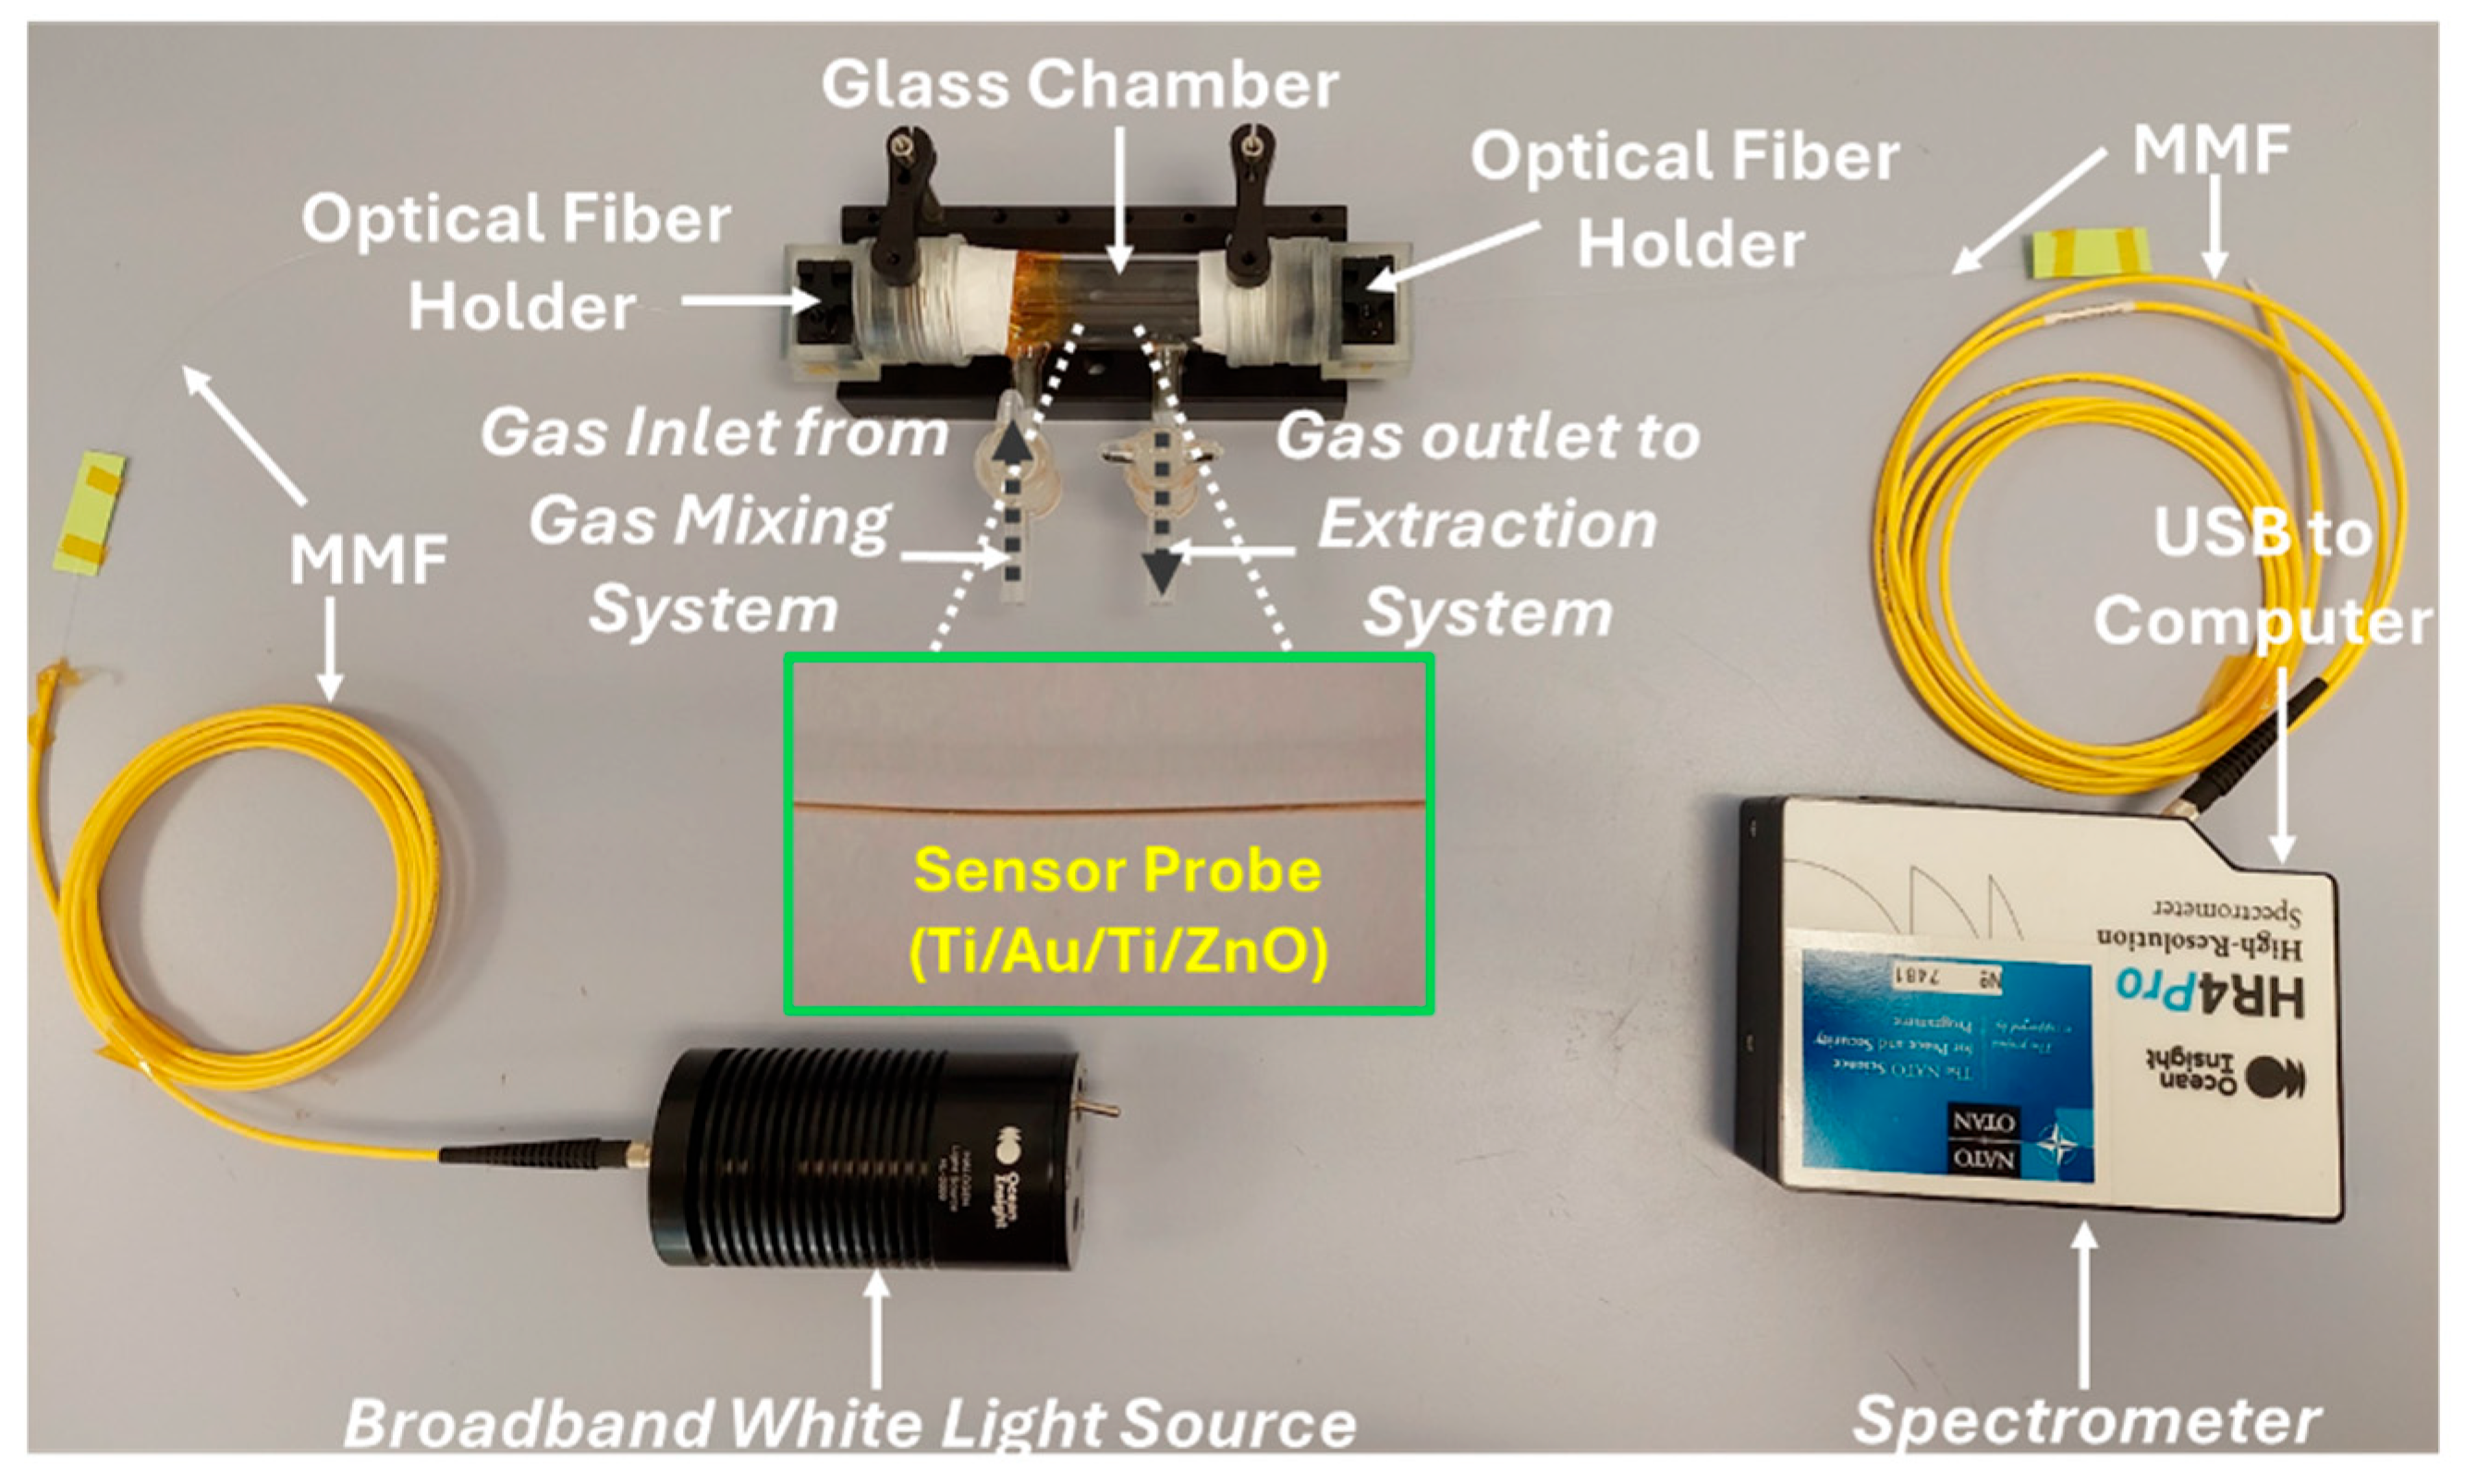
A schematic of the experimental setup is shown in
Figure 15. After fabricating the SPR sensor probe, it was fixed into the gas chamber for testing, which has an incorporated gas inlet and outlet. For our gas-sensing experiment, we used the gas-mixing system available at the chemical defense department of INTA “La Marañosa” in Madrid, Spain. Unpolarized light from a tungsten–halogen lamp (HL-2000-HP), and spectrometer (HR4PRO-XR-ES), both from Ocean Insight, Orlando, Florida, USA. was launched into the input end of the fiber, which is connected to the patch cord of the MMF. The spectrum of the transmitted power at the other end of the fiber was recorded using a spectrometer (HR4Pro, Ocean Insight) interfaced with a computer. To study the performance of the sensor, the reference spectrum was recorded first using the spectrometer software (OceanView version 2.0.15—EZ, Ocean Insight, Orlando, FL, USA).
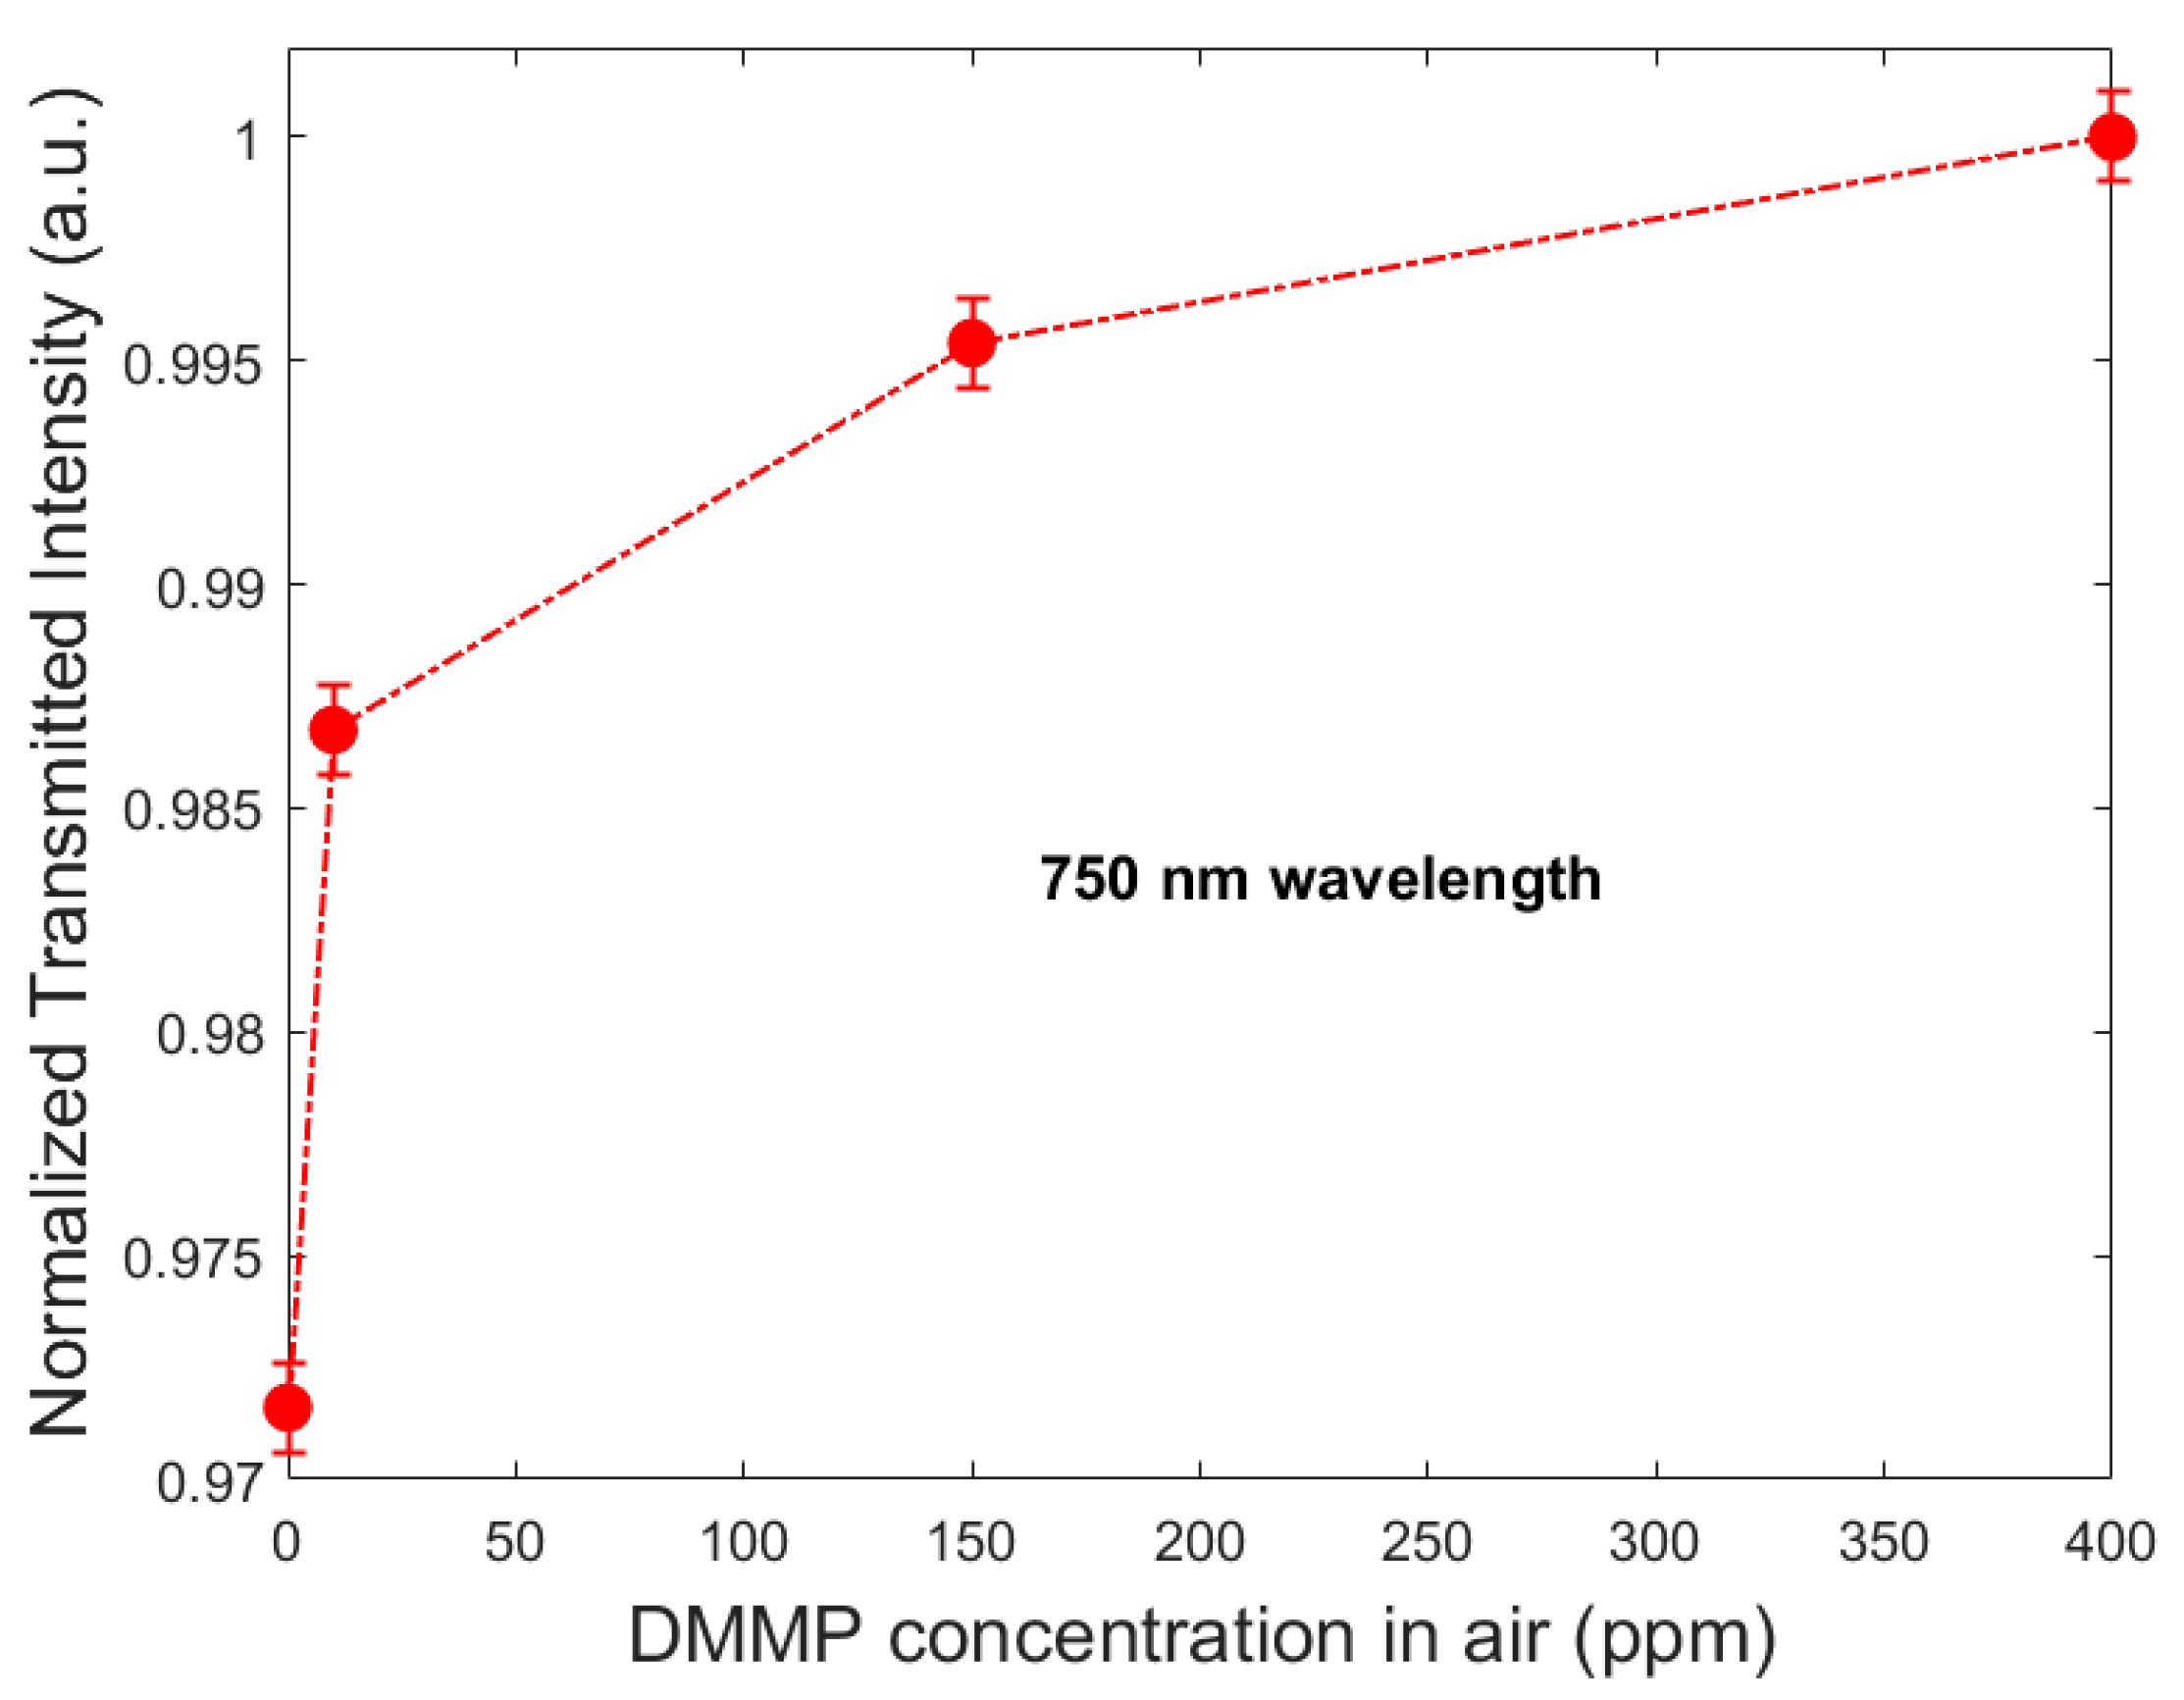
All spectra taken in the present study for different DMMP concentrations in the air were recorded relative to this reference. We used four different DMMP concentrations mixed into the air, starting from 0, 10, 150, and 400 ppm of DMMP.
In this study, we recorded changes in the transmitted spectra with respect to different concentrations of DMMP mixed in the air. We then calculated the transmitted power at a wavelength of 750 nm for various concentrations of DMPP mixed in the air.
Figure 16 shows that as the concentration changes, the transmitted power also changes due to the interaction of DMPP with the sensing layer. It appears that while the real part of the dielectric constant of the ZnO layer remains unchanged, the imaginary part changes rapidly, resulting in no shift in the resonance wavelength but a continuous decrease in the transmitted power over time. In other words, the absorption of light at a wavelength of 750 nm increases with the increasing DMMP concentration. Our paper aims to demonstrate that this type of sensor has potential applications for DMMP detection. Therefore, we have not provided a detailed characterization of the fiber optic sensor. However, the results presented in this paper indicate that this sensor has significant potential for the detection of DMMP and thus Sarin gas. The sensitivity of this type of sensor can be greatly enhanced if the operation wavelength is set to the near-infrared region near 1.5 μm [
43,
56], where low-cost and compact laser sources or even LEDs are widely available.
