Article

NaBH4-Mediated Co-Reduction Synthesis of Glutathione Stabilized Gold/Silver Nanoclusters for Detection of Magnesium Ions

1
School of Geographic and Biologic Information, Nanjing University of Posts and Telecommunications, Nanjing 210023, China
2
State Key Laboratory for Organic Electronics and Information Displays, Jiangsu Key Laboratory for Biosensors, Institute of Advanced Materials (IAM), Jiangsu National Synergetic Innovation Center for Advanced Materials (SICAM), Nanjing University of Posts & Telecommunications, Nanjing 210023, China
*
Author to whom correspondence should be addressed.
Chemosensors 2023, 11(8), 435; https://doi.org/10.3390/chemosensors11080435
Submission received: 13 July 2023 / Revised: 1 August 2023 / Accepted: 4 August 2023 / Published: 5 August 2023

Abstract

:
The content of magnesium ions (Mg2+) in drinking water is relatively high and the excessive Mg2+ ingestion may lead to pathological lesions in the human body system. At present, the detection of Mg2+ still relies on costly devices or/and complex organic fluorescence probes. To solve this problem, this work proposed a NaBH4-mediated co-reduction strategy for the synthesis of glutathione-stabilized bimetallic AuAg nanoclusters (GSH@AuAg NCs) with performance recognition to Mg2+. The preparation of GSH@AuAg NCs was simple and rapid and could be performed at mild conditions. The reaction parameters and sampling orders were optimized to understand the formation mechanism of GSH@AuAg NCs. The GSH@AuAg NCs exhibited a sensitive “light on” fluorescence response to Mg2+ due to the re-molding of the interfacial physicochemical environment following the Mg2+ coordination, which affected the surface charge transfer process, and thus led to a novel method for fluorescence detection of Mg2+ with admirable selectivity for Mg2+. The proposed method showed a detection limit of 0.2 μM, and its practical utility for the detection of Mg2+ in a real sample of purified drinking water was also demonstrated, confirming its practicability in monitoring the Mg2+ concentration in drinking water.

1. Introduction

Quantum-sized metal nanoclusters (MNCs) that only contain a few dozen atoms possess plenteous optical properties, such as outstanding fluorescence, size-dependent fluorescence, and ligand-tunable fluorescence, and thus hold great promise in fluorescent sensing applications [1,2,3,4,5]. Among MNCs, bio-liganded Au and Ag NCs prepared by easy one-pot synthesis have received the most attention due to their intrinsic luminescence properties [5,6,7,8]. To obtain the nanoclusters with superior stable and strong fluorescence, different bio-ligands such as peptides, proteins, and DNA, etc., have been used as the protective shell to wrap the core of metal atoms [8,9,10]. Besides, glutathione (GSH, l-γ-glutamyl-l-cysteinyl-glycine) containing one thiol (-SH) and two carboxyl (-COOH) functional groups has been considered as the most adopted stabilizer since it can protect nanoclusters more efficiently [9,10]. However, GSH-capped Au and Ag NCs still have some problems in practical applications, which are caused by low quantum yields (QYs) and less-than-perfect photon stability [10,11]. To solve these problems, some proteins with large cavity and abundant functional groups have been combined with GSH to act as protective ligands [11]. Extra efforts have also been invested in the preparation of Au/Ag bimetallic NCs (AuAg NCs). The Au and Ag can be easily mingled without changing the lattice parameter of AuAg NCs due to their similar sizes to the Femi wavelength of an electron (0.7 nm). In addition, the interaction of Au and Ag can modify the electronic structure of alloy, surface composition, and deficiency, sharing distinct advantages of highly enhanced fluorescence and photon-stability over monometallic nanoclusters as the synergetic effect [11,12,13]. In this work, a NaBH4-mediated co-reduction strategy was proposed for the synthesis of GSH@AuAg NCs with excellent fluorescence properties.
To prepare GSH@AuAg NCs, an appropriate chemical environment must be provided to match the assembly of GSH ligand and Au and Ag precursors, which inevitably brings rigor-reactive conditions such as strong alkali, high temperature, and prolonged reaction time [11,14]. Hence, there is a particular need to provide a simple and rapid method for GSH@AgAu NCs synthesis. Considering the mild conditions of NaBH4 reduction for obtaining Au and Ag NCs [15], a one-pot synthesis method by simply mixing of certain proportion of AuCl4− and Ag+ with GSH, and then NaBH4, was developed (Scheme 1A), which could form GSH@AgAuNCs with strong fluorescent emission within a matter of minutes. Moreover, the GSH@AgAuNCs showed a sensitive “turn-on” fluorescence response to magnesium ions (Mg2+) (Scheme 1B), thus providing a simple method for Mg2+ detection.
Mg2+ is the most abundant intracellular divalent cation and plays a significant physiological role in numerous cellular processes [16]. Moreover, excessive Mg2+ ingestion may lead to pathological lesions in the cardiovascular, nervous, urinary, and hematopoietic systems [17,18]. However, most methods for detecting Mg2+ still need expensive instrumentations, such as atomic absorption spectroscopy (AAS) and inductively coupled plasma-mass spectrometry (ICP-MS), and complex organic fluorescent probes [18,19,20]. It is valuable to design a simpler and more readily applicable sensor for Mg2+. This work provided a mild and easy preparation method for GSH@AgAuNCs with admirable sensitivity and selectivity for fluorescent detection of Mg2+ ions. The practical utility of GSH@AgAuNCs in monitoring the Mg2+ in a real sample of drinking water was also demonstrated.

2. Materials and Methods

2.1. Materials and Reagents

Silver nitrate (AgNO3), glutathione (GSH), and sodium borohydride (NaBH4) were purchased from Sigma-Aldrich (Shanghai, China). Chloroauric acid (HAuCl4) was obtained from Energy Chemical Co., Ltd. (Shanghai, China). Sodium hydroxide (NaOH) and other metal salts were products of Shanghai Aladdin Biochemical Technology Co., Ltd.(Shanghai, China) Tyrosine (Try), arginine (Arg), lysine (Lys), proline (Pro), glycine (Gly), phenylalanine (Phe), histidine (His), aspartate (Asp), glucose (Glu), and cysteine (Cys). K+, Na+, Ca2+, Mg2+, Cr3+, Cu2+, Zn2+, Ni2+, Co2+, Cd2+, Mn2+, Zr4+, Al3+, Fe2+, and Fe3+ solutions were prepared with KCl, NaCl, CaCl2∙2H2O, MgCl2, CrCl3, CuCl2·2H2O, ZnCl2, NiSO4∙6H2O, CoCl2∙6H2O, CdCl2∙5H2O, MnCl2∙4H2O, AlCl3∙6H2O, FeSO4∙7H2O, and FeCl3∙6H2O, respectively. All reagents were of analytical reagent grade and used as received without further purification. Ultrapure water with a resistivity of 18.2 MΩ·cm−1 obtained from a Millipore purification system was used for the experiments.

2.2. Characterization

Fluorescence spectra were recorded on a FluoroMax Plus spectrophotometer (Shi madzu, Kyoto, Japan). The UV-vis-NIR absorption spectra were recorded on a UV-3600 spectrophotometer (Shimadzu, Kyoto, Japan). Transmission electron microscopic (TEM) images were collected with a JEM-2100 transmission electron microscope (JEOL Ltd., Tokyo, Japan). The morphologies and structures of GSH@AuAg NCs were characterized by high-resolution TEM (HRTEM) (FEI Talos F200X). Fluorescence lifetimes of GSH@AuAg NCs were collected by an Edinburgh FLS920 spectrofluorometer (Edinburgh, Livington, England). X-ray photoelectron spectroscopy (XPS) was performed on PHI 5000 VersaProbe with A1 Kα (hυ = 1486.6 eV) X-ray source (Ulvac-Phi, Chigasaki, Japan).
The samples used for the TEM and AFM characterization were prepared as follows. For the TEM analysis, the copper wire mesh was dipped into a solution of freshly prepared GSH@AuAg NCs and then naturally dried after removal. For AFM sampling, a solution of freshly prepared GSH@AuAg NCs was deposited on the surface of a clean mica sheet. After being rapidly dried in air, they were imaged by AFM. In addition, purified GSH@AuAg NCs were used for XPS and FTIR spectral analysis. The actual photographs were taken with a digital camera under daylight. Fluorescence photographs of GSH@AuAg NCs were obtained with UV light by a Tanon MINI Space 1000 gel imager.

2.3. Synthesis of GSH@AuAg NCs

Firstly, 50 μL HAuCl4 (10 mM) was added to 758 μL ultrapure water in a 1.5 mL centrifuge tube and mixed with 50 μL AgNO3 (10 mM) to form flocculent precipitation. After stirring vigorously for 1 min, 50 μL GSH (20 mM) was added under vigorous stirring at room temperature for 5 min. Seventy-five μL NaBH4 (1 mM) dissolved in 0.25 M NaOH was then add to the mixture under ice water. Finally, 17 μL NaOH (0.25 M) was added to adjust the pH to 7.5. The GSH@AuAg NCs could be formed within 15 min at room temperature (25 °C), which were washed using an Amicon Ultra-15 centrifugal filter with a molecular weight cutoff of 10 kDa (Merck Millipore, Billerica, MA, USA), and then suspended in 1 mL of ultrapure water and reserved at 4 °C.

2.4. Selective and Sensitive Detection of Mg2+

After 100 μL GSH@AuAg NCs dispersion was diluted with 200 μL ultrapure water and added with 5.0 μL Mg2+ solution or sample to incubate at room temperature for 5 min, the fluorescent emission spectrum was recorded at the excitation wavelength of 468 nm.
The selectivity of the proposed method was in terms of fluorescence intensity variation of GSH@AuAg NCs in the presence of metal ions (Mg2+, Ca2+, Na+, K+, Al3+, Zr4+, Zn2+, Mn2+, Cd2+, Cr3+, Fe2+, Fe3+, Co2+, Ni2+, Cu2+). One hundred μL GSH@AuAg NCs dispersion was diluted with 200 μL ultrapure water and then added with 50 μM metal ions (final concentration) to incubate at room temperature for 5 min, and the fluorescent emission spectra were recorded at the excitation wavelength of 468 nm.
To detect Mg2+ in purified drinking water, 100 μL of GSH@AuAg NCs were mixed with 200 μL purified drinking water which was taken from the C’est bon bottled purified drinking water. Then, three sets of specific concentrations of Mg2+ were mixed with the resulting solution and the resulting solution was incubated at room temperature for 5 min. Finally, the content of Mg2+ in purified drinking water was calculated by emission spectra.

3. Results and Discussion

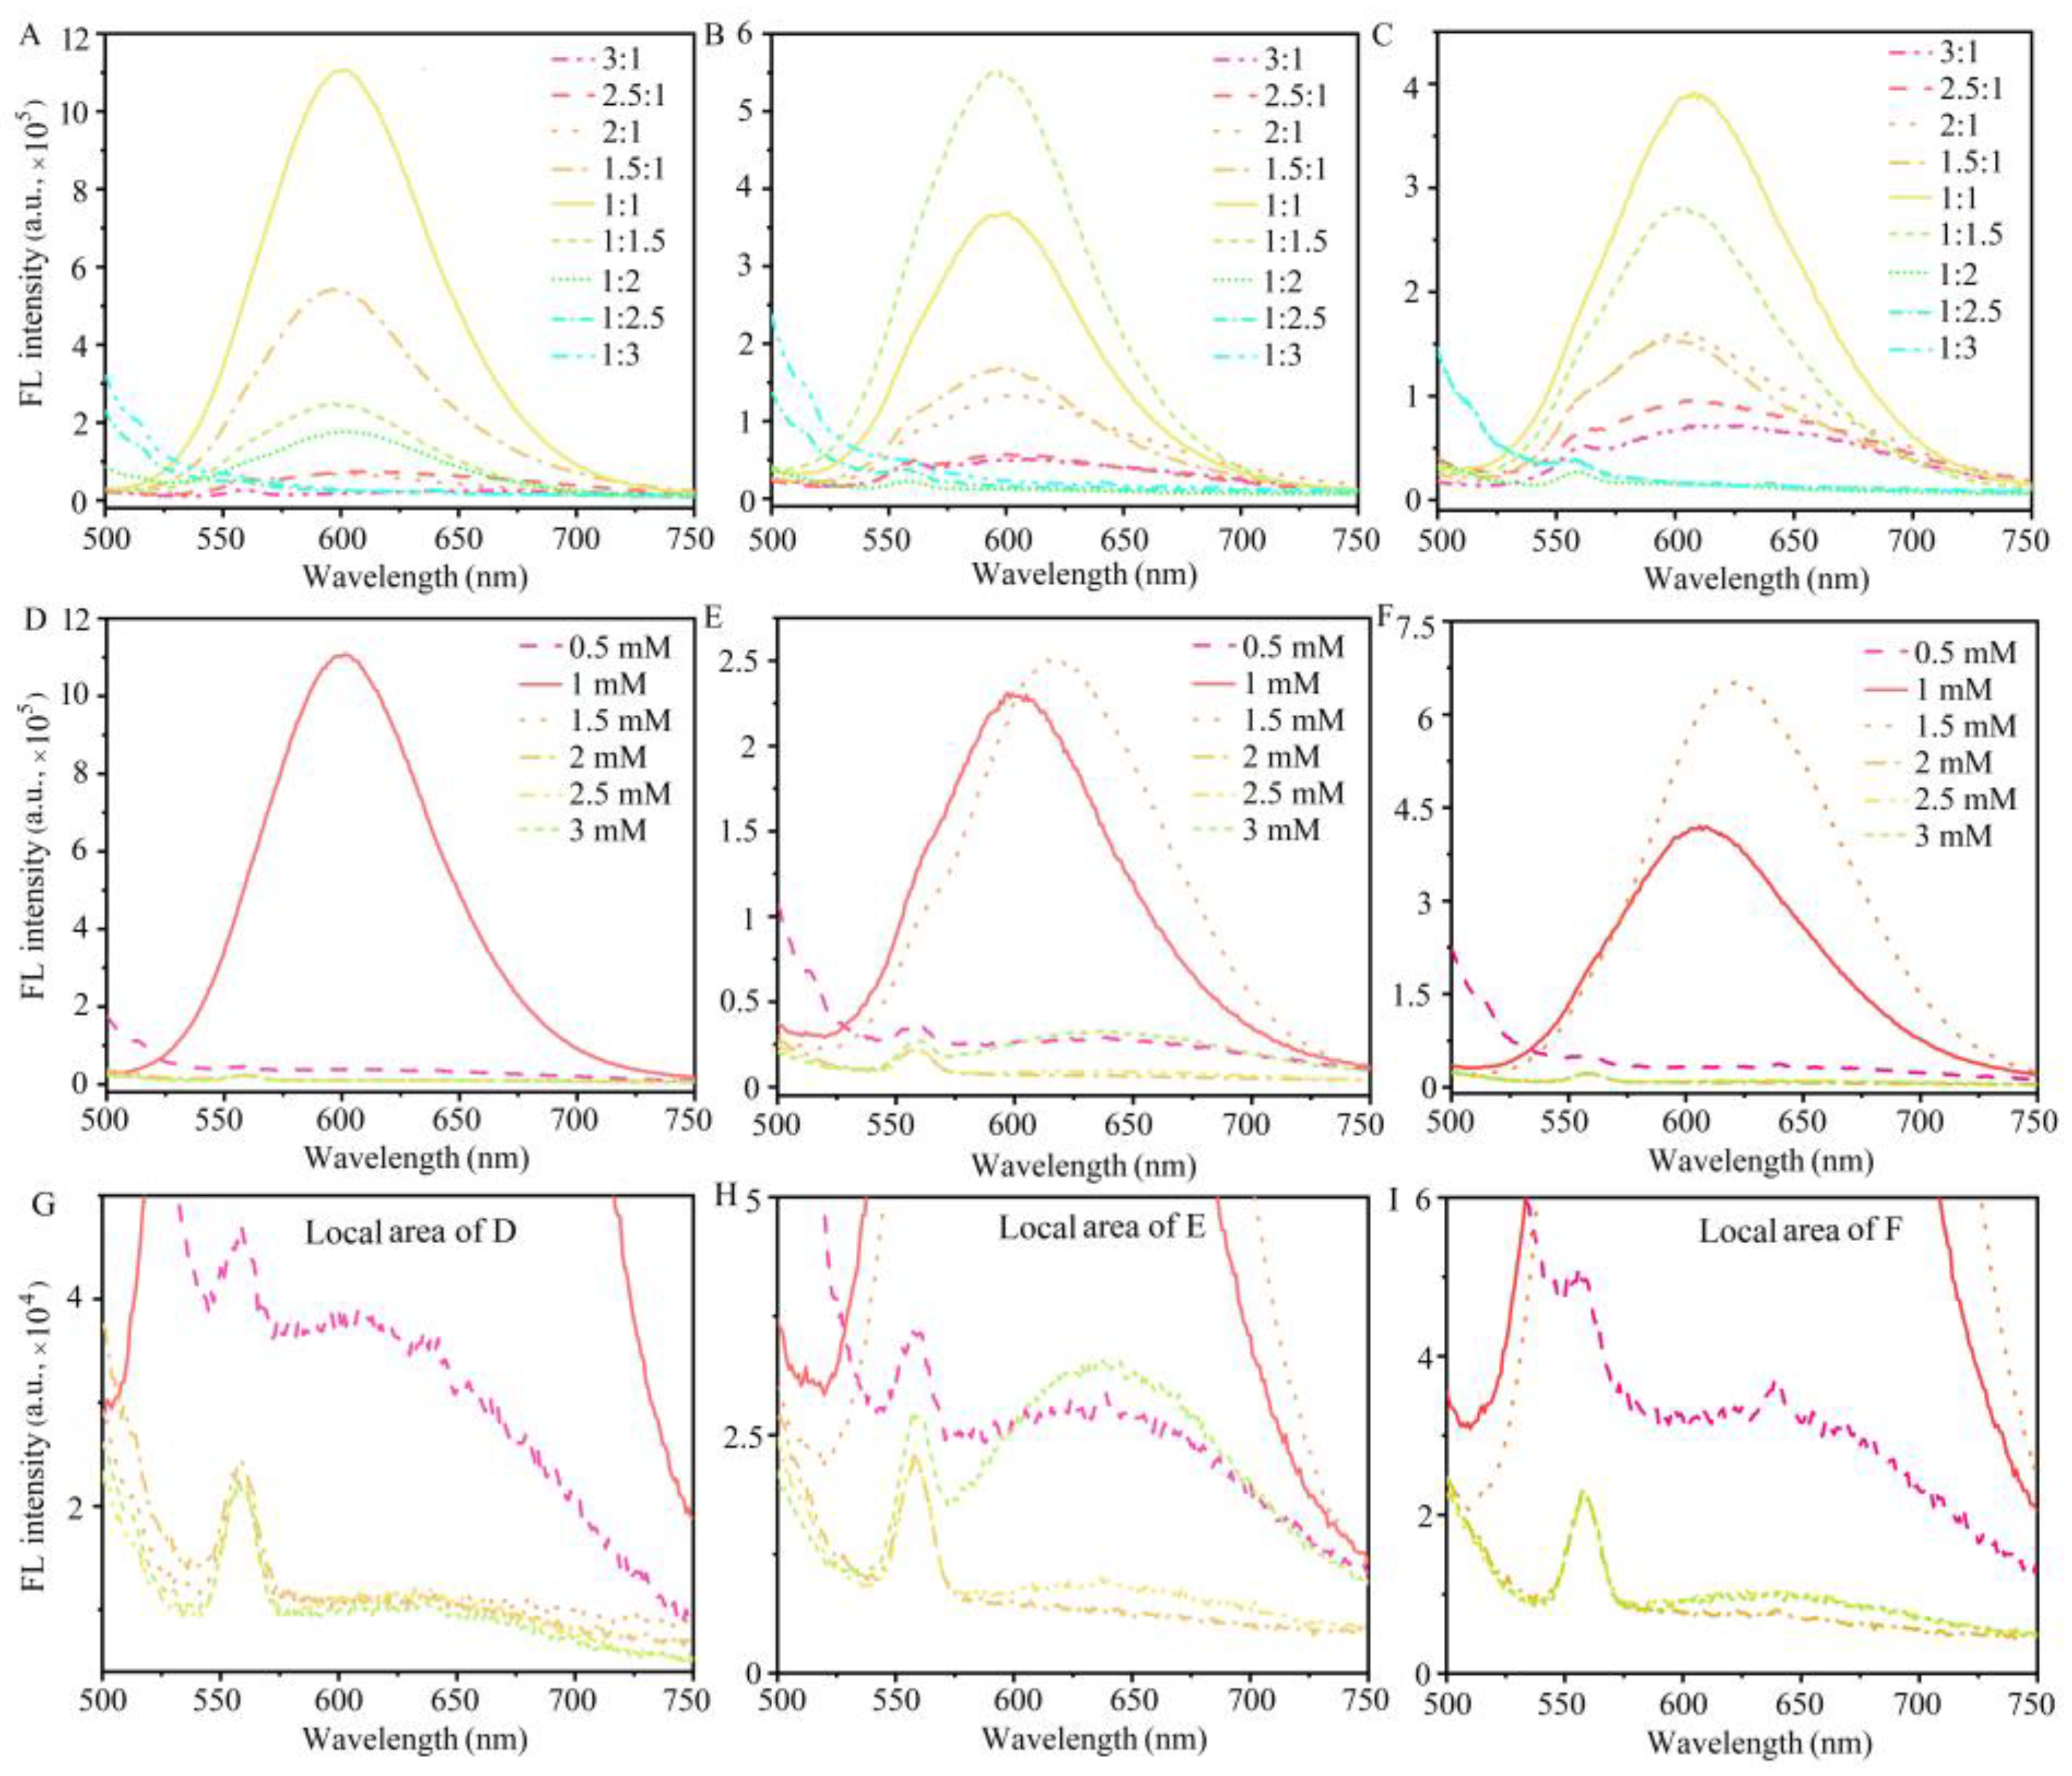
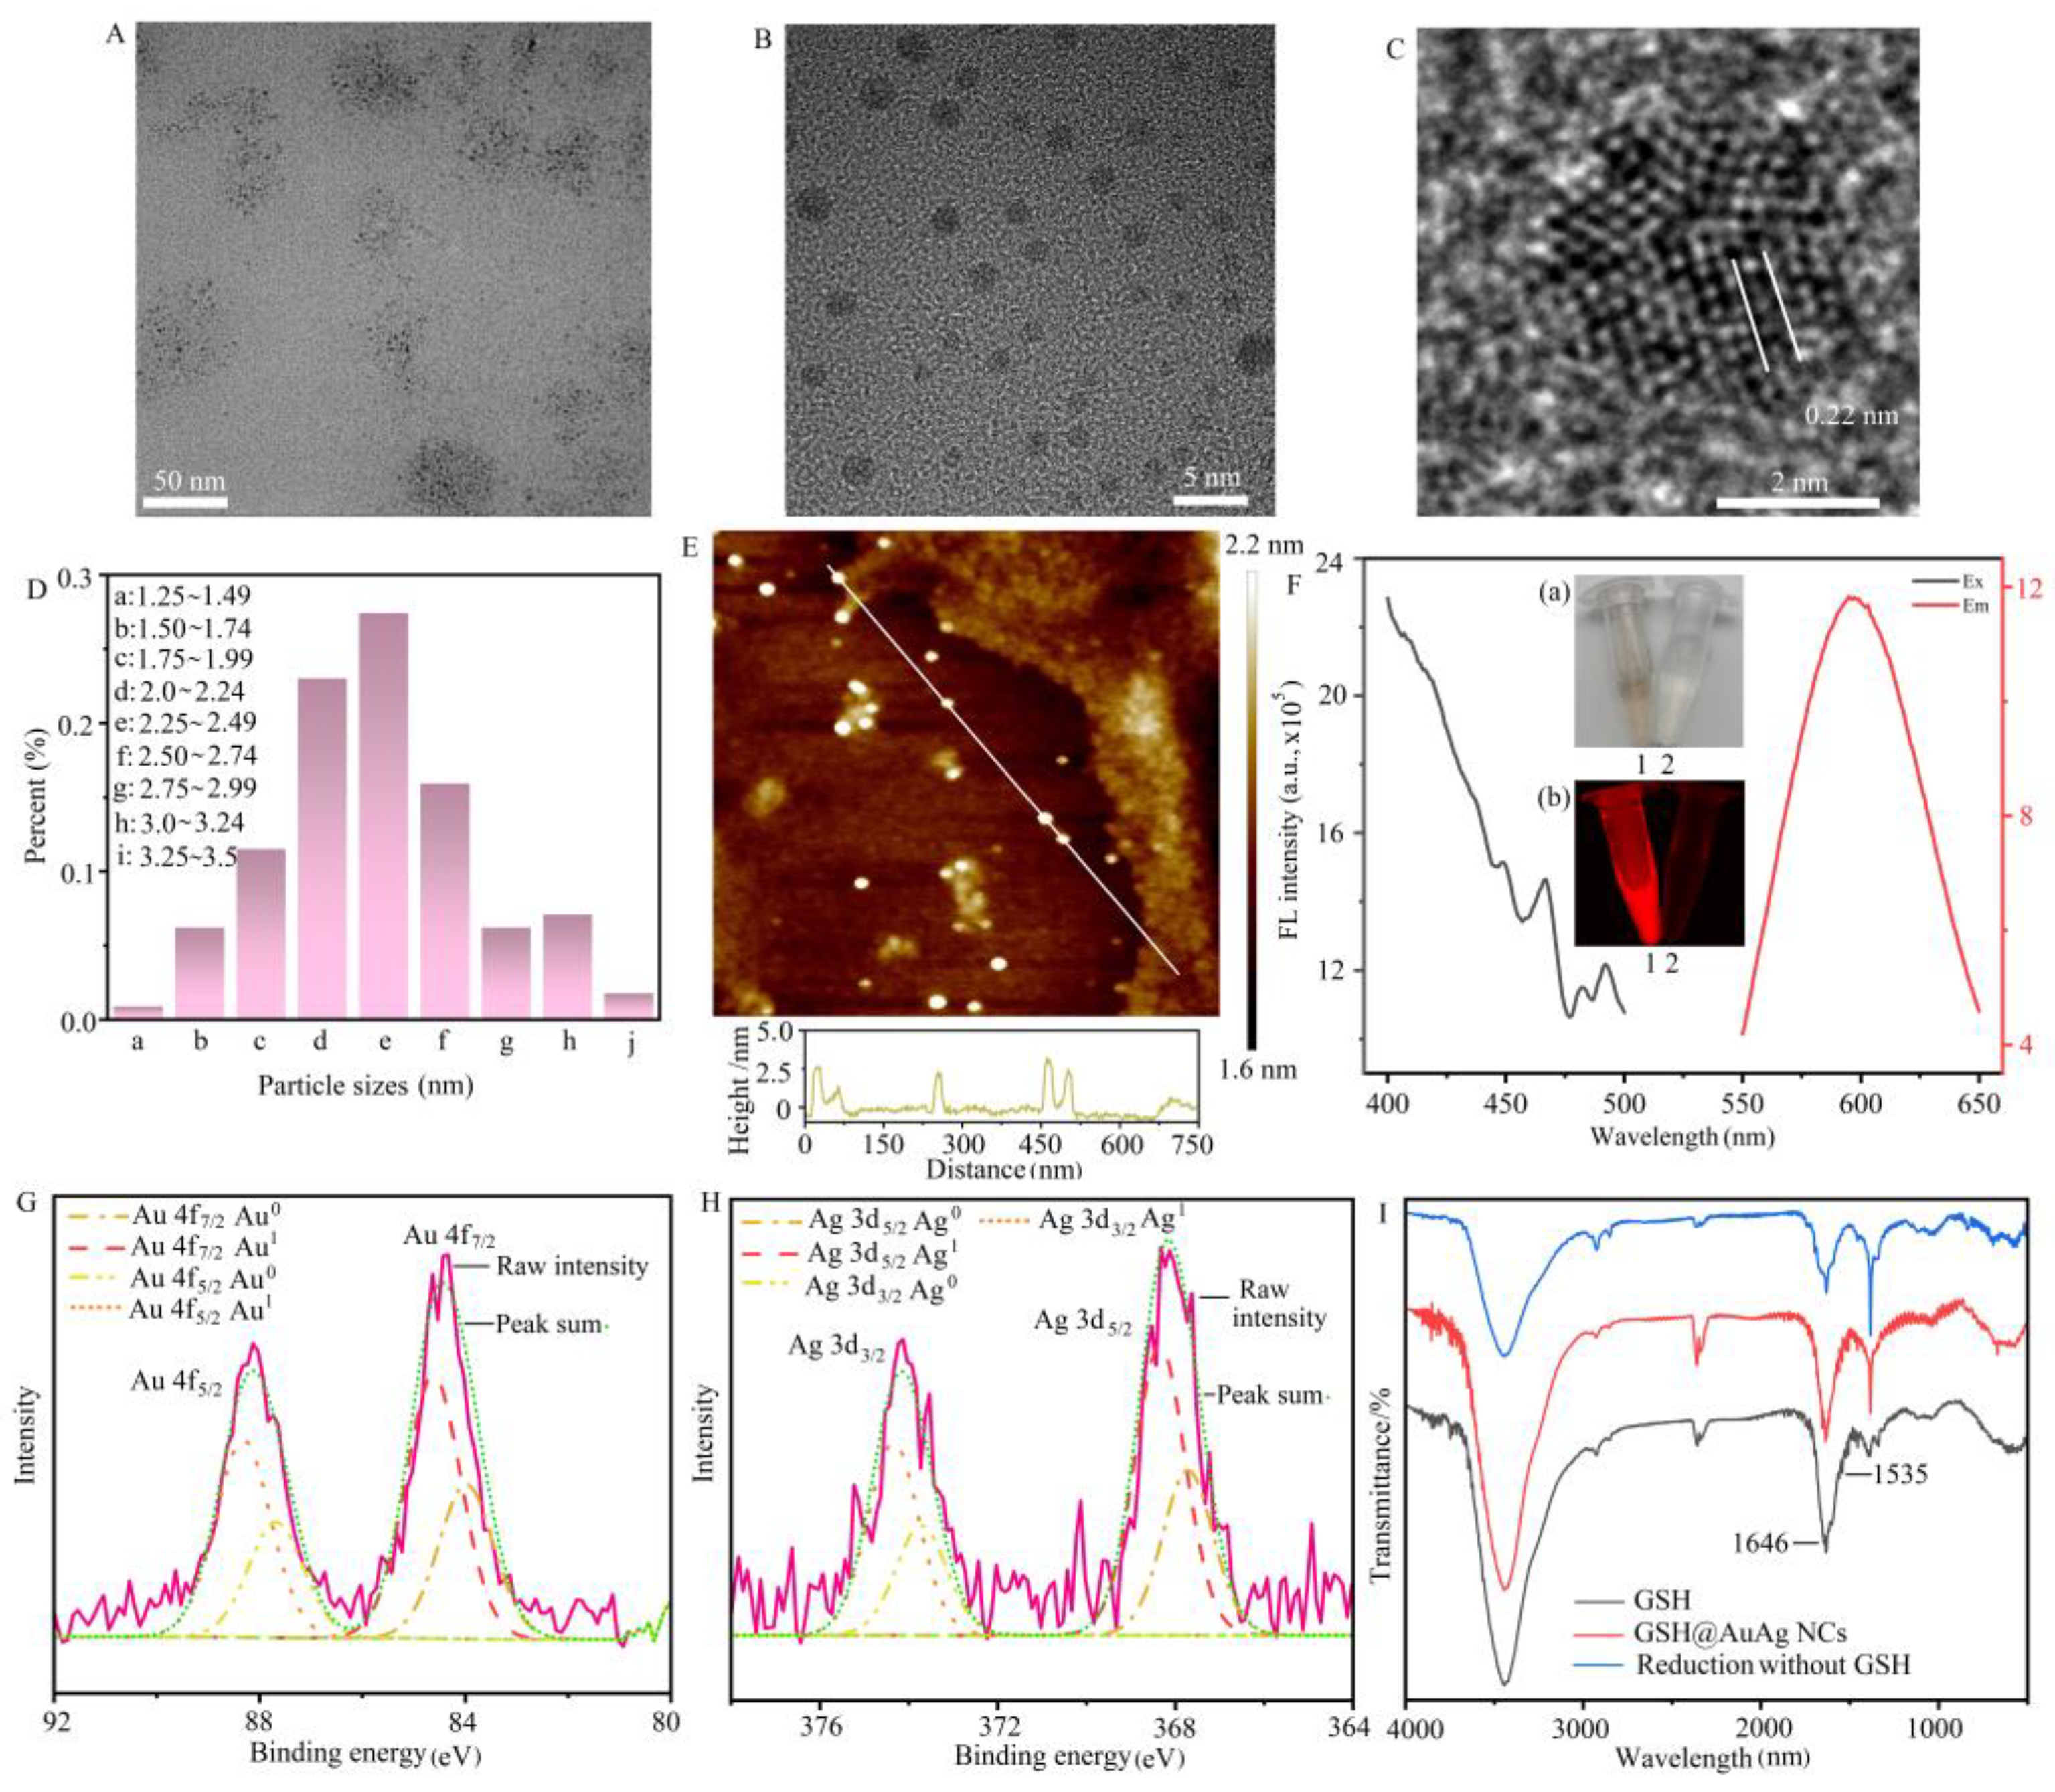
3.1. Synthesis and Characterization of GSH@AuAg NCs

The reductant NaBH4 was introduced in the mixture of HAuCl4, AgNO3, and GSH to accelerate the metallic nucleation and growth, which moderated the restricted synthesis conditions. After GSH@AuAg NCs were formed, the rate of NaBH4 reduction was limited by harmonizing reaction parameters, such as solution pH, amounts of reactants, and temperature. Therefore, the reaction conditions, such as the molar ratio of HAuCl4 to AgNO3 (Au/Ag), the concentrations of GSH and NaBH4, and the pH were firstly optimized by detecting the fluorescence of produced GSH@AuAg NCs. The effect of Au/Ag ratio was examined in the presence of 0.5 mM HAuCl4. The fluorescence intensity of GSH@AuAg NCs prepared at three pHs all increased gradually with the decreasing ratio of Au/Ag and reached a maximum intensity at the molar ratio of 1:1 for pH 7–8 and 11–12, and 1:1.5 for pH 9–10 (Figure 1A–C). More AgNO3 resulted in the decrease of fluorescence intensity of GSH@AuAg NCs and the appearance of a shoulder peak around 560 nm, which should result from other distinct clusters. The equal concentrations of Au and Ag precursors for the brightest nanoclusters hinted at the co-doping of Au and Ag.
The effect of GSH ligand concentration was examined at different pHs with 0.5 mM Au and Ag precursors and 0.75 mM NaBH4 to show the brightest GSH@AuAg NCs at 1.0 mM of GSH (Figure 1D,E). GSH at concentrations of 0.5 mM and 2–3 mM cannot obtain the GSH@AuAg NCs, where the fluorescence intensity of the solution was very weak (Figure 1G–I, the local amplified images of Figure 1D,E). The GSH@AuAg NCs synthesized at pH 7–8 showed much stronger fluorescence intensity than those obtained at higher pHs. Thus, pH 7.5 was selected for GSH@AuAg NCs synthesis.
The optimization of NaBH4 concentration for GSH@AuAg NCs synthesis was performed at pH 7.5 with 0.5 mM Au and Ag precursors, and 1.0 mM GSH. The maximum fluorescence intensity occurred at 0.75 mM NaBH4 (Figure S1 in SI). The optimized reaction time was 15 min, and a prolonged reaction time did not increase the fluorescence intensity of GSH@AuAg NCs (Figure S2 in SI).
As the first reported co-reduction synthesis of GSH@AuAg NCs mediated by NaBH4, the growth of GSH@AuAg NCs was investigated by UV-vis and fluorescence spectroscopy to understand the complex reduction assembly of Au and Ag precursors and GSH ligands. First, to confirm the doping synthesis of GSH@AuAg NCs rather than other luminous oligomeric clusters, spectroscopic analysis was performed by preparing the NCs in the absence of each reactant. The GSH@AuAg NCs did not exhibit obvious plasmon resonance absorption in the range of 400–700 nm, while a clear absorption peak appeared when the synthesis was performed in the absence of GSH or Au precursors (Figure 2A). In addition, in the absence of the Ag precursor, the reaction solution was transparent and the UV-vis absorbance was close to zero, which was similar to that in the absence of NaBH4 (Figure 2B, (3) and (5)) and could be attributed to the presence of GSH with two times higher concentration than HAuCl4 to form stabilized Au (I)-GSH complexes, which limited the immediate reduction to Au (0) components [21,22]. In the absence of the Au precursor, an absorption peak appeared at 450 nm and the solution became a lilac color, which resulted from the formation of large Ag nanoparticles (AgNPs) (Figure 2B, (2)) due to the weaker stability of GSH and Ag+ complexes. Interestingly, no fluorescence emission was observed in the absence of the Au or Ag precursor (Figure 2C), demonstrating that the fluorescence emission came from the bimetallic AuAg nanoclusters. In the absence of GSH, a shield peak occurred at 560 nm (Figure 2C, curve (4)), as observed in Figure 1, which eliminated the formation of the weak luminous metal (I)-GSH (M (I)-GSH) complexes. Besides, the mixture of Au and Ag precursors and GSH did not exhibit luminescence, which excluded the emission originating from the oligomeric metal (I)-GSH complex. The above results confirmed that all reactants are indispensable for the formation of GSH@AuAg NCs.
To understand the interaction of Au and Ag precursors with the GSH ligand, the ratio of GSH to Au precursor was changed while keeping the amount of GSH and total concentration of Au and Ag precursors at 1.0 mM to record the corresponding spectra. In the absence of the Ag precursor, an absorption peak appeared at 520 nm, and the solution color turned deep reddish brown (Figure 2D,E, (1)), indicating the formation of Au NPs, and the above protective function of GSH only occurred at a higher ratio of GSH to Au precursor. Interestingly, the absorption peak of Au NPs at 520 nm completely disappeared, and the solution became light brown–yellow after only 0.1 mM Ag precursor was added. More Ag precursor decreased the absorbance and the solution color became lighter till the presence of 0.5 mM Ag precursor (Figure 2D,E, (3)–(5)). The maximum fluorescence emission also occurred at 0.5 mM Au and Ag precursors (Figure 2F), demonstrating the synergism stability induced by co-doped Au and Ag and the formation of GSH@AuAg NCs.
The fluorescence of metal nanoclusters (MNCs) can be considered to originate from the aggregated M(I)-thiolate oligomers due to ligands inducing the ligand-to-metal charge transfer (LMCT) or ligand–metal–metal charge transfer (LMMCT) [21,22]. At high ratios of GSH to Au precursor, no Au (0) component was formed due to the protective effect of GSH ligand; thus, the nanoclusters could not be generated. While introducing Ag to decentralize the shielding of GSH as forming the M(I)–GSH complex, the NaBH4 initially reduced the Ag (I) to Ag (0) as a less weak protection against reducing Ag (I) to Ag (0), as the intertwined M(I)–GSH complexes made the Au(I) ions close to the Ag (0) surface prompt the formation of bimetallic clusters [22].
To further understand the assembly of Au and Ag precursors and GSH ligand, the effect of the feeding pattern was examined to elucidate the formulation of GSH@AuAg NCs. The premixing of the GSH ligand with the Au precursor and later, the introduction of the Ag precursor resulted in the growth of nanoclusters, which exhibited weaker luminosity and higher absorbance from 400 to 600 nm (Figure 2G–I, curve a), compared with the feeding mode that pre-mixed Au and Ag precursors, and then added GSH (Figure 2G–I, curve d), which showed the maximum luminosity, thus could be considered as an optimized sampling procedure (Figure 2J). In the optimized sampling procedure, the yellow mixture of Au and Ag precursors was attributed to the formation of multiple complexes by the electrostatic interaction; the solution became muddy white upon addition of GSH due to the formation of a mingled network of the Metal–GSH complex, and the addition of NaOH and NaBH4 produced brown–yellow GSH@AuAg NCs.
Another sampling procedure was premixing the GSH ligand with the Au precursor and then, NaBH4 to react for 5 min, then adding Ag precursor for another 10 min (Figure 2G–I, b). The absorbance of the final solution was extremely low at 0.5 mM Au and Ag precursors (Figure 2G, curve b1), which was different from that of the optimized sampling order (Figure 2G, curve d). This demonstrated the influence of the sampling order on the growth of GSH@AuAg NCs. In addition, further increasing the concentrations of the Au precursor, both the color and absorption spectra of the ultimate solution were close to that of the optimized sampling procedure, indicating the formation of nanoclusters (Figure 2G, curves b2 and b3). These results confirmed that the molar ratios of GSH to metal precursors significantly affected the assembly of Au, Ag, and GSH. Other sampling procedures, such as premixing the GSH ligand with the Ag precursor, then NaBH4 to react for 5 min and then adding the Au precursor, were also examined (Figure 2G–I, c). After 5 min NaBH4 reduction, the solution turned a lilac color, indicating the formation of large AgNPs as mentioned above. After introducing the Au precursor (0.5 mM), the solution color gradually decayed to colorless, and the absorbance was also significantly reduced (Figure 2G,H, curve c), suggesting the dissolution of AgNPs due to the interaction among Au, Ag, and GSH. The significantly weak emission intensity demonstrated the failure of the GSH@AuAg NCs assembly.
The TEM and AFM images and corresponding particle size distribution of GSH@AuAg NCs formed with the optimized sampling procedure showed spherical morphology and well dispersion with an average diameter of about 2.35 nm (Figure 3A–E). The clear lattice fringes were observed with an interspacing of 0.22 nm (inset in Figure 3B), corresponding to the d-spacing of the crystal plane of face-centered cubic Au (111) [23,24]. The GSH@AuAg NCs have also been characterized by fluorescence spectroscopy. As shown in Figure 3F, the maximum excitation and emission wavelengths of AuAg NCs were 468 nm and 600 nm, respectively. The GSH@AuAg NCs were yellow–brown under the visible light (inset in Figure 3F of a-1) and emitted a bright red fluorescence under UV irradiation (inset in Figure 3F of b-1), indicating forming high luminous nanoclusters. XPS spectroscopy was then used to confirm the elemental composition of the GSH@AuAg NCs and the valence states of Au and Ag (Figure S3 in SI, Figure 3D,E). The survey spectrum in Figure S3 confirmed that GSH@AuAg NCs were composed of Au 4f, Ag 3d, carbon (C 1s), sulfur (S 2p), oxygen (O 1s), and nitrogen (N 1s). The peaks of C, O, S, and N were attributed to GSH, indicating that the GSH was capped with the AuAg NCs. XPS spectroscopy was then used to confirm the elemental composition of the GSH@AuAg NCs and the valence states of Au and Ag (Figure 3D,E). The Au 4f XPS spectrum displayed a peak at 88.1 eV (Au 4f5/2) and a splitting peak at 84.4 eV (Au 4f7/2). The latter could be deconvoluted into two distinct components with the binding energies centered at 84.0 and 84.6 eV, assigned to Au (0) and Au (Ι), respectively. The predominant Au species in the GSH@AuAg NCs was identified as Au (Ι) (∼62.5%). The Ag 3d pattern exhibited two peaks at 374.1 eV (Ag 3d3/2) and 368.1 eV (Ag 3d5/2), and the latter was deconvoluted into Ag (I) at 368.4 eV and Ag (0) at 367.7 eV (Figure 3E). The predominant Ag species in the GSH@AuAg NCs was identified as Ag (I) (∼63.7%), indicating the successful doped synthesis of GSH@AuAg NCs [25,26]. FT-IR studies of GSH-AuAg NCs also demonstrated the presence of GSH. As depicted in Figure 3I, GSH (black line) has a set of characteristic IR bands such as the characteristic bands at 1535 cm−1 for the antisymmetric stretching of COO and 1646 cm−1 for the vibration of C=O/N-H [27,28], which can also be seen in the FT-IR spectrum of the GSH@AuAg NCs (red line), while disappearing with reduced synthesized AuAg NCs without GSH (blue line), further indicating the presence of GSH capping the AuAg NCs.

3.2. Optimization of pH for Recognition of GSH@AuAg NCs to Mg2+

MNCs, including AuAg NCs, have been reported as showing fancy numerous responses to different metal ions [7,23,29]. To provide a new fluorescence probe for Mg2+, the recognition conditions of GSH@AuAg NCs to Mg2+ were optimized. Firstly, the effect of pH on the fluorescence of GSH@AuAg NCs dispersion was examined (Figure 4A). The fluorescence was negligible at pHs lower than 6.5, and quickly enhanced with the increasing pH from 6.5 to 7.5 (Figure 4B). At different pHs, the responses of GSH@AuAg NCs to several metal ions were also examined. As shown in Figure 4C, the fluorescence of GSH@AuAg NCs could be completely quenched by Cu2+ ions in the pH range of 6.0–10, while Mg2+ exhibited obvious boosting effect at different pHs. Besides, Ca2+ exhibited a relatively weaker FL enhancement, and Zn2+ could quench the fluorescence at low pH and increase the fluorescence at pHs more than 9.0. Mg2+ and Ca2+ are the second main-group elements and possess a similar coordinated interaction with GSH, leading to the FL enhancement. In order to achieve Mg2+ detection, the optimum pH was chosen at 7.0, at which the FL enhancement of Ca2+ was the weakest, and the effect of Zn2+ was also relatively low.

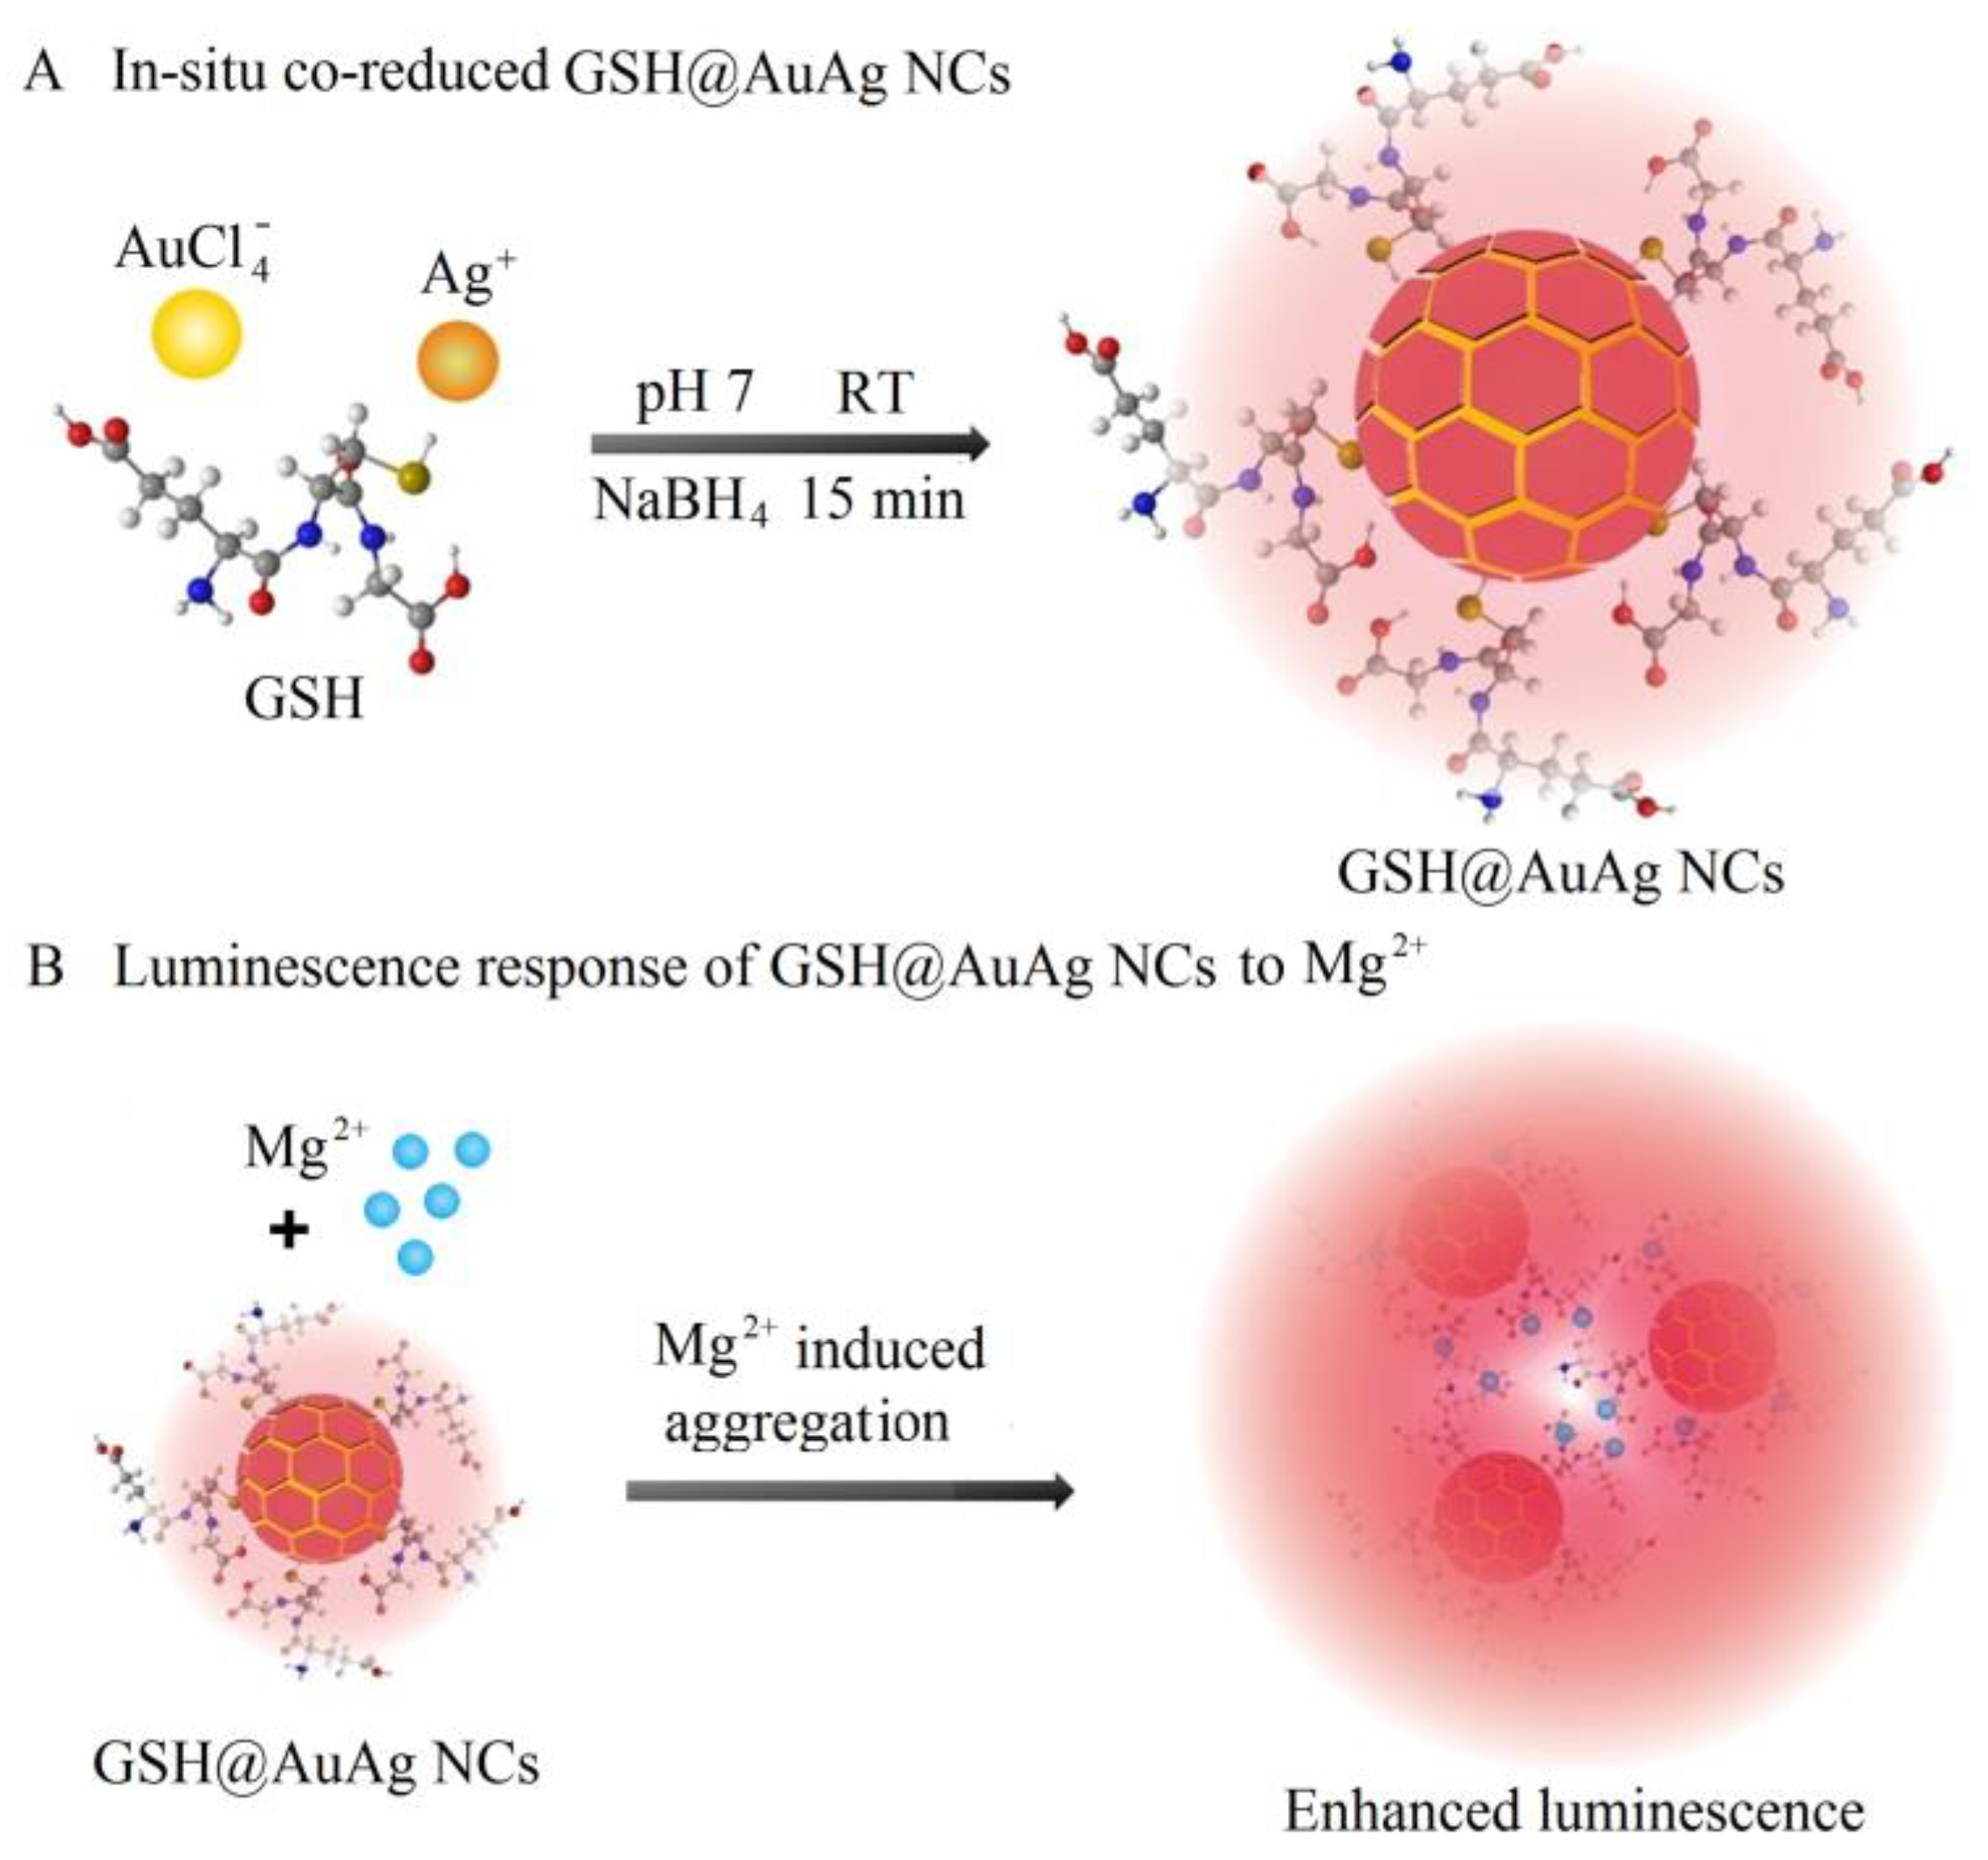
3.3. Mechanism of Mg2+-Mediated Fluorescence Enhancement of GSH@AuAg NCs

The TEM images of GSH@AuAg NCs showed the large aggregates with the size around 100 nm (Figure 5A), which was significantly larger than that of GSH@AuAg NCs (Figure 3), and could be attributed to the neutralization of negatively charged GSH@AuAg NCs by Mg2+ binding with -COO in GSH and/or the chelation of Mg2+ to carbonyl, hydroxyl, and other electron-donating groups [30,31]. The neutralized GSH@AuAg NCs weakened the dispersal stability of the GSH@AuAg NCs due to the loss of electrostatic repulsion. The aggregates induced by the chelation of Mg2+ ion deeply changed the surface metal–ligand [Au (1)–GSH] motifs state, which remolded the ligand conformation and strengthened the aurophilic interaction of the oligomeric GSH–[Au (I)–GSH]x motifs [8,21,31].
To further understand the interaction of Mg2+ with GSH@AuAg NCs, the average fluorescent lifetime of GSH@AuAg NCs was examined upon addition of Mg2+ (Figure 5B). The fluorescent lifetime increased from 3.29 μs to 3.45 μs, while the fluorescent QY increased from 2.47 % to 7.16 % with the ethanol solution of rhodamine 6G as a reference. The large stokes shift (130 nm) and long fluorescence lifetime of GSH@AuAg NCs in their excited-state decay indicated that luminescence originated from the ligand-to-metal charge transfer (LMCT) or ligand-to-metal–metal charge transfer (LMMCT) [21,22]. The increase of fluorescent QY and the prolongation of fluorescent lifetime upon the addition of Mg2+ indicated that the process of charge transfer underwent a transformation after Mg2+ chelation, further confirming the reconstructed local surface physicochemical environment.

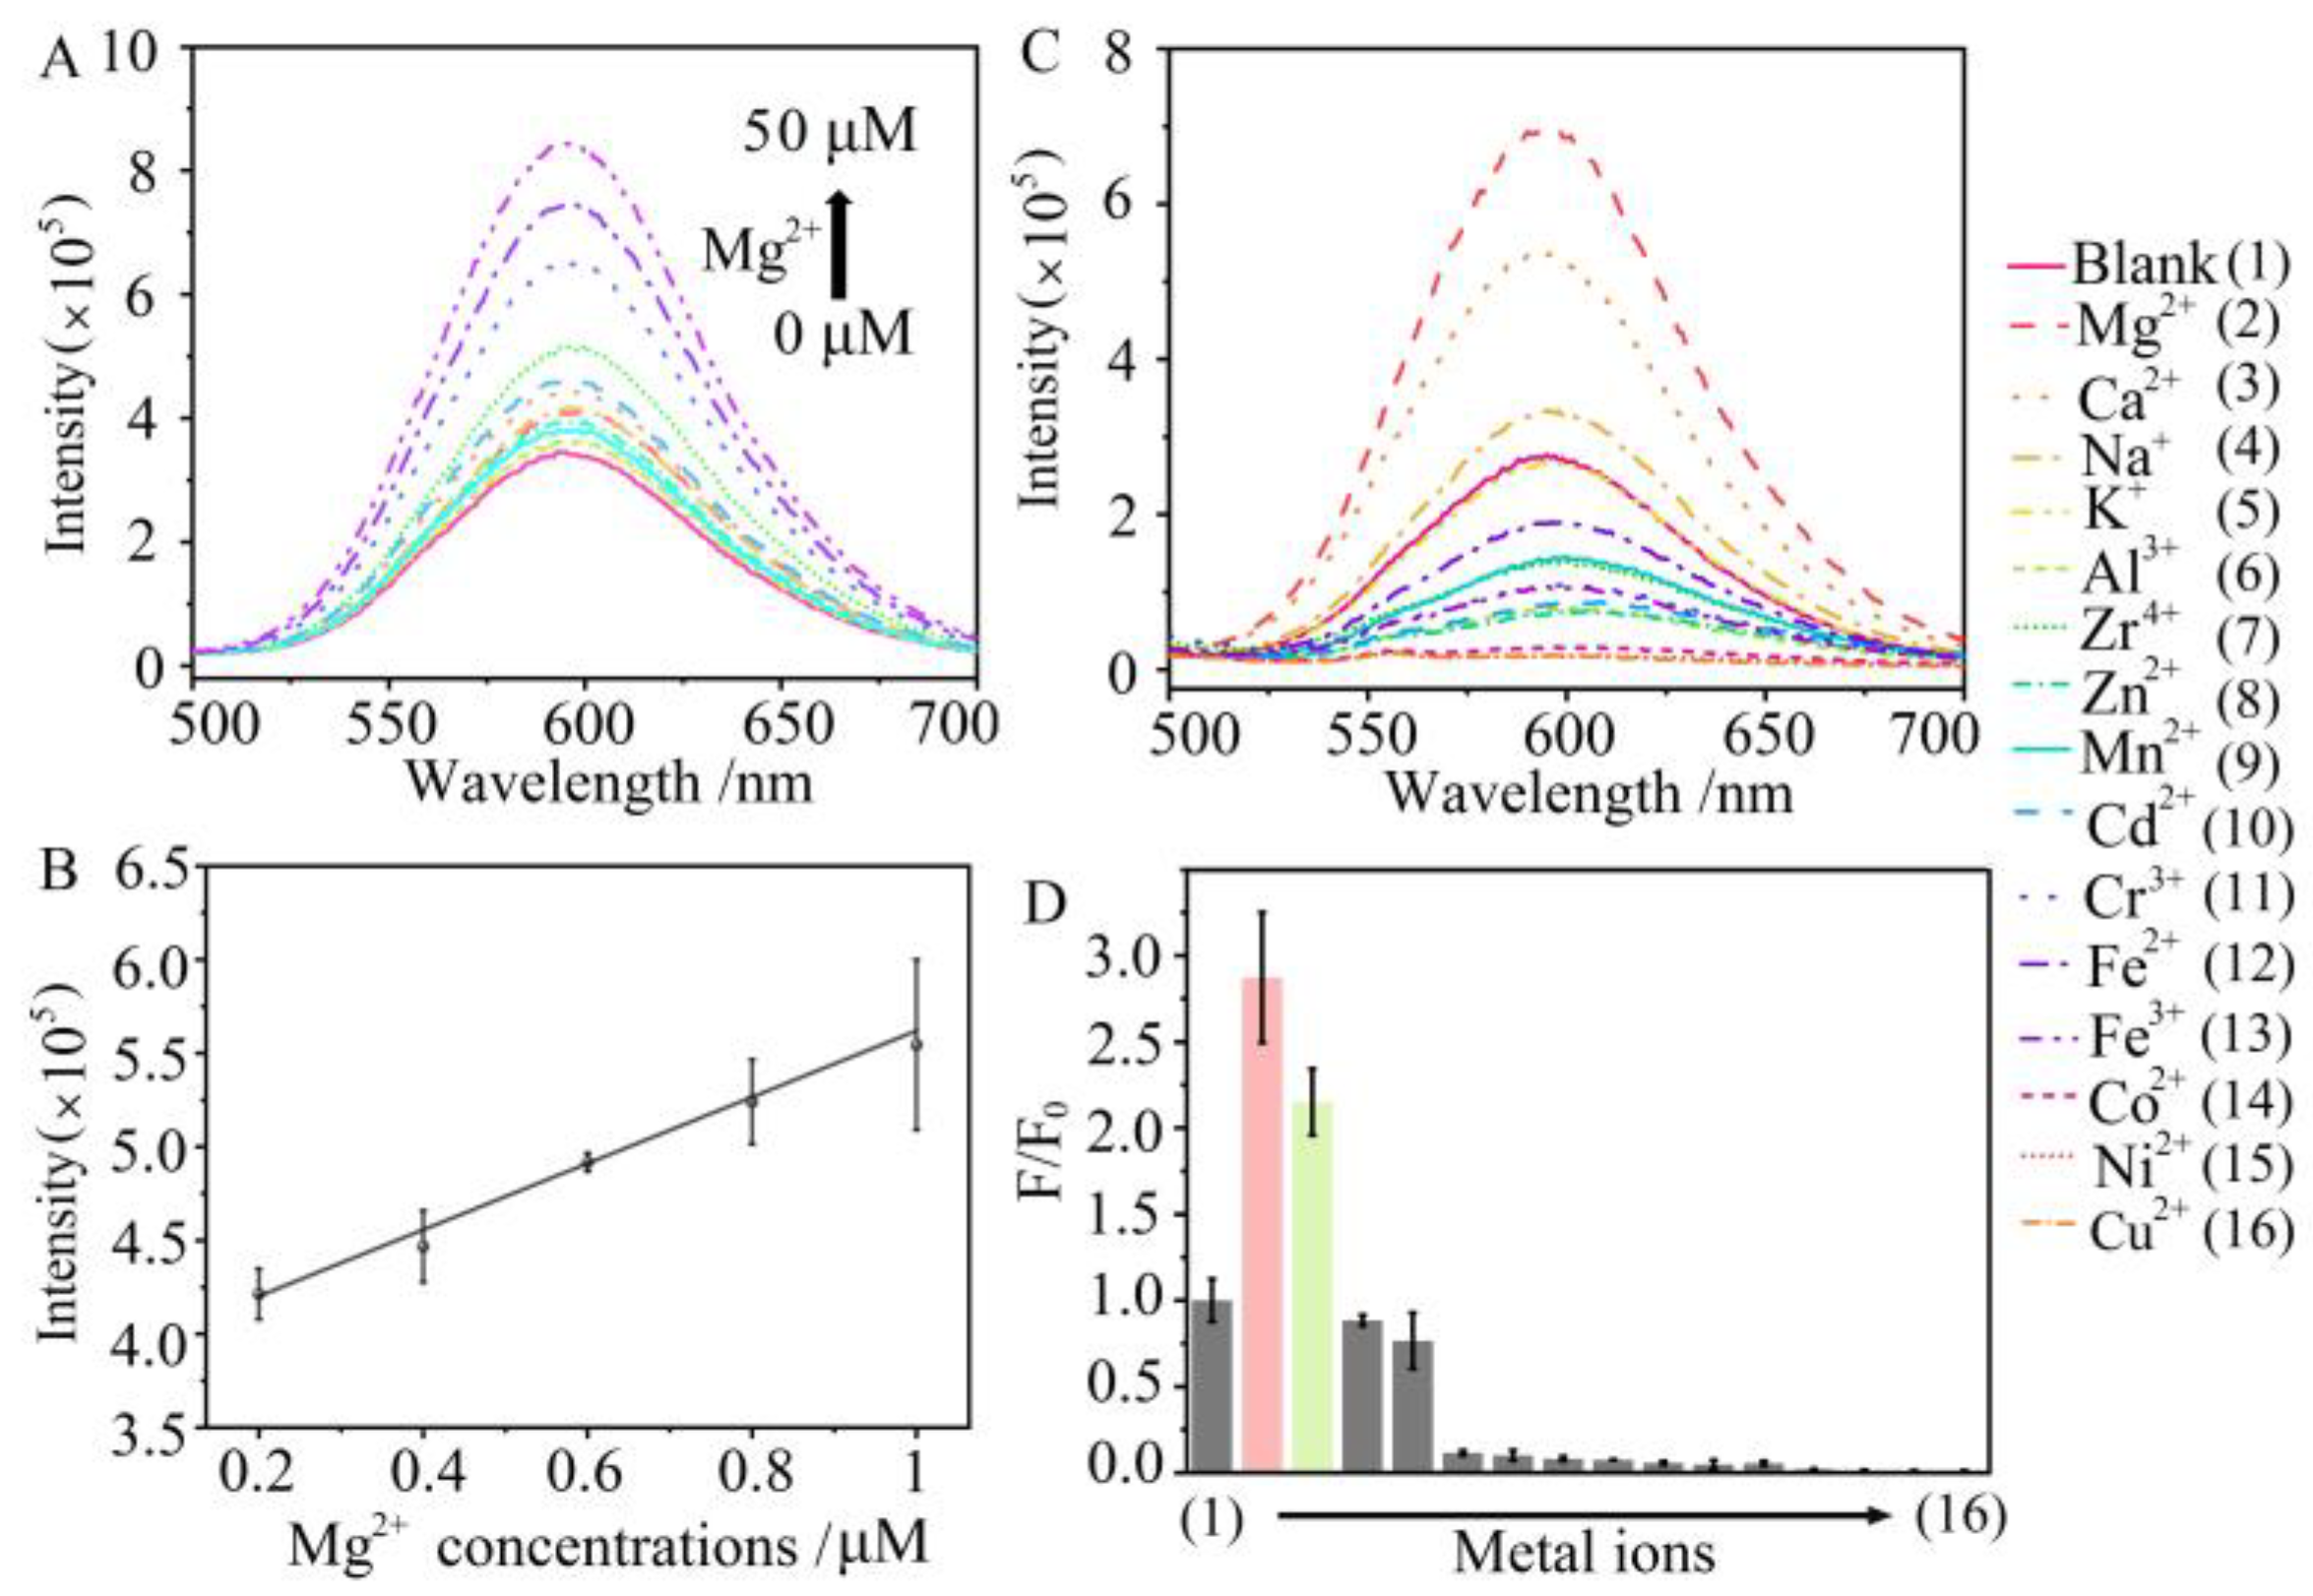
3.4. Sensing Performance towards Mg2+

In the optimization experimental conditions, we performed an Mg2+ assay as shown in Figure 6A. The emission intensity of GSH@AuAg NCs increased with the increasing Mg2+ concentration. The plot of fluorescence intensity vs the concentration showed a good linearity with an R2 of 0.989 over the range from 0.2 μM to 1 μM (Figure 6B). The linear regression equation was F = 177 c (μM) + 3.848 × 10⁵. To evaluate the specificity of the fluorometric detection of Mg2+, 14 types of metal ions were chosen to be tested under the same experimental conditions as those for Mg2+. As shown in Figure 6C, other common metal ions except Ca2+ showed a negligible effect on Mg2+ detection. The fluorescence quenching of GSH@AuAg NCs by the coexisting ions did not affect the detection of Mg2+ (Figure 6D), demonstrating the admirable specificity of GSH@AuAg NCs towards Mg2+ and the potential application of the proposed method in the quality testing of the Mg2+ amount.
To demonstrate the practical analytical application of the GSH@AuAg NCs, Mg2+ was spiked into purified drinking water at different concentrations. Recovery results were presented in Table S1, which showed the recoveries ranging from 94.7% to 97.4%, indicating an applicable Mg2+ detection in real drinking water. Unlike purified drinking water, the other dairy using water, such as the ground water and domestic treated water (tap water), tended to have higher concentrations of Mg2+ that can affect people’s normal life. To achieve specific identification of Mg2+ in dairy using water, some issues, such as the interference from other heavy metal ions, pH-induced changes in the specificity for Mg2+, and the signal crosstalk from Ca2+, had to be overcame. The designed GSH@AuAg NCs had several advantages that may have a positive impact on Mg2+ quantitative identification. Of all the common metal ions, only Mg2+ and Ca2+ turn on the fluorescence intensity of the GSH@AuAg NCs, demonstrating its anti-jamming performance for the most heavy metal ions. Then, as known, the pH of the ground water and tap water may change dynamically according to different environment backgrounds, which the fluorescence intensity of GSH@AuAg NCs would decrease in an acidic or alkaline condition, but the Mg2+-mediated turn-on fluorescence intensity of GSH@AuAg NCs was very stable at various pH values from 6 to 10. In addition, some heavy metal ions (Zn2+) can also enhance the fluorescence intensity of GSH@AuAg NCs at alkaline condition. Yet, the concentrations of most heavy metal ions (less than micro-molar) were much lower than that of Mg2+ (hundreds of micro moles to millimoles) in dairy using water [32,33], which mean the heavy metal ions may not interface the Mg2+ measurement even under different pH conditions. Ultimately, the only drawback was the crosstalk of Ca2+-mediated turn-on emission from GSH@AuAg NCs. The Ca2+ concentration in water was several times higher than that of Mg2 [33]. The pretreatment of the water sample by settlement or filtration adsorption of Ca2+ may solve this problem, and there are many techniques for removing Ca2+ from water [34,35], which may eliminate the effect of Ca2+ crosstalk on the accurate quantifying of Mg2+. By taking this into account, the specificity of Mg2+ in real-water samples can be achieved.

4. Conclusions

The facile, gentle, and fast synthesis of NaBH4-reduced GSH@AuAg NCs with good dispersivity has been successfully achieved by pre-mixing Au and Ag precursors and adding GSH in the mixture to form a metal–GSH complex, followed with NaBH4 addition for the reduction of metal ions at pH 7.5. The co-doping of Au and Ag at the molar ratio of 1:1 results in the synergism stability of the NCs. The GSH@AgAu NCs show a special enhancement of fluorescence response to magnesium ions (Mg2+) at pH 7.0, which has been designed for the first nanoclusters-based fluorescent sensing of Mg2+. The proposed method exhibits acceptable selectivity for Mg2+detection, and practical utility in monitoring the Mg2+ content in daily drinking water.

Supplementary Materials

The following supporting information can be downloaded at: https://www.mdpi.com/article/10.3390/chemosensors11080435/s1, Figure S1: Optimization of NaBH4 concentration for GSH@AuAg NCs preparation; Figure S2: Fluorescent spectra of GSH@AuAg NCs obtained at different times; Figure S3: The survey spectra of AuAg NCs; Table S1: Detection of Mg2+ in purified drinking water samples.

Author Contributions

Conceptualization, W.C.; methodology, W.C. and Y.C.; validation, Y.C., X.Z. and Z.H.; investigation, Y.C., X.Z. and Z.H.; resources, L.W. (Lixing Weng); data curation, Y.C.; writing—original draft preparation, Y.C.; writing—review and editing, W.C., M.X. and L.W. (Lixing Weng); supervision, L.W. (Lianhui Wang); funding acquisition, W.C. and L.W. (Lixing Weng). All authors have read and agreed to the published version of the manuscript.

Funding

This research was financially supported by the National Natural Science Foundation of China (22004068), “the Belt and Road” Innovation Cooperation Project of Jiangsu (BZ2022011), the research fund from Nanjing University of Posts and Telecommunications (XK0320921144) and self-funding projects from State Key Laboratory of Analytical Chemistry for Life Science, Nanjing University (SKLACLS2207).

Institutional Review Board Statement

Not applicable.

Informed Consent Statement

Not applicable.

Data Availability Statement

Not applicable.

Conflicts of Interest

The authors declare no conflict of interest.

References

  1. Yao, Q.; Chen, T.; Yuan, X.; Xie, J. Toward Total Synthesis of Thiolate-Protected Metal Nanoclusters. Acc. Chem. Res. 2018, 51, 1338–1348. [Google Scholar] [CrossRef]
  2. Jia, H.; Yu, S.; Yang, L.; Wei, Q.; Ju, H. Near-Infrared Electrochemiluminescence of Dual-Stabilizer-Capped Au Nanoclusters for Immunoassays. ACS Appl. Nano Mater. 2021, 4, 2657–2663. [Google Scholar] [CrossRef]
  3. Jia, H.; Yang, L.; Fan, D.; Kuang, X.; Sun, X.; Wei, Q.; Ju, H. Cobalt ion doping to improve electrochemiluminescence emisssion of gold nanoclusters for sensitive NIR biosensing. Sens. Actuators B Chem. 2022, 367, 132304. [Google Scholar] [CrossRef]
  4. Srinivasulu, Y.G.; Goswami, N.; Yao, Q.; Xie, J. High-Yield Synthesis of AIE-type Au22(SG)18 Nanoclusters through Precursors Engineering and Its pH-Dependent Size Transformation. J. Phys. Chem. C 2021, 125, 4066–4076. [Google Scholar] [CrossRef]
  5. Mastracco, P.; Gonzalez-Rosell, A.; Evans, J.; Bogdanov, P.; Copp, S.M. Chemistry-Informed Machine Learning Enables Discovery of DNA-Stabilized Silver Nanoclusters with Near-Infrared Fluorescence. ACS Nano 2022, 16, 16322–16331. [Google Scholar] [CrossRef] [PubMed]
  6. Aires, A.; Sousaraei, A.; Moller, M.; Cabanillas-Gonzalez, J.; Cortajarena, A.L. Boosting the Photoluminescent Properties of Protein-Stabilized Gold Nanoclusters through Protein Engineering. Nano Lett. 2021, 21, 9347–9353. [Google Scholar] [CrossRef]
  7. Li, J.; Peng, G.; Yu, Y.; Lin, B.; Zhang, L.; Guo, M.; Cao, Y.; Wang, Y. Cu2+-mediated turn-on fluorescence biosensor based on DNA-templated silver nanoclusters for label-free and sensitive detection of adenosine triphosphate. Microchim. Acta 2023, 190, 41. [Google Scholar] [CrossRef]
  8. Zanetti-Polzi, L.; Charchar, P.; Yarovsky, I.; Corni, S. Origins of the pH-Responsive Photoluminescence of Peptide-Functionalized Au Nanoclusters. ACS Nano 2022, 16, 20129–20140. [Google Scholar] [CrossRef]
  9. Li, X.; Luo, J.; Jiang, X.; Yang, M.; Rasooly, A. Gold nanocluster-europium(III) ratiometric fluorescence assay for dipicolinic acid. Microchim. Acta 2021, 188, 26. [Google Scholar] [CrossRef]
  10. Mi, W.; Tang, S.; Guo, S.; Li, H.; Shao, N. In situ synthesis of red fluorescent gold nanoclusters with enzyme-like activity for oxidative stress amplification in chemodynamic therapy. Chin. Chem. Lett. 2022, 33, 1331–1336. [Google Scholar] [CrossRef]
  11. Mi, W.; Tang, S.; Jin, Y.; Shao, N. Au/Ag Bimetallic Nanoclusters Stabilized by Glutathione and Lysozyme for Ratiometric Sensing of H2O2 and Hydroxyl Radicals. ACS Appl. Nano Mater. 2021, 4, 1586–1595. [Google Scholar] [CrossRef]
  12. Yin, M.-M.; Chen, W.-Q.; Hu, Y.-J.; Liu, Y.; Jiang, F.-L. Rapid preparation of water-soluble Ag@Au nanoclusters with bright deep-red emission. Chem. Commun. 2022, 58, 2492–2495. [Google Scholar] [CrossRef] [PubMed]
  13. Cui, L.; Li, C.; Chen, B.; Huang, H.; Xia, Q.; Li, X.; Shen, Z.; Ge, Z.; Wang, Y. Surface functionalized red fluorescent dual-metallic Au/Ag nanoclusters for endoplasmic reticulum imaging. Microchim. Acta 2022, 187, 66. [Google Scholar] [CrossRef] [PubMed]
  14. Li, Y.; Deng, Y.; Zhou, X.; Hu, J. A label-free turn-on-off fluorescent sensor for the sensitive detection of cysteine via blocking the Ag+-enhancing glutathione-capped gold nanoclusters. Talanta 2018, 179, 742–752. [Google Scholar] [CrossRef]
  15. Farrag, M.; Tschurl, M.; Heiz, U. Chiral Gold and Silver Nanoclusters: Preparation, Size selection, and Chiroptical Properties. Chem. Mater. 2013, 25, 862–870. [Google Scholar] [CrossRef]
  16. Pontes, M.H.; Yeom, J.; Groisman, E.A. Reducing ribosome biosynthesis promotes translation during low Mg2+ stress. Mol. Cell 2016, 64, 480–492. [Google Scholar] [CrossRef] [Green Version]
  17. Kim, D.Y.; Shinde, S.; Ghodake, G. Colorimetric detection of magnesium (II) ions using tryptophan functionalized gold nanoparticles. Sci. Rep. 2017, 7, 3966. [Google Scholar] [CrossRef] [PubMed] [Green Version]
  18. Li, L.; Ding, Y.; Zhang, C.; Xian, H.; Chen, S.; Dai, G.; Wang, X.; Ye, C. Ratiometric Fluorescence Detection of Mg2+ based on Regulating Crown-Ether Modified Annihilators for Triplet-Triplet Annihilation Upconversion. J. Phys. Chem. B 2022, 126, 3276–3282. [Google Scholar] [CrossRef]
  19. Gruskos, J.J.; Zhang, G.; Buccella, D. Visualizing Compartmentalized Cellular Mg2+ on Demand with Small-Molecule Fluorescent Sensors. J. Am. Chem. Soc. 2016, 138, 14639–14649. [Google Scholar] [CrossRef]
  20. Fujii, T.; Shindo, Y.; Hotta, K.; Citterio, D.; Nishiyama, S.; Suzuki, K.; Oka, K. Design and Synthesis of a FlAsH-Type Mg2+ Fluorescent Probe for Specific Protein Labeling. J. Am. Chem. Soc. 2014, 136, 2374–2381. [Google Scholar] [CrossRef] [PubMed]
  21. Goswami, N.; Yao, Q.; Luo, Z.; Li, J.; Chen, T.; Xie, J. Luminescent Metal Nanoclusters with Aggregation-Induced Emission. J. Phys. Chem. Lett. 2016, 7, 962–975. [Google Scholar] [CrossRef] [PubMed]
  22. Luo, Z.; Yuan, X.; Yu, Y.; Zhang, Q.; Leong, D.T.; Lee, J.Y.; Xie, J. From Aggregation-Induced Emission of Au(I)-Thiolate Complexes to Ultrabright Au (0) @Au (I)-Thiolate Core-Shell Nanoclusters. J. Am. Chem. Soc. 2012, 134, 16662–16670. [Google Scholar] [CrossRef] [PubMed]
  23. Wu, H.; Xie, R.; Hao, Y.; Pang, J.; Gao, H.; Qu, F.; Tian, M.; Guo, C.; Mao, B.; Chai, F. Portable smartphone-integrated AuAg nanoclusters electrospun membranes for multivariate fluorescent sensing of Hg2+, Cu2+ and L-histidine in water and food samples. Food Chem. 2023, 418, 135961. [Google Scholar] [CrossRef]
  24. Zhang, X.-L.; Li, X.; Li, X.-T.; Gao, Y.; Feng, F.; Yang, G.-J. Electrochemiluminescence sensor for pentoxifylline detection using Au nanoclusters@graphene quantum dots as an amplified electrochemiluminescence luminophore. Sens. Actuators B Chem. 2019, 282, 927–935. [Google Scholar] [CrossRef]
  25. Jia, H.; Yang, L.; Dong, X.; Zhou, L.; Wei, Q.; Ju, H. Cysteine Modification of Glutathione-Stabilized Au Nanoclusters to Red-Shift and Enhance the Electrochemiluminescence for Sensitive Bioanalysis. Anal. Chem. 2022, 94, 2313–2320. [Google Scholar] [CrossRef] [PubMed]
  26. Zhang, B.; Chen, L.; Zhang, M.; Deng, C.; Yang, X. A Gold-silver bimetallic nanocluster-based fluorescent probe for cysteine detection in milk and apple. Spectrochim. Acta A Mol. Biomol. Spectrosc. 2022, 278, 121345. [Google Scholar] [CrossRef]
  27. Chandran, N.; Janardhanan, P.; Bayal, M.; Unniyampurath, U.; Pilankatta, R.; Nair, S.S. Label Free, Nontoxic Cu-GSH NCs as a Nanoplatform for Cancer Cell Imaging and Subcellular pH Monitoring Modulated by a Specific Inhibitor: Bafilomycin A1. ACS Appl. Bio Mater. 2020, 3, 1245–1257. [Google Scholar] [CrossRef]
  28. Li, C.; Zhang, X.; Guo, Y.; Seidi, F.; Shi, X.; Xiao, H. Naturally Occurring Exopolysaccharide Nanoparticles: Formation Process and Their Application in Glutathione Detection. ACS Appl. Mater. Interfaces 2021, 13, 19756–19767. [Google Scholar] [CrossRef]
  29. Tahir, F.L.F., Jr.; Aucelio, R.Q.; Cremona, M.; Padilha, J.S.; Margheri, G.; Zaman, Q.; Concas, G.C.; Gisbert, M.; Ali, S.; Toloza, C.A.T.; et al. Quenching of the Photoluminescence of Gold Nanoclusters Synthesized by Pulsed Laser Ablation in Water upon Interaction with Toxic Metal Species in Aqueous Solution. Chemosensors 2023, 11, 118. [Google Scholar] [CrossRef]
  30. Sadhanala, H.K.; Aryal, S.; Sharma, K.; Orpaz, Z.; Michaeli, S.; Gedanken, A. Nitrogen-doped carbon dots as a highly selective and sensitive fluorescent probe for sensing Mg2+ ions in aqueous solution, and their application in the detection and imaging of intracellular Mg2+ ions. Sens. Actuators B Chem. 2022, 366, 131958. [Google Scholar] [CrossRef]
  31. Chang, H.; Karan, N.S.; Shin, K.; Bootharaju, M.S.; Nah, S.; Chae, S.I.; Baek, W.; Lee, S.; Kim, J.; Son, Y.J.; et al. Highly Fluorescent Gold Cluster Assembly. J. Am. Chem. Soc. 2021, 143, 326–334. [Google Scholar] [CrossRef] [PubMed]
  32. Yi, L.; Hong, Y.; Weng, L.; Zhu, Y. Measurement of free heavy metal ion concentrations in soils using Donnan membrane technique. Chin. J. Geohem. 2005, 24, 184–188. [Google Scholar]
  33. Panhwar, A.H.; Kazi, T.G.; Afrid, H.I.; Shaikh, H.R.; Arain, S.A.; Arain, S.S.; Brahman, K.D. Evaluation of Calcium and Magnesium in Scalp Hair Samples of Population Consuming Different Drinking Water: Risk of Kidney Stone. Biol. Trace Elem. Res. 2013, 156, 67–73. [Google Scholar] [CrossRef]
  34. Olsen, J.E.; Kero, I.T.; Engh, T.A.; Tranell, G. Model of Silicon Refining During Tapping: Removal of Ca, Al, and Other Selected Element Groups. Metall. Mater. Trans. B 2017, 48, 870–877. [Google Scholar] [CrossRef] [Green Version]
  35. Xu, Y.; Xiang, S.; Zhou, H.; Wang, G.; Zhang, H.; Zhao, H. Intrinsic Pseudocapacitive Affinity in Manganese Spinel Ferrite Nanospheres for High-Performance Selective Capacitive Removal of Ca2+ and Mg2+. ACS Appl. Mater. Interfaces 2021, 13, 38886–38896. [Google Scholar] [CrossRef]
Scheme 1. Schematic illustration of (A) co-reduced synthesis of GSH@AuAg NCs and, (B) detection mechanism of Mg2+.
Chemosensors 11 00435 sch001
Figure 1. Condition optimization for GSH@AuAg NCs synthesis. (AC) Molar ratio of Au to Ag at pH 7–8 (A), pH 9–10 (B), and pH 11–12 (C) in the presence of 0.5 mM Au, 1 mM GSH, and 0.75 mM NaBH4. (DF) Concentration of GSH at pH 7–8 (D), pH 9–10 (E), and pH 11–12 (F) in the presence of 0.5 mM Au and Ag precursors, and 0.75 mM NaBH4. (GI) G, H, and I were the partial dates from (DF), respectively.
Chemosensors 11 00435 g001
Figure 2. Growth process of GSH@AuAg NCs. (A,D,G) UV-vis absorption spectra, (A,E,H) photos and (C,F,I) FL spectra of the mixtures (1) 0.5 mM HAuCl4, 0.5 mM AgNO3, 1 mM GSH, and 0.75 mM NaBH4 as control, and (2–5) (1) without the presence of HauCl4 (2), AgNO3 (3), GSH (4), and NaBH4 (5) for (AC); and 1 mM GSH, 0.75 mM NaBH4, and (1) 1 + 0, (2) 0 + 1, (3) 0.75 + 0.25, (4) 0.9 + 0.1, and (5) 0.5 + 0.5 mM Au + Ag precursors for (DF); the reaction time is 15 min. (GI) Effects of feeding orders: (a) pre-mixed GSH and Au precursor + Ag precursor and then NaBH4, (b,c) pre-reduced Au (b) or Ag (c) precursor with NaBH4 and GSH for 5 min + another precursor at (b1) 0.5 + 0.5, (b2) 0.75 + 0.25, and (b3) 0.9 + 0.1 mM Au + Ag precursors, (d) following the schematic order shown in (J).
Chemosensors 11 00435 g002
Figure 3. Characterization of GSH@AuAg NCs prepared using 0.5 mM HauCl4, 0.5 mM AgNO3, 1 mM GSH, and 0.75 mM NaBH4 at pH 7.5 and 25 °C within 15 min. (A) TEM, (B,C) HRTEM, (D) Particle-size distribution histogram; (E) AFM images of GSH@AuAg NCs. (F) Fluorescence excitation and emission spectra of GSH@AuAg NCs, and the inset showed the photograph of GSH@AuAg NCs (1) and water (2) under visible light (a) and UV light from gel imager (b). (G) Au and (H) Ag XPS spectra of GSH@AuAg NCs. (I) FT-IR spectra of GSH, GSH@AuAg NCs, and reduced synthesized AuAg NCs without GSH.
Chemosensors 11 00435 g003
Figure 4. Effect of pH on FL response. (A) FL spectra and (B) intensity of GSH@AuAg NCs at different pHs. (C) FL responses to 50 µM metal ions.
Chemosensors 11 00435 g004
Figure 5. Mechanism of Mg2+-induced FL enhancement. (A) TEM image of Mg2+-induced aggregates of GSH@AuAg NCs. (B) FL lifetime of GSH@AuAg NCs before (green) and after (yellow) incubating with Mg2+.
Chemosensors 11 00435 g005
Figure 6. Sensing performance of GSH@AuAg NCs toward Mg2+. (A) FL spectra of GSH@AuAg NCs after incubating with different concentrations of Mg2+. (B) Plot of FL intensity of GSH@AuAg NCs vs Mg2+ concentration. (C) FL spectra of GSH@AuAg NCs after incubating with different metal ions. (D) FL response of GSH@ AuAg NCs to different metal ions.
Chemosensors 11 00435 g006
Disclaimer/Publisher’s Note: The statements, opinions and data contained in all publications are solely those of the individual author(s) and contributor(s) and not of MDPI and/or the editor(s). MDPI and/or the editor(s) disclaim responsibility for any injury to people or property resulting from any ideas, methods, instructions or products referred to in the content.

