Abstract
Bisphenol A (BPA), an alkylphenolic compound, is one of the most polluting and hazardous organic chemicals. Its routine detection is, however, still rather expensive due to high-cost equipment. In this context, we applied the effect caused by BPA to the optical properties of surfactant-stabilized silver nanoparticles further modified with the use of ammonia (AgNP-NH3) to develop a simple and quantitative approach for BPA determination. The experimental conditions of the AgNP-NH3 probe were adjusted to establish a stable and sensitive response toward BPA in aqueous media. The use of probe dispersion measured at a wavelength of 403 nm enabled a limit of detection of 2.0 nmol L−1 (0.5 ng mL−1), with a linear response as a function of a concentration of BPA ranging from 10 to 120 nmol L−1 (from 2.2 to 27 ng mL−1). The use of vortex-assisted liquid–liquid microextraction ensured the application of selective determination to real tap and stream water samples, with recoveries ranging from 85.0 to 111%. The protocol developed herein is simple, sensitive, and selective, does not require the use of toxic labeling agents, and can be easily adapted for the routine analysis of BPA in different real samples.
1. Introduction
Bisphenol A (2,2-bis(4-hydroxyphenyl) propane (BPA)) is a synthetic polyphenol widely applied as a plasticizer in the production of the polyacrylates, phenol resins, and polyesters used in the fabrication of pipes, medical equipment, tubing, thermal papers, and plastic consumer products. Although many companies have banned the use of BPA in their plastic products, this compound is still found in consumer products targeted toward children [1,2]. This compound displays persistent estrogenic activity, negatively affecting the endocrine systems of both humans and animals, resulting in metabolic diseases and increasing the probability of cancer (i.e., breast and prostate glands) as well as adverse effects in other organs, such as the pancreas and liver, even at low concentrations, thus being considered a pollutant of emerging concern [3,4].
Due to its large-scale use, BPA is routinely detected in food items, water, and other environmental compartments, resulting in public health concerns. For this reason, the European Union (EU) has established a maximum daily intake of 0.05 mg kg−1 body weight and adopted a directive that bans the use of BPA in the manufacturing of infant feeding bottles, as this population is the most vulnerable to this type of contamination [5].
Bisphenol A quantification can be achieved by applying traditional analytical methods, i.e., spectrophotometric techniques, either alone or coupled with separation techniques [6]. High-performance liquid chromatography (HPLC) with photometric or fluorometric detections is the most widely applied analytical approach in this regard [7,8,9], although HPLC methods employing mass detectors have also been widely applied for BPA detection [1,10,11,12]. However, precolumn or postcolumn chemical derivatization is required for sensitive fluorometric detection to generate UV–Vis absorbing capabilities [7]. Gas chromatographic (GC) methods present lower limits of detection than HPLC, although the requirement for chemical derivatization to use silylation or acetylation to improve separation and detection makes GC-based methods more tedious and time-consuming [13]. These methods, however, still require expensive equipment and toxic reagents, and are also time-consuming.
Metal nanoparticle (NP) applications are an emerging field of research due to the unique characteristics of these compounds, which originate from their nanoscale size. Nanoparticle optical properties, referred to as localized surface plasmon resonance (LSPR), are now being explored in many sensing applications [14,15], especially those concerning silver nanoparticles (AgNPs), which are mostly explored due to their size-dependent optical characteristics in the visible electromagnetic radiation (EMR) region. Analytical sensors based on AgNPs that explore LSPR are advantageous when used to sense molecules presenting relatively low inherent optical properties in the UV–Vis region of the EMR spectrum. Many routes for the fabrication of these NPs have been reported, such as wet chemical approaches, mechanical preparation, photochemical synthesis, and electrochemical methods [16,17,18].
Functionalized AgNPs have been used as analytical probes in the determination of various analytes, many of which are environmental contaminants, due to their simple synthesis, cost-effectiveness, and high extinction coefficient [19]. Surface plasmon resonance (SPR) is an optical phenomenon observed when the surface conducting electrons of NPs are excited by electromagnetic radiation, leading to incoherent resonance oscillation within a particle. This unique property of AuNP and AgNP plays an important role in sensing applications. Mochi et al., for example, developed a method based on AgNPs functionalized with 3-mercapto-1 propanesulfonic acid sodium salt for the detection of the metal contaminants Ni2+ and Co2+ in water samples via coordinated compound formation, achieving a limit of detection of 0.5 mg L−1 [20]. In another study, the functionalization of AgNPs employing anionic surfactants, such as sodium dodecyl sulphate (SDS), has led to the development of a sensing platform for the detection of three thiocarbamate pesticides, Ziram, Zineb, and Maneb, with limits of detection of 149.3 ng mL−1, 4 ng mL−1, and 9.1 ng mL−1, respectively [21]. In a similar report, AgNPs were reduced and functionalized using gallic acid, demonstrating sensitivity toward aminoglycosides. This study employed radiometric spectrophotometry (A560/A400), within a linear range of 50 to 650 pmol L−1, with a limit of detection at the picomolar level. The authors proposed that the amine groups of the aminoglycosides are responsible for the observed particle–analyte interactions. The developed sensor was then applied to the determination of streptomycin in complex samples such as serum and milk [22]. In another assessment, a simple approach was proposed for the colorimetric detection of ammonia, in which optical responses were monitored using smartphones. The changes in the surface plasmon resonance bands of AgNPs were confirmed due to the formation of a (Ag NH3)+ complex, decreasing the number of AgNPs. The dispersion color was monitored via red, green, and blue (RGB) color sensor measurements, and further spectrophotometric analyses. The limit of detection for ammonia when employing the RGB and spectrophotometric methods was 180 and 200 mg L−1, respectively [23]. Nishan et al. proposed a drug-mediated synthesis of AgNPs with further modifications using 1-H-3-methylimidazolium acetate ionic liquid. The functionalized AgNPs were then applied as probes for dopamine detection after optimization, with SPR signal changes directly proportional to a concentration range of 1 × 10⁻⁸ mol L−1 to 3.6 × 10⁻⁶ mol L−1. This probe was then applied for the detection of dopamine in physiological samples [24].
The colorimetric detection of BPA is mostly performed with specific aptamers applied as the biological recognition platform, such as the aggregation of gold nanoparticles via BPA-specific aptamer and cationic polymers. In this regard, the proposed aptasensor enabled the colorimetric and electrochemical detection of BPA at concentrations as low as trace levels [25,26]. However, aptasensors suffer from certain shortcomings, such as effects due to background color, time-consuming designs, and interferences from both the matrix and the external environment. In this context, the aim of the present study was to assess interactions between an aqueous AgNPs-NH3 dispersion and BPA, establishing experimental conditions to develop a sensitive and reliable probe without the use of chemical derivatization and sophisticated equipment.
2. Experimental
2.1. Apparatus
The UV–Vis spectral measurements were performed on a double-beam spectrophotometer (Spectro Lab., Shanghai, China, Model-UV 2601) with 1.0 cm pathlength quartz cuvettes. The pH measurements were obtained using a digital pH meter, Model-Adwa,(Hungary) AD1020, Ph/Mv/ISE, and temperature meter equipped with a glass working electrode. A Ag/AgCl electrode was used as a reference. All of the reagents were weighed on an analytical OHAUS balance (Nänikon, Switzerland). The nanoparticles were synthesized using a hotplate (Model BS-2H) and magnetic stirring (Model BS-2H). The size distribution and zeta potential of the prepared nanoparticles were assessed using a ZS90 zetasizer (Malvern, UK). Nanoparticle SEM images were obtained using an SM-5910 scanning electron microscope model (JEOL, Tokyo, Japan).
2.2. Reagents and Chemicals
Bisphenol A (BPA), polyethylene glycol monododecyl ether (Bj-35), sodium dodecyl sulfate (SDS), and hexadecyltrimethylammonium bromide (CTAB) were obtained from Sigma-Aldrich (St. Louis, MO, USA). Sodium hydroxide, sodium chloride, hydrochloric acid, octanol, ethanol, and methanol were obtained from Merck (Darmstadt, Germany). AgNO3, sodium borohydride (NaBH4), NH4OH, SDS, MgSO4, NiCl2, HgCl2 FeCl3, KCl, CdCl2, PbSO4, and NaCl were of an analytical grade.
2.3. Preparation of the Aqueous Nanoparticles Dispersion
Surfactant-stabilized AgNPs were prepared by adding a AgNO3 (0.01 mol L−1) solution, dropwise, to a sodium borohydride (NaBH4) and Bj-35 mixture under vigorous stirring at room temperature. The reaction mixture of the reducing and stabilizing agents was prepared by mixing 3.8 mg of sodium borohydride (NaBH4) and 20.0 mg of Bj-35 with 50 mL of deionized water under gentle stirring at room temperature for 30 min. The addition of dropwise AgNO3 was performed at room temperature until the appearance of a pale-yellow color, which was confirmed via the UV–Vis spectra as the formation of silver nanoparticles. The Ag concentration of the dispersion was 5 × 10⁻⁵ mol L−1 based on the amount of AgNO3 used as a precursor for nanoparticle synthesis.
2.4. Solution, Standards, and Aqueous Dispersions
A stock solution of the analyte (1.0 × 10⁻³ mol L−1) was prepared by dissolving an appropriate amount of BPA in ethanol, and working standards were prepared via further dilution in deionized water. Working dispersions of Bj-35-stabilized silver nanoparticles (analytical probes) were prepared by adding different amounts of the synthesized dispersion to a 5.0 mL volumetric flask and adjusting the volume with deionized water. The AgNPs-NH3 conjugate was prepared by mixing a 4.5 × 10⁻⁶ mol L−1 aqueous ammonia and dispersion with a 1.6 × 10⁻⁵ mol L−1 Ag concentration.
2.5. BPA Detection via a Conjugate Probe
The spectrophotometric batch analysis employing the AgNPs-NH3 conjugate probe, at 4.5 × 10⁻⁶ mol L−1 aqueous ammonia, and a dispersion (1.6 × 10⁻⁵ mol L−1) was performed by scanning from 300 to 700 nm and adjusting the spectral bandpass to 10.0 nm. Different volumes of BPA standards were added to the working dispersion before the final volume adjustment. These mixtures were then transferred to the quartz cuvettes to measure absorbances, and blank measurements were performed in the aqueous AgNPs-NH3 conjugate dispersion in the absence of BPA. Cuvettes were always immersed in nitric acid (10% v/v) and washed with deionized water between each measurement.
2.6. Vortex-Assisted Liquid–Liquid Microextraction (VALLME)
Tap water samples were analyzed for BPA without pretreatment, while stream water samples from a local lake in Pakistan were filtered through a filter with a pore size of 0.45 µm to remove particulate matter. Subsequently, the aqueous samples spiked with known amounts of BPA were placed in a Teflon tube, followed by the addition of 50 µL of octanol, acting as the extractant reagent. The mixture was then subjected to vortex agitation for 90 s to produce fine droplets, enabling the mass transfer of BPA to the organic phase. The two phases were then separated by centrifugation for 2.0 min at 3500 rpm. The floating phase was collected with the aid of a micropipette and allowed to react with the AgNPs-NH3 conjugate probe for the detection of BPA.
3. Results and Discussion
3.1. Characterization of BJ-35-AgNPs
The nonionic surfactant BJ-35 acts as a capping and stabilizing agent in the synthesis of AgNP dispersion. The oxyethylene groups and hydroxyl groups in Bj-35 surfactants are responsible for capping the AuNPs [27]. Finally, the color change in the reaction mixture from colorless to pale yellow indicates the reduction of silver ions and subsequent formation of surfactant-modified silver nanoparticles. Nanoparticle formation was also confirmed via the absorbance spectra and scanning electron microscopic (SEM) images. The obtained SEM image displayed in Figure 1A shows particles at the nanometric scale, while Figure 1B shows the best fit of the experimental statistical distribution obtained by a log-normal function. The size statistical distribution of Figure 1A was further utilized to perform the theoretical fit of Mie with quadrupole orders on the experimental extinction spectra of the colloidal dispersion of AgNPs (Figure 1C). The theoretical plot was processed by using code developed using Matlab® R2017a software. The matching between the experimental and the theoretical extinction spectra is coherent, supporting the reliability of the size of AgNPs obtained via SEM. The size of the particle dispersion at a pH of ~9 was also confirmed using a zetasizer, revealing a hydrodynamic size in the range of 30 to 60 nm and probe stability, with a zeta potential of −19.8 mV.

Figure 1.
(A) SEM image of AgNPs. (B) Histogram indicating nanoparticle size distribution obtained via a log-normal function. (C) Comparison between the experimental (grey circles) and theoretical (continuous black line) absorption spectra of the AgNPs.
3.2. Preliminary Studies
Initially, BPA was added to the AgNP dispersion at various concentration levels. However, the presence of BPA did not affect the spectral position of the probe dispersion over 120 min. Subsequently, the surface of the AgNPs was modified with the addition of ammonia, denoted as AgNPs-NH3. In contrast to the unmodified probe analyte addition decreasing the absorbance of AgNPs-NH3, corroborating previous studies indicate that ammonia acts as a ligand to form a complex (Ag (NH3)2+) with silver ions [28]. Finally, indirect BPA determination was conducted from the decreases in the SPR intensity of the AgNP-NH3 conjugate.
3.3. Optimization of Experimental Analytical Probe Conditions
3.3.1. Ammonia Amounts
Absorbance measurements of the AgNPs were performed after the addition of various amounts of NH3, aiming at a sensitive response of the probe towards BPA. The addition of an ammonia solution of 10 to 60 µL from a 3 × 10⁻⁴ mol L−1 stock solution to the AgNP dispersion decreased the SPR NP band, confirming the formation of a AgNPs-NH3 conjugate. The results of the probe interaction (Figure 2) with 80 nmol L−1 of BPA containing various amounts of NH3 is indicated as a change in absorbance (Ao−A), where Ao is the absorbance of a AgNPs-NH3 conjugate before and after BPA addition. The addition of 30 µL of ammonia solution to AgNPs followed by BPA treatment resulted in a maximum plasmonic resonance change, which remained constant following the further addition of ammonia.
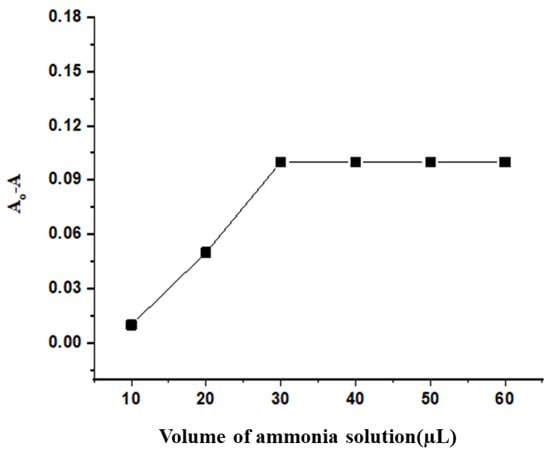
Figure 2.
Evaluation of the effect of ammonia concentrations on the probe response towards BPA (80 nmol L−1) in an aqueous dispersion.
3.3.2. Amount of AgNPs-NH3 Probe
Another assessment was performed to establish the experimental conditions to produce a working probe dispersion with a sensitive and reproducible response to BPA. The working dispersions were prepared using a stock dispersion/water (% v/v), and the response of the varying amounts of the AgNPs-NH3 conjugate, as 25, 33, 50, and 100%, in the final volume to the presence of BPA (60 nmol L−1), is depicted in Figure 3. The most significant and sensitive response from the AgNPs-NH3 conjugate was achieved at a concentration of 33% (1.6 × 10⁻⁵ mol L−1 Ag concentration of the dispersion). Some studies indicate that much lower concentrations than this produced narrow and less sensitive analytical responses, while higher concentrations increased measurement uncertainty [29].
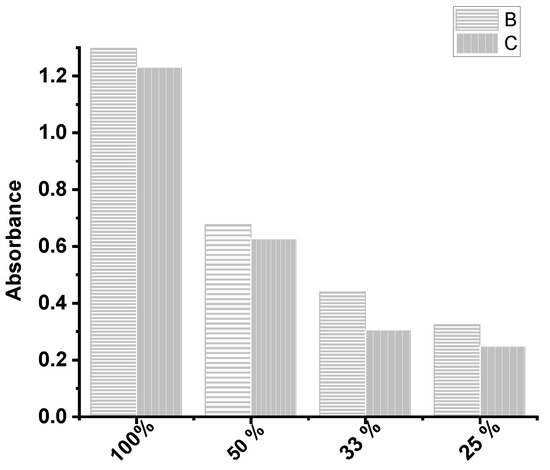
Figure 3.
Effect of the amount of AgNPs (shown as % in the dispersion) on the absorbance intensity (B) before and (C) after the addition of 60 nmol L−1 BPA.
3.3.3. Stability of the AgNP-NH3 Conjugate and Response Time
Nanoparticle stability is an important parameter for practical applications. Silver nanoparticles are only stable if the silver is fully capped by a stabilizing agent, while empty surface spaces can cause aggregations [30]. The absorbance of the AgNPs-NH3 dispersion was monitored as a function of time from 2 to 60 min after dilution with deionized water, with no change in the plasmonic resonance within the monitored range (Figure 4). Absorbances were then evaluated as a function of time (every 5 min up to 60 at room temperature) after the addition of 40 nmol L−1 BPA. The results are reported as changes in absorbance (Ao−A), indicating a promptly decreasing absorbance, stabilizing during the entire monitored time of 60 min, with random signal variations of less than 2%. The established response time for the proposed protocol was, therefore, 20 min after the addition of BPA to the probe.
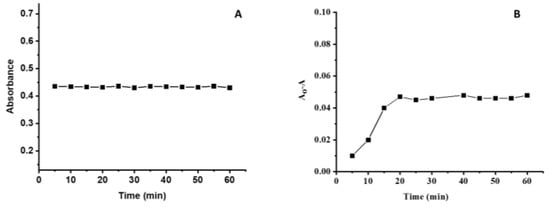
Figure 4.
(A) Stability of the optical response of the AgNPs-NH3 probe dispersion. (B) Stability of the optical response of the AgNPs-NH3 probe dispersion after the addition of 40.0 nmol L−1 BPA.
3.3.4. Effect of pH
The hydronium ion concentration of the medium plays an important role in probe stability and subsequent analyte interaction with NPs’ surfaces. The pH of the medium of the AgNPs-NH3 conjugate was adjusted from 2.0 to 12.0. The maximum absorbance was recorded in basic media, corroborating previous reports that nanoparticles are highly stable in basic media compared to acidic media. For BPA detection, the most effective pH was found to be above 8 (Figure 5), where analyte addition induced significant spectral profile variations. In aqueous solutions, BPA is present in its molecular form at low pH values (pKa of BPA = 9.6–10.2) and will lose protons at higher values. Thus, at a pH around its pKa values, approximately 50% of BPA molecules are deprotonated, resulting in bisphenoxide anions. Previous studies indicate that the ammonia can form a positively charged complex with silver ions, responsible for the reaction with bisphenoxide anions [28].

Figure 5.
Effect of pH values on the absorption of the AgNPs-NH3 dispersion. B—Probe without the addition of BPA. C—Probe dispersion after the addition of 50 nmol L−1 BPA.
3.3.5. Effect of the Surfactants on the Response of the Probe
Media organization due to the presence of surfactants may contribute to NP dispersion signal stabilization via potential interactions with the silver surface. It is worth noting that although Bj-35 is used as a capping agent, surface defects are still available in the silver–ammonia complex. Considering this, further studies were conducted to investigate the effect of organized surfactant media on nanoparticle–bisphenol interactions. Different surfactants, namely CTAB (cationic) and SDS (anionic), at concentrations below, near, and above their (critical micellar concentration) CMCs, were incorporated into the AgNPs-NH3 probe before the addition of BPA. The addition of CTAB caused insignificant effects on the spectral profile of the conjugate probe dispersion, but the addition of BPA is expected to strongly interact with the quaternary ammonium cations of the CTAB in the pi-electron cloud of the aromatic nucleus of the analyte, leading to induced absorbance changes. It has been reported that some neutral aromatic compounds undergo weak but specific interactions with the quaternary ammonium head groups in cationic micelles, barring the interaction of the BPA with the conjugate surface [31]. The addition of SDS resulted in a reduction in the spectral profile of the conjugate, as the anionic head of SDS strongly interacts with the positively charged conjugate, hindering BPA interactions with the conjugate surface.
3.4. Analytical Characteristics of the AgNPs-NH3 Probe for BPA Detection
The quantification of BPA using the developed AgNPs-NH3 conjugate probe was carried out by applying the optimized conditions listed in Table 1. Figure 6 indicates that probe absorbance gradually decreased with increasing BPA amounts, up to 120 nmol L−1, remaining constant with the addition of higher amounts. Probe evaluation was performed by analyzing an analytical curve constructed using the net change in absorbance (Ao−A) versus the assessed BPA concentration (Figure 7A,B). The linear response (R2 = 0.998) covered a wide range, from final BPA concentrations of 10 nmol L−1 (2.2 ng mL−1) to 120 nmol L−1 (27 ng mL−1). The equation model regression curve was (Ao−A) = 1.2 × 10⁶ [ BPA] + 0.009. The limit of detection (LOD) was 2.0 nmol L−1 (0.5 ng mL−1), calculated as 3 Sb/m, and the limit of quantification was 20.0 nmol L−1, calculated as 10 Sb/m, where Sb is the measured standard deviation of the AgNPs-NH3 conjugate (4.5 × 10⁻⁶ mol L−1 aqueous ammonia and dispersion 1.6 × 10⁻⁵ mol L−1) and m is the curve sensitivity [32]. The instrumental precision (2.3%) of the proposed AgNPs-NH3 probe-based method was evaluated via the coefficient of variation in the signal produced through the replicate analysis of ten BPA aliquots at the same concentration (50 nmol L−1). Intermediary precision (2.5%) was calculated through the coefficient of variation of the BPA recovery attained through ten independent analyte analyses at 50 nmol L−1 (Table 2).

Table 1.
Optimized experimental conditions for BPA detection, applying the developed AgNPs-NH3 probe.
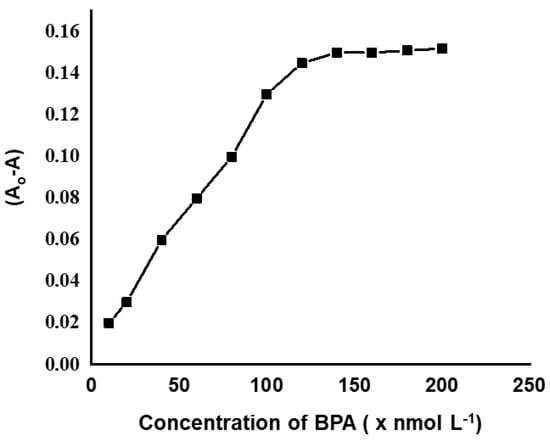
Figure 6.
The response of the AgNPs-NH3 probe in the presence of increasing concentrations (10–200 nmol L−1) of BPA.
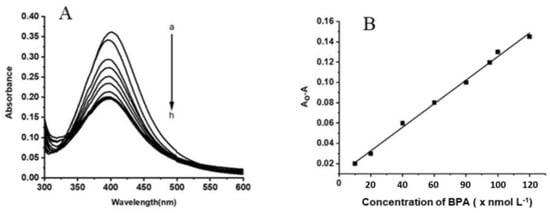
Figure 7.
(A) The absorption spectra of the AgNPs-NH3 probe in the presence of increasing concentrations of BPA. Lines a–h: 0.0; 10.0; 20.0; 40.0; 60.0; 80.0; 100.0; 120.0; 140.0; 160.0; and 180.0 nmol L−1. (B) Analytical curve based on the decreased intensity of the absorbance of AgNPs expressed as Ao−A as a function of BPA concentration.

Table 2.
Analytical figures of merit of the proposed probe for the detection of BPA.
3.5. Selectivity Studies
Prior to testing the developed probe in real water samples, the effects of relevant interfering studies were assessed, which comprised selected metals’ anions and cations generally found in aquatic environments. The selectivity studies were carried out in triplicate, and the degree of the signal variation from the AgNPs-NH3 conjugate probe to the presence of these chemical substances was calculated as (Ao−A) × 100. The results revealed that the optical response of the AgNPs-NH3 dispersion is not significantly affected by the presence of these chemical species under the experimental conditions established for BPA detection, with a probe signal variation of less than 4% to three orders of magnitude of the interferent concentrations in comparison to the analyte (Table 3). In contrast, the presence of much lower amounts of BPA (measured in nmol L−1) caused an about 10% alteration in the probe intensity. Consequently, the presence of anions or cations does not interfere in the detection of BPA when utilizing the established AgNPs-NH3 probe method.

Table 3.
Effect of some potential interfering chemical substances on the absorbance of the AgNPs-NH3 probe dispersion.
3.6. Jobs Plot
The binding stoichiometry between the AgNPs-NH3 conjugate probe and BPA was investigated by the job plot method of continuous variation [33]. A series of solutions was prepared, each containing the same total moles of the AgNPs-NH3 conjugate probe (based on Ag dispersion concentrations) and BPA but at different ratios, e.g., 1:9 to 9:1 with respect to the AgNPs-NH3 conjugate probe and BPA. The observed changes in the absorption intensity of the AgNPs-NH3 conjugate probe were plotted as a function of BPA mole fractions (BPA/BPA + AgNPs-NH3), as depicted in Figure 8. The maximum change was observed at a mole fraction value of 0.6, revealing a 1:3 (AgNPs: BPA) binding stoichiometry between the probe and BPA.
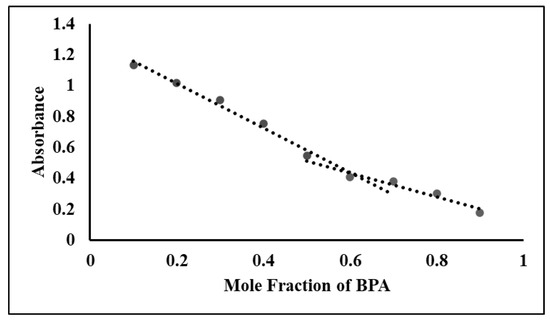
Figure 8.
Jobs plot of the mole fraction of BPA as a function of absorbance.
3.7. Method Application to Real Water Samples
BPA determination employing the AgNPs-NH3 probe was tested by quantifying BPA in real water samples spiked at three concentration levels, namely 40 nmol L−1, 60 nmol L−1, and 80 nmol L−1 (Table 4). In all three cases, the samples were subjected to octanol-based VALLME prior to SPR band measurements. The recoveries in tap water samples ranged from 93 to 113%, while in stream water samples they ranged from 85 to 90%. The calculated recoveries were satisfactory considering the amount of BPA in the probe. Our ammonia-mediated AgNP probe method is, therefore, simple and selective, achieved by VALLME for the detection of trace quantities of BPA in aqueous samples, and extendable to more complex samples.

Table 4.
Recovery (n = 3) results for BPA using the developed AgNPs-NH3 probe method for fortified tap water and stream water samples.
The results indicate that the proposed method is adequate for the detection of BPA in real water samples, which have been reported as ranging from 17.6 to 324 ng L–1 in bottled water and averaging 317 ng L–1 in tap water in China [34], at concentrations of 20, 21, 18, and 40 ng L–1 in tap water, well water, river water, and rainwater samples from Nigeria [35], respectively, between 3.7 ng L–1 and 50.3 ng L–1 in tap water from [36], and from 13 to 37 ng L–1 in influents to wastewater treatment plants in Malaysia [37].
4. Conclusions
The aqueous dispersion of AgNPs-NH3 developed here is a sensitive probe for the indirect determination of BPA following the optimization of experimental conditions for a sensitive and selective response. The achieved limit of detection was 2.0 nmol L−1 of BPA in the working dispersion. The use of vortex-assisted liquid–liquid microextraction ensured the selectivity towards the targeted analyte in complex environmental samples. The approach was tested in real samples with satisfactory recoveries at the ng level of concentration ranges. The proposed probe is simple and does not require the use of expensive and hazardous chemicals or tedious derivatization procedures, comprising an interesting alternative for monitoring efforts of BPA as an aquatic environment contaminant.
Author Contributions
Conceptualization, Z. and S.K.; methodology, Z., S.K. and Z.A.S.; software, R.U. and S.K.; validation, R.U., E.A.A. and C.A.T.T.; formal analysis, Z. and C.A.T.T.; investigation, R.A.H.-D.; resources, R.U. and E.A.A.; data curation, Z. and R.A.H.-D.; writing—original draft preparation, Z., S.K., U.M. and R.A.H.-D.; writing—review and editing, R.A.H.-D.; visualization, Z. and S.K.; supervision, S.K. and R.U.; project administration, E.A.A.; funding acquisition, R.U. All authors have read and agreed to the published version of the manuscript.
Funding
The research work was supported by researchers supporting project number (RSP2023R45) at King Saud University Riyadh Saudi Arabia.
Institutional Review Board Statement
Not applicable.
Informed Consent Statement
Not applicable.
Data Availability Statement
Not applicable.
Acknowledgments
The authors wish to thank Researchers Supporting Project number (RSP2023R45) at King Saud University Riyadh Saudi Arabia for financial support.
Conflicts of Interest
The authors declare no conflict of interest.
References
- Frederiksen, H.; Aksglaede, L.; Sorensen, K.; Nielsen, O.; Main, K.M.; Skakkebaek, N.E.; Juul, A.; Andersson, A.-M. Bisphenol A and other phenols in urine from Danish children and adolescents analyzed by isotope diluted TurboFlow-LC–MS/MS. Int. J. Hyg. Environ. Health 2013, 216, 710–720. [Google Scholar] [CrossRef] [PubMed]
- Kumar, P.; Aruna Priyanka, R.; Shalini Priya, P.; Gunasree, B.; Srivanth, S.; Jayasakthi, S.; Kapoor, A.; MuthuKumar, R. Bisphenol A contamination in processed food samples: An overview. Int. J. Environ. Sci. Technol. 2023, 20, 1–20. [Google Scholar] [CrossRef]
- Hoshyar, S.A.; Barzani, H.A.; Yardım, Y.; Şentürk, Z. The effect of CTAB, a cationic surfactant, on the adsorption ability of the boron-doped diamond electrode: Application for voltammetric sensing of Bisphenol A and Hydroquinone in water samples. Colloids Surf. A Physicochem. Eng. Asp. 2021, 610, 125916. [Google Scholar] [CrossRef]
- Chen, X.; Wang, C.; Tan, X.; Wang, J. Determination of bisphenol A in water via inhibition of silver nanoparticles-enhanced chemiluminescence. Anal. Chim. Acta 2011, 689, 92–96. [Google Scholar] [CrossRef]
- European Commission. Regulation (EU) No 1169/2011 of the European Parliament and of the Council of 25 October 2011 on the provision of food information to consumers, amending Regulations (EC) No 1924/2006 and (EC) No 1925/2006 of the European Parliament and of the Council, and repealing Commission Directive 87/250/EEC, Council Directive 90/496/EEC, Commission Directive 1999/10/EC, Directive 2000/13/EC of the European Parliament and of the Council, Commission Directives 2002/67/EC and 2008/5/EC and Commission Regulation (EC) No 608/2004. Off. J. Eur. Union 2011, 304, 18–63. [Google Scholar]
- Zhuang, Y.; Zhou, M.; Gu, J.; Li, X. Spectrophotometric and high performance liquid chromatographic methods for sensitive determination of bisphenol A. Spectrochim. Acta Part A Mol. Biomol. Spectrosc. 2014, 122, 153–157. [Google Scholar] [CrossRef]
- Braunrath, R.; Podlipna, D.; Padlesak, S.; Cichna-Markl, M. Determination of bisphenol A in canned foods by immunoaffinity chromatography, HPLC, and fluorescence detection. J. Agric. Food Chem. 2005, 53, 8911–8917. [Google Scholar] [CrossRef]
- Brenn-Struckhofova, Z.; Cichna-Markl, M. Determination of bisphenol A in wine by sol-gel immunoaffinity chromatography, HPLC and fluorescence detection. Food Addit. Contam. 2006, 23, 1227–1235. [Google Scholar] [CrossRef] [PubMed]
- Kang, J.-H.; Kondo, F. Determination of bisphenol A in milk and dairy products by high-performance liquid chromatography with fluorescence detection. J. Food Prot. 2003, 66, 1439–1443. [Google Scholar] [CrossRef]
- Dreolin, N.; Aznar, M.; Moret, S.; Nerin, C. Development and validation of a LC–MS/MS method for the analysis of bisphenol a in polyethylene terephthalate. Food Chem. 2019, 274, 246–253. [Google Scholar] [CrossRef]
- Ashley-Martin, J.; Gaudreau, É.; Dumas, P.; Liang, C.L.; Logvin, A.; Bélanger, P.; Provencher, G.; Gagne, S.; Foster, W.; Lanphear, B. Direct LC-MS/MS and indirect GC–MS/MS methods for measuring urinary bisphenol A concentrations are comparable. Environ. Int. 2021, 157, 106874. [Google Scholar] [CrossRef]
- Jurek, A.; Leitner, E. Analytical determination of bisphenol A (BPA) and bisphenol analogues in paper products by LC-MS/MS. Food Addit. Contam. Part A 2018, 35, 2256–2269. [Google Scholar] [CrossRef]
- Caban, M.; Stepnowski, P. The quantification of bisphenols and their analogues in wastewaters and surface water by an improved solid-phase extraction gas chromatography/mass spectrometry method. Environ. Sci. Pollut. Res. 2020, 27, 28829–28839. [Google Scholar] [CrossRef] [PubMed]
- Guo, X.; Wu, Z.; Li, W.; Wang, Z.; Li, Q.; Kong, F.; Zhang, H.; Zhu, X.; Du, Y.P.; Jin, Y. Appropriate size of magnetic nanoparticles for various bioapplications in cancer diagnostics and therapy. ACS Appl. Mater. Interfaces 2016, 8, 3092–3106. [Google Scholar] [CrossRef]
- Chen, L.; Li, H.; He, H.; Wu, H.; Jin, Y. Smart plasmonic glucose nanosensors as generic theranostic agents for targeting-free cancer cell screening and killing. Anal. Chem. 2015, 87, 6868–6874. [Google Scholar] [CrossRef]
- Hanada, N.; Ichikawa, T.; Fujii, H. Catalytic effect of nanoparticle 3d-transition metals on hydrogen storage properties in magnesium hydride MgH2 prepared by mechanical milling. J. Phys. Chem. B 2005, 109, 7188–7194. [Google Scholar] [CrossRef]
- Khalililaghab, S.; Momeni, S.; Farrokhnia, M.; Nabipour, I.; Karimi, S. Development of a new colorimetric assay for detection of bisphenol-A in aqueous media using green synthesized silver chloride nanoparticles: Experimental and theoretical study. Anal. Bioanal. Chem. 2017, 409, 2847–2858. [Google Scholar] [CrossRef]
- Zhang, Y.; Yuan, X.; Wang, Y.; Chen, Y. One-pot photochemical synthesis of graphene composites uniformly deposited with silver nanoparticles and their high catalytic activity towards the reduction of 2-nitroaniline. J. Mater. Chem. 2012, 22, 7245–7251. [Google Scholar] [CrossRef]
- Qadri, T.; Khan, S.; Begum, I.; Ahmed, S.; Shah, Z.A.; Ali, I.; Ahmed, F.; Hussain, M.; Hussain, Z.; Rahim, S. Synthesis of phenylbenzotriazole derivative stabilized silver nanoparticles for chromium (III) detection in tap water. J. Mol. Struct. 2022, 1267, 133589. [Google Scholar] [CrossRef]
- Mochi, F.; Burratti, L.; Fratoddi, I.; Venditti, I.; Battocchio, C.; Carlini, L.; Iucci, G.; Casalboni, M.; De Matteis, F.; Casciardi, S. Plasmonic sensor based on interaction between silver nanoparticles and Ni2+ or Co2+ in water. Nanomaterials 2018, 8, 488. [Google Scholar] [CrossRef]
- Ghoto, S.A.; Khuhawar, M.Y.; Jahangir, T.M. Silver nanoparticles with sodium dodecyl sulfate as colorimetric probe for detection of dithiocarbamate pesticides in environmental samples. Anal. Sci. 2019, 35, 631–637. [Google Scholar] [CrossRef]
- Ghodake, G.; Shinde, S.; Saratale, R.G.; Kadam, A.; Saratale, G.D.; Syed, A.; Marraiki, N.; Elgorban, A.M.; Kim, D.Y. Silver nanoparticle probe for colorimetric detection of aminoglycoside antibiotics: Picomolar-level sensitivity toward streptomycin in water, serum, and milk samples. J. Sci. Food Agric. 2020, 100, 874–884. [Google Scholar] [CrossRef]
- Amirjani, A.; Fatmehsari, D.H. Colorimetric detection of ammonia using smartphones based on localized surface plasmon resonance of silver nanoparticles. Talanta 2018, 176, 242–246. [Google Scholar] [CrossRef]
- Nishan, U.; Gul, R.; Muhammad, N.; Asad, M.; Rahim, A.; Shah, M.; Iqbal, J.; Uddin, J.; Shujah, S. Colorimetric based sensing of dopamine using ionic liquid functionalized drug mediated silver nanostructures. Microchem. J. 2020, 159, 105382. [Google Scholar] [CrossRef]
- Zhang, D.; Yang, J.; Ye, J.; Xu, L.; Xu, H.; Zhan, S.; Xia, B.; Wang, L. Colorimetric detection of bisphenol A based on unmodified aptamer and cationic polymer aggregated gold nanoparticles. Anal. Biochem. 2016, 499, 51–56. [Google Scholar] [CrossRef]
- Saygılı-Canlıdinç, R.; Caglayan, M.O.; Kariper, İ.A.; Üstündağ, Z.; Şahin, S. Aptamer-based impedimetric label-free detection of bisphenol A from water samples using a gold nanoparticle-modified electrochemical nanofilm platform. J. Appl. Electrochem. 2023, 53, 1–10. [Google Scholar] [CrossRef]
- Jang, M.H.; Kim, J.K.; Yoo, H. Nonionic brij surfactant-mediated synthesis of raspberry-like gold nanoparticles with high surface area. J. Nanosci. Nanotechnol. 2012, 12, 4088–4092. [Google Scholar] [CrossRef]
- Guo, H.; Tao, S. Silver nanoparticles doped silica nanocomposites coated on an optical fiber for ammonia sensing. Sens. Actuators B Chem. 2007, 123, 578–582. [Google Scholar] [CrossRef]
- Miranda-Andrades, J.R.; Pérez-Gramatges, A.; Pandoli, O.; Romani, E.C.; Aucélio, R.Q.; da Silva, A.R. Spherical gold nanoparticles and gold nanorods for the determination of gentamicin. Spectrochim. Acta Part A Mol. Biomol. Spectrosc. 2017, 172, 126–134. [Google Scholar] [CrossRef]
- Restrepo, C.V.; Villa, C.C. Synthesis of silver nanoparticles, influence of capping agents, and dependence on size and shape: A review. Environ. Nanotechnol. Monit. Manag. 2021, 15, 100428. [Google Scholar] [CrossRef]
- Chakraborty, G.; Chowdhury, M.P.; Hassan, P.; Tsuchiya, K.; Torigoe, K.; Saha, S.K. Interaction of Tyrosine Analogues with Quaternary Ammonium Head Groups at the Micelle/Water Interface and Contrasting Effect of Molecular Folding on the Hydrophobic Outcome and End-Cap Geometry. J. Phys. Chem. B 2018, 122, 2355–2367. [Google Scholar] [CrossRef]
- Toloza, C.A.; Almeida, J.M.; Khan, S.; Dos Santos, Y.G.; da Silva, A.R.; Romani, E.C.; Larrude, D.G.; Freire, F.L., Jr.; Aucélio, R.Q. Gold nanoparticles coupled with graphene quantum dots in organized medium to quantify aminoglycoside anti-biotics in yellow fever vaccine after solid phase extraction using a selective imprinted polymer. J. Pharm. Biomed. Anal. 2018, 158, 480–493. [Google Scholar] [CrossRef]
- Boruah, B.S.; Daimari, N.K.; Biswas, R. Functionalized silver nanoparticles as an effective medium towards trace determination of arsenic (III) in aqueous solution. Results Phys. 2019, 12, 2061–2065. [Google Scholar] [CrossRef]
- Li, X.; Ying, G.-G.; Su, H.-C.; Yang, X.-B.; Wang, L. Simultaneous determination and assessment of 4-nonylphenol, bisphenol A and triclosan in tap water, bottled water and baby bottles. Environ. Int. 2010, 36, 557–562. [Google Scholar] [CrossRef]
- Maduka Ignatius, C.; Ezeonu Francis, E.; Neboh Emeka, E.; Shu Elvis, N.; Ikekpeazu Ebele, J. BPA and environmental estrogen in potable water sources in Enugu municipality, South-East, Nigeria. Bull. Environ. Contam. Toxicol. 2010, 85, 534–537. [Google Scholar] [CrossRef]
- Esteban, S.; Gorga, M.; González-Alonso, S.; Petrovic, M.; Barceló, D.; Valcárcel, Y. Monitoring endocrine disrupting compounds and estrogenic activity in tap water from Central Spain. Environ. Sci. Pollut. Res. 2014, 21, 9297–9310. [Google Scholar] [CrossRef]
- Santhi, V.; Sakai, N.; Ahmad, E.; Mustafa, A. Occurrence of bisphenol A in surface water, drinking water and plasma from Malaysia with exposure assessment from consumption of drinking water. Sci. Total Environ. 2012, 427, 332–338. [Google Scholar] [CrossRef]
Disclaimer/Publisher’s Note: The statements, opinions and data contained in all publications are solely those of the individual author(s) and contributor(s) and not of MDPI and/or the editor(s). MDPI and/or the editor(s) disclaim responsibility for any injury to people or property resulting from any ideas, methods, instructions or products referred to in the content. |
© 2023 by the authors. Licensee MDPI, Basel, Switzerland. This article is an open access article distributed under the terms and conditions of the Creative Commons Attribution (CC BY) license (https://creativecommons.org/licenses/by/4.0/).