Abstract
The cobalt metal–organic framework (Co-MOF) is a kind of crystalline porous material within a periodic network structure, which is formed via the self-assembly of a Co metal center and a bridged organic ligand. In this paper, a Co-MOF was facilely synthesized via an ultrasonic method and applied to enhance the chemiluminescence (CL) emission of the NaIO4-H2O2 system. The synthesized Co-MOF was nanosheet-like in nature and stacked in 2–3-micrometer flower shapes. Compared to the NaIO4-H2O2 system without a Co-MOF, the CL intensity of the Co-MOF-NaIO4-H2O2 system was enhanced about 70 times. This CL mechanism was determined to be a result of the synergistic effects of chemiluminescence resonance energy transfer (CRET) and electron–hole annihilation (EHA). The Co-MOF not only acted as a catalyst to accelerate the generation of reactive oxygen species in the CL reaction, but also worked as an emitter to further enhance the CL. Based on the Co-MOF-NaIO4-H2O2 system, a highly sensitive CL analysis method was established for pyrogallol (PG) detection. Addition of PG into the CL system generated 1O2*, which could transfer energy to the Co-MOF and further enhance the CL response. The enhanced CL was linear with the PG concentration. The CL analysis method exhibited a linear range of 1 × 10⁻⁴ M to 1 × 10⁻⁷ M, as well as having a linear correlation coefficient of 0.9995 and a limit of detection of (S/N = 3) of 34 nM.
1. Introduction
Pyrogallol (PG) belongs to the phenol family and is inherently toxic. However, as it is a chemical reagent and chemical raw material, PG is widely used in pharmaceutical synthesis, cosmetics, dyeing materials, and electronic products [1]. In the biomedical field, the interactions between PG analogs and biomacromolecules (e.g., protein, DNA/RNA, and polymers) can be used for the design of useful biomedical materials [2]. Due to the widespread use of PG, it is consequentially discharged into industrial effluents and, thus, adds hazards into aquatic environments. PG can cause oxidative stress, which may lead to biological poisoning or even death [3,4,5]. The abundance of PG in rivers is about 4 μM [6]. For As4.1 juxtaglomerular cells, the IC50 of PG is about 60 μM for 48 h, as determined using an MTT assay [7]. Many analytical methods have been designed for PG detection [8,9,10,11,12], but they show the disadvantages of high-cost, complicated and time-consuming procedures, and low sensitivity. Therefore, it is necessary to establish a new cost-effective technique for PG detection that is characterized by high sensitivity, ease of operation, and rapid analysis.
Chemiluminescence (CL) analysis is a characteristic method used in analytical chemistry, as well as in environmental monitoring, drug analysis, food testing, biological analysis, and clinical detection, because of its simple equipment, convenient operation, rapid analysis, and easy automation [13,14,15,16,17]. However, it is undeniable that the CL analysis method still has limitations, such as easy interference, poor selectivity, and low signal response [18,19]. Selecting appropriate sensitizers and adding them into CL systems is an effective route toward enhancing CL intensity and improving both sensitivity and accuracy. The development of nanomaterials sheds light on ways to devise novel CL sensitizers [20]. Nanomaterials can enhance CL intensity in two ways: chemiluminescence resonance energy transfer (CRET) and electron–hole annihilation (EHA). CRET is a process through which energy transfers from a CL reagent to an energy acceptor during the CL reaction; EHA is a process through which the nanomaterials serve as CL emitters in order to produce enhanced CL from the combination of hole- and electron-injected nanomaterials [19,21]. Metal–organic frameworks (MOFs) represent a new class of nanomaterials, and they are composed of metal nodes and organic ligands and have become one of the most attractive materials due to their tunable structure and function [22,23]. Due to their porous structure and low energy band, many researchers have begun to pay attention to their application. For example, Singh et al. [24] prepared a two-fold, interpenetrated, and mixed-ligand Cd(II)-organic framework with great photoluminescence (PL) with which to detect Fe3+ and Cr (IV). Liu et al. [25] designed a Zn-MOF with a new organic linker, which contained a pyridine group, was able to absorb CO2 due to its large specific surface area and porous structure, and could also detect Cu2+ due to its excellent PL properties. Therefore, it is an appealing research direction regarding the application of MOF materials with specific energy levels and porous molecular structures to sensitize the CL process [26]. However, MOFs used in aqueous solutions have poor stability and dispersity, meaning that their applications in liquid-phase CL systems face serious challenges. Additionally, MOFs are always synthesized through hydro- and solvo-thermal reactions, which involve energy- and time-consuming steps and impede their CL applications [27]. Therefore, novel MOFs with higher stability and better dispersity need to be designed and synthesized through facile and economical approaches in order to enhance CL intensity for sensitive detection.
In this work, we synthesized a cobalt metal–organic framework (Co-MOF) using an ultrasonic method that used 2-aminoterephthalic acid (NH2-H2BDC) as a ligand and applied it to sensitize the ultraweak CL system of NaIO4-H2O2. The Co-MOF dramatically enhanced the CL response of the NaIO4-H2O2 system. Optimum CL signals were obtained by optimizing experimental conditions. The CL process was systematically studied and demonstrated to occur via two synergistic mechanisms: CRET and EHA. The CL signals showed a linear relationship with the concentration of PG within a specific range. As a result, the Co MOF-NaIO4-H2O2 system was developed as a CL analysis method for PG detection, having the advantages of high sensitivity, good reproducibility, and fast analysis speed.
2. Materials and Methods
2.1. Reagents and Materials
Sulfuric acid (H2SO4, 98%) was purchased from Beijing Chemical Reagent Co. (Beijing, China). Hydrogen peroxide (H2O2, 30%), ethanol (99.7%) and isopropyl alcohol (98.5%) were supplied by Sinopharm Chemical Reagent Co., Ltd. (Shanghai, China). Cobalt chloride hexahydrate (CoCl2∙6H2O, 99%), N,N-dimethylformamide (DMF, C3H7NO, 99.9%), triethylamine (C6H15N, 99.5%), NH2-H2BDC (C8H7NO4, ≥98%) and PG (C6H6O3, 99%) were obtained from Beijing InnoChem Science and Technology Co., Ltd. (Beijing, China). Sodium periodate (NaIO4, ≥99.5%), p-benzoquinone (BQ, C6H4O2, 99.7%) and thiourea (99%) were purchased from Aladdin Reagent Co., Ltd. (Shanghai, China). Ascorbic acid (AA, C6H8O6, ≥99%), 5,5-dimethyl-1-pyrroline-N-oxide (DMPO, C6H11NO) and 2,2,6,6-tetramethylpiperidine (TEMP, C9H19N) were bought from Sigma-Aldrich Chemical Co. (St. Louis, MO, USA). In a typical experiment, none of the chemicals were further purified.
2.2. Apparatus
The scanning electron microscope (SEM) images were obtained via a JSM-7900 scanning electron microscope (JEOL, Tokyo, Japan) to study the micro-morphologies of the samples. The transmission electron microscopy (TEM) image and selected area electron diffraction (SAED) patterns were determined via a JEOL-1400 transmission electron microscope (JEOL, Tokyo, Japan). Energy-dispersive X-ray spectroscopy (EDS) was recorded on a JED-2300 T transmission electron microscope (JEOL, Tokyo, Japan). The elemental composition of the surface of the material was measured via the X-ray photoelectron spectrometry (XPS) tool created by AXIS SUPRA, Shimadzu, Kyoto, Japan. Fourier transform infrared (FT-IR) spectra were used to determine functional groups and structures depending on PerkinElmer Frontier FT-IR spectrometer. The PL spectra were determined via an Agilent Cary Eclipse spectrofluorometer (F-7000, Hitachi, Japan) with a 5-nanometer silt width. UV-vis absorption spectra were collected via a PerkinElmer Lambda 950 spectrophotometer. The batch experiment was performed via a BPCL ultraweak CL analyzer (BPCL-GP21Q-TGC, Guangzhou microlight technology Co., Ltd., Guangzhou, Guangdong, China), and the voltage of the photomultiplier tube (PMT) was controlled at 700 V. CL spectra were collected via an FLS-1000 steady-state/transient fluorescence spectrometer (Edinburgh Instruments Ltd., Livingstone, Edinburgh, UK). Electron paramagnetic resonance (EPR) spectra were determined via a Bruker E500 spectrometer to make sure that the correct free radicals were generated. Brunauet–Emmett–Teller (BET) surface areas and pore size distribution were detected via the autosorb iQ analyzer (Quantachrome Instruments Co., Ltd., Boynton Beach, Florida, USA).
2.3. Synthesis of Co-MOF
Co-MOF was synthesized via the ultrasonic method illustrated in previous literature [28]. Firstly, 32 mL DMF, 2 mL C2H5OH and 2 mL H2O were mixed in a 100-milliliter flask. Subsequently, 0.75 mmol of NH2-H2BDC was added into the above flask and dissolved using an ultrasonic wave. Next, 0.75 mmol of CoCl2·6H2O was added and ultrasonically treated until completely dissolved. Finally, 0.8 mL of triethylamine was quickly poured into the flask and vigorously stirred for 5 min. The flask was kept under ultrasonic treatment for 8 h at a power of 90 kHz under ambient conditions. The resulting product was then centrifuged at a speed of 10,000 rpm for 5 min to remove the supernatant, washed twice with C2H5OH and dispersed in 30 mL of H2O. The washed product was freeze-dried under a vacuum and then collected for further use. The ultrasonic time for Co-MOF synthesis was further optimized to obtain the best CL enhancement.
2.4. CL Emission Study of the Co-MOF-NaIO4-H2O2 System
All of the CL signals were collected via the BPCL luminescence analyzer at a time interval of 0.01 s. The PMT was operated at a voltage of 1000 V. In total, 1 mL of 0.08 M NaIO4 solution and 100 μL of 4 mg∙mL−1 Co-MOF were mixed into the CL reaction cell. Next, 1 mL of 0.12 M H2O2 solution (acidified by 0.006 M H2SO4) was rapidly injected, and the CL reaction was triggered. The CL intensity was measured, and the kinetic curves were collected. A control experiment was conducted without Co-MOF to demonstrate the effect of Co-MOF on the CL process of NaIO4-H2O2 system. In order to obtain the optimum CL emission, the concentrations of all of the substances in the CL system were optimized using the univariate method. The CL intensities were measured at a series of concentrations of Co-MOF (1 mg∙mL−1, 2 mg∙mL−1, 3 mg∙mL−1, 4 mg∙mL−1, 5 mg∙mL−1, and 6 mg∙mL−1) and H2O2 (0.04 M, 0.08 M, 0.10 M, 0.12 M, 0.14 M and 0.16 M), NaIO4 (0.01 M, 0.02 M, 0.03 M, 0.04 M, 0.05 M, 0.06 M, 0.07 M, 0.08 M, 0.09 M, and 0.10 M), as well as different concentration of H2SO4 (0.002 M, 0.003 M, 0.004 M, 0.005 M, 0.006 M, 0.007 M, 0.008 M, and 0.009 M) to adjust pH values. The following experiments were carried out under optimal conditions.
2.5. CL Mechanism Study of the Co-MOF-NaIO4-H2O2 System
EPR and free radical quenching experiments were the two main methods used to explore the CL mechanism of the Co-MOF-NaIO4-H2O2 system. The EPR spectrum was collected at the X-band frequency of 9.85 GHz using a 300 W xenon lamp (300 nm < λ < 1100 nm) as the light source. The output radiation was focused on the sample in the cavity through an optical fiber (50 cm in length, 0.3 cm in diameter). TEMP and DMPO were used as the specific detection reagents for 1O2, ∙OH, and ∙O2−. In the free-radical-quenching experiments, specific free-radical quenchers were used to detect the free-radical intermediates of the reaction system. Furthermore, the role of dissolved oxygen in the system was analyzed through the bubbling experiment of oxygen and nitrogen. CL kinetic curves were collected, with all of the solutions pre-treated with nitrogen. In the control experiment, the solutions were first treated with nitrogen and then treated with oxygen. Moreover, CL kinetic curves were collected via various injection sequences of reagents. Three different injection sequences were investigated. The first way was to add acidified H2O2 into the mixture of NaIO4 and Co-MOF, the second way was to inject NaIO4 into the mixture of Co-MOF and acidified H2O2, and the third way was to infuse Co-MOF into the mixed solution of NaIO4 and acidified H2O2. CL spectrum and UV-Vis spectrum tests were also conducted to verify the CL mechanism.
2.6. PG Detection
The constructed Co-MOF-NaIO4-H2O2 system was developed as a CL sensor for PG detection. Calibration curve was recorded by detecting the relationship between CL intensities and PG concentration series under the optimal experimental conditions. Next, 100 μL PG (dissolved in H2O), 1 mL 0.08 M NaIO4 solution, and 100 μL 4 mg∙mL−1 Co-MOF were mixed into the CL reaction cell. Finally, 1 mL of 0.12 M H2O2 solution (acidified by 0.006 M H2SO4) was injected to detect the CL signals.
3. Results and Discussion
3.1. Characterization of Co-MOF
The ultrasonic synthesized Co-MOF displayed a flower-shaped morphology with a diameter of approximately 2~3 μm (Figure 1a). This morphology was formed by stacking several pieces of nanosheets, which were transparent and ultrathin (Figure 1b). The large surface and numerous active sites of Co-MOF nanosheets were conducive to the CL reactions. The SAED image in Figure 1b’s inset image demonstrates the single-crystal diffraction properties of the Co-MOF. The XRD pattern confirmed the high crystallinity of Co-MOF and coincided with the simulated pattern of cobalt-based ultrathin MOFs nanosheets (Figure 1h) [28,29]. The EDS-mapping diagram showed the composition of the Co-MOF, which was composed of Co, C, N, and O uniformly distributed across the nanosheets (Figure 1c). XPS was utilized to corroborate the chemical composition and provide further information on the surface electronic state of the Co-MOF (Figure 1d). As shown in Figure 1e, the characteristic signals at 781.6 eV and 797.6 eV were attributed to Co 2p3/2 and Co 2p1/2, respectively [30]. Satellite peaks accompanying them at 786.4 eV and 802.7 eV revealed the formation of antibonding orbitals between the Co and O elements [31]. The characteristic signal of O 1s at 531.8 eV and its fitting peaks at 531.6 eV, 532.1 eV, and 533.4 eV were attributed to Co-O, C-O, and C=O, respectively (Figure 1f) [29]. The signature signal of C is located at 283.6 eV and 287.4 eV, and its fitting peaks located at 283.4 eV, 284.8 eV, and 287.4 eV were attributed to C-C, C-O-C, and O-C=O, respectively (Figure 1g) [28]. All of the above results confirmed the successful coordination between Co2+ and NH2·H2BDC. The coordination between Co2+ and NH2·H2BDC was further verified via the FT-IR spectra (Figure 1i). Apparent differences were observed via the FT-IR spectra of Co-MOF and NH2·H2BDC. The –OH in the –COOH group of NH2·H2BDC had a broad-stretching vibrational absorption peak in the region of 3000 cm−1 to 2500 cm−1. In contrast, the peak of Co-MOF disappeared within the FT-IR spectra due to the deprotonation of NH2·H2BDC during the coordination process [29]. Compared to the FT-IR spectra of NH2·H2BDC, three new peaks appeared at the low wavenumbers of 708 cm−1, 450 cm−1, and 423 cm−1, which were attributed to the stretching vibration of Co-O [29,32,33]. In addition, the stretching vibration peak of the H2O molecule at 3087 cm−1 indicated that Co2+ also coordinated with H2O in Co-MOF. Asymmetric and symmetric stretching vibration absorptions in the -COO- group in the ligand NH2·H2BDC resulted in the two peaks located at 1558 cm−1 and 1381 cm−1, respectively. The peaks at 3473 cm−1 and 3342 cm−1 were derived from the asymmetric and symmetric stretching vibrations in the -NH2 group in the ligand NH2·H2BDC. The intensities of the two peaks in the FT-IR spectra of Co-MOF were significantly weaker than those of the FT-IR spectra of NH2·H2BDC, further indicating the coordination effect of NH2·H2BDC [29,33,34]. As shown in Figure 1j’s inset image, the prepared Co-MOF exhibited a bright blue color under the UV lamp (λex = 365 nm). Co-MOF gave an emission centered at 420-nanometer excitation due to lights with different wavelengths varying from 320 nm to 400 nm (Figure 1j).
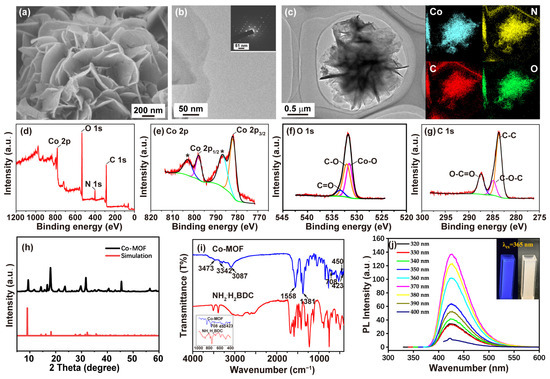
Figure 1.
Characterization of ultrasonically synthesized Co-MOF: (a) SEM image of Co-MOF; (b) TEM image of Co-MOF, and the inset image is the SAED image of Co-MOF; (c) EDS-mapping analysis of Co-MOF, (blue refers to cobalt element, yellow refers to nitrogen element, red refers to carbon element, and green refers to oxygen element); (d) XPS survey of Co-MOF; (e) high-resolution XPS spectra of Co 2p of Co-MOF (peaks marked with * revealed the formation of antibonding orbitals between the Co and O elements); (f) High-resolution XPS spectra of O 1s of Co-MOF; (g) high-resolution XPS spectra of C 1s of Co-MOF; (h) XRD pattern of the as-synthesized Co-MOF (black) and simulated XRD pattern of cobalt-based ultrathin MOFs nanosheets (red); (i) FT−IR spectra of Co-MOF and NH2·H2BDC; (j) PL spectra of Co-MOF, and the inset image is the photograph of Co-MOF under a UV lamp (λex = 365 nm).
The hydrothermal synthesized Co-MOF displayed a morphology completely different to that of the ultrasonic synthesized Co-MOF. As shown in Figure 2a,b, the Co-MOF synthesized via the hydrothermal method exhibited a regular circular shape, rather than layer stacked flower shape, and its size was approximately 500 nm and 1 μm, which was slightly smaller than the size of Co-MOF synthesized via ultrasound.
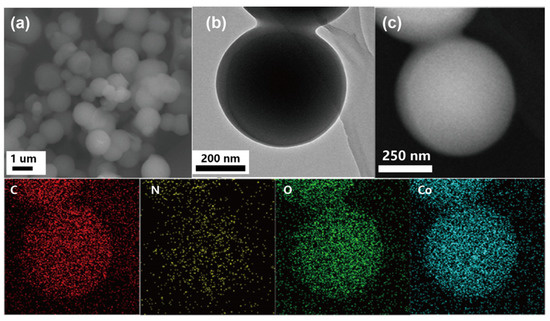
Figure 2.
Characterization of hydrothermally synthesized Co-MOF: (a) SEM image of Co-MOF; (b) TEM image of Co-MOF; (c) EDS-mapping analysis of Co-MOF (red color refers to carbon element, yellow color refers to nitrogen element, green color refers to oxygen element, and blue color refers to cobalt element).
3.2. CL Emission of the Co-MOF-NaIO4-H2O2 System
As shown in Figure 3a, the ultraweak CL emission of the NaIO4-H2O2 system was dramatically enhanced using the ultrasonic synthesized Co-MOF. Free Co2+ ions were also tested by adding CoCl2 solution into the NaIO4-H2O2 system, while its CL enhancement was negligible, indicating that the CL enhancement was rooted from Co-MOF. In comparison, the CL enhancement of hydrothermally synthesized Co-MOF was also tested and demonstrated to be weaker than that of ultrasonically synthesized Co-MOF (Figure 3b). Ultrasonic waves proved able to have a certain effect on the synthesized Co-MOF and the CL emission performed via the Co-MOF-NaIO4-H2O2 system. The N2 adsorption and desorption isotherms were carried out to examine the differences between the specific surface areas and pore sizes of the hydrothermally synthesized and ultrasonically synthesized Co-MOFs to explore the effect of ultrasonic waves (Figure 4). All of the isotherms (red line in Figure 4) displayed a closed hysteresis loop of type H3, demonstrating that a type IV classification (BDDT classification) was available for them, and the samples exhibited mesoporous structures. According to the multi-point BET calculations, the specific surface area of the Co-MOF synthesized via the ultrasonication method was 27.42 m2/g, while that of the Co-MOF synthesized via the hydrothermal method was 10.88 m2/g. As shown in the inset of Figure 4a and b, the main pore sizes of ultrasonically synthesized and hydrothermally synthesized Co-MOF were identified via the Barrett–Joyner–Halenda (BJH) model to be 29.83 and 3.80 nm, respectively. Larger pores in ultrasonically synthesized Co-MOF demonstrated more structural defects that were caused by ultrasonic waves. The larger specific surface areas and greater structural defects of the ultrasonically synthesized Co-MOF was promising for CL enhancement.
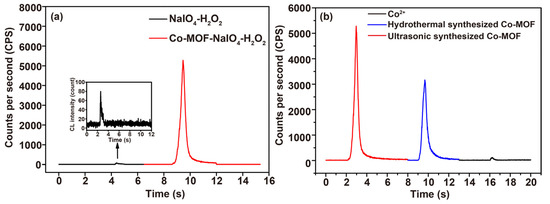
Figure 3.
CL enhancement of Co-MOF: (a) the comparison between CL intensities of NaIO4-H2O2 system and the Co-MOF-NaIO4-H2O2 system (conditions: 4 mg∙mL−1 Co-MOF, 0.12 M H2O2 acidified using 0.006 M H2SO4 and 0.08 M NaIO4); (b) the comparison between CL intensities of CoCl2-NaIO4-the H2O2, Co-MOF (hydrothermal synthesized)-NaIO4-H2O2, and Co-MOF (ultrasonic synthesized)-NaIO4-H2O2 systems (conditions: 4 mg∙mL−1 CoCl2, 4 mg∙mL−1 Co-MOF, 0.12 M H2O2 acidified using 0.006 M H2SO4 and 0.08 M NaIO4).
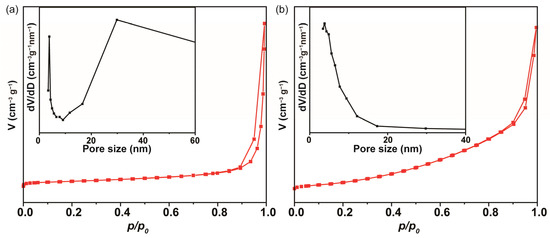
Figure 4.
The N2 adsorption and desorption isotherms of the Co-MOF synthesized via different methods: (a) sonication method; (b) hydrothermal method. The insets are the pore sizes of the Co-MOF synthesized via the sonication and hydrothermal methods.
Subject to the optimal CL response, the experimental parameters of the Co-MOF-NaIO4-H2O2 system were systematically optimized via the univariate method. The effects of the ultrasonic time required for Co-MOF synthesis and the concentrations of Co-MOF, H2SO4 (to adjust the optimal pH), H2O2, and NaIO4 on the CL intensity were separately investigated. The effect of the Co-MOF synthesis time on the CL of the Co-MOF-NaIO4-H2O2 system is shown in Figure 5a. The Co-MOF had the best enhancement effect on the CL intensity of NaIO4-H2O2 system after 8 h of ultrasonic synthesis. The CL intensity of the Co-MOF-NaIO4-H2O2 system increased with the increase in Co-MOF amount until it reached 4 mg·mL−1 (Figure 5b). According to preliminary experiments, the Co-MOF-NaIO4-H2O2 system has excellent CL performance under H2SO4 acidification conditions. When 0.12 M H2O2 was acidified with 0.006 M H2SO4, the CL intensity of the system was highest (Figure 5c,d). The CL signal of the system was optimal when the concentration of NaIO4 was 0.08 M (Figure 5e). Unless otherwise specified, subsequent experiments were carried out under optimal experimental conditions.
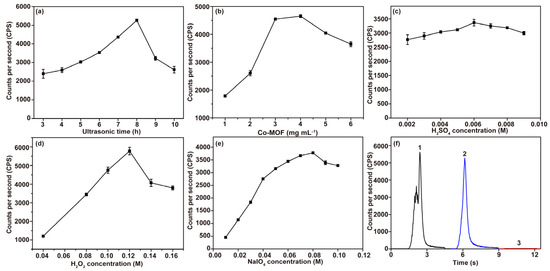
Figure 5.
Optimization of experimental conditions in the Co-MOF−NaIO4−H2O2 system. (a) Ultrasonic time required for Co-MOF synthesis was optimized (conditions: 4 mg∙mL−1 Co-MOF, 0.12 M H2O2 acidified using 0.006 M H2SO4 and 0.08 M NaIO4); (b) the amount of Co-MOF added into the NaIO4-H2O2 system was optimized (conditions: 0.12 M H2O2 acidified using 0.006 M H2SO4 and 0.08 M NaIO4); (c) H2SO4 concentration was optimized (conditions: 4 mg∙mL−1 Co-MOF, 0.12 M H2O2 and 0.08 M NaIO4); (d) NaIO4 concentration was optimized (conditions: 4 mg∙mL−1 Co-MOF and 0.12 M H2O2 acidified using 0.006 M H2SO4); (e) H2O2 concentration was optimized (conditions: 4 mg∙mL−1 Co-MOF, 0.006 M H2SO4 and 0.08 M NaIO4); (f) optimization of the regent mixing order of the Co-MOF-NaIO4-H2O2 system (conditions: 4 mg∙mL−1 Co-MOF, 0.12 M H2O2 acidified using 0.006 M H2SO4 and 0.08 M NaIO4). Legend: (1) injection of NaIO4 into the mixture of Co-MOF and H2O2; (2) injection of H2O2 into the mixture of Co-MOF and NaIO4; (3) injection of Co-MOF into the mixture of NaIO4 and H2O2.
Moreover, different injection sequences of reagents in the system are essential factors that affect CL intensity. Therefore, the influence of these sequences on the CL intensity of the system needs to be investigated. Under the optimal experimental conditions, the most robust CL kinetic curves were obtained when NaIO4 solution was injected into the mixture of acidic H2O2 and Co-MOF (Figure 5f). The reason for this outcome is that Co-MOF acts as a catalyst that accelerates the reaction of H2O2 decomposition to generate ·OH, which is beneficial for CL process. However, since the system underwent two CL reactions, the CL kinetic curve showed a shoulder peak that was not favorable for detection. The subsequent experiments were conducted by injecting acidic H2O2 solution into the mixture containing NaIO4 and Co-MOF.
3.3. CL Mechanism of the Co-MOF-NaIO4-H2O2 System
Nanomaterials introduced into liquid-phase CL systems generally act as catalysts [35] and luminophores [36,37]. To elucidate the role of Co-MOF and the main light emission species of the system, the CL spectra of the Co-MOF-NaIO4-H2O2 system were collected using a transient fluorescence spectrometer. The results showed that the system had a maximum CL emission of 470 nm and the luminescence range was 350–600 nm (Figure 6a), which overlapped with the emission band of dimol singlet oxygen 1(O2)2 [38,39,40] and Co-MOF. Therefore, (1O2)2* and Co-MOF* were speculated to be the main emitters present in the Co-MOF-NaIO4-H2O2 system. Figure 6b shows the UV-Vis spectra in which the NaIO4, H2O2, NaIO4-H2O2, Co-MOF-NaIO4, and Co-MOF-NaIO4-H2O2 systems had no characteristic absorption peaks. In contrast, Co-MOF had a prominent strong characteristic absorption peak at 300–400 nm. After the addition of H2O2, the absorption peak decreased, and its position was redshifted, demonstrating that Co-MOF catalyzed H2O2 to give ·OH and reacted with ·OH. As a result, H2O2, which is a strong oxidant, also produced a weak and rapidly quenched CL signal when mixed with Co-MOF (Figure 6c, black line). The disappeared absorption peak of Co-MOF at 300–400 nm in the Co-MOF-NaIO4 system further proved that Co-MOF not only played the role of catalyst in this system, but also participated in the reaction [41]. This phenomenon was certified based on the weak CL signals noted in Figure 6c (blue line). In addition, no other absorption peaks were observed; thus, it was clear that substances with additional UV-vis absorption were not produced via the CL system.

Figure 6.
A study on the CL mechanism of the Co-MOF-NaIO4-H2O2 system: (a) CL spectra of the Co-MOF-NaIO4-H2O2 system; (b) UV-vis absorption spectra of the reagents used in the Co-MOF-NaIO4-H2O2 CL system; (c) CL kinetic curves of the Co-MOF-H2O2 and the Co-MOF-NaIO4 systems.
(1O2)2* derived from reactive oxygen species (ROS) (1O2, ·O2− and ·OH) was proved to be one of the luminophor molecules in the Co-MOF-NaIO4-H2O2 system via the CL spectra (Figure 6a). Different radical scavengers and EPR spectra were used to detect the three kinds of ROS in the CL system and explore the roles that ROS played in the CL reaction process. The generation of ROS was verified by detecting the changes in the CL intensity of the Co-MOF-NaIO4-H2O2 system before and after the addition of the specific radical scavengers. AA is an effective reactive oxygen radical quencher [42]. The CL intensity gradually decreased with increasing concentration of AA (Figure 7a). Therefore, it could be concluded that reactive oxygen radicals were produced via the Co-MOF-NaIO4-H2O2 system and played crucial roles in the CL process. H2O2 could be oxidized using IO4− and yield ·O2− [35,43]. As a free radical scavenger of ·O2−, BQ significantly quenched the CL intensity of the Co-MOF-NaIO4-H2O2 system, indicating the presence of and important role played by ·O2− in the CL system (Figure 7b). Thiourea and isopropanol are common ·OH radical scavengers and were used to detect ·OH via this CL reaction system. The addition of different concentrations of thiourea into the system was found to have an inhibitory effect on the CL intensity (Figure 7c). The same phenomenon was observed when isopropanol was added into the CL system. In total, 10 μL of isopropanol quenched more than 95% of the CL in the Co-MOF-NaIO4-H2O2 system (Figure 7d). The reason for this outcome was that isopropanol quickly captured ·OH to generate acetone carbonyl radicals, which then produced acetone [44]. Since isopropanol preferentially reacted with ·OH, the chances of ·OH participating in the CL reactions were reduced, resulting in the decreased CL intensity.
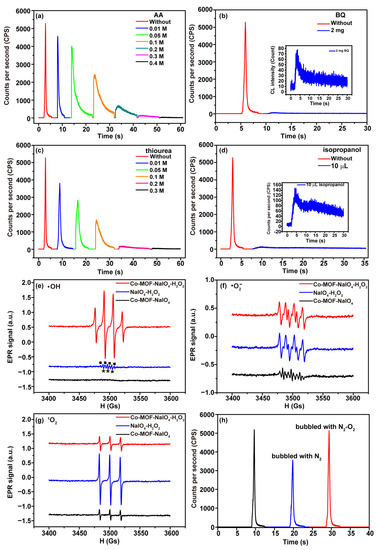
Figure 7.
ROS detection in Co-MOF−NaIO4−H2O2 system. (a) ROS radicals in Co-MOF−NaIO4-H2O2 system were detected via AA; (b) ·O2− in Co-MOF−NaIO4−H2O2 system was detected via BQ; (c) ·OH in Co-MOF−NaIO4−H2O2 system was detected via thiourea; (d) ·OH in Co-MOF−NaIO4−H2O2 system was detected via isopropanol; (e) ·OH was detected via EPR spectra of Co-MOF−NaIO4−H2O2 system, with DMPO used as the specific scavenger agent (square symbols indicated the EPR signals of DMPO-·OH; asterisk symbols indicated the EPR signals of DMPOX); (f) ·O2− was detected via EPR spectra of Co-MOF−NaIO4−H2O2 system, with DMPO used as the specific scavenger agent and CH3OH used as the solvent; (g) 1O2 was detected via EPR spectra of Co-MOF−NaIO4−H2O2 system, with TEMP used as the specific scavenger agent; (h) effects of dissolved oxygen on CL intensity were detected via the Co-MOF-NaIO4-H2O2 system.
EPR is the most direct method used to identify radical intermediates in chemical reactions [45]. DMPO was used as the scavenger agent for ·OH detection in the Co-MOF-NaIO4-H2O2, NaIO4-H2O2, and Co-MOF-NaIO4 systems. ·OH reacts with DMPO to form radical adduct DMPO-·OH, which can generate a quadruple peak of EPR signals with an intensity ratio of 1:2:2:1 [46]. The characteristic EPR signals of DMPO-·OH were collected via the Co-MOF-NaIO4-H2O2 system (Figure 7e, red line), which confirmed the formation of ·OH. In the absence of Co-MOF, the characteristic EPR signals of DMPO-·OH were also collected via the NaIO4-H2O2 system (Figure 7e, blue line, square symbols). EPR signals of DMPO-·OH collected via the NaIO4-H2O2 system decreased sharply compared to those signals collected via the Co-MOF-NaIO4-H2O2 system, suggesting that the addition of Co-MOF promoted the decomposition of H2O2 to produce ·OH. There was no obvious EPR signals of DMPO-·OH in the Co-MOF-NaIO4 system (Figure 7e, black line), verifying that ·OH was derived from the decomposition of H2O2. The triplet EPR signals with the intensity ratio of 1:1:1 in Figure 7e (blue line, asterisk symbols) were assigned to 5,5-dimethyl-2-oxopyrroline-1-oxyl (DMPOX), which was derived from the oxidation reaction between 1O2 and DMPO [47]. DMPO is also the specific detection reagent for ·O2− when CH3OH is used as the solvent. The characteristic 1:1:1:1 quartette EPR signals of DMPO-·O2− in Figure 7f confirmed the presence of ·O2− via the Co-MOF-NaIO4-H2O2, NaIO4-H2O2, and Co-MOF-NaIO4 systems. IO4− reacted with H2O2, generating ·O2− and Co-MOF that accelerated this process [45]. Moreover, ·OH derived from H2O2 consumed ·O2− and then promoted the production of ·O2−. This process was the reason that the EPR signals collected via the Co-MOF-NaIO4-H2O2 and NaIO4-H2O2 systems were stronger than those of Co-MOF-NaIO4 system. TEMP is a specific scavenger for 1O2 and reacts with 1O2 to generate TEMPO, which is a stable nitrogen oxide radical with a characteristic EPR spectrum [48]. In Figure 7g, the characteristic triplet peaks of 1O2 with an intensity ratio of 1:1:1 were observed via the Co-MOF-NaIO4-H2O2, NaIO4-H2O2, and Co-MOF-NaIO4 systems. 1O2 was the product of the reaction between ·O2− and ·OH. EPR signals collected via the 1O2 in Co-MOF-NaIO4-H2O2 system (red line) were significantly weaker than those collected via the NaIO4-H2O2 system (blue line) because Co-MOF reacted with (1O2)2*, which was derived from 1O2. In order to confirm whether dissolved oxygen participated in the CL process of the Co-MOF-NaIO4-H2O2 system, nitrogen and oxygen were alternately infused into the system. The CL intensity collected via the system was significantly reduced when nitrogen was infused for 15 min (Figure 7h, blue line). The CL intensity was restored when the system was subsequently infused with O2 for 15 min (Figure 7h, red line). It could be concluded that dissolved oxygen played an essential role in the system and reacted with IO4- to generate ·O2− and ·OH [43]. This reaction process explained why EPR signals of 1O2 were also observed via the Co-MOF-NaIO4 system, even though there was no H2O2.
Based on the above results, the possible CL mechanism of the Co-MOF-NaIO4-H2O2 system was inferred and shown in Figure 8. The specific reactions were described in Equations (1)–(11). Firstly, Co-MOF acted as a catalyst to decompose NaIO4 and H2O2 to produce radical intermediates (·OH and ·O2−) (Equations (1) and (2)) [40,49,50]. The catalytic behavior of Co-MOF was beneficial for radical intermediate generation. IO4− could be oxidized using dissolved O2 to create ·OH and ·O2− (Equation (3)) [43]. The unstable ·O2− could trigger a reaction to produce 1O2 (Equation (4)) [51]. (1O2)2* with higher energy was generated using 1O2 (Equation (5)) [40] and worked as one of the critical luminophores in the Co-MOF-NaIO4-H2O2 system. Oxidative radicals ·OH and IO4− acted as electron acceptors for Co-MOF and injected holes into Co-MOF (Equations (6) and (7)). The reductive ·O2− acted as an electron donor to inject electrons into the Co-MOF (Equation (8)) [52]. Due to the CRET effect, the excited state (1O2)2* transferred its energy to Co-MOF to generate Co-MOF* (Equation (9)) [53] to produce a strong CL response. The EHA effect between hole-injected Co-MOF and electron-injected Co-MOF jointly promoted the enhanced CL collected via the Co-MOF-NaIO4-H2O2 system (Equations (10) and (11)). The CRET and EHA effects together caused the strong CL release.
IO4− + O2 + 3H2O → 2·O2− + 2·OH+ IO3− + 4H+
H+ + ·O2− + OH → 1O2 + H2O
1O2 + 1O2 → (1O2)2* → hv (λ = 478 nm)
·OH + Co-MOF + H+ → Co-MOF∙+ + H2O
IO4− + Co-MOF + 2H+ → Co-MOF∙+ + IO3− + H2O
·O2− + Co-MOF → Co-MOF∙− + O2
(1O2)2* + Co-MOF → Co-MOF* + 2O2
Co-MOF∙+ + Co-MOF∙− → Co-MOF* + Co-MOF
Co-MOF* → Co-MOF + hv
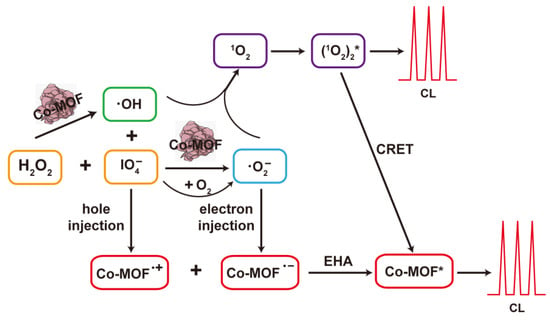
Figure 8.
Schematic of the CL mechanism in the Co-MOF-NaIO4-H2O2 system.
3.4. PG Detection
The Co-MOF-NaIO4-H2O2 CL system constructed in this experiment was successfully used to detect PG because it could enhance the CL response. PG can be oxidized using ·O2− to generate o-quinone and hydroquinone, which slowly react to yield quinone condensation products and Diels–Alder dimers [54]. These complex oxidation reactions involve forming multiple products from quinone intermediates through different reaction pathways controlled via kinetics. The oxidation process of PG is shown in Figure 9a. During this oxidation process, the excited state of singly linear oxygen (1O2*) was formed, and it enhanced the CL through intramolecular energy transfer. As shown in Figure 9b, the CL intensity showed a linear relationship with PG concentration in the range of 1 × 10⁻⁴ M to 1 × 10⁻⁷ M, having a linear correlation coefficient of 0.9995 and a limit of detection (LOD) (S/N = 3) of 34 nM. Compared to the existing CL methods used for PG detection, the detection method described in this article has a wider linear range and lower LOD. For example, Zhuang et al. [55] developed a KIO4-isothiocyanatoisoluminol CL system to investigate the concentration of PG within the liner range of 1.75 × 10⁻⁸–2.5 × 10⁻⁶ M. Shah et al. [40] synthesized N-CDs to enhance the CL of KIO4-H2O2 systems within the liner range of 1.0 × 10⁻⁴–1.0 × 10⁻⁷ M and LOD of 46 nM. Mostafa et al. [10] constructed a lucigenin-PG system to detect PG, and the results showed that the LOD was 940 nM, which was higher than that of our method. Therefore, the CL detection method that we developed has a promising future in the application of PG detection.
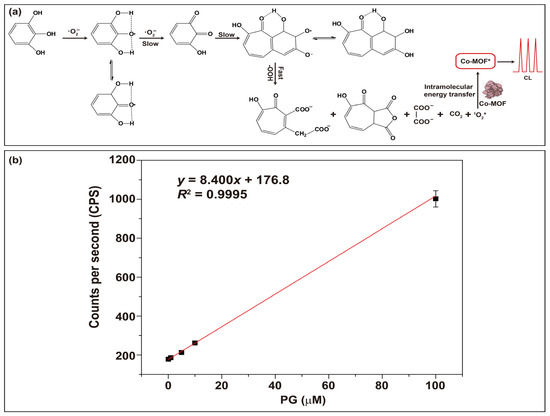
Figure 9.
PG detection: (a) schematic diagram of the mechanism of PG detection; (b) standard curve used for PG detection based on the Co-MOF-NaIO4-H2O2 system that had a PMT operating at 1200 V.
4. Conclusions
In conclusion, the Co-MOF prepared via the ultrasonic method in this work effectively enhanced the CL signal of the NaIO4-H2O2 system. The Co-MOF-mediated CL enhancement was attributed to the synergistic effects of CRET and EHA. A novel CL analysis method was established for PG detection based on the quantitative relationship between the PG concentrations and the CL signal of the Co-MOF-NaIO4-H2O2 system. The research content and application fields of MOF materials were enriched through this work. In future work, CL analysis methods based on MOF nanomaterials are expected to be used in multiple fields, such as clinical diagnosis, food safety, and environmental pollution monitoring.
Author Contributions
Conceptualization, Y.W.; data curation, Y.L., Z.L. and Z.G.; formal analysis, Z.W. and D.Z.; funding acquisition, J.W.; investigation, Y.W.; methodology, Y.W. and Z.W.; project administration, J.W.; resources, J.W.; supervision, J.W.; validation, K.L.; writing—original draft, Y.W.; writing—review and editing, J.W. and X.L. All authors have read and agreed to the published version of the manuscript.
Funding
This work was supported by the Beijing Natural Science Foundation (No. 2222022) and the National Natural Science Foundation of China (No. 21874120).
Data Availability Statement
The research data are available when they are requested.
Conflicts of Interest
The authors declare that they have no known competing financial interests or personal relationships that could have appeared to influence the work reported in this paper.
References
- Li, Z.; Yang, Y.; Zeng, Y.; Wang, J.; Liu, H.; Guo, L.; Li, L. Novel imidazole fluorescent poly(ionic liquid) nanoparticles for selective and sensitive determination of pyrogallol. Talanta 2017, 174, 198–205. [Google Scholar] [CrossRef] [PubMed]
- Shin, M.; Park, E.; Lee, H. Plant-inspired pyrogallol-containing functional materials. Adv. Funct. Mater. 2019, 29, 1903022. [Google Scholar] [CrossRef]
- Singh, V.; Ahmad, S.; Rao, G.S. Prooxidant and antioxidant properties of iron-hydroquinone and iron-1,2,4-benzenetriol complex-implications for benzene toxicity. Toxicology 1994, 89, 25–33. [Google Scholar] [CrossRef] [PubMed]
- Gao, Y.N.; Fu, Q.Q.; Lu, J.; Yang, H.; Orr, P.T.; Zhang, F.; Dong, J.; Zhang, M.; Gu, Q.H.; Zhou, C.J.; et al. Enhanced pyrogallol toxicity to cyanobacterium microcystis aeruginosa with increasing alkalinity. J. Appl. Phycol. 2020, 32, 1827–1835. [Google Scholar] [CrossRef]
- Hamed, M.; Martyniuk, C.J.; Said, R.E.M.; Soliman, H.A.M.; Badrey, A.E.A.; Hassan, E.A.; Abdelhamid, H.N.; Osman, A.G.M.; Sayed, A.E.H. Exposure to pyrogallol impacts the hemato-biochemical endpoints in catfish (clarias gariepinus). Environ. Pollut. 2023, 333, 122074. [Google Scholar] [CrossRef]
- He, S.; He, D.; Jiang, H. Fi-chemiluminescence determination of pyrogallol in water. Phys. Test. Chem. Anal. 2008, 44, 316–318. [Google Scholar]
- Park, W.H.; Han, Y.H.; Kim, S.H.; Kim, S.Z. Pyrogallol, ROS generator inhibits As4.1 juxtaglomerular cells via cell cycle arrest of G2 phase and apoptosis. Toxicology 2007, 235, 130–139. [Google Scholar] [CrossRef]
- Rajkumar, C.; Kim, H. An amperometric electrochemical sensor based on hierarchical dual-microporous structure polypyrrole nanoparticles for determination of pyrogallol in the aquatic environmental samples. Microchem. J. 2022, 183, 108038. [Google Scholar] [CrossRef]
- Torrini, F.; Renai, L.; Scarano, S.; Del Bubba, M.; Palladino, P.; Minunni, M. Colorimetric selective quantification of anthocyanins with catechol/pyrogallol moiety in edible plants upon zinc complexation. Talanta 2022, 240, 123156. [Google Scholar] [CrossRef]
- Mostafa, I.M.; Gilani, M.; Chen, Y.Q.; Lou, B.H.; Li, J.P.; Xu, G.B. Lucigenin-pyrogallol chemiluminescence for the multiple detection of pyrogallol, cobalt ion, and tyrosinase. J. Food Drug Anal. 2021, 29, 510–520. [Google Scholar] [CrossRef]
- Bao, A.; Xiao, N.; Zhu, Y.C.; Xin, S.G.; Zhang, H.B. The electrochemical catalytic behavior of pyrogallol at an 8-hydroxyquinoline-aluminum complex modified carbon paste electrode and its detection in tomato. RSC Adv. 2015, 5, 12710–12716. [Google Scholar] [CrossRef]
- Matemadombo, F.; Apetrei, C.; Nyokong, T.; Rodriguez-Mendez, M.L.; de Saja, J.A. Comparison of carbon screen-printed and disk electrodes in the detection of antioxidants using copc derivatives. Sensor. Actuat. B-Chem. 2012, 166, 457–466. [Google Scholar] [CrossRef]
- Chen, F.; Xia, X.; Ye, D.; Li, T.; Huang, X.; Cai, C.; Zhu, C.; Lin, C.; Deng, T.; Liu, F. A green-emitting luminol analogue as the next-generation chemiluminescent substrate in biochemical analysis. Anal. Chem. 2023, 95, 5773–5779. [Google Scholar] [CrossRef]
- Yuan, S.J.; Yu, R.; Tu, Y.; Du, Y.H.; Feng, X.; Nie, F. An enhanced chemiluminescence hybrids of luminol by sulfonated polyaniline decorated copper-based metal organic frame composite applicable to the measurement of hydrogen peroxide in a wide ph range. Talanta 2023, 254, 124183. [Google Scholar] [CrossRef]
- Li, J.L.; Yang, M.Q.; Cao, D.; Zhang, L.; Zong, C.; Li, P. Ultrasensitive homogeneous detection of pcsk9 and efficacy monitoring of the pcsk9 inhibitor based on proximity hybridization-dependent chemiluminescence imaging immunoassay. Anal. Chem. 2023, 95, 5428–5435. [Google Scholar] [CrossRef]
- Sun, M.X.; Song, H.J.; Liu, H.Y.; Su, Y.Y.; Xie, X.B.; Lv, Y. Organic semiconductor nanosheets for sulfite detecting based on activation of sulfite and a synergetic chemiluminescence resonance energy transfer process in a mild system of Fe2+-SO32−. Anal. Chem. 2023, 95, 3901–3908. [Google Scholar] [CrossRef]
- Chang, J.F.; Yu, L.; Hou, T.; Hu, R.X.; Li, F. Direct and specific detection of glyphosate using a phosphatase-like nanozyme-mediated chemiluminescence strategy. Anal. Chem. 2023, 95, 4479–4485. [Google Scholar] [CrossRef]
- Yang, M.; Huang, J.; Fan, J.; Du, J.; Pu, K.; Peng, X. Chemiluminescence for bioimaging and therapeutics: Recent advances and challenges. Chem. Soc. Rev. 2020, 49, 6800–6815. [Google Scholar] [CrossRef]
- Yan, Y.; Wang, X.; Hai, X.; Song, W.; Ding, C.; Cao, J.; Bi, S. Chemiluminescence resonance energy transfer: From mechanisms to analytical applications. Trac-Trend. Anal. Chem. 2020, 123, 115755. [Google Scholar] [CrossRef]
- Zhu, H.; Huang, X.; Deng, Y.; Chen, H.; Fan, M.; Gong, Z. Applications of nanomaterial-based chemiluminescence sensors in environmental analysis. Trac-Trend. Anal. Chem. 2023, 158, 116879. [Google Scholar] [CrossRef]
- Zong, C.; Wu, J.; Zang, Y.; Ju, H.X. Resonance energy transfer and electron-hole annihilation induced chemiluminescence of quantum dots for amplified immunoassay. Chem. Commun. 2018, 54, 11861–11864. [Google Scholar] [CrossRef] [PubMed]
- Ma, X.; Kang, J.; Wu, Y.; Pang, C.; Li, S.; Li, J.; Xiong, Y.; Luo, J.; Wang, M.; Xu, Z. Recent advances in metal/covalent organic framework-based materials for photoelectrochemical sensing applications. Trac-Trend. Anal. Chem. 2022, 157, 116793. [Google Scholar] [CrossRef]
- Ren, X.; Liao, G.; Li, Z.; Qiao, H.; Zhang, Y.; Yu, X.; Wang, B.; Tan, H.; Shi, L.; Qi, X.; et al. Two-dimensional MOF and COF nanosheets for next-generation optoelectronic applications. Coordin. Chem. Rev. 2021, 435, 213781. [Google Scholar] [CrossRef]
- Singh, M.; Kumar, G.; Neogi, S. Devising mixed-ligand based robust Cd(II)-framework from bi-functional ligand for fast responsive luminescent detection of Fe3+ and Cr(VI) oxo-anions in water with high selectivity and recyclability. Front. Chem. 2021, 9, 651866. [Google Scholar] [CrossRef]
- Liu, B.; Hou, L.; Wu, W.P.; Dou, A.N.; Wang, Y.Y. Highly selective luminescence sensing for Cu2+ ions and selective CO2 capture in a doubly interpenetrated MOF with lewis basic pyridyl sites. Dalton Trans. 2015, 44, 4423–4427. [Google Scholar] [CrossRef] [PubMed]
- Rühle, B.; Virmani, E.; Engelke, H.; Hinterholzinger, F.M.; von Zons, T.; Brosent, B.; Bein, T.; Godt, A.; Wuttke, S. A chemiluminescent metal-organic framework. Chem-Eur. J. 2019, 25, 6349–6354. [Google Scholar] [CrossRef]
- Vaitsis, C.; Sourkouni, G.; Argirusis, C. Metal organic frameworks (MOFs) and ultrasound: A review. Ultrason. Sonochem. 2019, 52, 106–119. [Google Scholar] [CrossRef]
- Zhao, S.; Wang, Y.; Dong, J.; He, C.; Yin, H.; An, P.; Zhao, K.; Zhang, X.; Gao, C.; Zhang, L.; et al. Ultrathin metal-organic framework nanosheets for electrocatalytic oxygen evolution. Nat. Energy 2016, 1, 16184. [Google Scholar] [CrossRef]
- Zhang, L.; Ouyang, H.; Zhang, D.; Fu, Z. Novel cobalt-based metal-organic frameworks with superior catalytic performance on n-(4-aminobutyl)-n-ethylisoluminol chemiluminescent reaction. Anal. Chim. Acta 2021, 1148, 238174. [Google Scholar] [CrossRef]
- Wang, S.; Zhao, Y.; Wang, M.; Li, H.; Saqib, M.; Ge, C.; Zhang, X.; Jin, Y. Enhancing luminol electrochemiluminescence by combined use of cobalt-based metal organic frameworks and silver nanoparticles and its application in ultrasensitive detection of cardiac troponin i. Anal. Chem. 2019, 91, 3048–3054. [Google Scholar] [CrossRef]
- Zhong, H.; Ly, K.H.; Wang, M.; Krupskaya, Y.; Han, X.; Zhang, J.; Zhang, J.; Kataev, V.; Büchner, B.; Weidinger, I.M.; et al. A phthalocyanine-based layered two-dimensional conjugated metal-organic framework as a highly efficient electrocatalyst for the oxygen reduction reaction. Angew. Chem. Int. Edit. 2019, 58, 10677–10682. [Google Scholar] [CrossRef]
- Tirosh, E.; Shemer, G.; Markovich, G. Optimizing cobalt ferrite nanocrystal synthesis using a magneto-optical probe. Chem. Mater. 2006, 18, 465–470. [Google Scholar] [CrossRef]
- Shyamaldas; Bououdina, M.; Manoharan, C. Dependence of structure/morphology on electrical/magnetic properties of hydrothermally synthesised cobalt ferrite nanoparticles. J. Magn. Magn. Mater. 2020, 493, 165703. [Google Scholar] [CrossRef]
- Yang, J.; Xiong, P.; Zheng, C.; Qiu, H.; Wei, M. Metal-organic frameworks: A new promising class of materials for a high performance supercapacitor electrode. J. Mater. Chem. A 2014, 2, 16640–16644. [Google Scholar] [CrossRef]
- Huang, C.; Wang, Y.; Wang, Y.; Chen, T.; Wu, J.; Liu, X.; Lin, C. Ultraweak chemiluminescence enhanced on the surface of lanthanide metal-organic framework nanosheets synthesized by ultrasonic wave. Appl. Surf. Sci. 2022, 579, 151860. [Google Scholar] [CrossRef]
- Wang, Y.F.; Wang, Y.R.; Huang, C.X.; Chen, T.Y.; Wu, J. Ultra-weak chemiluminescence enhanced by cerium-doped LaF3 nanoparticles: A potential nitrite analysis method. Front. Chem. 2020, 8, 639. [Google Scholar] [CrossRef]
- Wang, Y.; Huang, C.; Wang, Y.; Chen, T.; Wu, J. Chemiluminescence enhanced by cerium-doped LaF3 nanoparticles through electron-hole annihilation. J. Lumin. 2021, 239, 118407. [Google Scholar] [CrossRef]
- Shah, S.N.A.; Khan, M.; Rehman, Z.U. A prolegomena of periodate and peroxide chemiluminescence. Trac-Trend. Anal. Chem. 2020, 122, 115722. [Google Scholar] [CrossRef]
- Adam, W.; Kazakov, D.V.; Kazakov, V.P. Singlet-oxygen chemiluminescence in peroxide reactions. Chem. Rev. 2005, 105, 3371–3387. [Google Scholar] [CrossRef]
- Shah, S.N.A.; Li, H.; Lin, J. Enhancement of periodate-hydrogen peroxide chemiluminescence by nitrogen doped carbon dots and its application for the determination of pyrogallol and gallic acid. Talanta 2016, 153, 23–30. [Google Scholar] [CrossRef]
- Cai, N.; Yang, D.Q.; He, Y.Y.; Chen, F.N. Enhanced chemiluminescence of the fluorescein-KIO4 system by cdte quantum dots for determination of catechol. Luminescence 2018, 33, 871–876. [Google Scholar] [CrossRef] [PubMed]
- Li, R.; Kameda, T.; Toriba, A.; Hayakawa, K.; Lin, J. Determination of benzo[a]pyrene-7,10-quinone in airborne particulates by using a chemiluminescence reaction of hydrogen peroxide and hydrosulfite. Anal. Chem. 2012, 84, 3215–3221. [Google Scholar] [CrossRef] [PubMed]
- Zheng, Y.Z.; Zhang, D.K.; Shah, S.; Li, H.F.; Lin, J.M. Ultra-weak chemiluminescence enhanced by facilely synthesized nitrogen-rich quantum dots through chemiluminescence resonance energy transfer and electron hole injection. Chem. Commun. 2017, 53, 5657–5660. [Google Scholar] [CrossRef] [PubMed]
- Lai, D.Z.; Lu, W.Y.; Liu, T.; Fu, Y.Q.; Yi, L.M.; Chen, W.X. Peroxy radical formation from Cu2O/poly(acrylonitrile) nanofibers and hydrogen peroxide. Sci. Adv. Mater. 2016, 8, 775–782. [Google Scholar] [CrossRef]
- Sun, X.; Lei, J.; Jin, Y.; Li, B. Long-lasting and intense chemiluminescence of luminol triggered by oxidized g-C3N4 nanosheets. Anal. Chem. 2020, 92, 11860–11868. [Google Scholar] [CrossRef]
- Liu, H.J.; Sun, M.X.; Su, Y.Y.; Deng, D.Y.; Hu, J.Y.; Lv, Y. Chemiluminescence of black phosphorus quantum dots induced by hypochlorite and peroxide. Chem. Commun. 2018, 54, 7987–7990. [Google Scholar] [CrossRef]
- Zhang, W.Y.; Fernandez-Fueyo, E.; Ni, Y.; van Schie, M.; Gacs, J.; Renirie, R.; Wever, R.; Mutti, F.G.; Rother, D.; Alcalde, M.; et al. Selective aerobic oxidation reactions using a combination of photocatalytic water oxidation and enzymatic oxyfunctionalizations. Nat. Catal. 2018, 1, 55–62. [Google Scholar] [CrossRef]
- Chance, B.; Sies, H.; Boveris, A. Hydroperoxide metabolism in mammalian organs. Physiol. Rev. 1979, 59, 527–605. [Google Scholar] [CrossRef]
- Xie, C.G.; Li, H.F. Determination of tannic acid in industrial wastewater based on chemiluminescence system of KIO4-H2O2-tween40. Luminescence 2010, 25, 350–354. [Google Scholar] [CrossRef]
- Huang, T.Y.; Lin, W.Y. A stopped-flow study of the dual chemiluminescence for the luminol-KIO4-Mn2+ system in strong alkaline solutions. Luminescence 2011, 26, 118–124. [Google Scholar] [CrossRef]
- Lin, Z.; Xue, W.; Chen, H.; Lin, J. Peroxynitrous-acid-induced chemiluminescence of fluorescent carbon dots for nitrite sensing. Anal. Chem. 2011, 83, 8245–8251. [Google Scholar] [CrossRef]
- Shah, S.; Zheng, Y.Z.; Li, H.F.; Lin, J.M. Chemiluminescence character of ZnS quantum dots with bisulphite-hydrogen peroxide system in acidic medium. J. Phys. Chem. C. 2016, 120, 9308–9316. [Google Scholar] [CrossRef]
- Dou, X.N.; Lin, Z.; Chen, H.; Zheng, Y.Z.; Lu, C.; Lin, J.M. Production of superoxide anion radicals as evidence for carbon nanodots acting as electron donors by the chemiluminescence method. Chem. Commun. 2013, 49, 5871–5873. [Google Scholar] [CrossRef]
- Evmiridis, N.P.; Vlessidis, A.G.; Thanasoulias, N.C.; Fritsky, I.O. Chemical analysis through cl-detection assisted by periodate oxidation. Bioinorg. Chem. Appl. 2007, 2007, 92595. [Google Scholar] [CrossRef]
- Zhuang, H.S.; Wang, Q.E.; Wu, F. Study on the chemiluminescence (CL) analysis for the determination of pyrogallol in water environment. Spectrosc. Spect. Anal. 2004, 24, 927–929. [Google Scholar]
Disclaimer/Publisher’s Note: The statements, opinions and data contained in all publications are solely those of the individual author(s) and contributor(s) and not of MDPI and/or the editor(s). MDPI and/or the editor(s) disclaim responsibility for any injury to people or property resulting from any ideas, methods, instructions or products referred to in the content. |
© 2023 by the authors. Licensee MDPI, Basel, Switzerland. This article is an open access article distributed under the terms and conditions of the Creative Commons Attribution (CC BY) license (https://creativecommons.org/licenses/by/4.0/).