


Abstract
The potential of applying Artificial Neural Network (ANN) models based on near-infrared (NIR) spectra for the characterization of physical and chemical features of oil-in-aqueous oregano/rosemary extract emulsions was explored in this work. Emulsions were prepared using a batch emulsification process, with pea protein as the emulsifier. NIR spectral data were connected to the results of the analysis of physical and chemical properties of the emulsions (zeta potential, Feret droplet diameter, total polyphenolic content, and antioxidant capacity) with the final aim of quantitative prediction of the physical and chemical features. For that purpose, robust non-linear multivariate analysis (Artificial Neural Network modeling) was applied. The spectra themselves were preprocessed using several approaches (raw spectra, Savitzky–Golay smoothing, standard normal variate, and multiplicative scatter corrections) after which the impact of NIR spectral preprocessing on the ANN model’s efficiency was evaluated. The results show that NIR spectroscopy integrated with ANN computation can be employed to quantitatively predict the physical and chemical properties of oil-in-plant extract emulsions (R2 > 0.9).
1. Introduction
Antioxidants are compounds that can limit the destruction caused by highly reactive molecules [1]. Antioxidants, especially those derived from plants, have a well-known ability to inhibit the creation of reactive species that are dangerous to human health [2]. Oregano (Origanum vulgaris L.) and rosemary (Rosmarinus officinalis L.), medicinal plants of the Lamiaceae family, contain bioactive substances that have significant antioxidant characteristics, including free radical scavenging activity [3,4,5]. Although they possess notable effects on human health, their application is limited. The bioavailability and integrity of polyphenols are key factors in their effectiveness. Due to their sensitivity to environmental conditions (physical, chemical, and biological), polyphenols’ potential health benefits are constrained. Their rapid oxidation, which results in the progressive presence of a brown color and/or unpleasant smells, low water solubility, and unpleasant taste, which should be disguised prior to being incorporated into food, are all issues associated with their use [4,6].
In order to overcome the abovementioned limitations, polyphenol encapsulation is one of the more interesting stabilization methods. The food, pharmaceutical, and cosmetic industries, as well as personal care, agricultural products, biotechnology, biomedicine, and veterinary medicine, use microencapsulated products to varying degrees [7,8,9]. For a variety of biocompounds, emulsions represent one of the most diverting encapsulating and delivery systems [10]. Their function is to protect and delivery a variety of bioactive substances, with applications in the food industry, nutrition, medicine, and other fields [9]. The knowledge about the effect of factors such as emulsion constituents, homogenization mode, and emulsifying agent type on emulsion stability is critical because practical benefits of emulsion technology present numerous challenges [11,12]. Natural and synthetic emulsifiers are frequently employed to stabilize emulsions used in food industries. Plant-based proteins including zein originating from corn and pea proteins and oleosin from oilseeds like soy, canola, and rapeseed are being investigated because of their significant bioavailability, low autoimmune reaction profile, and preferred amino acid composition [13,14].
Many properties of emulsions can be analyzed based on their recorded near-infrared spectra and explained using classical multivariate analysis [15,16,17,18,19,20,21]. Near-infrared spectroscopy (NIRs) has been used for decades in the food industry [22,23,24]. The key benefits of this spectroscopic technique include low cost of analyses compared to standard analytical techniques, lack of sample preparation, and the capacity to investigate a wide range of products [24]. However, due to complexity of food matrixes, spectroscopic measurements often produce misleading results, and chemometrics is mostly utilized to analyze the collected NIR spectra. Chemometric approaches use mathematical and statistical tools to analyze the obtained data and extract as much information as possible. The following methods such as Principal Component Analysis (PCA), Canonical Correlation Analysis (CCA), Factorial Discriminant Analysis (FDA), Principal Component Regression (PCR), Common Components and Specific Weights Analysis (CCSWA), Partial Least Squares (PLS), and Artificial Neural Networks Method (ANNs) are frequently employed in the analysis of spectral data [5,19,25]. ANNs are effective tools for machine learning and data mining. Building non-linear models is how Artificial Neural Network (ANN) models aim to solve pattern recognition problems [5,20,26]. However, the fundamental drawback of employing ANNs is their stochastic character and computational complexity (ANN training results depend on the initial parameters) [27].
Therefore, the aim of this research was to build Artificial Neural Network (ANN) models for estimating physical (zeta potential and the average Feret droplet diameter) and chemical (total polyphenolic content, antioxidant activity determined by the DPPH, and the FRAP methods) characteristics of oil-in-aqueous oregano/rosemary extract emulsions based on their recorded NIR spectra. The emulsification was carried out in accordance with the experiments reported in the paper by Sirovec et al. [12]. According to our best knowledge, this is the first time NIRs have been used in combination with ANNs to predict both physical and chemical properties of oil-in-aqueous extract emulsions manufactured using natural plant pea protein as an emulsifier. The presented approach could be very useful for monitoring the medicinal plant aqueous extract encapsulation process through emulsification, especially regarding the total polyphenolic content and antioxidant activity. To ascertain the impact of NIR spectra preprocessing on the ANN models, various spectral preprocessing techniques (raw spectra, Savitzky–Golay smoothing, standard normal variate (SNV), and multiplicative scatter corrections (MSC)) were used.
2. Materials and Methods
2.1. Materials
2.1.1. Plants, Sunflower Oil, and Pea Protein Powder
Edible sunflower oil (VitaDor, Germany) was bought from a nearby grocery store. The organic pea protein powder was provided from Nutrigold (Zagreb, Croatia). Dried plant materials such as oregano (Origanum vulgare L.) and rosemary (Rosmarinus officinalis L.) were bought from SonnentoR (Sprögnitz, Austria) and Nutrigold (Zagreb, Croatia), respectively. Oregano and rosemary were harvested in the 2020 and 2021 growing seasons, dried naturally, and stored at room temperature until use. Austria (oregano) and India (rosemary) are the countries where the plants were originally grown.
2.1.2. Chemicals
Sigma-Aldrich Chemie provided TPTZ (2,4,6-tris(2-pyridyl)-s-triazine), gallic acid (98%), iron(II) sulphate heptahydrate, DPPH (1,1-diphenyl-2-picrylhydrazyl), and Trolox (6-hydroxy-2,5,7,8-tetramethylchromane-2 carboxylic acid) (Steinheim, Germany). Gram-Mol d.o.o. supplied 30% hydrochloric acid, hexahydrate iron(III) chloride, and sodium carbonate (Zagreb, Croatia). J.T. Baker supplied the sodium acetate trihydrate (Deventer, The Netherlands). Kemika d.d. (Zagreb, Croatia) supplied the Folin–Ciocalteu reagent, T.T.T. d.o.o. (Sveta Nedjelja, Croatia) supplied the acetic acid, and Carlo Erba Reagents S.A.S. supplied the methanol (France). The chemicals used were analytical reagent grade.
2.2. Methods
2.2.1. Solid-Liquid Extraction Procedure
A solid-liquid extraction technique was applied for preparation of the aqueous oregano/rosemary extracts. An amount of 12 g of dried plants was added to 600 mL of distilled water and preheated to 80 °C. The Ika HBR4 digital oil bath (IKA-Werk GmbH & Co. KG, Staufen, Germany) was used for the extraction performed under the following conditions: T = 80 °C, rotational speed = 250 rpm, and t = 30 min. The samples were then filtered through a 100% cellulose paper filter (LLG Labware, Meckenheim, Germany) with a pore diameter of 5–13 µm using a vacuum filtration system [12,28].
2.2.2. Pea Protein Dispersion in Aqueous Plant Extracts
Pea protein suspensions in aqueous oregano/rosemary extracts were prepared as described in the study by Sridharan et al. [29], with slight adjustments of their method [12]. To generate a 1% pea protein concentration, 4.5 g of pea protein powder was suspended in 450 mL of aqueous plant extracts. Following homogenization and pH adjustment to 7 (0.5 M NaOH), the pea protein solution was filtered through a filter paper with pore diameters ranging from 4 to 12 μm (Rundfilter, MN 640 m dia 11 cm, Macherey-Nagel, Düren, Germany). The 0.1 and 0.5% pea protein concentrations were made by diluting 1% pea protein concentration with a certain volume of distilled water.
2.2.3. Preparation of Oil-in-Water Emulsions Containing Oregano/Rosemary Extracts
The Box–Behnken experimental design was used for preparation of the oil-in-aqueous oregano/rosemary extract emulsions. The design was made separately for the oregano (17 experiments) and for the rosemary emulsions (17 experiments), resulting in 34 samples of emulsions altogether. The independent variables tested were oil concentration (10, 15, and 25%), emulsifier content (0.1, 0.5, and 1%), and homogenization rate (15,000, 25,000, and 35,000 min−1). The procedure was previously described by Sirovec et al. [12]. Briefly, a specific volume of aqueous plant extracts with a proper concentration of emulsifier was combined with a specific volume of sunflower oil in a 15 mL falcon test tube (total volume of 7 mL). Batch emulsification was performed using an OMNI TH220-PCRH homogenizer (Omni International, Kennesaw, GA, USA). The duration of homogenization was 4 min.
2.2.4. Dry Matter Content Measurement
Plant materials (1–5 ± 0.0001 g) were dried to a constant weight at 105 °C for the duration of 3 h [30]. All measurements were performed in duplicate.
2.2.5. Zeta Potential Measurement
Immediately after emulsification, the zeta potential of oil-in-aqueous oregano/rosemary extract emulsions was measured as described previously by Sirovec et al. [12].
2.2.6. The Average Feret Droplet Diameter Measurement
Using a microscope with a camera, samples of the prepared oregano/rosemary emulsions were captured at 10× magnification (BTC type LCD-35, Bresser, Germany). Using the software program ImageJ (v.1.8.0. National Institutes of Health, Bethesda, MD, USA), the average Feret droplet diameter was determined for each emulsion as the average value of 30 measurements of the Feret droplet diameter [12].
2.2.7. Measurement of Total Polyphenolic Content and Antioxidant Activity of the Prepared Emulsions
As previously described by Singleton and Rossi [31], the total polyphenolic content (TPC) of the oil-in-aqueous oregano/rosemary extract emulsions was assessed spectrophotometrically. All measurements were carried out in duplicate. The results were expressed as mg of gallic acid equivalents per gram of dry matter of plant material [12]. DPPH and FRAP were used to determine the antioxidant activity of the oil-in-aqueous oregano/rosemary extract emulsions. According to Brand-Williams et al. [32], the DPPH (1,1-diphenyl-2-picrylhydrazyl) scavenging method was used. The results were presented in duplicate as mmol Trolox equivalents per gram of dry plant material [12]. According to Benzie and Strain [33], the Ferric ion reducing antioxidant power (FRAP) assay was carried out. The results were presented in duplicate as mmol FeSO4·7H2O equivalents per gram of dry plant material [12].
2.2.8. Near-Infrared Spectroscopy (NIR)
Samples were diluted 200 times in distilled water prior to NIR measurements. An NIR spectrophotometer NIR-128L-1.7-USB/6.25/50 μm (Control Development, South Bend, IN, USA) with the installed software Spec32 and a halogen light source was applied to measure the near-infrared spectra of the prepared emulsions (a total of 34 samples). The complete spectral range (904 nm–1699 nm) was covered by three consecutive runs for each emulsion, and the mean value of the spectra was further used [5,34].
2.2.9. NIR Data Preprocessing
Using the Unscrambler X software (Version 10.1. CAMO AS, Oslo, Norway), the effectiveness of the preprocessing techniques for NIR spectra on sample grouping was evaluated. Raw spectra, Savitzky–Golay smoothing (SG), standard normal variate (SNV), and multiplicative scatter corrections (MSC) were examined as preprocessing techniques. Principal Component Analysis (PCA) was also performed using raw and preprocessed spectra. Statistica 14.0 (TIBCO®® Statistica, Palo Alto, CA, USA) was used to perform PCA.
2.2.10. Artificial Neural Network (ANN) Modeling
Artificial Neural Network (ANN) modeling was used for the prediction of physical (zeta potential and the average Feret droplet diameter) and chemical (total polyphenolic content and antioxidant activity) characteristics of the oil-in-aqueous oregano/rosemary extract emulsions. ANN models were also developed for the prediction of physical properties, the prediction of chemical properties, and for the simultaneous prediction of physical and chemical properties. Multiple Layer Perceptron (MLP) networks were developed using the software Statistica 14.0. (TIBCO®® Statistica, Palo Alto, CA, USA). ANNs consist of three layers: input, hidden, and output. Developed ANNs consisted of 4 neurons in the input layer that represent the coordinates of the first four factors obtained from PCA. The four factors’ principal components contributed to more than 99.99% of the data variability. The number of hidden layer neurons ranged from 4 to 13, and they were randomly selected by the algorithm. Identity, Logistic, Hyperbolic tangent, and Exponential functions were chosen randomly as the hidden activation functions and the output activation functions. The data set for the construction of ANNs was 68 × 9, with 68 rows representing oil-in-aqueous plant extract emulsions, 4 columns representing 4 PCA coordinates (factors), and 5 columns representing the results for zeta potential, the average Feret droplet diameter, TPC, DPPH, and FRAP. To ensure the development of the relabel models, cross validation implemented in Statistica 14.0. (TIBCO®® Statistica, Palo Alto, CA, USA) was used. A subsampling strategy was applied. Random subsampling with 5 subsamples and 1000 seeds for subsampling was used. The back error propagation algorithm was used for model training, and the error function was the sum of squares. R2 and Root Mean Square Error (RMSE) values for training, testing, and validation were used to estimate the performance of developed models. In order to develop ANN, data were randomly divided into three categories: network training (70%—48 data points), model test (15%—10 data points), and model validation (15%—10 data points).
3. Results and Discussion
3.1. NIR Spectra of the Prepared Emulsions
The objective of this study was to investigate the feasibility of NIR spectroscopy to evaluate the physical and chemical properties of oil-in-aqueous oregano/rosemary extract emulsions using pea proteins as an emulsifier. According to Sridharan et al. [29], oil-in-water emulsions are usually used in food products to provide texture and/or preserve the encapsulated components. Oil/water interfaces of food-grade emulsions can be stabilized by proteins, either animal or, lately intensively used, plant proteins [35,36]. Among many proteins, pea proteins stand out as widespread vegetarian diet, gluten-free, and minimal allergenicity molecules, indicating that they are safe for a wide range of people, and were therefore considered as a surfactant throughout this study [37].
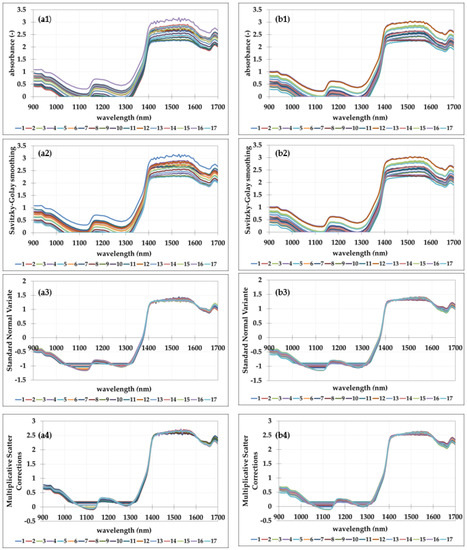
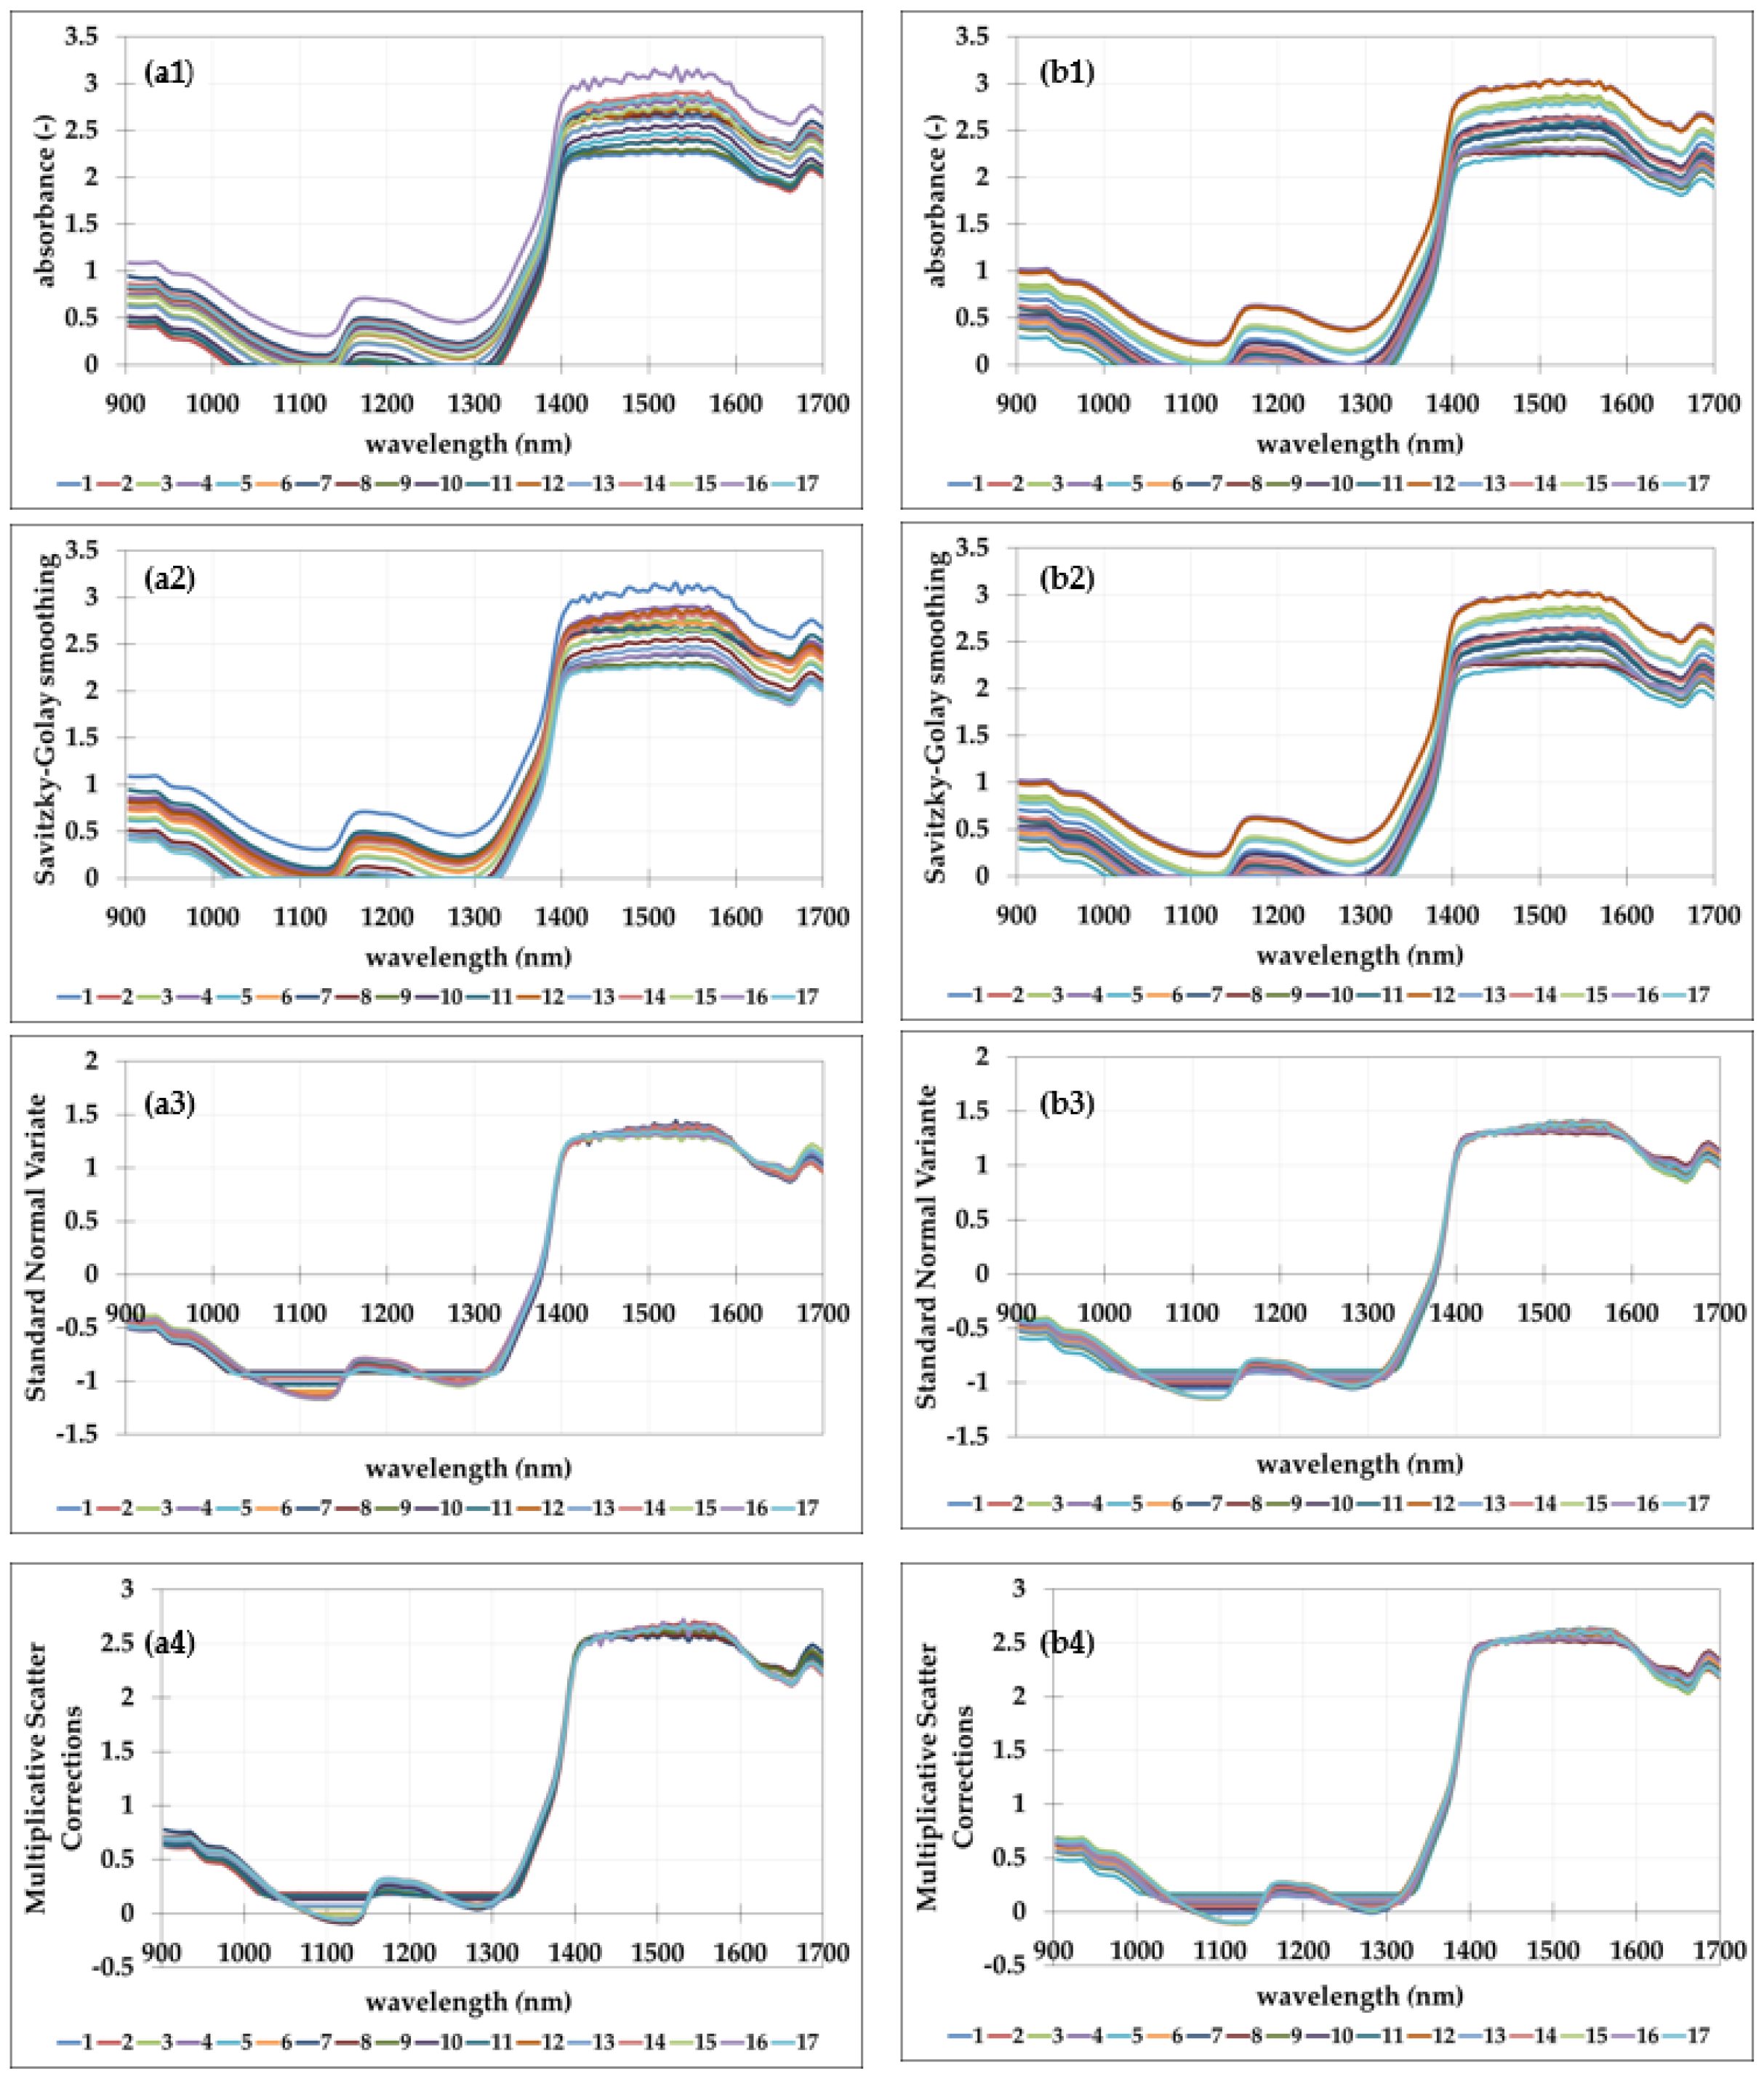
The continuous NIR spectra of oil-in-aqueous plant extract emulsions formed with pea proteins were collected in range from 904 to 1699 nm. Figure 1 depicts the mean raw spectra and preprocessed spectra of 17 samples of oil-in-oregano extract emulsions and oil-in-rosemary extract emulsions produced based on the Box–Behnken experiment designs.
Figure 1.
NIR spectra of oil-in-aqueous plant extract emulsions: (a1) raw spectra of oregano aqueous extract emulsions; (b1) raw spectra of rosemary aqueous extract emulsions; (a2) oregano aqueous extract emulsions spectra after Savitzky–Golay smoothing (SG); (b2) rosemary aqueous extract emulsions spectra after Savitzky–Golay smoothing (SG); (a3) oregano aqueous extract emulsions spectra after standard normal variate (SNV) preprocessing; (b3) rosemary aqueous extract emulsions spectra after Savitzky–Golay smoothing (SG); (a4) oregano aqueous extract emulsions spectra after multiplicative scatter corrections (MSC) preprocessing; (b4) rosemary aqueous extract emulsions spectra multiplicative scatter corrections (MSC) preprocessing.
It is clear that the raw spectra including both types of emulsions correspond to a single absorbance pattern (Figure 1(a1,b1)). This can be explained by the fact that water is the most abundant component in the prepared emulsions; therefore, spectra have the same specific pattern characteristic of the aqueous samples. For the emulsions with oregano extract, there are no specific outliers. On the other hand, for the emulsions with rosemary extract, it can be noticed that the spectra for the emulsion prepared according to experimental condition 4 (25% of oil, 1% of emulsifier, and 35,000 rpm) show slightly higher absorbance than other prepared emulsions along the whole analyzed wavelength range. This is probably a consequence of the higher amount of the used emulsifier. There are additional variances in the amplitude of typical wavelength bands extending from 900 to 1050 nm, 1100 to 1300 nm, and 1400 to 1699 nm. The C-H and N-H 3rd overtones, the C-H 2nd overtone, and the O-H and N-H 2nd overtones, respectively, correspond to selected spectral areas [38,39]. The wavelength region from 1400 to 1699 nm, which is unique for the superposition of the O-H bonds, shows the most obvious variations in the spectral profiles of both sample types. As mentioned before by Valinger et al. [5], the discrepancies in this region of the spectrum are clearly associated with the amount of water in the samples.
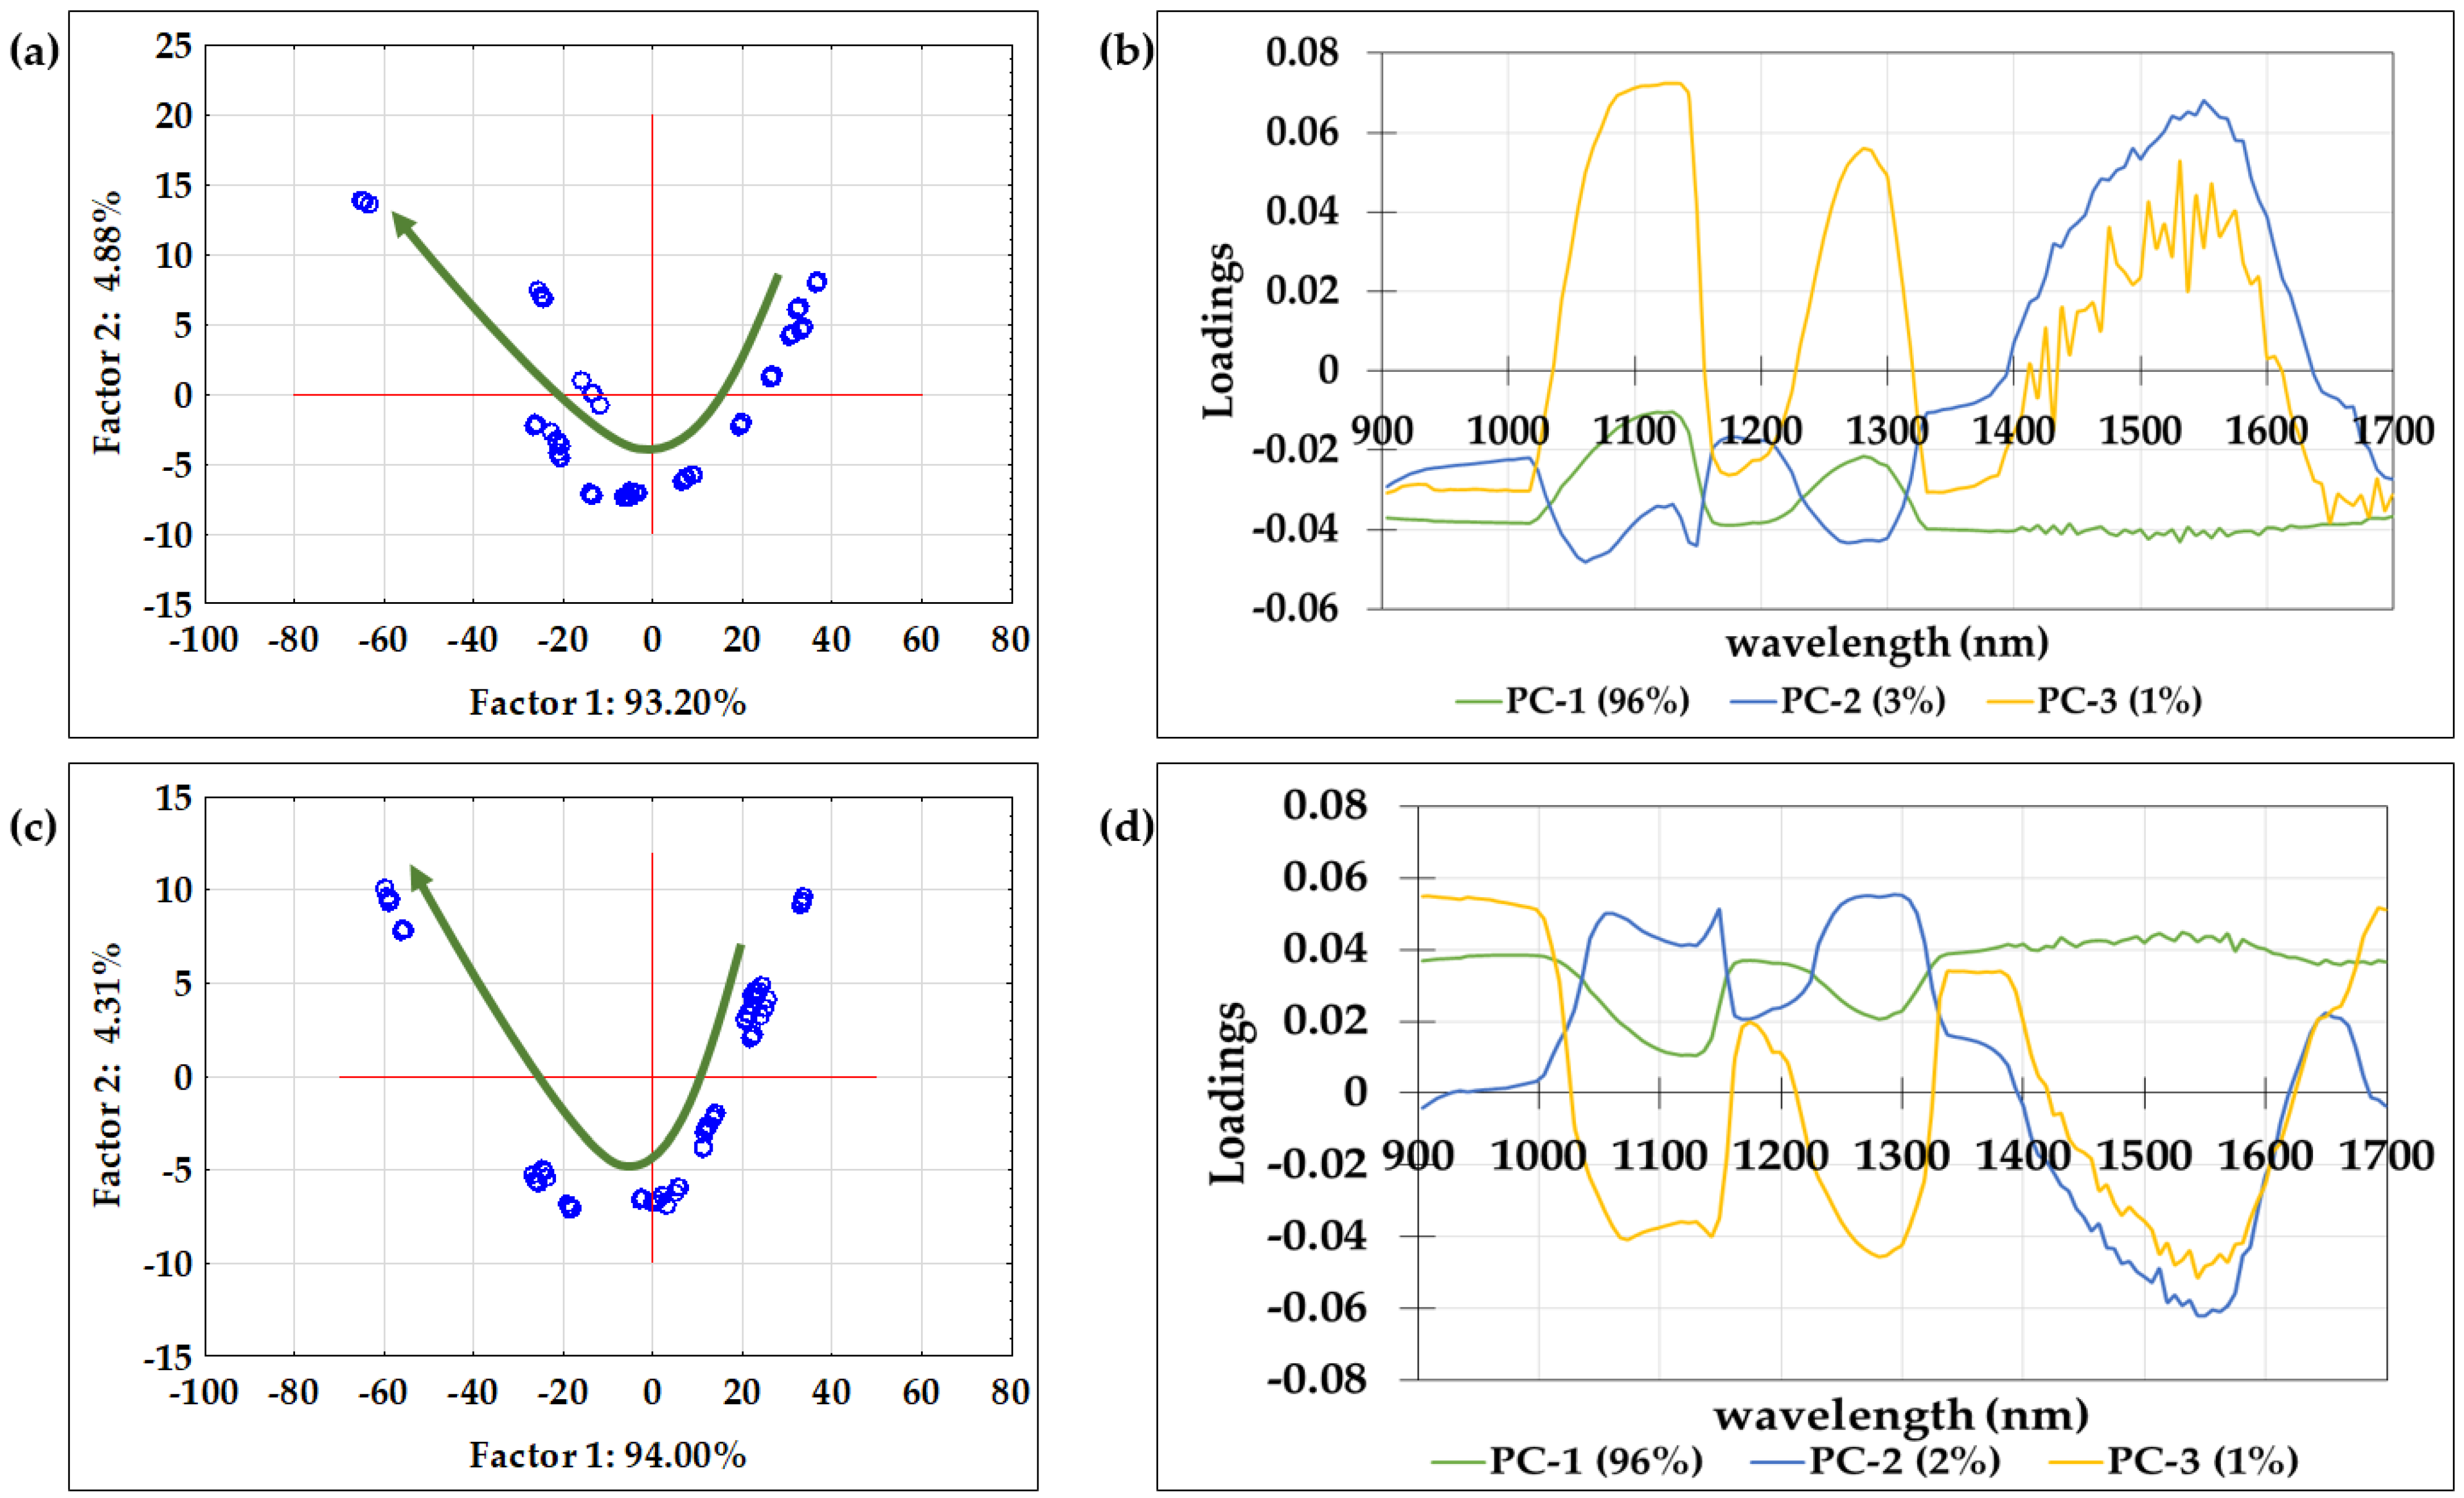
As mentioned in the introduction of this work, the motivation for this research was to analyze whether it is possible to interpret the physical as well as chemical characteristics of the produced oil-in-aqueous oregano/rosemary extract emulsions based on the NIR spectra. However, according to Gál et al. [40], because spectral data comprise a large amount of information which could be partially visible, understanding the spectra in connection to the detected physical as well as chemical properties of the materials is difficult. Because of that, chemometric tools must be applied. One of the most prominent chemometric methodologies for recognizing the variations across samples and decreasing the amount of attributes is Principal Component Analysis [41]. PCA significantly reduces the number of variables; it can account for the most variability, beginning with the first factor containing the greatest variance explained and ending with the final factor with the least variance explained [26]. Besides the fact that PCA enables observation of the variety between spectra by evaluating the scores, studying the loadings derived from PCA also provides insight into the source of the observed variability [42]. In this study, PCA was used to compare the raw NIR spectra of the produced oil-in-aqueous oregano/rosemary extract emulsions. Figure 2 depicts the derived PCA score plot and the corresponding loading plots of raw NIR spectra of both types of emulsions.
Figure 2.
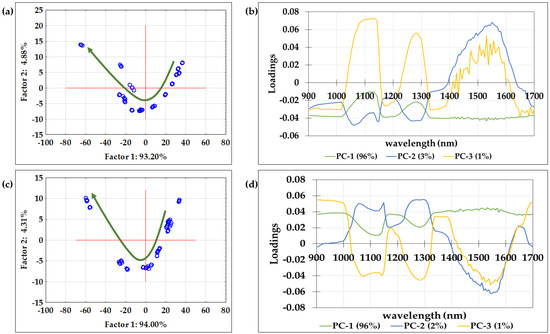
PCA score plots of 68 raw NIR spectra of (a) oil-in-oregano aqueous extract emulsions and (c) oil-in-rosemary aqueous extract emulsions and corresponding loading plots for (b) oil-in-oregano aqueous extract emulsions and (d) oil-in-rosemary aqueous extract emulsions. The green arrows present the direction of sample grouping according to the growing quantity of emulsifier used for sample preparation.
It is evident that first and second principle components account for more than 98% of the overall variation for both types of emulsions. For emulsions prepared with oregano aqueous extract, the first four PCs have eigenvalues greater than 1 (PC1–741.8385, PC2-38.8130, PC3-11.4431, and PC4-2.5197), and those four components explain over 99.9% of overall data variation. In the case of emulsions prepared from rosemary aqueous extract, again, the first four PCs have eigenvalues greater than 1 (PC1-748.2248, PC2-34.2854, PC3-7.8000, and PC4-3.7133), and those four components also explain over 99.9% of the variation in the data. Loading plots (Figure 2b,d), on the other hand, showed that PC-1 for oregano extract emulsions is negatively correlated with wavelengths in a range from 900 to 1400 nm and positively correlated with wavelengths in a range from 1400 to 1600 nm, while for the rosemary extract emulsions, completely inverse outcomes were achieved. For both types of samples, the highest absolute value of absorbance was noticed at 1550 nm corresponding to the NH first overtone. Moreover, loading analyses showed that PC-2 and PC-3 have the opposite trend to PC-1 but follow the same trend for both samples. Maximum loading for PC-2 and PC-3 were obtained at 1100 nm, 1250 nm, and 1550 nm, corresponding to the CH second overtone and NH first overtone, respectively. Furthermore, loading belonging to PC-3 for oil-in-oregano aqueous extract emulsions is noisy at this range, indicating the necessity of spectra preprocessing. Based on the results presented in Figure 1(a2–a4,b2–b4), it can be noticed that the smoothing influence is not apparent visually, while SNV and MSC revealed the highest spectral differences in wavelength ranges from 900 to 1000 nm, from 1050 to 1150 nm, from 1250 to 1350 nm, and from 1500 to 1560 nm.
PCA of the raw NIR spectra indicated particular specimen groupings all along the PCA score plot (Figure 2a,c). A thorough examination of the findings shows that they had been classified based on the quantity of emulsifier used for sample preparation in the direction of the green arrows shown in Figure 2a,c. The samples with the least amount of emulsifying agent were positioned in the first quadrant, while those with the most emulsifying agent were positioned in the second quadrant. The samples could not be distinguished based on the amount of oil used or the rotational speed used for emulsification. Comparable findings were given by Grgić et al. [19] who noticed sample grouping based firstly on the type of the emulsifier and based secondly on the amount of the emulsifier used. Based on the above, NIR spectra can be efficiently used to discriminate oil-in-water emulsion samples.
3.2. ANN Modeling of Oil-in-Aqueous Oregano/Rosemary Extract Emulsions Selected Physical and Chemical Properties Based on NIR Spectra
Several examples in the literature demonstrate that NIR spectroscopy has great capability for quantifying the diameter and moisture content of oil-in-water emulsions [17,19,20,43]. When working with emulsions, however, various interferences such as specimen width, measurement geometry, or specimen physical characteristics may affect the light passing distance and lead the spectra to alter [44,45]. Therefore, it is sometimes important to include preprocessing into the development of chemometric models using NIR spectra [46]. Besides the raw NIR spectra, preprocessed NIR spectra were also used, and the effectiveness of the preprocessing on the ANN models was tested. Preprocessing included several methods: Savitzky–Golay smoothing (SG), standard normal variate (SNV), and multiplicative scatter corrections (MSC). Savitzky–Golay (SG) smoothing is a popular preprocessing approach that successfully eliminates disturbances such as baseline drift and tilt [47]. Smoothing parameters include the polynomial degree, polynomial derivative order, and number of smoothing points [42,48]. Multiplicative signal correction (MSC) is a technique used when the two principal impacts are present in the samples. The spectra are modified for the baseline and multiplicative amplification influence, and a reference spectrum is defined, which is normally the average spectrum of the calibration inputs collection [42,45,46,49]. By reducing the average value for the whole spectrum and afterwards dividing the outcome by the standard deviation of the complete spectrum, the standard normal variate (SNV) reduces a continuous offset term [42,45,46,49]. ANN models were developed separately for both types of emulsions. Because of their non-linearity, ANNs have already been proposed as an effective tool for interpreting spectrum information [26,50,51]. The ANN learning algorithm appears to be a viable replacement for traditional two-dimensional calibration techniques utilized throughout NIR spectroscopy [5,20].
Table 1 and Table 2 show ANN structures for individual output factor and emulsion category, with the resulting coefficients of determination for every output variable indicated in Table 3 and Table 4. The R2 and RMSE values for training, testing, and validation, in addition to the number of hidden layer neurons, were used to choose the most effective ANN design. For the oregano emulsion, the ANNs established for the prediction of emulsion chemical characteristics achieved the best training, testing, and validation results, followed by the ANNs developed for the concurrent prediction of chemical and physical characteristics and ANNs developed for the prediction of physical characteristics. The findings can explain the greater dispersion of data describing the physical properties of oil-in-oregano aqueous extract emulsions. It can also be noticed that preprocessing of the NIR spectra did not contribute to higher ANN model accuracy. The positive effect of the SNV preprocessing method was only observed on the Feret diameter as the analyzed model output. The multilayer perceptron (MLP) Artificial Neural Network MLP 4-5-3, considered as the most favorable for the representation of chemical properties of oil-in-aqueous oregano extract emulsions (R2training = 0.9853, RMSEtraining = 6.0391, R2test = 0.9812, RMSEtest = 7.7728, R2validation = 0.9674, RMSEvalidation = 11.3507) based on the NIR spectral region, had four neurons in the input layer, five neurons in the hidden layer, and three neurons in the output layer (Table 1). Tanh was the hidden activation function, and Exponential was the output activation function.
Table 1.
The structure of ANNs chosen to describe physical properties (P) including zeta potential and Feret diameter, chemical properties (C) including TPC, DPPH and FRAP, and combined physical/chemical (P + C) properties of aqueous oregano extract emulsions according to various NIR spectra pretreatments.
Table 2.
The structure of ANNs chosen to describe the physical properties (P) including zeta potential and Feret diameter, chemical properties (C) including TPC, DPPH and FRAP, and combined physical/chemical (P + C) properties of aqueous rosemary extract emulsions according to various NIR spectra pretreatments.
Table 3.
Correlation coefficients (R2) and Root Mean Square Errors (RMSEs) of ANN models for description of aqueous oregano extract emulsion physical properties (P) including zeta potential and Feret diameter, chemical properties (C) including TPC, DPPH and FRAP, and combined physical/chemical (P + C) properties according to various NIR spectra pretreatments.
Table 4.
Correlation coefficients (R2) and Root Mean Square Errors (RMSEs) of ANN models for description of aqueous rosemary extract physical properties (P) including zeta potential and Feret diameter, chemical properties (C) including TPC, DPPH and FRAP, and combined physical/chemical (P + C) properties according to various NIR spectra pretreatments.
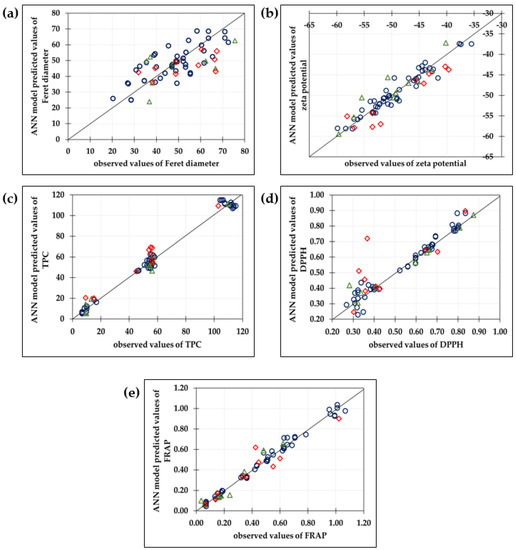
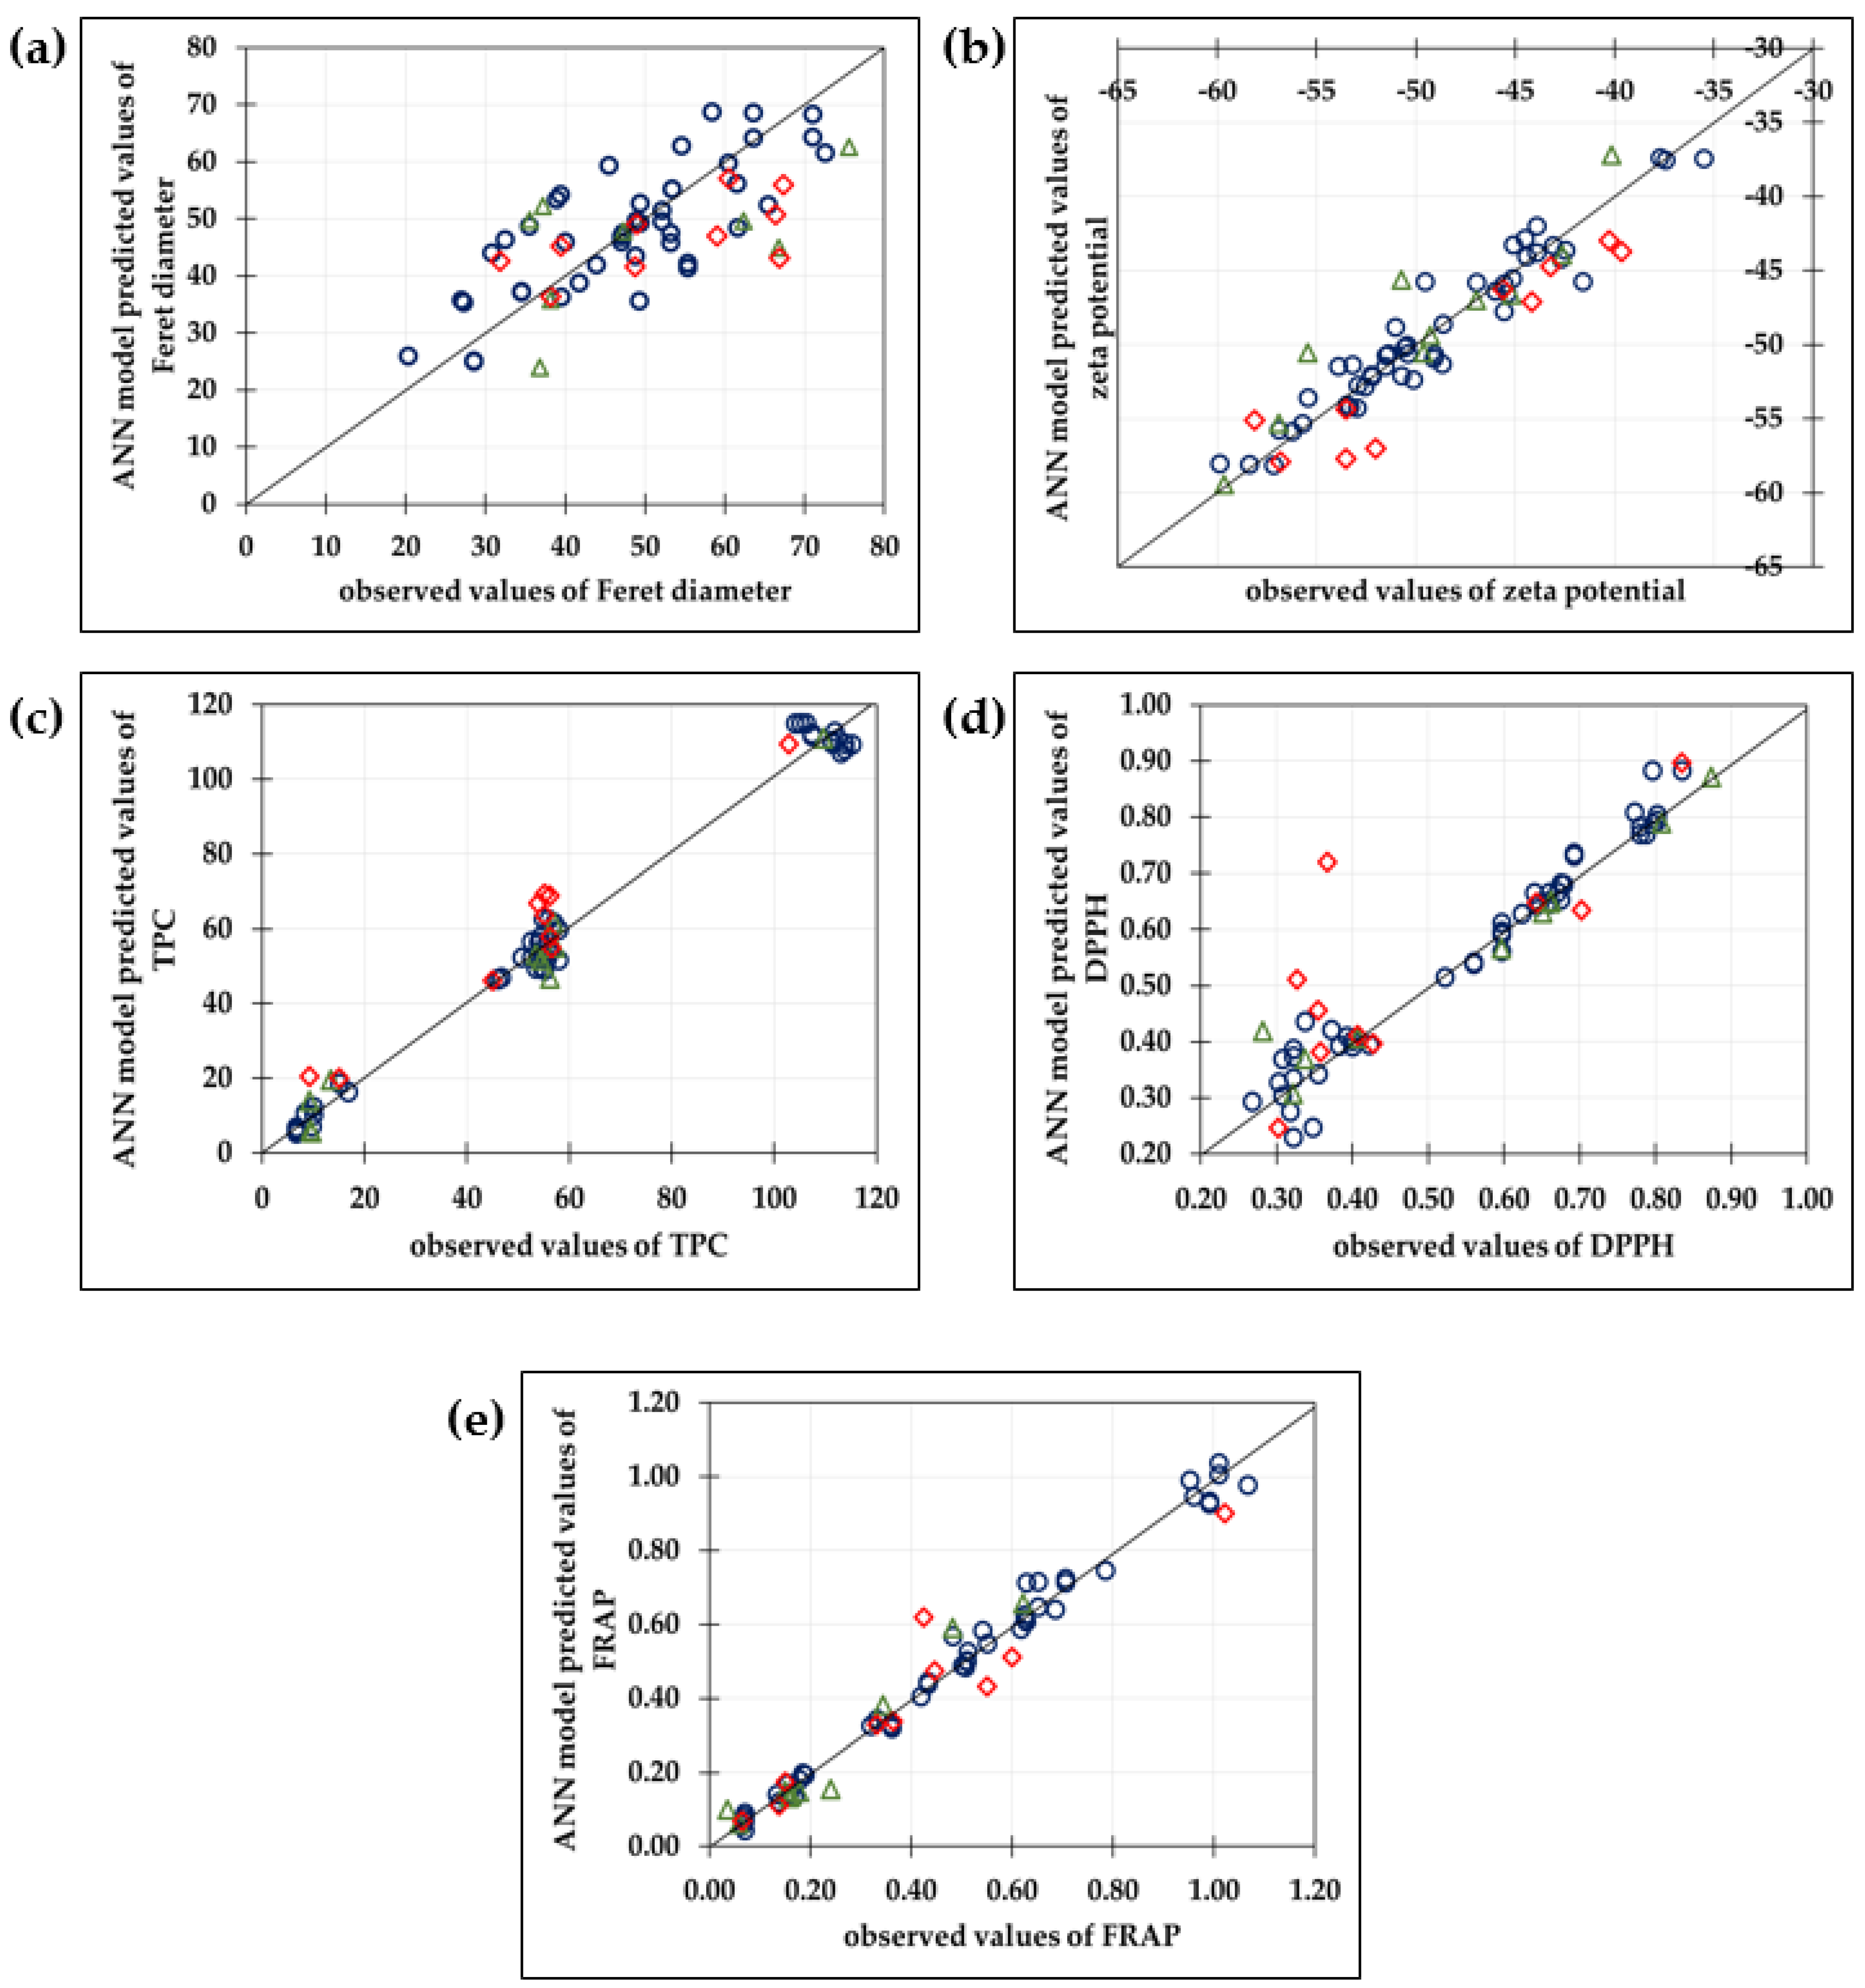
Selected ANNs described all three analyzed chemical properties (Table 4) with high precision (R2training (TPC) = 0.9982, RMSEtraining (TPC) = 3.4746, R2test (TPC) = 0.9953, RMSEtest (TPC) = 3.9415, R2validation (TPC) = 0.9894, RMSEvalidation (TPC) = 6.5336; R2training(DPPH) = 0.9899, RMSEtraining (DPPH) = 0.0276, R2test(DPPH) = 0.9695, RMSEtest (DPPH) = 0.0340, R2validation (DPPH) = 0.9630, RMSEvalidation (DPPH) = 0.0443; R2training (FRAP) = 0.9756, RMSEtraining (FRAP) = 0.065, R2test (FRAP) = 0.9742, RMSEtest (FRAP) = 0.0883, R2validation (FRAP) = 0.9499, RMSEvalidation (FRAP) = 0.1022). On the other hand, results showed that developed ANN models based on the NIR spectra of the prepared emulsions were not reliable for Feret diameter prediction. To develop a more suitable model, specific wavelength fingerprint selection would probably be required. Furthermore, the results show the high potential of the developed ANN model for the simultaneous prediction of selected physical and chemical properties of aqueous oregano extract emulsions (Table 3 and Figure 3) using raw NIR spectra. According to R2 and RMSE values, MLP 4-6-5 is the most suitable for the description of the zeta potential data (R2validation (zeta potential) = 0.8418, RMSEvalidation (zeta potential) = 3.3636) and TPC data (R2validation (TPC) = 0.8741, RMSEvalidation (TPC) = 28.3374). Zeta potential data (Figure 3b) were distributed evenly around the whole spectrum, while for the TPC data, sample grouping in three groups (Figure 3c) was noticed. As given in Figure 3 for DPPH data alone (Figure 3d), specific outliers can be noticed. Based on the experimental values of zeta potential (in range from −30 mV to −60 mV), it can be concluded that the prepared emulsions are stable. According to the literature, emulsions with zeta potential values less than −30 mV or greater than +30 mV are classified as stable [52].
Figure 3.
Comparison between observed and ANN model predicted values of physical (a) Feret diameter, (b) zeta potential and chemical properties (c) total polyphenolic content (TPC), (d) antioxidant activity measured by DPPH method, (e) antioxidant activity measured by FRAP method of oil-in-oregano aqueous extract emulsions based on the NIR spectra. A selected ANN model was used for the simultaneous prediction of physical and chemical properties of the analyzed samples. (o—traning data set; ∆—test data set; ◊—validation data set).
According to the findings for the emulsions with oregano (Table 2), the ANNs established for the estimation of emulsion chemical characteristics had the maximum training, testing, and validation performances, followed by the ANNs established for the simultaneous assessment of chemical and physical characteristics and the ANNs established for the assessment of physical characteristics.
Equivalent outcomes were produced by Valinger et al. [5] for modeling the physical and chemical properties of olive leaf aqueous extract based on NIR spectra, by Marić et al. [53] and Jurinjak Tušek et al. [54] for modeling the physical and chemical properties of root vegetable extract based on NIR spectra, and Valinger et al. [26] for modeling the physical and chemical properties of industrial hemp aqueous extract based on NIR spectra. The same trend can be seen for raw spectra and the selected preprocessing methods. It is also important to mention that spectra preprocessing did not have a positive effect on the training, testing, and validation performances of ANN models. On the contrary, the used preprocessing methods resulted in decreases in training, testing, and validation performances of ANN models, particularly models used to predict emulsion physical properties. The decrease in the model’s accuracy was mostly evidenced for the Feret diameter as the ANN model output variable. This can be explained by the fact that preprocessing can reduce valuable data or increase the impact of irrelevant data [55]. Therefore, the fact that the ANN model developed based on the raw spectra shows higher accuracy can be considered an important advantage and very important and applicable result.
As for the oil-in-aqueous oregano extract emulsions, in the case of oil-in-aqueous rosemary extract emulsions, the developed ANN model based on the raw NIR spectra was the most suitable for the description of chemical properties. The MLP 4-4-3 (R2training = 0.9456, RMSEtraining = 10.3888, R2test = 0.9225, RMSEtest = 11.9938, R2validation = 0.8989, RMSEvalidation = 20.0926) chosen as predictor of chemical properties of oil-in-aqueous rosemary extract emulsions was able to describe all three analysis output variables with high precision (R2training (TPC) = 0.9718, RMSEtraining (TPC) = 4.5579, R2test (TPC) = 0.9460, RMSEtest (TPC) = 4.8426, R2validation (TPC) = 0.8519, RMSEvalidation (TPC) = 7.9168; R2training(DPPH) = 0.9493, RMSEtraining (DPPH) = 0.0316, R2test(DPPH) = 0.9436, RMSEtest (DPPH) = 0.0410, R2validation (DPPH) = 0.8942, RMSEvalidation (DPPH) = 0.0434; R2training (FRAP) = 0.9719, RMSEtraining (FRAP) = 0.0458, R2test(FRAP) = 0.9158, RMSEtest (FRAP) = 0.0488, R2validation (FRAP) = 0.8556, RMSEvalidation (FRAP) = 0.0523).
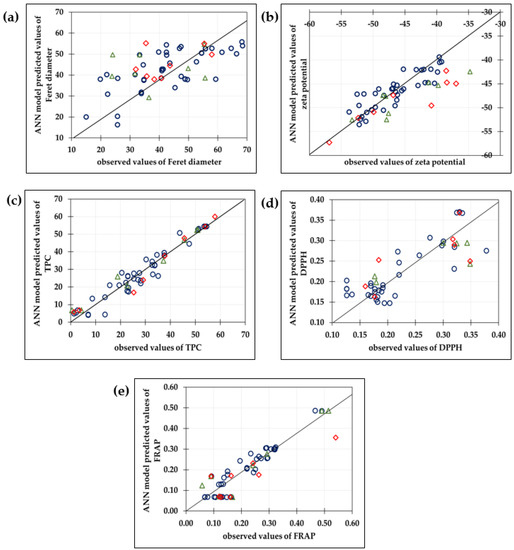
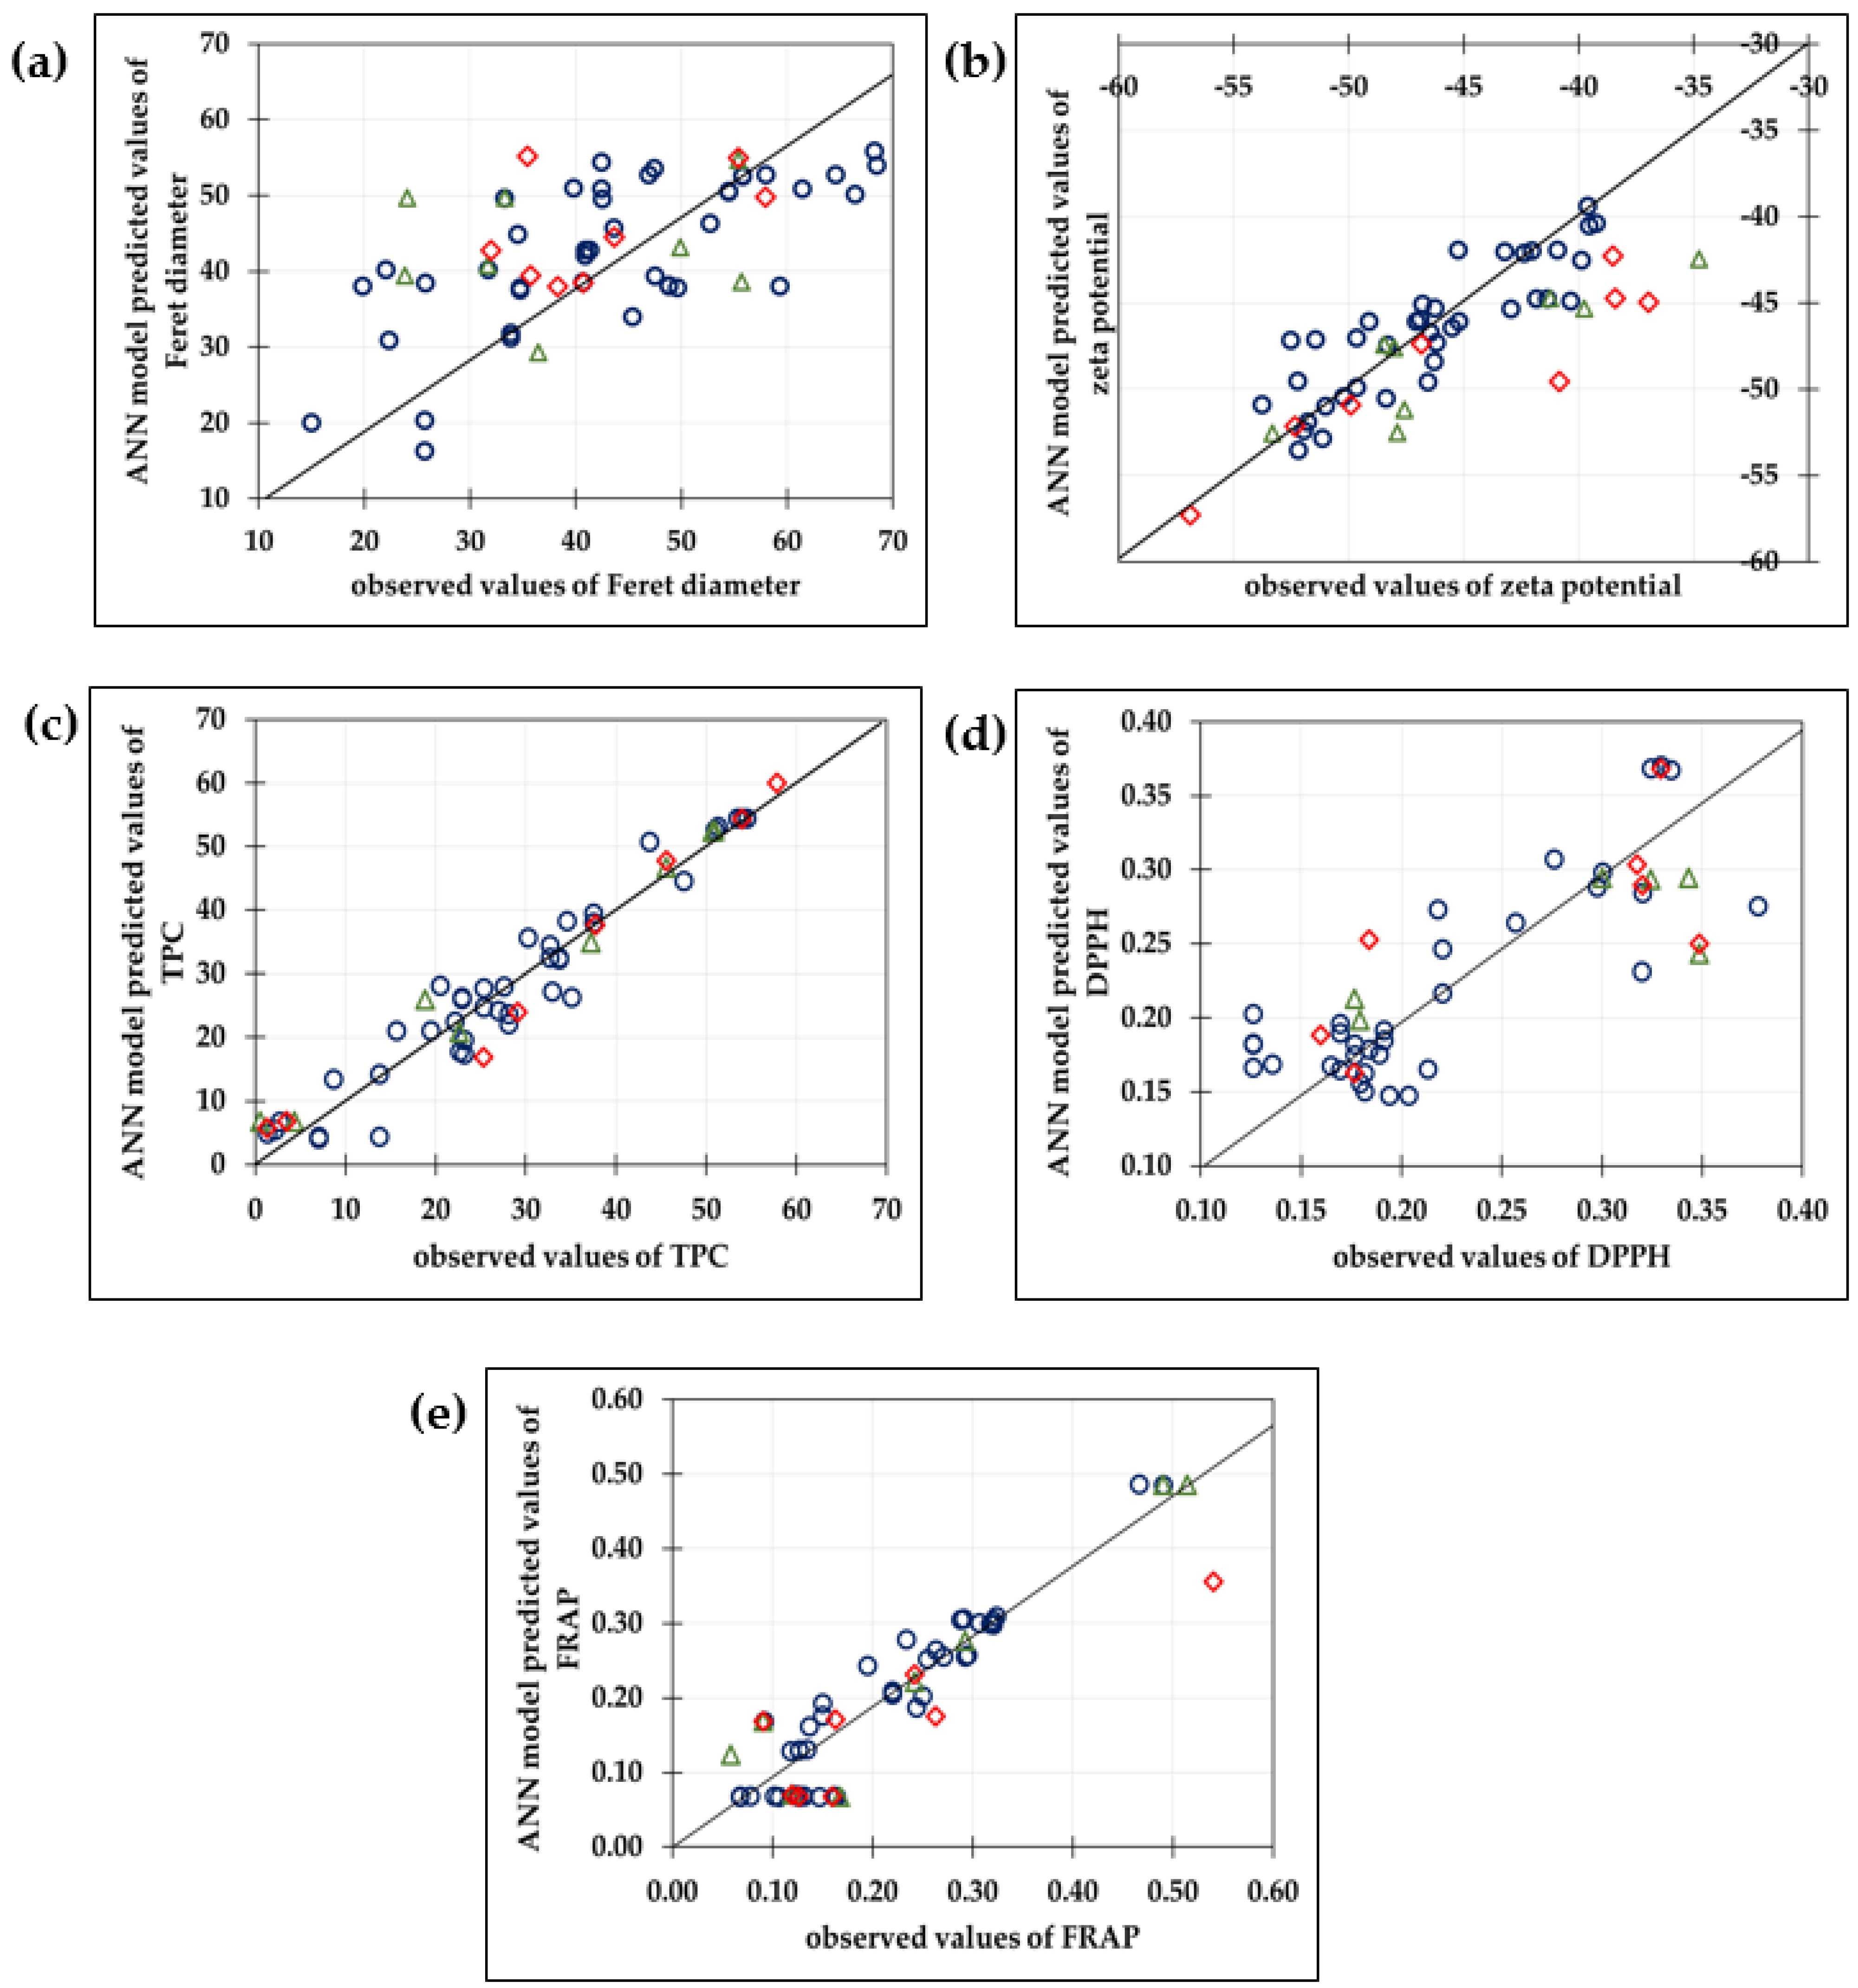
Moreover, MLP 4-6-5 (R2training = 0.8889, RMSEtraining = 42.5650, R2test = 0.8133, RMSEtest = 57.3472, R2validation = 0.7999, RMSEvalidation = 117.9804) designed for the concurrent prediction of physical and chemical properties of the analyzed emulsion based on raw NIR spectra was able to describe the FRAP (R2training = 0.9441, RMSEtraining = 0.0429, R2test = 0.9355, RMSEtest = 0.0550, R2validation = 0.9056, RMSEvalidation = 0.0883), TPC (R2training = 0.9877, RMSEtraining = 3.7226, R2test = 0.9756, RMSEtest = 3.9809, R2validation = 0.9638, RMSEvalidation = 0.4216), and zeta potential (R2training = 0.8510, RMSEtraining = 4.1106, R2test = 0.8497, RMSEtest = 4.7355, R2validation = 0.7922, RMSEvalidation = 5.5010) with high precision (Table 4 and Figure 4). The presented results confirm previous studies [17,19,20,43] indicating NIR spectroscopy coupled with ANN modeling can be efficiently used for monitoring oil-in-water emulsion properties. Nevertheless, because the physical and chemical characteristics of the obtained emulsions varied depending on the aqueous phase properties, it is possible to conclude that the developed models might be employed particularly for the selected emulsification process.
Figure 4.
Comparison between observed and ANN model predicted values of physical (a) Feret diameter, (b) zeta potential and chemical properties (c) total polyphenolic content (TPC), (d) antioxidant activity measured by DPPH method, (e) antioxidant activity measured by FRAP method of oil-in-rosemary aqueous extract emulsions based on the NIR spectra. The selected ANN model was used for the simultaneous prediction of physical and chemical properties of the analyzed samples. (o—traning data set; ∆—test data set; ◊—validation data set).
4. Conclusions
NIR spectroscopy combined with ANN modeling may be effectively utilized to monitor the parameters of oil-in-water emulsions in qualitative as well as quantitative manners. Given the physical and chemical features of the resulting emulsion changed depending on the aqueous phase parameters, it can be deduced that the created models may be used specifically for the chosen emulsification procedure.
Author Contributions
Conceptualization, A.J.T. and T.J.; methodology, M.B.; software, D.V.; formal analysis, S.S. and T.S.C.; writing—original draft preparation, S.S. and T.J.; writing—review and editing, A.J.T. and J.G.K.; visualization, M.B. and D.V.; supervision, J.G.K. All authors have read and agreed to the published version of the manuscript.
Funding
This research received no external funding.
Institutional Review Board Statement
Not applicable.
Informed Consent Statement
Not applicable.
Data Availability Statement
Not applicable.
Conflicts of Interest
The authors declare no conflict of interest.
References
- Chakrabartty, I.; Mohanta, Y.K.; Nongbet, A.; Mohanta, T.K.; Mahanta, S.; Das, N.; Saravanan, M.; Sharma, N. Exploration of Lamiaceae in cardio vascular diseases and functional foods: Medicine as food and food as medicine. Front. Pharmacol. 2022, 13, 2041. [Google Scholar] [CrossRef] [Scilit] [PubMed]
- Michel, J.; Abd Rani, N.Z.; Husain, K. A Review on the potential use of medicinal plants from Asteraceae and Lamiaceae plant family in cardiovascular diseases. Front. Pharmacol. 2020, 11, 852. [Google Scholar] [CrossRef] [Scilit]
- Hossain, M.B.; Barry-Ryan, C.; Martin-Diana, A.B.; Brunton, N.P. Effect of drying method on the antioxidant capacity of six Lamiaceae herbs. Food Chem. 2010, 123, 85–91. [Google Scholar] [CrossRef] [Scilit]
- Munin, A.; Edwards-Lévy, F. Encapsulation of natural polyphenolic compounds: A review. Pharmaceutics 2011, 3, 793–829. [Google Scholar] [CrossRef] [Scilit]
- Dawurung, C.J.; Nguyen, M.T.H.; Pengon, J.; Dokladda, K.; Bunyong, R.; Rattanajak, R.; Kamchonwongpaisan, S.; Nguyen, P.T.M.; Pyne, S.G. Isolation of bioactive compounds from medicinal plants used in traditional medicine: Rautandiol B, a potential lead compound against Plasmodium falciparum. BMC Complement Med. Ther. 2021, 21, 231. [Google Scholar] [CrossRef] [Scilit] [PubMed]
- Fang, Z.; Bhandari, B. Encapsulation of polyphenols–A review. Trends Food Sci. Technol. 2010, 21, 510–523. [Google Scholar] [CrossRef] [Scilit]
- Benita, S. Microencapsulation: Methods and Industrial Applications, 2nd ed.; CRC Press: Boca Raton, FL, USA, 2005. [Google Scholar]
- Shanthi, C.N.; Gupta, D.; Kumar Mahato, A. Traditional and emerging applications of microspheres: A Review. Int. J. Pharm Tech. Res. 2010, 2, 675–681. [Google Scholar]
- Lu, W.; Kelly, A.L.; Miao, S. Emulsion-based encapsulation and delivery systems for polyphenols. Trends Food Sci. Technol. 2016, 47, 1–9. [Google Scholar] [CrossRef] [Scilit]
- McClements, D.J.; Li, Y. Structured emulsion-based delivery systems: Controlling the digestion and release of lipophilic food components. Adv. Colloid Interface Sci. 2010, 159, 213–228. [Google Scholar] [CrossRef] [Scilit]
- Tan, C.; McClements, D.J. Application of advanced emulsion technology in the food industry: A review and critical evaluation. Foods 2021, 10, 812. [Google Scholar] [CrossRef] [Scilit]
- Sirovec, S.; Jurinjak Tušek, A.; Benković, M.; Valinger, D.; Sokač Cvetinić, T.; Gajdoš Kljusurić, J.; Jurina, T. Emulsification of rosemary and oregano aqueous extracts and their in vitro bioavailability. Plants 2022, 11, 3372. [Google Scholar] [CrossRef] [Scilit] [PubMed]
- Kutzli, I.; Griener, D.; Gibis, M.; Grossmann, L.; Baier, S.K.; Weiss, J. Improvement of emulsifying behavior of pea proteins as plant-based emulsifiers via Maillard-induced glycation in electrospun pea protein–maltodextrin fibers. Food Funct. 2020, 11, 4049–4056. [Google Scholar] [CrossRef] [Scilit]
- Östbring, K.; Nilsson, K.; Ahlström, C.; Fridolfsson, A.; Rayner, M. Emulsifying and anti-oxidative properties of proteins extracted from industrially cold-pressed rapeseed press-cake. Foods 2020, 9, 678. [Google Scholar] [CrossRef] [Scilit] [PubMed]
- Araujo, A.M.; Santos, L.M.; Fortuny, M.; Melo, R.L.F.V.; Coutinho, R.C.C.; Santos, A.F. Evaluation of water content and average droplet size in water-in-crude oil emulsions by means of near-infrared spectroscopy. Energy Fuels 2008, 22, 3450–3458. [Google Scholar] [CrossRef] [Scilit]
- Pedro, A.M.K.; Ferreira, M.M.C. The use of near-infrared spectroscopy and chemometrics for determining the shelf-life of products. Appl. Spectrosc. 2009, 63, 1308–1314. [Google Scholar] [CrossRef] [Scilit]
- Borges, G.R.; Farias, G.B.; Braz, T.M.; Santos, L.M.; Amaral, M.J.; Fortuny, M.; Franceschi, E.; Dariva, C.; Santos, A.F. Use of near infrared for evaluation of droplet size distribution and water content in water-in-crude oil emulsions in pressurized pipeline. Fuel 2015, 147, 43–52. [Google Scholar] [CrossRef] [Scilit]
- Dinache, A.; Tozar, T.; Smarandache, A.; Andrei, I.R.; Nistorescu, S.; Nastasa, V.; Staicu, A.; Pascu, M.L.; Romanitan, M.O. Spectroscopic characterization of emulsions generated with a new laser-assisted device. Molecules 2020, 25, 1729. [Google Scholar] [CrossRef] [Scilit]
- Grgić, F.; Jurina, T.; Valinger, D.; Gajdoš Kljusurić, J.; Jurinjak Tušek, A.; Benković, M. Near-infrared spectroscopy coupled with chemometrics and artificial neural network modeling for prediction of emulsion droplet diameters. Micromachines 2022, 13, 1876. [Google Scholar] [CrossRef] [Scilit]
- Jurinjak Tušek, A.; Jurina, T.; Čulo, I.; Valinger, D.; Gajdoš Kljusurić, J.; Benković, M. Application of NIRs coupled with PLS and ANN modelling to predict average droplet size in oil-in-water emulsions prepared with different microfluidic devices. Spectrochim. Acta Part A Mol. Biomol. Spectrosc. 2022, 270, 120860. [Google Scholar] [CrossRef] [Scilit]
- Mishra, P.; van Dijk, M.; Wintermeyer, C.; Sabater, C.; Bot, A.; Verkleij, T.; Broeze, J. At-line and inline prediction of droplet size in mayonnaise with near-infrared spectroscopy. Infrared Phys. Technol. 2022, 123, 104155. [Google Scholar] [CrossRef] [Scilit]
- Holroyd, S.E. The Use of near Infrared Spectroscopy on Milk and Milk Products. J. Near Infrared Spectrosc. 2013, 21, 311–322. [Google Scholar] [CrossRef] [Scilit]
- Grossi, M.; Di Lecce, G.; Arru, M.; Gallina Toschi, T.; Riccò, B. An opto-electronic system for in-situ determination of peroxide value and total phenol content in olive oil. J. Food Eng. 2015, 146, 1–7. [Google Scholar] [CrossRef] [Scilit]
- Zareef, M.; Chen, Q.; Hassan, M.M.; Arslan, M.; Hashim, M.M.; Ahmad, W.; Kutsanedzie, F.Y.H.; Agyekum, A.A. An Overview on the applications of typical non-linear algorithms coupled with NIR spectroscopy in food analysis. Food Eng. Rev. 2020, 12, 173–190. [Google Scholar] [CrossRef] [Scilit]
- Shalev, N.T.; Ghermani, A.; Tchernov, D.; Shemesh, E.; Israel, A.; Brook, A. NIR spectroscopy and artificial neural network for seaweed protein content assessment in-situ. Comput. Electron. Agric. 2022, 201, 107304. [Google Scholar] [CrossRef] [Scilit]
- Mireei, S.A.; Mohtasebi, S.S.; Massudi, R.; Rafiee, S.; Arabanian, A. Feasibility of near infrared spectroscopy for analysis of date fruits. Int. Agrophys. 2010, 24, 351–356. [Google Scholar]
- Costa, L.R.; Tonoli, G.H.D.; Milagres, F.R.; Hein, P.R.G. Artificial neural network and partial least square regressions for rapid estimation of cellulose pulp dryness based on near infrared spectroscopic data. Carbohydr. Polym. 2019, 224, 115186. [Google Scholar] [CrossRef] [Scilit] [PubMed]
- Jurinjak Tušek, A.; Benković, M.; Belščak Cvitanović, A.; Valinger, D.; Jurina, T.; Gajdoš Kljusurić, J. Kinetics and thermodynamics of the solid-liquid extraction process of total polyphenols, antioxidants and extraction yield from Asteraceae plants. Ind. Crops Prod. 2016, 91, 205–214. [Google Scholar] [CrossRef] [Scilit]
- Sridharan, S.; Meinders, M.B.J.; Bitter, J.H.; Nikiforidis, C.V. Pea flour as stabilizer of oil-in-water emulsions: Protein purification unnecessary. Food Hydrocoll. 2020, 101, 105533. [Google Scholar] [CrossRef] [Scilit]
- Horwitz, W. Agricultural Chemicals, Contaminants, Drugs. In Association of Analytical Chemists: Official Methods of Analysis of AOAC International; AOAC International: Gaithersburg, MD, USA, 2010; Volume I. [Google Scholar]
- Singleton, V.L.; Rossi, J.A. Colorimetry of total phenolics with phosphomolybdic-phosphotungstic acid reagents. Am. J. Enol. Vitic. 1965, 16, 144–158. [Google Scholar] [CrossRef] [Scilit]
- Brand-Williams, W.; Cuvelier, M.E.; Berset, C. Use of a free radical method to evaluate antioxidant activity. LWT–Food Sci. Technol. 1995, 28, 25–30. [Google Scholar] [CrossRef] [Scilit]
- Benzie, I.F.F.; Strain, J.J. The ferric reducing ability of plasma (FRAP) as a measure of “antioxidant power”: The FRAP assay. Anal. Biochem. 1996, 239, 70–76. [Google Scholar] [CrossRef] [Scilit] [PubMed]
- Matešić, N.; Jurina, T.; Benković, M.; Panić, M.; Valinger, D.; Gajdoš Kljusurić, J.; Jurinjak Tušek, A. Microwave-assisted extraction of phenolic compounds from Cannabis sativa L.: Optimization and kinetics study. Sep. Sci. Technol. 2021, 56, 2047–2060. [Google Scholar] [CrossRef] [Scilit]
- Kim, W.; Wang, Y.; Selomulya, C. Dairy and plant proteins as natural food emulsifiers. Trends Food Sci. Technol. 2020, 105, 261–272. [Google Scholar] [CrossRef] [Scilit]
- Kumar, M.; Tomar, M.; Punia, S.; Dhakane-Lad, J.; Dhumal, S.; Changan, S.; Senapathy, M.; Berwal, M.K.; Sampathrajan, V.; Sayed, A.A.S.; et al. Plant-based proteins and their multifaceted industrial applications. LWT 2022, 154, 112620. [Google Scholar] [CrossRef] [Scilit]
- Niroula, A.; Alshamsi, R.; Sobti, B.; Nazir, A. Optimization of pea protein isolate-stabilized oil-in-water ultra-nanoemulsions by response surface methodology and the effect of electrolytes on optimized nanoemulsions. Colloids Interfaces 2022, 6, 47. [Google Scholar] [CrossRef] [Scilit]
- Beć, K.B.; Grabska, J.; Huck, C.W. Principles and applications of miniaturized near-infrared (NIR) spectrometers. Chem. Eur. J. 2021, 27, 1514–1532. [Google Scholar] [CrossRef] [Scilit]
- Grabska, J.; Beć, K.B.; Ozaki, Y.; Huck, C.W. Anharmonic DFT study of near-infrared spectra of caffeine: Vibrational analysis of the second overtones and ternary combinations. Molecules 2021, 26, 5212. [Google Scholar] [CrossRef] [Scilit]
- Gál, L.; Oravec, M.; Gemeiner, P.; Čeppan, M. Principal component analysis for the forensic discrimination of black inkjet inks based on the Vis-NIR fibre optics reflection spectra. Forensic Sci. Int. 2015, 257, 285–292. [Google Scholar] [CrossRef] [Scilit]
- Toscano, G.; Rinnan, Å.; Pizzi, A.; Mancini, M. The use of near-infrared (NIR) spectroscopy and principal component analysis (PCA) to discriminate bark and wood of the most common species of the pellet sector. Energy Fuels 2017, 31, 2814–2821. [Google Scholar] [CrossRef] [Scilit]
- Roger, J.-M.; Mallet, A.; Marini, F. preprocessing NIR spectra for aquaphotomics. Molecules 2022, 27, 6795. [Google Scholar] [CrossRef] [Scilit]
- Bampi, M.; Scheer, A.D.P.; De Castilhos, F. Application of near infrared spectroscopy to predict the average droplet size and water content in biodiesel emulsions. Fuel 2013, 113, 546–552. [Google Scholar] [CrossRef] [Scilit]
- Bi, Y.; Yuan, K.; Xiao, W.; Wu, J.; Shi, C.; Xia, J.; Chu, G.; Zhang, G.; Zhou, G. A local pre-processing method for near-infrared spectra, combined with spectral segmentation and standard normal variate transformation. Anal. Chim. Acta 2016, 909, 30–40. [Google Scholar] [CrossRef] [Scilit] [PubMed]
- Grisanti, E.; Totska, M.; Huber, S.; Calderon, C.K.; Hohmann, M.; Lingenfelser, D.; Otto, M. Dynamic localized SNV, Peak SNV, and partial peak SNV: Novel standardization methods for preprocessing of spectroscopic data used in predictive modeling. J. Spectrosc. 2018, 2018, 5037575. [Google Scholar] [CrossRef] [Scilit]
- Heil, K.; Schmidhalter, U. An Evaluation of different NIR-spectral pre-treatments to derive the soil parameters C and N of a humus-clay-rich soil. Sensors 2021, 21, 1423. [Google Scholar] [CrossRef] [Scilit] [PubMed]
- Chen, H.; Song, Q.; Tang, G.; Feng, Q.; Lin, L. The combined optimization of Savitzky-Golay smoothing and multiplicative scatter correction for ft-nir pls models. ISRN Spectrosc. 2013, 2013, 1–9. [Google Scholar] [CrossRef] [Scilit]
- Joe, A.F.; Gopal, A. A Study on various preprocessing algorithms used for NIR spectra. Res. J. Pharm. Biol. Chem. Sci. 2016, 7, 2752–2757. [Google Scholar]
- Liu, Y.; Liu, Y.; Chen, Y.; Zhang, Y.; Shi, T.; Wang, J.; Hong, Y.; Fei, T.; Zhang, Y. The influence of spectral pretreatment on the selection of representative calibration samples for soil organic matter estimation using Vis-NIR reflectance spectroscopy. Remote Sens. 2019, 11, 450. [Google Scholar] [CrossRef] [Scilit]
- Basile, T.; Marsico, A.D.; Perniola, R. Use of artificial neural networks and NIR spectroscopy for non-destructive grape texture prediction. Foods 2022, 11, 281. [Google Scholar] [CrossRef] [Scilit]
- Gojun, M.; Valinger, D.; Šalić, A.; Zelić, B. Development of NIR-Based ANN models for on-line monitoring of glycerol concentration during biodiesel production in a microreactor. Micromachines 2022, 13, 1590. [Google Scholar] [CrossRef] [Scilit]
- Marsalek, R. Particle size and zeta potential of ZnO. APCBEE Procedia 2014, 9, 13–17. [Google Scholar] [CrossRef] [Scilit]
- Marić, L.; Malešić, E.; Jurinjak Tušek, A.; Benković, M.; Valinger, D.; Jurina, T.; Gajdoš Kljusurić, J. Effects of drying on physical and chemical properties of root vegetables: Artificial neural network modelling. Food Bioprod. Process. 2020, 119, 148–160. [Google Scholar] [CrossRef] [Scilit]
- Jurinjak Tušek, A.; Benković, M.; Malešić, E.; Marić, L.; Jurina, T.; Gajdoš Kljusurić, J.; Valinger, D. Rapid quantification of dissolved solids and bioactives in dried root vegetable extracts using near infrared spectroscopy. Spectrochim. Acta Part A Mol. Biomol. Spectrosc. 2021, 261, 120074. [Google Scholar] [CrossRef] [Scilit] [PubMed]
- Schoot, M.; Kapper, C.; van Kollenburg, G.H.; Postma, G.J.; van Kessel, G.; Buydens, L.M.C.; Jansen, J.J. Investigating the need for preprocessing of near-infrared spectroscopic data as a function of sample size. Chemom. Intell. Lab. Syst. 2020, 204, 104105. [Google Scholar] [CrossRef] [Scilit]

Disclaimer/Publisher’s Note: The statements, opinions and data contained in all publications are solely those of the individual author(s) and contributor(s) and not of MDPI and/or the editor(s). MDPI and/or the editor(s) disclaim responsibility for any injury to people or property resulting from any ideas, methods, instructions or products referred to in the content. |
© 2023 by the authors. Licensee MDPI, Basel, Switzerland. This article is an open access article distributed under the terms and conditions of the Creative Commons Attribution (CC BY) license (https://creativecommons.org/licenses/by/4.0/).