Abstract
Gold nanoclusters (Au NCs) belong to a class of materials that is highly fluorescent and biocompatible. Bovine serum albumin (BSA) protected gold nanoclusters (BSA-Au NCs) have been extensively used in biological applications due to their easy synthesis and relatively high quantum yield. Therefore, understanding the behavior of BSA-Au NCs in different chemical and physical environments is essential to enhance their application in biological systems. In this study, we investigated the effect of plasmonic nanostructures with different localized surface plasmon resonance (LSPR) wavelengths on the behavior of BSA-Au NCs by recording time-dependent fluorescence spectra in the presence of silver nanoparticles (AgNPs) with various shapes. However, we did not observe any conclusive LSPR-wavelength-dependent fluorescent behavior. Additionally, the fluorescence intensity of BSA-Au NCs exhibited gradual decay under light excitation, even at several hundred μW/cm2 in a fluorescence spectrometer, indicating that they are not as photostable as previously assumed. We found further that the photostability of BSA-Au NCs is affected by the wavelength of the incident light (370, 420, 480, and 550 nm), which can be accurately described using bi-exponential decay functions. Our study provides an easy in situ method to evaluate the photostability of Au NCs under different-wavelength light irradiation using a commercial fluorescence spectrometer.
1. Introduction
Gold nanoclusters (Au NCs) have been studied increasingly in recent years due to their unique fluorescence properties and biocompatibility arising from their molecular-like characteristics. Typically consisting of several or tens of gold atoms, these clusters exhibit strong fluorescence when their size is similar to or smaller than the Fermi wavelength of their conductive electrons [1]. As a result, Au NCs have potential applications in various fields, such as biomedical imaging [2], catalysts [3], chemical and biological sensing [4], and photovoltaics [5]. However, their small size and large surface-to-volume ratio require suitable protective ligands such as thiolate (SR), phosphine [6], halides [7], or proteins [8] to prevent further formation of nanoparticles and ensure stability. Furthermore, the fluorescence intensity of the Au NCs is strongly dependent on different physical and chemical environments. For instance, the fluorescence properties of Au NCs can be affected by various environmental factors such as temperature [9], pH [10], solvent polarity [11], and the presence of metal ions [12,13,14,15]. In addition, several reports have described the possibility of energy transfer or its efficiency, which depends on the distance between Au NCs and nanostructures using ultrafast laser systems [16]. Therefore, it is conceivable that the association of Au NCs with colloidal AgNPs could alter the environment of the fluorophore of Au NCs, such as the accessibility of water and the conformation of protecting groups. However, few reports have addressed the evolution of fluorescence when Au NCs encounter colloidal nanoparticles [17].
Silver nanoparticles (AgNPs) with various shapes exhibit diverse physicochemical properties, such as catalytic ability [18], color [19,20], surface-enhanced phenomena [21,22], and antibacterial capability [23]. Furthermore, the toxicity of AgNPs has been reported to be related to their shapes, possibly because certain crystal planes have better binding ability to the cell walls of bacteria [23]. Hence, a comprehensive understanding of particle-specific effects in the antibacterial activity of AgNPs could be obtained by estimating the interaction between AgNPs of various shapes and biological molecules.
AgNPs have various effects on organisms, resulting from their interactions with biological molecules on the cell surface. Among these interactions, an association of AgNPs with proteins is arguably the most crucial. For example, human blood contains numerous proteins, such as serum albumin and antibodies. Upon entering the body, AgNPs can readily interact with proteins present in bodily fluids, thereby forming a protein corona on the surface of the AgNPs. Since it is inevitable that proteins will adsorb to AgNPs when applied to a biological system, it is necessary to utilize various tools to understand comprehensively the thermodynamic and kinetic aspects of protein–AgNP interaction. Intuitively, suppose we can synthesize protein-protected small metal clusters containing florophore and exhibiting fluorescence, such as BSA-Au NCs. In that case, it is conceivable that these clusters can exhibit different fluorescence behaviors when adsorbed onto AgNPs. Simple fluorescence spectroscopy could provide valuable information to explore the interaction between proteins and AgNPs.
Plasmon-mediated processes and photochemical methods have been employed to synthesize AgNPs with different shapes without surfactants and protective polymers with large molecular weights [24,25]. The resulting AgNPs, surrounded only by citrate ions or 1,3-acetonedicarboxylate, are accessible to other molecules for attachment [24,26]. Furthermore, the LSPR band of colloidal AgNPs undergoes a significant redshift upon the adsorption of proteins onto their surface [27]. These advantages make them ideal candidates for studying the interaction between proteins and nanostructures.
In this study, we synthesized BSA-protected Au NCs using the method described by Ying et al. [8]. These Au NCs are water-soluble and exhibit intense, red-colored fluorescence under UV light. In addition, we employed a combination of photochemical and plasmon-mediated processes to synthesize AgNPs with various shapes, including quasi-spherical, decahedral, and triangular plates [20,24,27]. A commercial spectrometer was used to record the time-resolved fluorescence spectra of the Au NCs. Upon addition of the Au NCs to the AgNP colloids, we found that the fluorescence intensity of the Au NCs decreased gradually in the first few minutes, reaching a baseline after 15–20 min. Furthermore, we fitted the decay rates with bi-exponential functions and found that they were not strongly dependent on the shape of the silver nanoparticles. This result suggests that the interaction between the BSA-Au NCs and silver nanoparticles with different shapes, including adsorption or plasmon-enhanced energy transfer (PEET), may not be a crucial factor in the emission decay.
Additionally, we observed a decrease in the fluorescence intensity of Au NCs under light irradiation in the absence of silver nanoparticles, indicating that the Au NCs are photo-unstable. The baselines observed in the fluorescence decay rates suggest that there are at least three types of BSA-Au NCs: two are photo-unstable, and another is photostable. In addition, the ratios of photostable types depend on the wavelengths of irradiation light.
2. Experimental
2.1. Materials
Silver nitrate (AgNO3) and trisodium citrate (Na3C6H5O7) were purchased from JT Baker. Chloroauric acid (HAuCl4) was purchased from Alfa Aesar. Sodium borohydride (NaBH4) and bovine serum albumin were purchased from Sigma-Aldrich. Sodium hydroxide was purchased from Mallinckrodt. All these reagents were not further purified before being used. Milli-Q grade water (>18 MΩ) was used in all experiments. Highly purified water is critical in synthesizing nanomaterials, where impurities can significantly affect the properties and performance of the resulting nanoparticles.
2.2. Instrumentation
TEM images of the samples were acquired using a Joel JEM-2100 transmission electron microscope (TEM), which was operated at both 100 kV and 200 kV. Before analysis, the BSA-Au NCs and AgNP colloids were dripped onto a carbon-coated copper grid and air-dried at room temperature. The UV-vis extinction spectra of the samples were obtained using a Hitachi U-5100 spectrophotometer at 25 °C. The fluorescence spectra were recorded using a HORIBA Jobin Yvon FluoroLog fluorescence spectrophotometer. The instrument was operated at the excitation and emission wavelengths specific to the samples being analyzed, with the fluorescence intensity and spectrum being recorded for further analysis.
2.3. BSA-Au NCs Preparation
BSA-Au NCs were prepared according to the reference [8]. Briefly, mix 0.5 mL of HAuCl4 solution (10−2 M) with 0.5 mL of BSA solution (0.05 g/mL) by shaking, and let it stand for 2 min. Then add 0.5 mL of NaOH solution (0.1 M) and place the prepared solution in a dry bath at 37 °C for 12 h.
2.4. Preparation of AgNP Colloids
2.4.1. Preparation of QS-AgNP Colloids
Take 48 mL of deionized water in a beaker and stir with a magnetic stirrer. Add 0.5 mL of trisodium citrate solution (3 × 10⁻² M). Then add 1 mL of silver nitrate solution (10−2 M) to the beaker. After that, take a solution of sodium borohydride (0.5 mL, 5 × 10⁻³ M) and add it dropwise with a rate of 5 s/drop while stirring for 5 min. The solution immediately turned yellow, indicating the formation of spherical silver nanoparticle (AgNP) colloids. We call this a seed solution. The seed solution was then transferred from the beaker to a 50 mL glass tube and subjected to photoirradiation using violet LEDs (405 ± 10 nm, 35 mW/cm2) for 90 min. The experimental setup for this photochemical reaction was similar to the one utilized in our previous investigations [24,27], illustrated in Figure 1A. This process utilizes violet LEDs capable of exciting the silver ion–citrate complex in the solution, forming tiny seeds. These seeds can grow into larger AgNPs through a plasmon-mediated process [24,27].
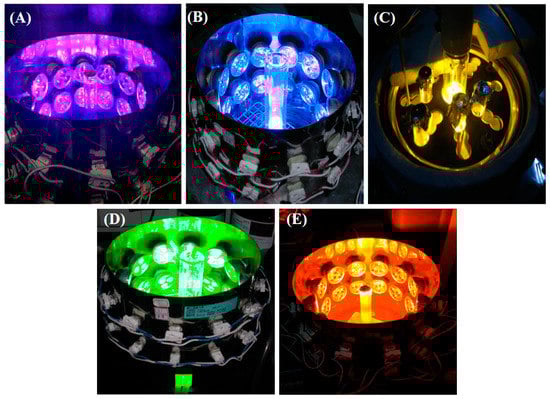
Figure 1.
The setup for the plasmon-mediated process and photochemical reaction. (A) Violet LEDs; (B) blue LEDs; (C) the sodium lamp; (D) green LEDs; (E) red LEDs.
2.4.2. Preparation of D-AgNP Colloids Using the Photochemical Method
Add 0.066 g of trisodium citrate powder to a beaker containing 49.5 mL of Milli-Q grade water and stir with a magnetic stir bar. Then, add 0.5 mL of silver nitrate solution (10−2 M) to the beaker and stir for 5 min. After that, transfer the solution from the beaker into a glass tube and irradiate it with violet LEDs (405 ± 10 nm, 35 mW/cm2, as shown in Figure 1A) for 70 s. The solution turned yellow within 45 s, indicating the formation of spherical AgNPs. Then the photochemical seed AgNP colloids were irradiated with blue LEDs (460 ± 12 nm, 40 mW/cm2, as shown in Figure 1B) for 90 min. The end products exhibited a fascinating bicolor characteristic, reflecting shades of orange and green when viewed from various angles [28], as illustrated in Figure 2. This intriguing optical property is attributed to the intense light scattering by the product’s unique structure [29,30].
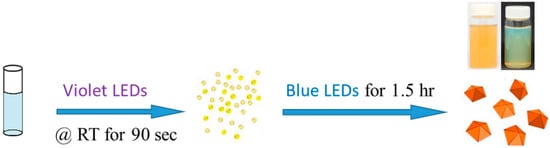
Figure 2.
The schematic evolution of AgNP colloids under light irradiation via the photochemical and plasmon-mediated processes.
2.4.3. Preparation of T-AgNPt Colloids Using the Plasmon-Mediated Method
The seed solution was transferred to a 50 mL glass tube for irradiation with sodium lamps (590 nm, ~60 mW/cm2, Figure 1C) for 90 min to form the desired products. Sodium lamps are commonly used for nanoparticle synthesis due to their efficiency and affordability [31,32]. The 590 nm wavelength is suitable for preparing T-AgNPt via the plasmon-mediated process. For a typical synthesis of AgNPts, controlling the bath temperature is not necessary. The AgNPt colloidal solution is blue [20].
2.4.4. Preparation of HQ-AgNPt Colloids Using Photochemical Methods
The AgNP colloids, prepared according to the process outlined in Section 2.4.2, undergo a photochemical transformation in shape to form AgNPts. This transformation is achieved by exposing the seed solution to green LEDs with a 518 ± 16 nm wavelength and an average power of approximately 48 mW/cm2 for 30 min. The selection of green LEDs is based on their ability to meet the resonance condition required to prepare AgNPts via a plasmon-mediated process. However, the LSPR bandwidth of this stage of AgNPt colloids is quite broad. Consequently, the process is followed by exposing the solution to red LEDs for 90 min. The red LEDs have a 630 ± 18 nm wavelength and an average power of approximately 60 mW/cm2. Therefore, they are chosen for the size-focusing process [27]. In this process, smaller AgNPts, exhibiting a dipolar LSPR band peaking at around 630 nm, can interact with the red light and grow into larger AgNPts via a plasmon-mediated process.
On the other hand, larger AgNPts with longer LSPR wavelengths, which do not meet the resonance condition with the excitation light, undergo a light-induced oxidation process, releasing silver ions into the colloidal solution. As a result, the size distribution of AgNPts improves due to the growth of smaller AgNPts and the shrinkage of larger AgNPts under the red LED irradiation for this size-focusing process. The photochemical reaction systems are illustrated in Figure 1D,E.
3. Results and Discussion
3.1. Characterization of Shapely Silver Nanoparticles
Figure 3A–D depicts the UV-vis spectra and TEM images of colloidal silver nanoparticles with different shapes. Quasi-spherical silver nanoparticles (QS-AgNPs), shown in Figure 3A, exhibit an asymmetric LSPR band that peaked at around 400 nm with an FWHM of about 80 nm. The size distribution ranges from 5–20 nm. Figure 3B shows decahedral silver nanoparticles (D-AgNPs), which exhibit a highly symmetrical and sharp LSPR band centered around 475 nm, corresponding to the long-axis (in-plane) dipolar LSPR mode. Additionally, a minor band centered around 400 nm corresponds to the short-axis (out-of-plane) dipolar LSPR mode. The as-prepared D-AgNPs have a narrow size distribution with an edge length of 40 ± 5 nm. Triangular silver nanoplates (T-AgNPts) shown in Figure 3C were synthesized using a plasmon-mediated process under sodium lamp irradiation. The UV-vis spectra of T-AgNPts show bands peaking at 690 nm and 332 nm correlating to the in-plane dipolar LSPR mode and out-of-plane quadrupole mode, respectively. The primary band at 690 nm is not symmetrical, and the TEM image shows a broad size distribution. Figure 3D shows silver nanoplates synthesized through a three-stage photochemical reaction, which exhibit two LSPR bands peaked at 675 nm and 333 nm. These bands correspond to the in-plane dipolar LSPR and out-of-plane quadrupole modes. The in-plane dipolar LSPR band is sharp, symmetrical, and can be fitted with a Lorentzian function with an FWHM of 72 nm. The size distribution of these silver nanoplates is 60 ± 15 nm. Due to their high quality, we refer to the silver nanoplates synthesized through the three-stage photochemical reaction as HQ-AgNPts.
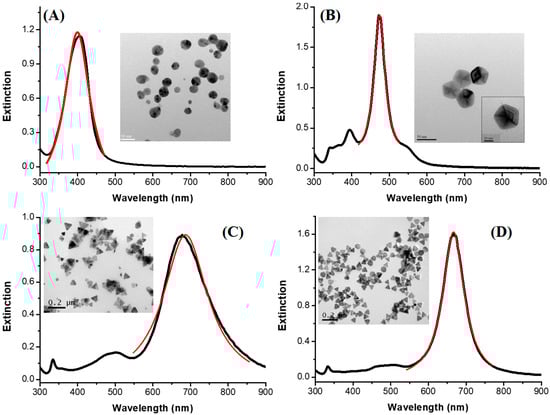
Figure 3.
UV-vis spectra and TEM images of colloidal silver nanoparticles with different shapes. (A) Quasi-spherical silver nanoparticles (QS-AgNPs), (B) decahedral silver nanoparticles (D-AgNPs), (C) triangular silver nanoplates (T-AgNPts) and (D) high-quality silver nanoplates (HQ-AgNPts).
3.2. Characterization of Gold Nanoclusters
Figure 4A,B depicts the TEM images, fluorescence spectra, and the digital image of BSA-protected gold nanoclusters (BSA-Au NCs). The TEM image shown in Figure 4A indicates that the BSA-Au NCs exhibit a narrow size distribution, with sizes ranging from 0.5–2.5 nm. This confirms the success of the synthesis method used in this study. Figure 4B illustrates the fluorescence spectra of BSA-Au NC colloids excited at 370 nm and 480 nm. The fluorescence spectrum excited at 480 nm shows only one peak, while the spectrum excited at 370 nm displays two peaks. The peak observed at 640 nm in both spectra corresponds to the fluorescence bands of Au25 NCs [8]. However, the peak at 440 nm, observed only in the spectrum excited at 370 nm and having an intensity of only one-third of the peak at 640 nm, is likely due to fluorescence from BSA aggregation, as shown in Figure S1. Further investigation would be required to confirm this hypothesis.
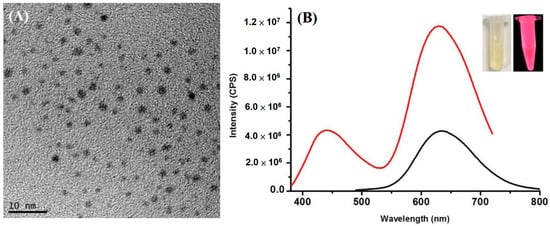
Figure 4.
(A) TEM images and (B) fluorescence spectra excited with 370 nm (red) and 480 nm (black) light, and the digital image of BSA-protected gold nanoclusters (BSA-Au NCs).
3.3. Time Evolution of Fluorescence of BSA-Au NCs in Different AgNP Colloids
Figure 5A–D presents the fluorescence spectra of BSA-Au NCs in the presence of different AgNP colloids at various interaction times under 370 nm light excitation. The interaction times represent the duration after adding BSA-Au NCs into AgNP colloids. The spectra were recorded sequentially, with each recording lasting 60 s. The peaks at 440 nm remain nearly constant for 30 min, while the peak at 640 nm gradually decreases. This result suggests that the fluorescence of BSA aggregation is unaffected by the presence of AgNPs, while the fluorescence of BSA-Au NCs decreases over time.
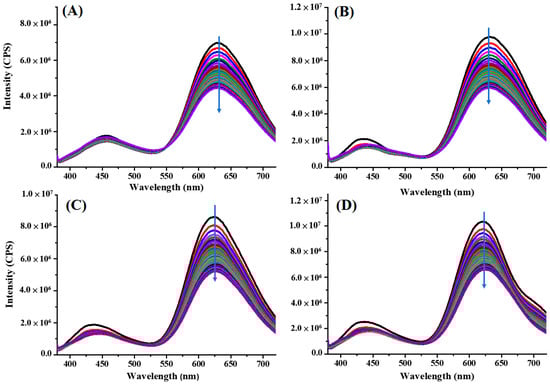
Figure 5.
Fluorescence spectra of BSA-Au NCs in the presence of (A) QS-AgNP colloids, (B) D-AgNP colloids, (C) T-AgNPt colloids, and (D) HQ-AgNPt colloids at various interaction times under 370 nm light excitation.
For further understanding of the kinetics of the fluorescence evolution, we plot the fluorescence intensity integration (integrating the area in the spectra between 550–720 nm) varied with interaction times (as shown in Figure 6A–D).
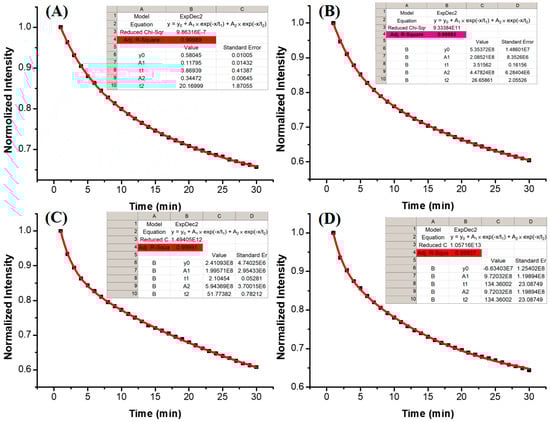
Figure 6.
Fluorescence intensity integration (integrating the area in the spectra between 550–720 nm) varied with interaction times. (A) QS-AgNP colloids, (B) D-AgNP colloids, (C) T-AgNPt colloids, and (D) HQ-AgNPt colloids at various interaction times under 370 nm light excitation.
The results show that fluorescent intensities decreased by more than 35% after AgNPs were placed into BSA-Au NC solutions. Two factors could contribute to the fluorescence decrease of Au NCs after the clusters associate with AgNPs. One is the environmental change of the Au NC fluorophores in the presence and absence of AgNPs [33]. The other could be attributed to metal exchange [34,35,36].
Consequently, the gradual decline may indicate the rates of BSA-Au NCs adsorption onto AgNPs. In order to investigate the adsorption kinetics of BSA-Au NCs in the presence of AgNPs, the fluorescence decay curves of the samples were analyzed. Bi-exponential functions were used to fit the curves of the decay data, as shown in Figure 6A–D. The fitting parameters are listed in Table 1. The red lines in Figure 6A–D correspond to the bi-exponential decay function fits, with all R2 values above 0.999. The data showed that two fluorescence decay stages, slow and fast, were observed. The slow stage was the major contributor to the fluorescence decrease of BSA-Au NCs upon associating with the QS-AgNP, T-AgNPt, and HQ-AgNPt colloids. The decay times of the slow component varied between 20.2 min for QS-AgNP and 35.3 min for T-AgNPt, demonstrating that the anisotropy of the nanoparticle shape is positively correlated with an increase in the decay time of the slow component. This suggests that the shapes of the nanoparticles may play a role in the adsorption kinetics of the BSA-Au NCs on the nanoparticle surface. However, the observed tendency was not statistically significant, suggesting that other factors may also be involved in the fluorescence decay process. For example, different concentrations of free silver ions (Ag+) may play a role in the fluorescence decay of BSA-Au NCs [37]. It must be emphasized that the sizes of silver nanoparticles used in the study were different. Therefore, it is unclear whether or not the particle sizes of AgNPs influence the fluorescence decay of Au NCs. The critical issue remains to be further studied.

Table 1.
Fitting parameters of the fluorescence decay of BSA-Au NCs in the presence of different AgNPs.
3.4. Time Evolution of Fluorescence of BSA-Au NCs in the Presence of Silver Ions
In previous studies, the effect of silver ions on the fluorescence behavior of Au NCs was reported. For instance, Jin’s group demonstrated that glutathione-protected gold nanoclusters (Au25SG18) showed increased fluorescence intensity in the presence of silver ions [38]. They proposed a principle based on the change in the oxidation state of Au NCs and silver ions to explain this phenomenon of fluorescent enhancement. On the other hand, Chang’s group reported that Ag+ ions can suppress the fluorescence of Au NCs on aluminum oxide (Al2O3) nanoparticles through the d10–d10 electron interaction between Ag and Au [39]. Similarly, Wang et al. showed that the fluorescence of cytidine-stabilized Au NCs could be turned on in the presence of silver ions by forming AuAg NCs [40]. Since free silver ions can play diverse roles in affecting the fluorescence response of Au NCs and cannot be entirely excluded in the AgNP colloids [41], it is essential to estimate their influence. In this regard, Figure 7A,B illustrates the fluorescence evolution of BSA-Au NCs in the presence of 10−4 M and 2.5 × 10⁻⁶ M silver ions. The results indicate that as the concentration of silver ions increases, the fluorescence decays more rapidly. However, it is noteworthy that even at a low concentration of silver ions, the fluorescence of BSA-Au NCs still decreases over time. This observation may be attributed to the inherent photo-instability of BSA-Au NCs when exposed to continuous excitation of UV light (370 nm) emitted from the fluorescent spectrometer lamp.
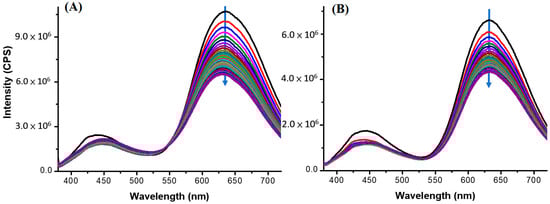
Figure 7.
Fluorescence evolution of BSA-Au NCs in the presence of 10−4 M (A) and 2.5 × 10⁻⁶ M (B) silver ions.
3.5. Time Evolution of Fluorescence of BSA-Au NCs under the Irradiation of Light with Different Wavelengths
Several studies have demonstrated that Au NCs possess excellent photostability [42,43], indicating that their optical characteristics do not degrade or alter significantly over time under light exposure. However, as discussed in the previous sections, the results suggest that BSA-Au NCs may have inherent photo-instability. Figure 8A–D illustrates the time-dependent fluorescence behavior of BSA-Au NCs under irradiation with different wavelengths (550 nm, 480 nm, 420 nm, and 370 nm) in the absence of silver ions and silver nanoparticles (AgNPs). The results show that the fluorescence intensity of BSA-Au NCs decreases faster upon exposure to excitation light with shorter wavelengths.
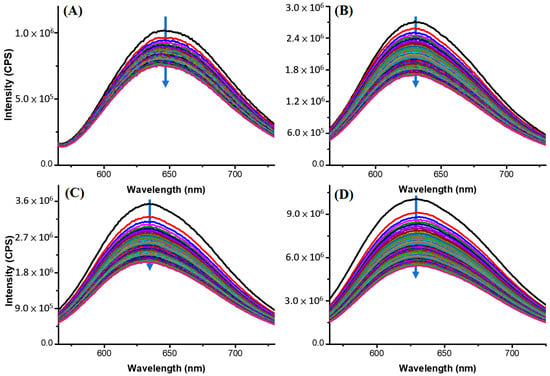
Figure 8.
Time-dependent fluorescence behavior of BSA-Au NCs under irradiation with different wavelengths (A) 550 nm, (B) 480 nm, (C) 420 nm, and (D) 370 nm in the absence of silver ions and silver nanoparticles (AgNPs).
Figure 9A–D displays the changes in fluorescence intensity integration of BSA-Au NCs (the area under the spectra between 550–720 nm) as a function of interaction time. The red lines in the figures correspond to the bi-exponential decay function that fits with all R2 values above 0.996. The fitted parameters are listed in Table 2.
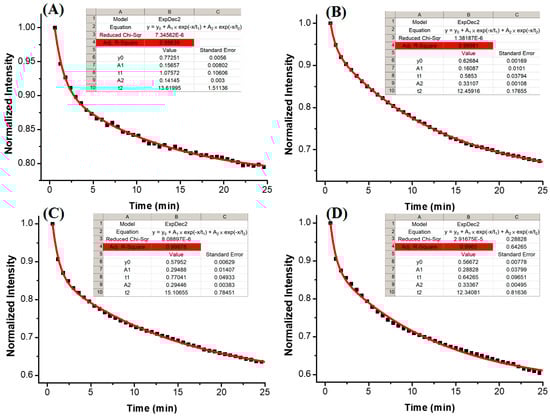
Figure 9.
Normalized fluorescence intensity integration of BSA-Au NCs (the area under the spectra between 550–720 nm) as a function of interaction time under the irradiation of different wavelengths. (A) 550 nm, (B) 480 nm, (C) 420 nm, and (D) 370 nm.
Table 2.
Fitting parameters of the fluorescence decay of BSA-Au NCs under irradiation light with different wavelengths.
Table 2 presents the obtained parameters, which include two decay lifetimes (τ1 and τ2) and one baseline value (y0). These parameters suggest the existence of three distinct types of BSA-Au NCs. The ratio of the photostable BSA-Au NCs can be correlated to the value of y0/(A1 + A2 + y0). The BSA-Au NCs corresponding to the baseline value exhibit a much longer lifetime than the other two types. As shown in Table 2, the value of y0/(A1 + A2 + y0) decreases when the wavelength of the excitation light is shorter.
The fluorescence intensity decreases accompanied by a slightly blue shift (3–5 nm) in the fluorescence peak. It is speculated that after absorbing light, BSA-Au NCs undergo their photochemical reactions, producing reactive oxygen species (ROS), which include oxygen O2−, ·OH, H2O2, and 1O2 [44,45]. We proposed that the photoactivation of ROS can cause protein oxidation and disrupt the stable clusters’ framework (Au–S bond), forming disulfides and releasing the gold atoms from the protein structure, resulting in a blue shift of the fluorescence peak.
4. Conclusions
In this study, we explored the fluorescence characteristics in the presence of differently shaped AgNPs, as well as the photostability of BSA-protected gold nanoclusters (BSA-Au NCs). To achieve this, we monitored the time-dependent fluorescence spectra of the samples under in situ UV-vis light irradiation with different wavelengths (370 nm, 420 nm, 480 nm, and 550 nm). Surprisingly, we observed a decay in the fluorescence intensity of BSA-Au NCs even under light excitation with a power of hundreds of μW/cm2 in a fluorescence spectrometer, indicating that their photostability is not as expected. Furthermore, the intensity and wavelength of the incident light were found to influence the photostability of BSA-Au NCs. Biexponential decay functions can be used to characterize this behavior. Therefore, with the use of a commercial fluorescence spectrometer, our study provides a straightforward in situ method for evaluating the photostability of Au NCs under different-wavelength light irradiation.
Supplementary Materials
The following supporting information can be downloaded at: https://www.mdpi.com/article/10.3390/chemosensors11050279/s1, Figure S1: The fluorescence spectrum of NaOH-treated-BSA excited at 370 nm light.
Author Contributions
Conceptualization and methodology, C.-L.H.; synthesis of AgNPs, W.-C.H. and C.-Y.H.; synthesis of gold nanoclusters, W.-C.H.; fluorescence analysis, W.-C.H.; TEM images, B.-H.H.; writing—review and editing, C.-L.H. and J.-C.C.; project administration, C.-L.H. All authors have read and agreed to the published version of the manuscript.
Funding
This work was supported by the Ministry of Science and Technology (Taiwan) (MOST 111-2113-M-415-005-).
Institutional Review Board Statement
Not applicable.
Informed Consent Statement
Not applicable.
Data Availability Statement
The data presented in this study are available on request from the corresponding author.
Acknowledgments
This work was supported by the Ministry of Science and Technology (Taiwan) and the Department of Applied Chemistry, National Chiayi University, Taiwan.
Conflicts of Interest
The authors declare that they have no conflict of interest.
References
- Kreibig, U.; Vollmer, M. Optical Properties of Metal Clusters; Springer Science & Business Media: Berlin/Heidelberg, Germany, 2013. [Google Scholar]
- Yang, X.; Yang, M.; Pang, B.; Vara, M.; Xia, Y. Gold nanomaterials at work in biomedicine. Chem. Rev. 2015, 115, 10410–10488. [Google Scholar] [CrossRef] [PubMed]
- Li, G.; Jin, R. Atomically precise gold nanoclusters as new model catalysts. Acc. Chem. Res. 2013, 46, 1749–1758. [Google Scholar] [CrossRef] [PubMed]
- Chen, L.-Y.; Wang, C.-W.; Yuan, Z.; Chang, H.-T. Fluorescent gold nanoclusters: Recent advances in sensing and imaging. Anal. Chem. 2015, 87, 216–229. [Google Scholar] [CrossRef]
- Choi, H.; Chen, Y.S.; Stamplecoskie, K.G.; Kamat, P.V. Boosting the Photovoltage of Dye-Sensitized Solar Cells with Thiolated Gold Nanoclusters. J. Phys. Chem. Lett. 2015, 6, 217–223. [Google Scholar] [CrossRef] [PubMed]
- Zhang, Q.F.; Williard, P.G.; Wang, L.S. Polymorphism of Phosphine-Protected Gold Nanoclusters: Synthesis and Characterization of a New 22-Gold-Atom Cluster. Small 2016, 12, 2518–2525. [Google Scholar] [CrossRef] [PubMed]
- Walter, M.; Akola, J.; Lopez-Acevedo, O.; Jadzinsky, P.D.; Calero, G.; Ackerson, C.J.; Whetten, R.L.; Grönbeck, H.; Häkkinen, H. A unified view of ligand-protected gold clusters as superatom complexes. Proc. Natl. Acad. Sci. USA 2008, 105, 9157–9162. [Google Scholar] [CrossRef]
- Xie, J.; Zheng, Y.; Ying, J.Y. Protein-directed synthesis of highly fluorescent gold nanoclusters. J. Am. Chem. Soc. 2009, 131, 888–889. [Google Scholar] [CrossRef]
- Shang, L.; Stockmar, F.; Azadfar, N.; Nienhaus, G.U. Intracellular thermometry by using fluorescent gold nanoclusters. Angew. Chem. Int. Ed. 2013, 52, 11154–11157. [Google Scholar] [CrossRef]
- Gao, P.; Li, M.; Zhang, Y.; Dong, C.; Zhang, G.; Shi, L.; Li, G.; Yuan, M.; Shuang, S. Facile, rapid one-pot synthesis of multifunctional gold nanoclusters for cell imaging, hydrogen sulfide detection and pH sensing. Talanta 2019, 197, 1–11. [Google Scholar] [CrossRef]
- Gan, Z.; Chen, J.; Wang, J.; Wang, C.; Li, M.-B.; Yao, C.; Zhuang, S.; Xu, A.; Li, L.; Wu, Z. The fourth crystallographic closest packing unveiled in the gold nanocluster crystal. Nat. Commun. 2017, 8, 14739. [Google Scholar] [CrossRef]
- Yue, Y.; Liu, T.-Y.; Li, H.-W.; Liu, Z.; Wu, Y. Microwave-assisted synthesis of BSA-protected small gold nanoclusters and their fluorescence-enhanced sensing of silver (I) ions. Nanoscale 2012, 4, 2251–2254. [Google Scholar] [CrossRef] [PubMed]
- Hu, D.; Sheng, Z.; Gong, P.; Zhang, P.; Cai, L. Highly selective fluorescent sensors for Hg2+ based on bovine serum albumin-capped gold nanoclusters. Analyst 2010, 135, 1411–1416. [Google Scholar] [CrossRef] [PubMed]
- Ho, J.-A.A.; Chang, H.-C.; Su, W.-T. DOPA-mediated reduction allows the facile synthesis of fluorescent gold nanoclusters for use as sensing probes for ferric ions. Anal. Chem. 2012, 84, 3246–3253. [Google Scholar]
- Nath, P.; Chatterjee, M.; Chanda, N. Dithiothreitol-facilitated synthesis of bovine serum albumin–gold nanoclusters for Pb (II) ion detection on paper substrates and in live cells. ACS Appl. Nano Mater. 2018, 1, 5108–5118. [Google Scholar] [CrossRef]
- Chen, C.-W.; Wang, C.-H.; Wei, C.-M.; Hsieh, C.-Y.; Chen, Y.-T.; Chen, Y.-F.; Lai, C.-W.; Liu, C.-L.; Hsieh, C.-C.; Chou, P.-T. Highly sensitive emission sensor based on surface plasmon enhanced energy transfer between gold nanoclusters and silver nanoparticles. J. Phys. Chem. C 2010, 114, 799–802. [Google Scholar] [CrossRef]
- Casteleiro, B.; Martinho, J.M.G.; Farinha, J.P.S. Interaction between gold nanoclusters and gold nanoparticles encapsulated in polymer nanoparticles. Colloids Interface Sci. Commun. 2023, 52, 100694. [Google Scholar] [CrossRef]
- Shi, Y.; Lyu, Z.; Zhao, M.; Chen, R.; Nguyen, Q.N.; Xia, Y. Noble-metal nanocrystals with controlled shapes for catalytic and electrocatalytic applications. Chem. Rev. 2020, 121, 649–735. [Google Scholar] [CrossRef]
- Kelly, K.L.; Coronado, E.; Zhao, L.L.; Schatz, G.C. The Optical Properties of Metal Nanoparticles: The Influence of Size, Shape, and Dielectric Environment. J. Phys. Chem. B 2003, 107, 668–677. [Google Scholar] [CrossRef]
- Lee, B.H.; Hsu, M.S.; Hsu, Y.C.; Lo, C.W.; Huang, C.L. A facile method to obtain highly stable silver nanoplate colloids with desired surface plasmon resonance wavelengths. J. Phys. Chem. C 2010, 114, 6222–6227. [Google Scholar] [CrossRef]
- Mulvihill, M.J.; Ling, X.Y.; Henzie, J.; Yang, P. Anisotropic etching of silver nanoparticles for plasmonic structures capable of single-particle SERS. J. Am. Chem. Soc. 2010, 132, 268–274. [Google Scholar] [CrossRef]
- Langer, J.; de Aberasturi, D.J.; Aizpurua, J.; Alvarez-Puebla, R.A.; Auguié, B.; Baumberg, J.J.; Bazan, G.C.; Bell, S.E.; Boisen, A.; Brolo, A.G. Present and future of surface-enhanced Raman scattering. ACS Nano 2019, 14, 28–117. [Google Scholar] [CrossRef] [PubMed]
- Pal, S.; Tak, Y.K.; Song, J.M. Does the antibacterial activity of silver nanoparticles depend on the shape of the nanoparticle? A study of the gram-negative bacterium Escherichia coli. Appl. Environ. Microbiol. 2007, 73, 1712–1720. [Google Scholar] [CrossRef] [PubMed]
- Yang, L.-C.; Lai, Y.-S.; Tsai, C.-M.; Kong, Y.-T.; Lee, C.-I.; Huang, C.-L. One-pot synthesis of monodispersed silver nanodecahedra with optimal SERS activities using seedless photo-assisted citrate reduction method. J. Phys. Chem. C 2012, 116, 24292–24300. [Google Scholar] [CrossRef]
- Langille, M.R.; Personick, M.L.; Mirkin, C.A. Plasmon-Mediated Syntheses of Metallic Nanostructures. Angew. Chem. Int. Ed. 2013, 52, 13910–13940. [Google Scholar] [CrossRef]
- Xie, Z.X.; Tzeng, W.C.; Huang, C.L. One-Pot Synthesis of Icosahedral Silver Nanoparticles by Using a Photoassisted Tartrate Reduction Method under UV Light with a Wavelength of 310 nm. ChemPhysChem 2016, 17, 2551–2557. [Google Scholar] [CrossRef]
- Huang, C.-C.; Chen, H.-J.; Leong, Q.L.; Lai, W.K.; Hsu, C.-Y.; Chen, J.-C.; Huang, C.-L. Synthesis of silver nanoplates with a narrow LSPR band for chemical sensing through a plasmon-mediated process using photochemical seeds. Materialia 2022, 21, 101279. [Google Scholar] [CrossRef]
- Chen, J.-C.; Chu, Y.-T.; Chang, S.-H.; Chuang, Y.-T.; Huang, C.-L. Physical Properties and the Reconstruction of Unstable Decahedral Silver Nanoparticles Synthesized Using Plasmon-Mediated Photochemical Process. Nanomaterials 2022, 12, 1062. [Google Scholar] [CrossRef]
- Pietrobon, B.; Kitaev, V. Photochemical synthesis of monodisperse size-controlled silver decahedral nanoparticles and their remarkable optical properties. Chem. Mater. 2008, 20, 5186–5190. [Google Scholar] [CrossRef]
- Lee, S.-W.; Chang, S.-H.; Lai, Y.-S.; Lin, C.-C.; Tsai, C.-M.; Lee, Y.-C.; Chen, J.-C.; Huang, C.-L. Effect of Temperature on the Growth of Silver Nanoparticles Using Plasmon-Mediated Method under the Irradiation of Green LEDs. Materials 2014, 7, 7781–7798. [Google Scholar] [CrossRef]
- Jia, H.; Xu, W.; An, J.; Li, D.; Zhao, B. A simple method to synthesize triangular silver nanoparticles by light irradiation. Spectrochim. Acta A Mol. Biomol. 2006, 64, 956–960. [Google Scholar] [CrossRef]
- Ciou, S.-H.; Cao, Y.-W.; Huang, H.-C.; Su, D.-Y.; Huang, C.-L. SERS enhancement factors studies of silver nanoprism and spherical nanoparticle colloids in the presence of bromide ions. J. Phys. Chem. C 2009, 113, 9520–9525. [Google Scholar] [CrossRef]
- Cirri, A.; Hernández, H.M.; Johnson, C.J. High precision electronic spectroscopy of ligand-protected gold nanoclusters: Effects of composition, environment, and ligand chemistry. J. Phys. Chem. A 2020, 124, 1467–1479. [Google Scholar] [CrossRef] [PubMed]
- Li, Y.; Chen, M.; Wang, S.; Zhu, M. Intramolecular metal exchange reaction promoted by thiol ligands. Nanomaterials 2018, 8, 1070. [Google Scholar] [CrossRef]
- Antoine, R. Supramolecular Gold Chemistry: From Atomically Precise Thiolate-Protected Gold Nanoclusters to Gold-Thiolate Nanostructures. Nanomaterials 2020, 10, 377. [Google Scholar] [CrossRef]
- Chang, C.-Y.; Tseng, T.-H.; Chen, B.-R.; Wu, Y.-R.; Huang, C.-L.; Chen, J.-C. Silver Nanoparticle-Mediated Synthesis of Fluorescent Thiolated Gold Nanoclusters. Nanomaterials 2021, 11, 2835. [Google Scholar] [CrossRef] [PubMed]
- Wang, M.; Wang, S.; Xie, X.; Su, X. Ag-ion-modified Au nanoclusters for fluorometric analysis of alkaline phosphatase. ACS Appl. Nano Mater. 2020, 3, 6034–6042. [Google Scholar] [CrossRef]
- Wu, Z.; Wang, M.; Yang, J.; Zheng, X.; Cai, W.; Meng, G.; Qian, H.; Wang, H.; Jin, R. Well-defined nanoclusters as fluorescent nanosensors: A case study on Au(25) (SG)(18). Small 2012, 8, 2028–2035. [Google Scholar] [CrossRef]
- Chen, P.C.; Yeh, T.Y.; Ou, C.M.; Shih, C.C.; Chang, H.T. Synthesis of aluminum oxide supported fluorescent gold nanodots for the detection of silver ions. Nanoscale 2013, 5, 4691–4695. [Google Scholar] [CrossRef]
- Zhang, Y.; Jiang, H.; Wang, X. Cytidine-stabilized gold nanocluster as a fluorescence turn-on and turn-off probe for dual functional detection of Ag(+) and Hg(2+). Anal. Chim. Acta 2015, 870, 1–7. [Google Scholar] [CrossRef]
- Hsu, M.S.; Cao, Y.W.; Wang, H.W.; Pan, Y.S.; Lee, B.H.; Huang, C.L. Time-dependent surface plasmon resonance spectroscopy of silver nanoprisms in the presence of halide ions. ChemPhysChem 2010, 11, 1742–1748. [Google Scholar] [CrossRef]
- Kang, X.; Zhu, M. Tailoring the photoluminescence of atomically precise nanoclusters. Chem. Soc. Rev. 2019, 48, 2422–2457. [Google Scholar] [CrossRef] [PubMed]
- Chakraborty, I.; Pradeep, T. Atomically precise clusters of noble metals: Emerging link between atoms and nanoparticles. Chem. Rev. 2017, 117, 8208–8271. [Google Scholar] [CrossRef] [PubMed]
- Canaparo, R.; Foglietta, F.; Limongi, T.; Serpe, L. Biomedical applications of reactive oxygen species generation by metal nanoparticles. Materials 2020, 14, 53. [Google Scholar] [CrossRef] [PubMed]
- Matulionyte, M.; Dapkute, D.; Budenaite, L.; Jarockyte, G.; Rotomskis, R. Photoluminescent gold Nanoclusters in cancer cells: Cellular uptake, toxicity, and generation of reactive oxygen species. Int. J. Mol. Sci. 2017, 18, 378. [Google Scholar] [CrossRef]
Disclaimer/Publisher’s Note: The statements, opinions and data contained in all publications are solely those of the individual author(s) and contributor(s) and not of MDPI and/or the editor(s). MDPI and/or the editor(s) disclaim responsibility for any injury to people or property resulting from any ideas, methods, instructions or products referred to in the content. |
© 2023 by the authors. Licensee MDPI, Basel, Switzerland. This article is an open access article distributed under the terms and conditions of the Creative Commons Attribution (CC BY) license (https://creativecommons.org/licenses/by/4.0/).