Article

Synthesis and Characterization of a Multiporous SnO2 Nanofibers-Supported Au Nanoparticles-Based Amperometric Sensor for the Nonenzymatic Detection of H2O2

by
Md. Ashraful Kader
1,
Nina Suhaity Azmi
1,*,
A. K. M. Kafi
2,
Md. Sanower Hossain
3,*,
Mohd Faizulnazrie Bin Masri
1,
Aizi Nor Mazila Ramli
1 and
Ching Siang Tan
4,*
1
Faculty of Industrial Sciences and Technology, Universiti Malaysia Pahang, Kuantan 26300, Malaysia
2
Department of Chemistry and Biochemistry, Kent State University, Kent, OH 44242, USA
3
Centre for Sustainability of Ecosystem and Earth Resources (Pusat ALAM), Universiti Malaysia Pahang, Gambang, Kuantan 26300, Malaysia
4
School of Pharmacy, KPJ Healthcare University College, Nilai 71800, Malaysia
*
Authors to whom correspondence should be addressed.
Chemosensors 2023, 11(2), 130; https://doi.org/10.3390/chemosensors11020130
Submission received: 17 January 2023 / Revised: 2 February 2023 / Accepted: 5 February 2023 / Published: 10 February 2023
(This article belongs to the Special Issue Advanced Electrochemical Sensors or Biosensors Based on Nanomaterial)

Abstract

:
The challenges of a heme protein and enzyme-based H2O2 sensor was subdued by developing a highly sensitive and practically functional amperometric gold nanoparticles (Au NPs)/SnO2 nanofibers (SnO2 NFs) composite sensor. The composite was prepared by mixing multiporous SnO2 NFs (diameter: 120–190 nm) with Au NPs (size: 3–5 nm). The synthesized Au NPs/SnO2 NFs composite was subsequently coated on a glassy carbon electrode (GCE) and displayed a well-defined reduction peak during a cyclic voltammetry (CV) analysis. The SnO2 NFs prevented the aggregation of Au NPs through its multiporous structure and enhanced the catalytic response by 1.6-fold. The SnO2 NFs-supported GCE/Au NPs/SnO2 NFs composite sensor demonstrated a very good catalytic activity during the reduction of hydrogen peroxide (H2O2) that displayed rapid amperometric behavior within 6.5 s. This sensor allowed for highly sensitive and selective detection. The sensitivity was 14.157 µA/mM, the linear detection range was from 49.98 µM to 3937.21 µM (R2 = 0.99577), and the lower limit of detection was 6.67 µM. Furthermore, the developed sensor exhibited acceptable reproducibility, repeatability, and stability over 41 days. In addition, the Au NPs/SnO2 NFs composite sensor was tested for its ability to detect H2O2 in tap water, apple juice, Lactobacillus plantarum, Bacillus subtilis, and Escherichia coli. Therefore, this sensor would be useful due to its accuracy and sensitivity in detecting contaminants (H2O2) in commercial products.

Graphical Abstract

1. Introduction

Hydrogen peroxide (H2O2) is a member of the reactive oxygen species (ROS) family. It is a weak acid (pKa ≈ 11.62), and at high concentrations, it can damage biological membranes and lead to the development of various life-threatening diseases [1,2]. H2O2 is widely used in multiple fields, such as the food, environment monitoring, and pharmaceutical industries, because of its strong oxidizing, bleaching, and sterilizing properties [3]; however, global concerns have arisen due to using concentrations higher than the acceptable limit (less than 3%). Although low concentrations of H2O2 are not harmful as they are quickly broken down by enzymes in the intestinal cells, ingesting concentrations greater than 3% can lead to adverse effects, such as vomiting, the irritation of mucous membranes, and burns in the esophagus [4].
H2O2 is commonly found as an ingredient in everyday products, such as cosmetics, textiles, and in agri-food industries. For example, it is used as a bleaching agent and in mouthwash preparation [5,6,7]. Certain bacteria commonly found in dietary products can generate H2O2. Escherichia coli, found in meat, raw milk, and vegetables, can produce intracellular H2O2 at rates of 10 to 15 µM/s in the presence of glucose [8,9]. Lactobacillus plantarum is a probiotic microorganism widely used in the food processing industry and is found in the gastrointestinal tract [10]. It contains pyruvate oxidase in its cytoplasm, which converts pyruvate to acetyl-phosphate using oxygen to produce CO2 and H2O2 [11]. If these products are not closely inspected, H2O2 may remain in the products as residues. Hence, it is important to regulate H2O2 levels to preserve healthy lives and to achieve the sustainable development goals (SDG #3) established by the United Nations. The efficient and precise method for detecting H2O2 in food samples is, therefore, crucial.
Among the many detection methods for H2O2, electrochemical sensors are an unprecedented invention of this century that are used to detect various chemical and biological phenomena inexpensively in many sectors, including clinical diagnosis, environmental monitoring, food quality monitoring, and more [12,13]. The principle of electrochemical detection was introduced by Clark and Lyons in 1962 [14] and is presently the most versatile point-of-care device. The electrochemical H2O2 sensor is a vindicated device that outperforms conventional colorimetry, chemiluminescence, titration, spectrometry, and chromatography fluorescence-based devices [15]. It has a wide linear detection range, a low detection limit, a quick current response, and excellent sensitivity [16].
Classical amperometry-based electrochemical H2O2 sensors were traditionally fabricated using natural enzymes such as horseradish peroxidase and hemoglobin [17], but, the high cost, instability, short life, and transducer dependence of natural enzymes utterly limit their widespread use [18]. The use of these catalysts also has the potential for oxidation of possible interferences such as ascorbic acid (AA), dopamine (DA), and uric acid (UA) that impede sensing performances [19]. Therefore, it is crucial to develop a high-performance and selective enzyme-free sensor to quantify H2O2. In the era of nonenzymatic H2O2 sensing, researchers have used various catalysts such as those that are carbon hybrid-based, metal-based, metal oxide-based, and polymers [20,21]. Among the nonenzymatic H2O2 sensors, metal-derived NPs are particularly well-suited catalysts because of their diverse morphologies, high surface areas, and superior electrocatalytic activities [22].
Au NPs have tremendous chemical, electrical and optical properties that enhance their surface-to-volume ratio, provide excellent conductivity, have electrochemical characteristics, biocompatibility, facile surface functionalization, and tuneable optoelectronic properties. These properties make them attractive catalyst candidates not only for H2O2 sensing but also for ascorbic acid, metal ions, and more [23,24]. Au NPs have demonstrated excellent nanozyme activities similar to catalase, reductase, oxidase, peroxidase, and superoxide dismutase [25]. This enzyme-like property can promote electron transfer through the interface of nanoparticles and widening the modified electrode’s outer region [26]; thus, it accelerates the catalytic response during H2O2 sensing [27,28].
It has been reported that the high surface-to-volume ratio of Au NPs can cause instability and aggregation [29]. Bare Au NPs have been shown to be inactive towards certain chemicals in enzyme-mimicking catalytic reactions [30]. The strategy of dispersing Au NPs with porous materials is particularly effective because the porous structures feature internal cavities that effectively retain the NPs without aggregation and that maintain their activity. Aside from this, porous materials exhibit a size-selective property that ensures an accurate interaction of the reactant with an active metal surface [31,32]. SnO2 NFs are a citable porous metal oxide used as catalyst supports due to their large surface-to-volume ratio and the formation of nanograins and grain boundaries [33,34,35]. This high surface area to volume ratio allows for a large surface area while having a low total volume [36]. Multiporous SnO2 NFs synthesized via electrospinning by regulating the precursor concentration have been reported to have a surface area 6–8 times greater than porous nanofibers and nanowires [37]. Therefore, in this study, Au NPs and SiO2 were combined to develop a high-performance Au NPs/SnO2 NFs composite sensor to detect H2O2. A diverse sample, including tap water, apple juice, L. plantarum, B. subtilis, and E. coli were used to evaluate the accuracy and sensitivity of the H2O2 detection nanosensors.

2. Methods and Materials

2.1. Materials and Reagents

Gold(III) chloride trihydrate (HAuCl4·3H2O) (>99.9%), sodium borohydride (NaBH4, 98%), sodium citrate (99%), tin chloride pentahydrate (SnCl4·5H2O), crab shell-extracted chitosan, dimethylformamide (DMF), polyvinylpyrrolidone (PVP), NaH2PO4·H2O (98%), Na2HPO4·7H2O (99%), NaOH pellets, HCl, ethanol, and H2O2 (30% wt%) were analytical grade and purchased from Sigma-Aldrich (St. Louis, MO, USA). The H2O2 was preserved at 4 °C. Ultrapure water (18 MΩ cm) purified with the Nanopure® water system was used throughout the experiments. A phosphate buffer (PBS) (0.1 M) with a pH of 7.0 was utilized as an electrolyte. The phosphate buffer’s desired pH was maintained using 1.0 M hydrochloric acid (HCl) or 1.0 M sodium hydroxide (NaOH).

2.2. Synthesis of Gold Nanoparticles (Au NPs)

The Au NPs were synthesized by the citrate reduction techniques described by Wang et al. [38]. The Au NPs were synthesized in a round-bottom flask by mixing 100 mL of 0.01% (w/w) aqueous HAuCl4 with 1 mL 1% (w/w) sodium citrate solution under stirring. After 1 min, 1.6 mL of 0.075% (w/w) NaBH4 (dissolved in the 1% (w/w) sodium citrate solution) was slowly added to the solution. The reaction mixture was continuously stirred until it turned red. At 4 °C, the synthesized Au NPs were preserved.

2.3. Synthesis of Multiporous SnO2 Nanofiber (SnO2 NFs)

A SnO2 nanofiber was synthesized based on our previous research [39]. First, a solution was prepared by dissolving 3 g of PVP in ethanol and DMF in a volume ratio of 1:1. Then, at room temperature, several concentrations of SnCl4·5H2O were added to this solution until it turned transparent. The concentrations of SnCl4·5H2O added was 5.5 mM, 7 mM, 8.5 mM, 10 mM, and 11.5 mM, labeled T0, T1, T2, T3, and T4, respectively. Then, the viscosity of the synthesis precursor solution was measured using a rheometer (LVDV III Ultra, Brookfield Co., Middleboro, MA, USA). This solution was then placed into a plastic syringe fitted with a steel needle and prepared for injection during the electrospinning experiment. The following parameters were employed in this electrospinning: voltage: 25 kV, distance between collector and needle tip: 20 cm, injection rate: 0.6 mLh−1, humidity: 40–45%, and rotation speed: 1200 rpm. The collected nanofibers were annealed at 600 °C for 3 h with a heating rate of 0.5 °C per minute.

2.4. Sensing Electrode Fabrication

First, the stock solution of SnO2 NFs was prepared by adding SnO2 NFs with ultrapure water (5 mg/mL) through stirring. Then, the Au NPs/SnO2 NFs composite was prepared by mixing 8.5 µL of the Au NPs solution with 5.5 µL of the SnO2 NFs solution. A GCE electrode (3 mm) was employed to coat this Au NPs/SnO2 NFs composite for fabricating the sensor. Prior to an electrode modification, the GCE electrode surface was cleaned using 0.05 μm alumina slurries. Then, CV was cycled in a 0.5 M H2SO4 solution at a potential range of −1.5 V to 0.5 V at 1a 00 mV/s scan rate for further treatment. Following the electrode drying, the prepared 14 µL Au NPs/SnO2 NFs composite was coated onto the GCE electrode with 1.5 µL of chitosan (2 mg/mL) and left to dry overnight. The modified electrodes were rinsed with water before an analysis to obtain the maximum response. Different Au NP concentrations were added with a certain amount of SnO2 nanofiber to achieve the ultimate response. For the comparison, the GC/Au NPs and GC/SnO2 NFs electrodes were prepared similarly.

2.5. Preparation of Real Sample for Multiple-Step Chronoamperometry Analysis

The consistency of the Au-SnO2 NFs composite for detecting H2O2 was evaluated by applying a potential of −0.82 V through multi-step chronoamperometry using tap water, apple juice, L. plantarum, E. coli, and B. subtilis. The H2O2-containing real sample was prepared by adding 20 mL of tap water and 8 mL of apple juice to 0.1 M PBS (pH 7.0), and the total volume was 50 mL. During the analysis, 100 μM of H2O2 was added every 50 s.
The test sample was prepared using a 2-day-old stock of L. plantarum and E. coli supplied by Glycobio International Sdn. Bhd., Kuantan, Malaysia. A 50 mL amount of broth culture was centrifuged at 4000× g for 20 min using an ultracentrifuge, and the collected pellet was again centrifuged at 4000× g for 10 min. The collected pellet was then re-suspended in 10 mL of PBS solution (pH 7.0) to prepare the test sample. Prior to injecting H2O2, 1 mL of each bacterium was suspended in 49 mL of 0.1 M PBS (pH 7.0) and incubated for 15 min under continuous stirring. After incubation, the multi-step chronoamperometry was carried out by adding 200 µM of H2O2 at 50 s intervals. The B. subtilis for the test sample preparation was provided by Glycobio International Sdn. Bhd., Malaysia, in a lyophilized form. The test sample was prepared by adding 22 mg of the lyophilized bacteria to 50 mL of the 0.1 M PBS (pH 7.0) solution, which was then incubated and stirred for 15 min under continuous stirring. During the analysis, 200 μM of H2O2 was added every 50 s.
The changes in the amperometric current response were monitored, and the recovery of H2O2 from the solution was estimated by comparing it to the standard (0.1 M PBS solution) amperometric curve.

2.6. Apparatus

The Au NPs and Au NPs/SnO2 NFs composite were characterized using transmission electron microscopy (TEM) (Technai 20, FEI, Hillsboro, OR, USA) with a selected area electron diffraction (SAED). The morphology and porous structure of the SnO2 NFs were studied using field emission scanning electron microscopy (FESEM) with EDX at a 5 kV acceleration voltage (JEOL, Tokyo, Japan (JSM-7800F)). The Au NPs/SnO2 NFs composite was verified using X-ray powder diffraction (XRD) (Miniflex II; Rigaku, Tokyo, Japan). An electrochemical analysis was performed in a three-electrode cell using a Gamry potentiostat instrument (INTERFACE1000E; 09218, Warminster, UK), where a platinum wire electrode and Ag/AgCl electrode served as the counter and reference electrodes, respectively. By applying a voltage between −1.064 V and 0.3 V vs. the Ag/AgCl, cyclic voltammetry (CV) was conducted in 0.1 M PBS (pH 7). A multiple-step chronoamperometry was conducted by applying a potential of −0.82 V while stirring. At room temperature, all the analyses were performed.

3. Results and Discussion

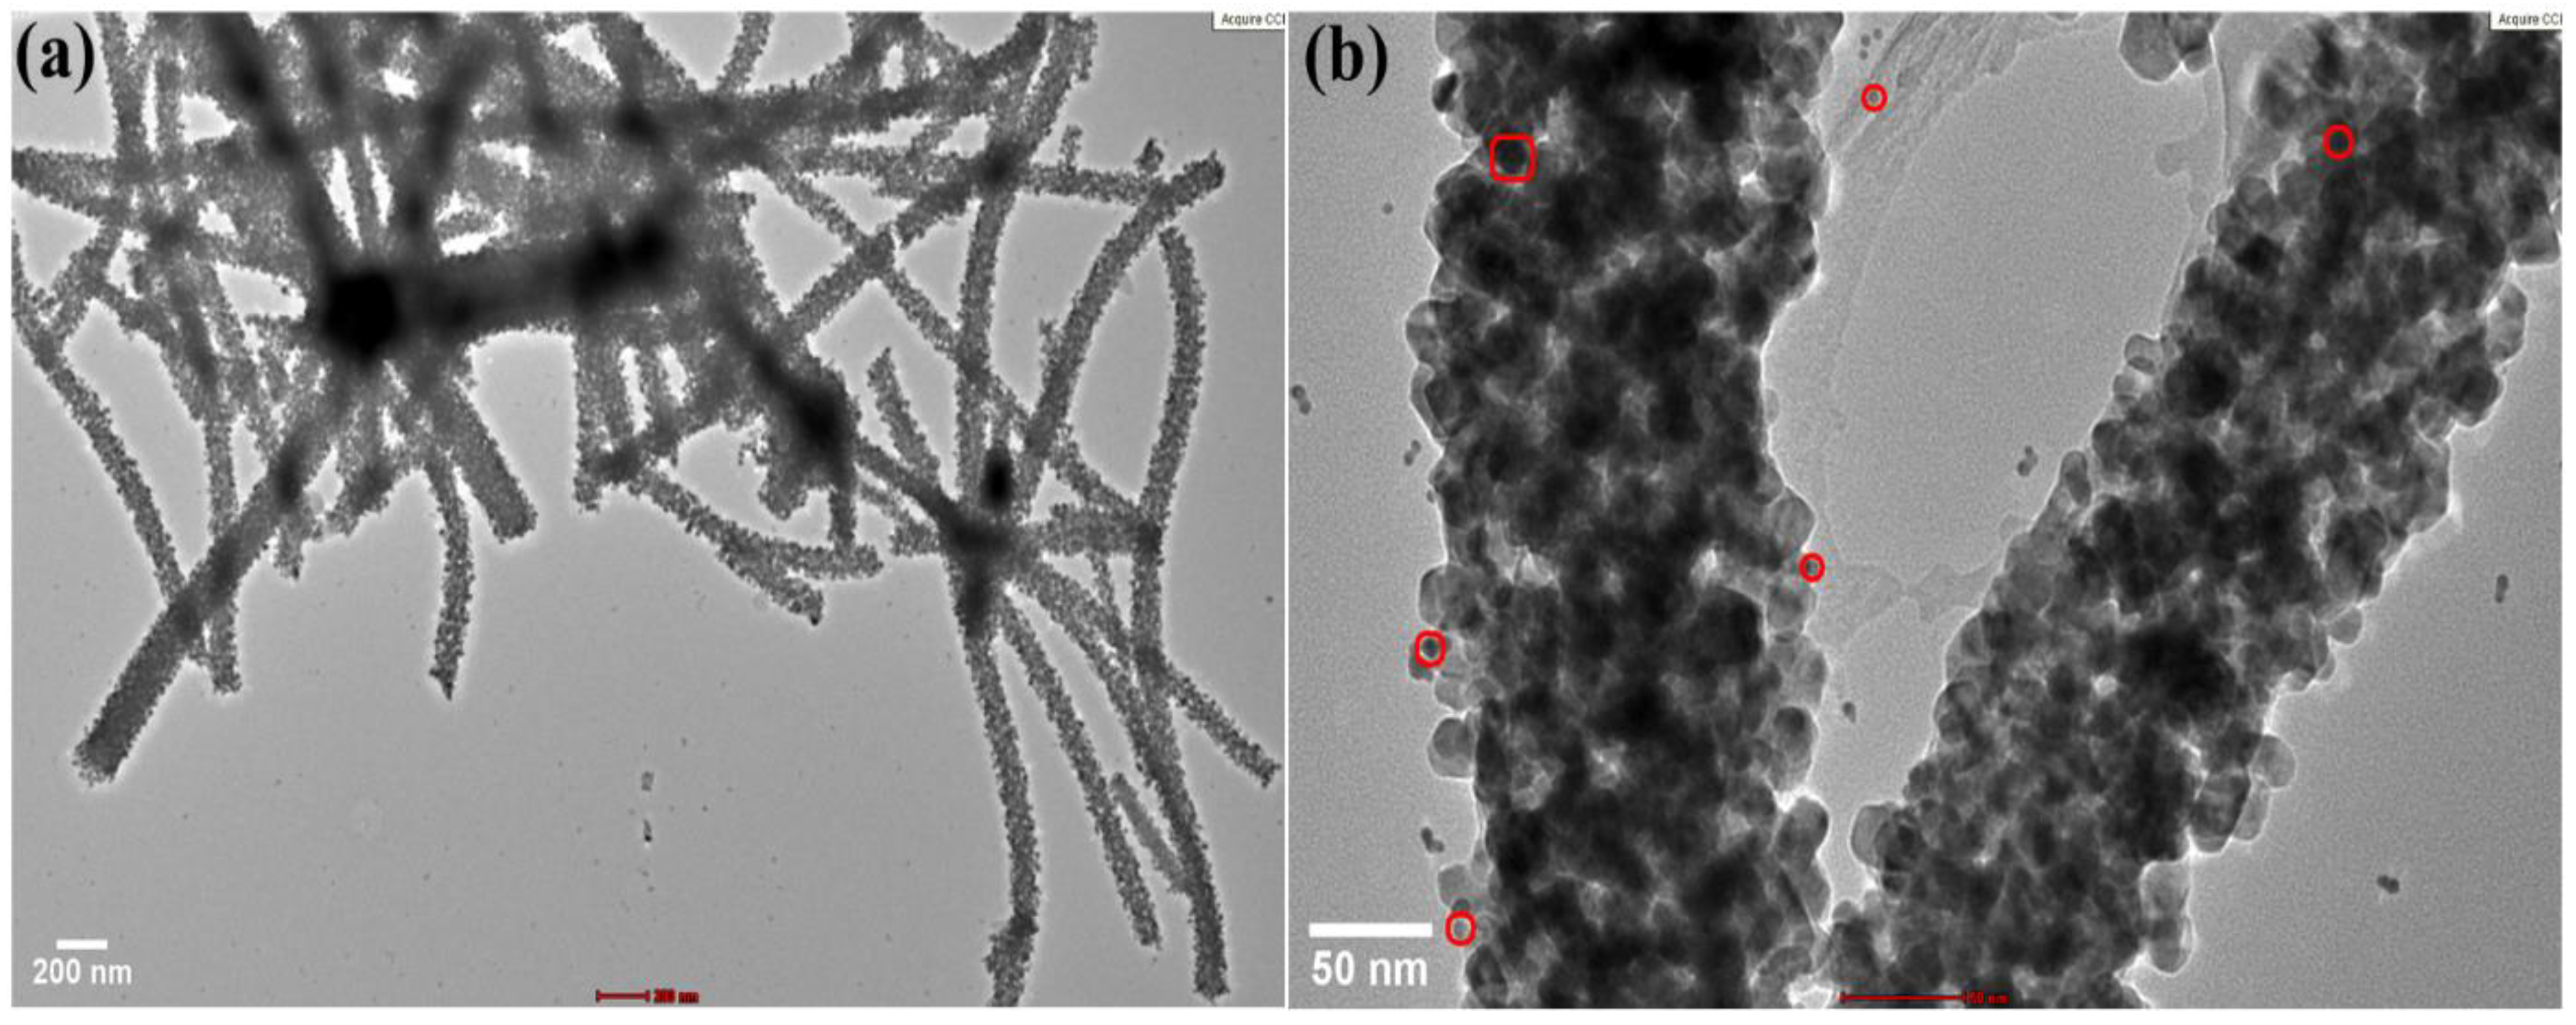
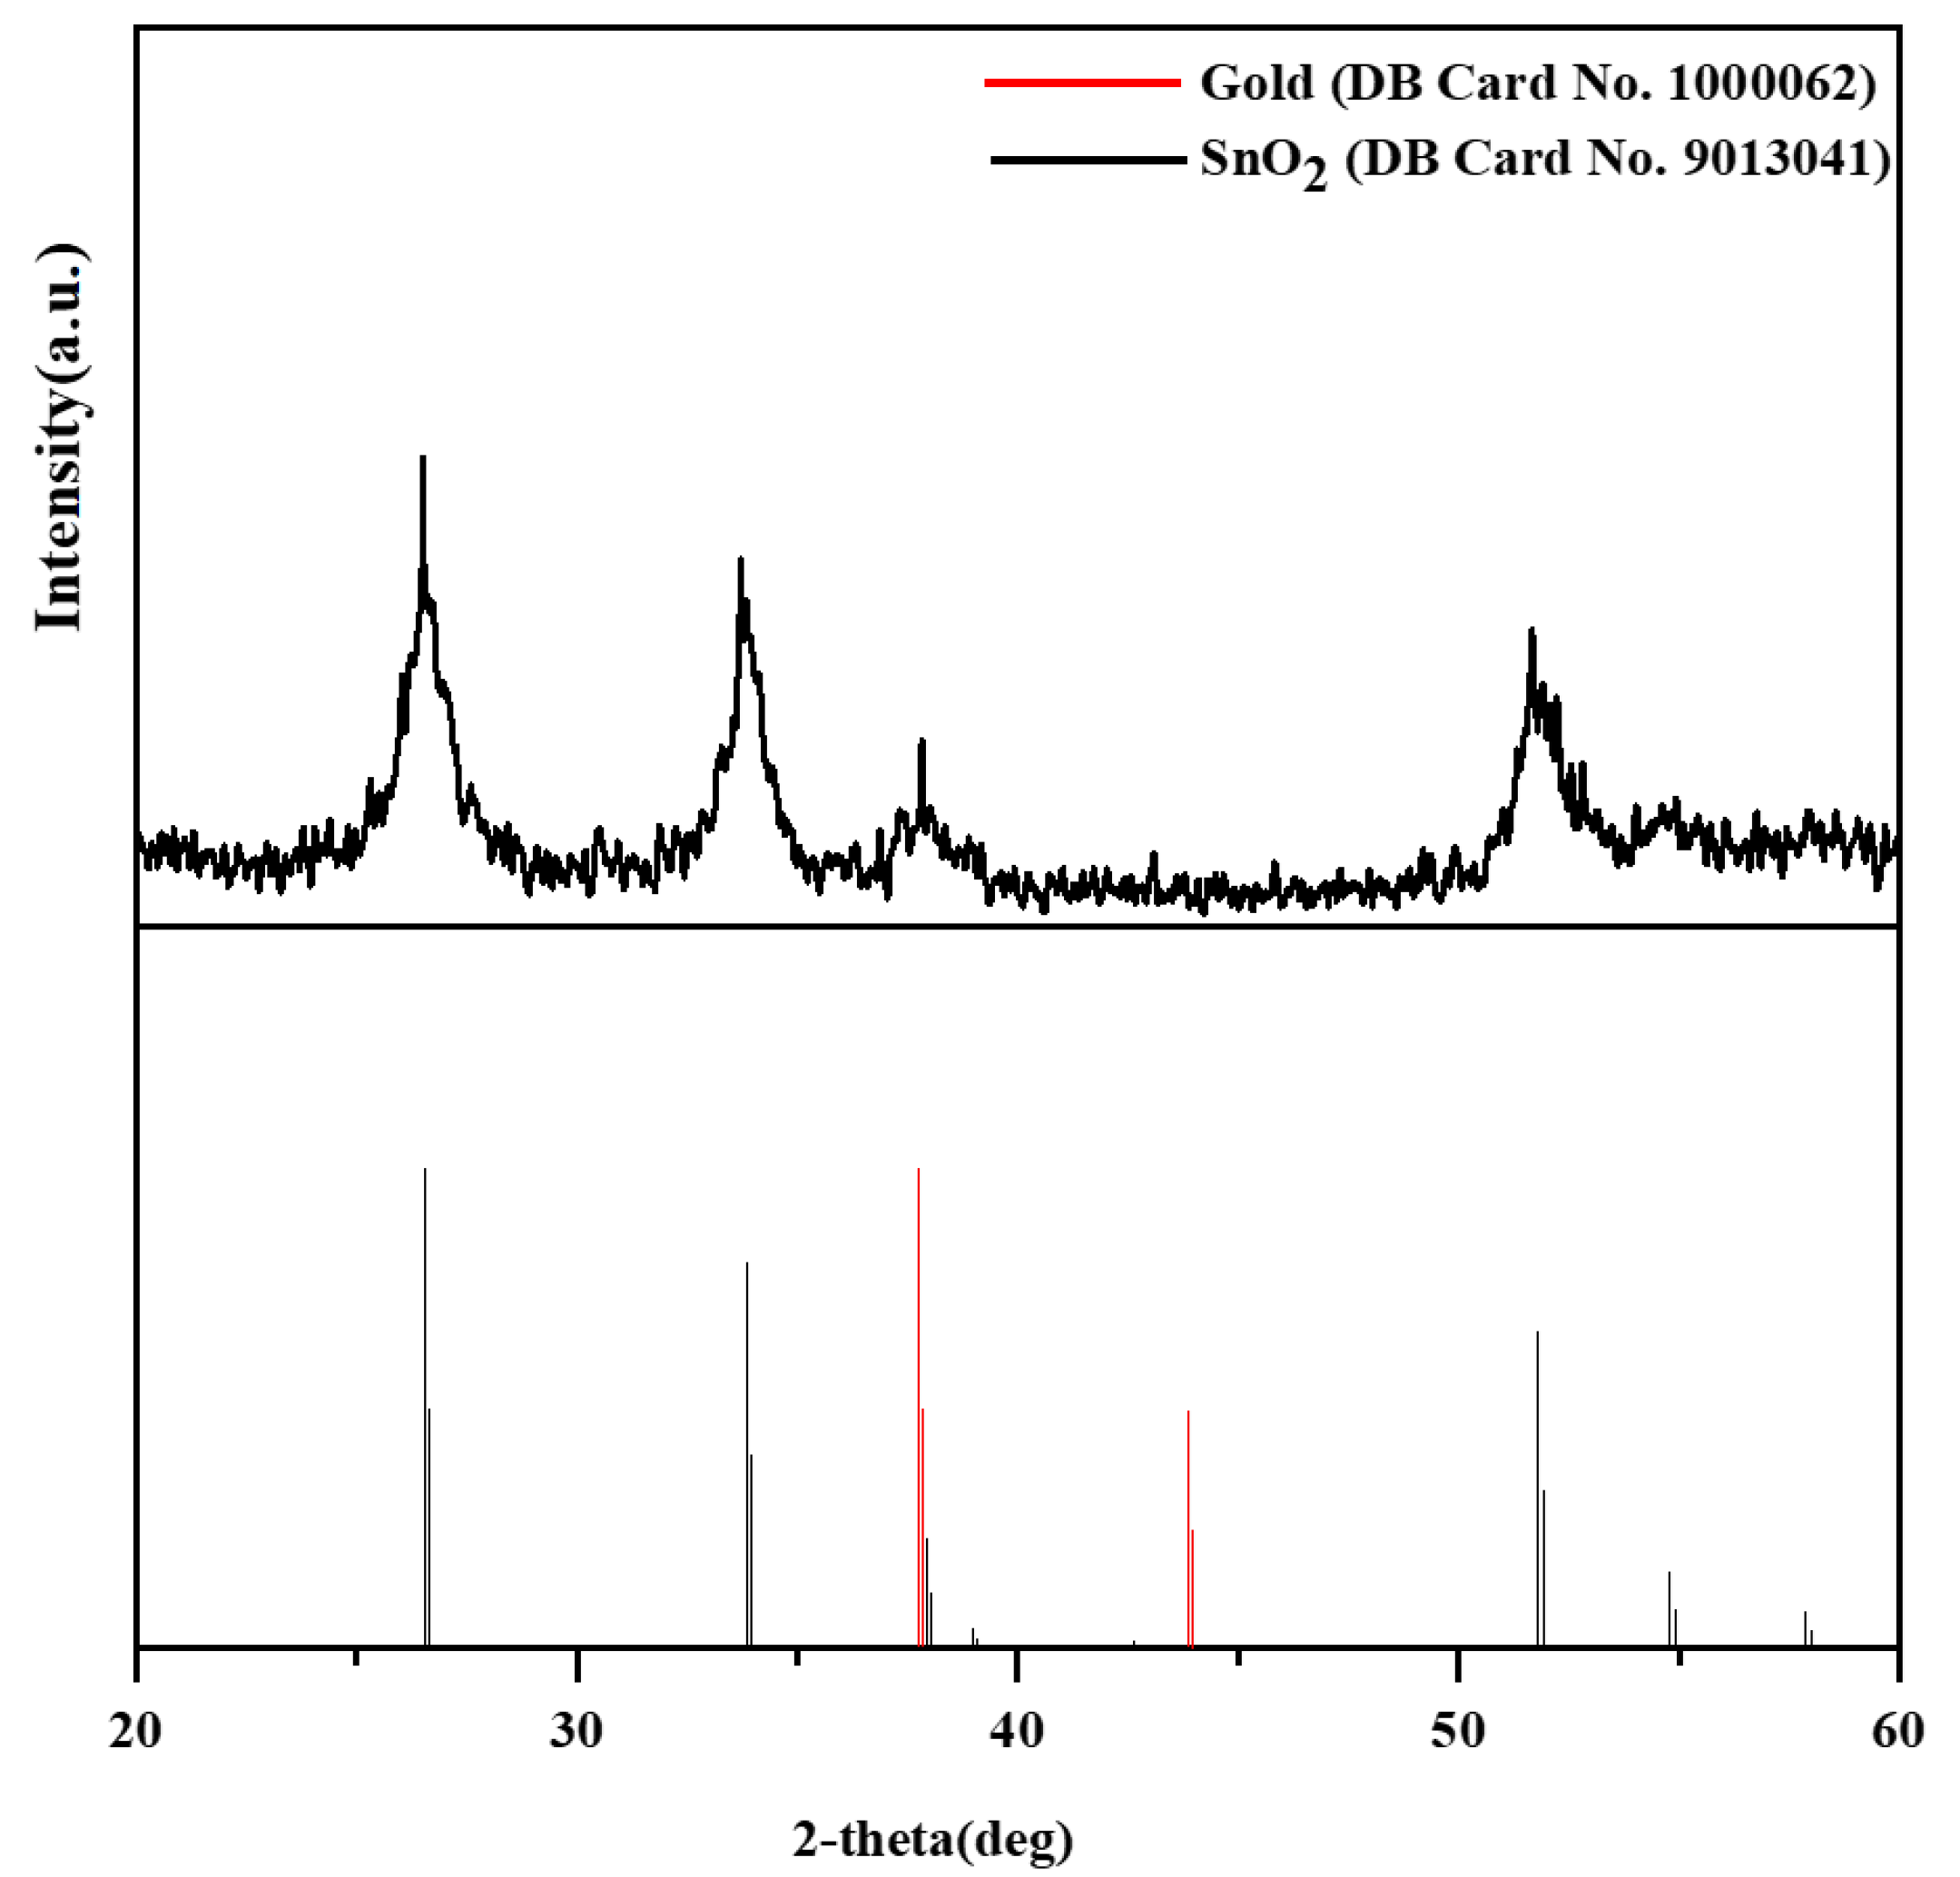
3.1. Morphological Characterization

The structure and morphology of the Au NPs were investigated using TEM. Figure 1a shows the synthesis of Au NPs with a size of 3–5 nm. The shape of the Au NPs was confirmed by UV-Vis, with the maximum absorption wavelength being around 519 nm, as shown in Figure 1b. It has been reported that an SPR peak near 520 nm is an indicator of spherical-shaped particles [40,41,42]. There was no change in the SPR peak after 30 days, which indicated the stability of the Au NPs. Small Au NPs were more active in exhibiting catalytic activity as compared to larger Au NPs. A similar finding was also reported by other researchers [43,44].
Figure 1c,d show the FESEM images of electrospun multiporous SnO2 NFs. They had a crystalline morphology and fibrous structure with fiber–fiber interconnections. The average diameter was 120–190 nm, and the number of channels varied from two to four. The SnO2 NFs had many small grains below 15 nm, smaller than the porous nanofibers (15–25 nm) [45]. This small grain size made for a multiporous and crystal structure. Due to the multiporous structure, multiple channels, and a three-dimensional network, the SnO2 NFs offered a large surface area that was very convenient for loading Au NPs. The synthesized NFs were annealed at 600 °C, which increased the crystallinity and surface roughness.
The synthesis of the Au NPs/SnO2 NFs composites was verified using TEM and XRD analyses. The images of the Au NPs/SnO2 NFs are shown in Figure 2 at various magnifications. It is apparent from the figure that the Au NPs were uniformly dispersed across the region being scanned of the composite. Figure 2a reveals the typical structure of the Au NPs/SnO2 NFs composite where dark spots in some areas appeared from the stacking of numerous nano-size fibers. The enlarged view in Figure 2b indicates the presence of Au NPs (marked by red circles) on a SnO2 nanofiber along with nanograins of SnO2 fibers. After deposition, no decomposition or size change of the Au NPs by the SnO2 NFs occurred. The deposition of Au NPs on the multiporous SnO2 surface helped maintain the catalytic activity, providing a large surface area and preventing agglomeration.
The presence of Au NPs on the SnO2 NFs without any structural changes was further verified using XRD, as displayed in Figure 3. The XRD was carried out using a K α Cu value of 1.5406 angular units over the angular range of 20° to 60°. A diffraction pattern at 2θ values of 26.52°, 33.76°, and 51.75° were found, which corresponded to the (110), (101), and (211) crystal planes of SnO2, respectively (the SnO2 phase COD database (DB) card no. 1000062). This diffraction pattern agrees with babu et al. [46]. The diffraction peaks of the SnO2 were broad and reduced in intensity, demonstrating that nanocrystals made up the mesoporous walls of the SnO2 [47]. Another diffraction peak found in the XRD pattern was attributed to face-centered cubic nano gold (the Au phase COD database (DB) card no. 9013041) [48]. The diffraction peak of the Au was relatively weak due to the low concentration and nanometer size of the Au NPs [49]. There was no peak corresponding to the Au–Sn compound observed. As a result, it is reasonable to anticipate that both components kept their physical structure, and the formation of a nanocomposite can be expected [50]. All of these indicate that Au NPs and SnO2 nanoparticles were successfully loaded and anchored onto the surface of the electrode. The average crystallinity index of the synthesized Au NPs–SnO2 NFs was 70.

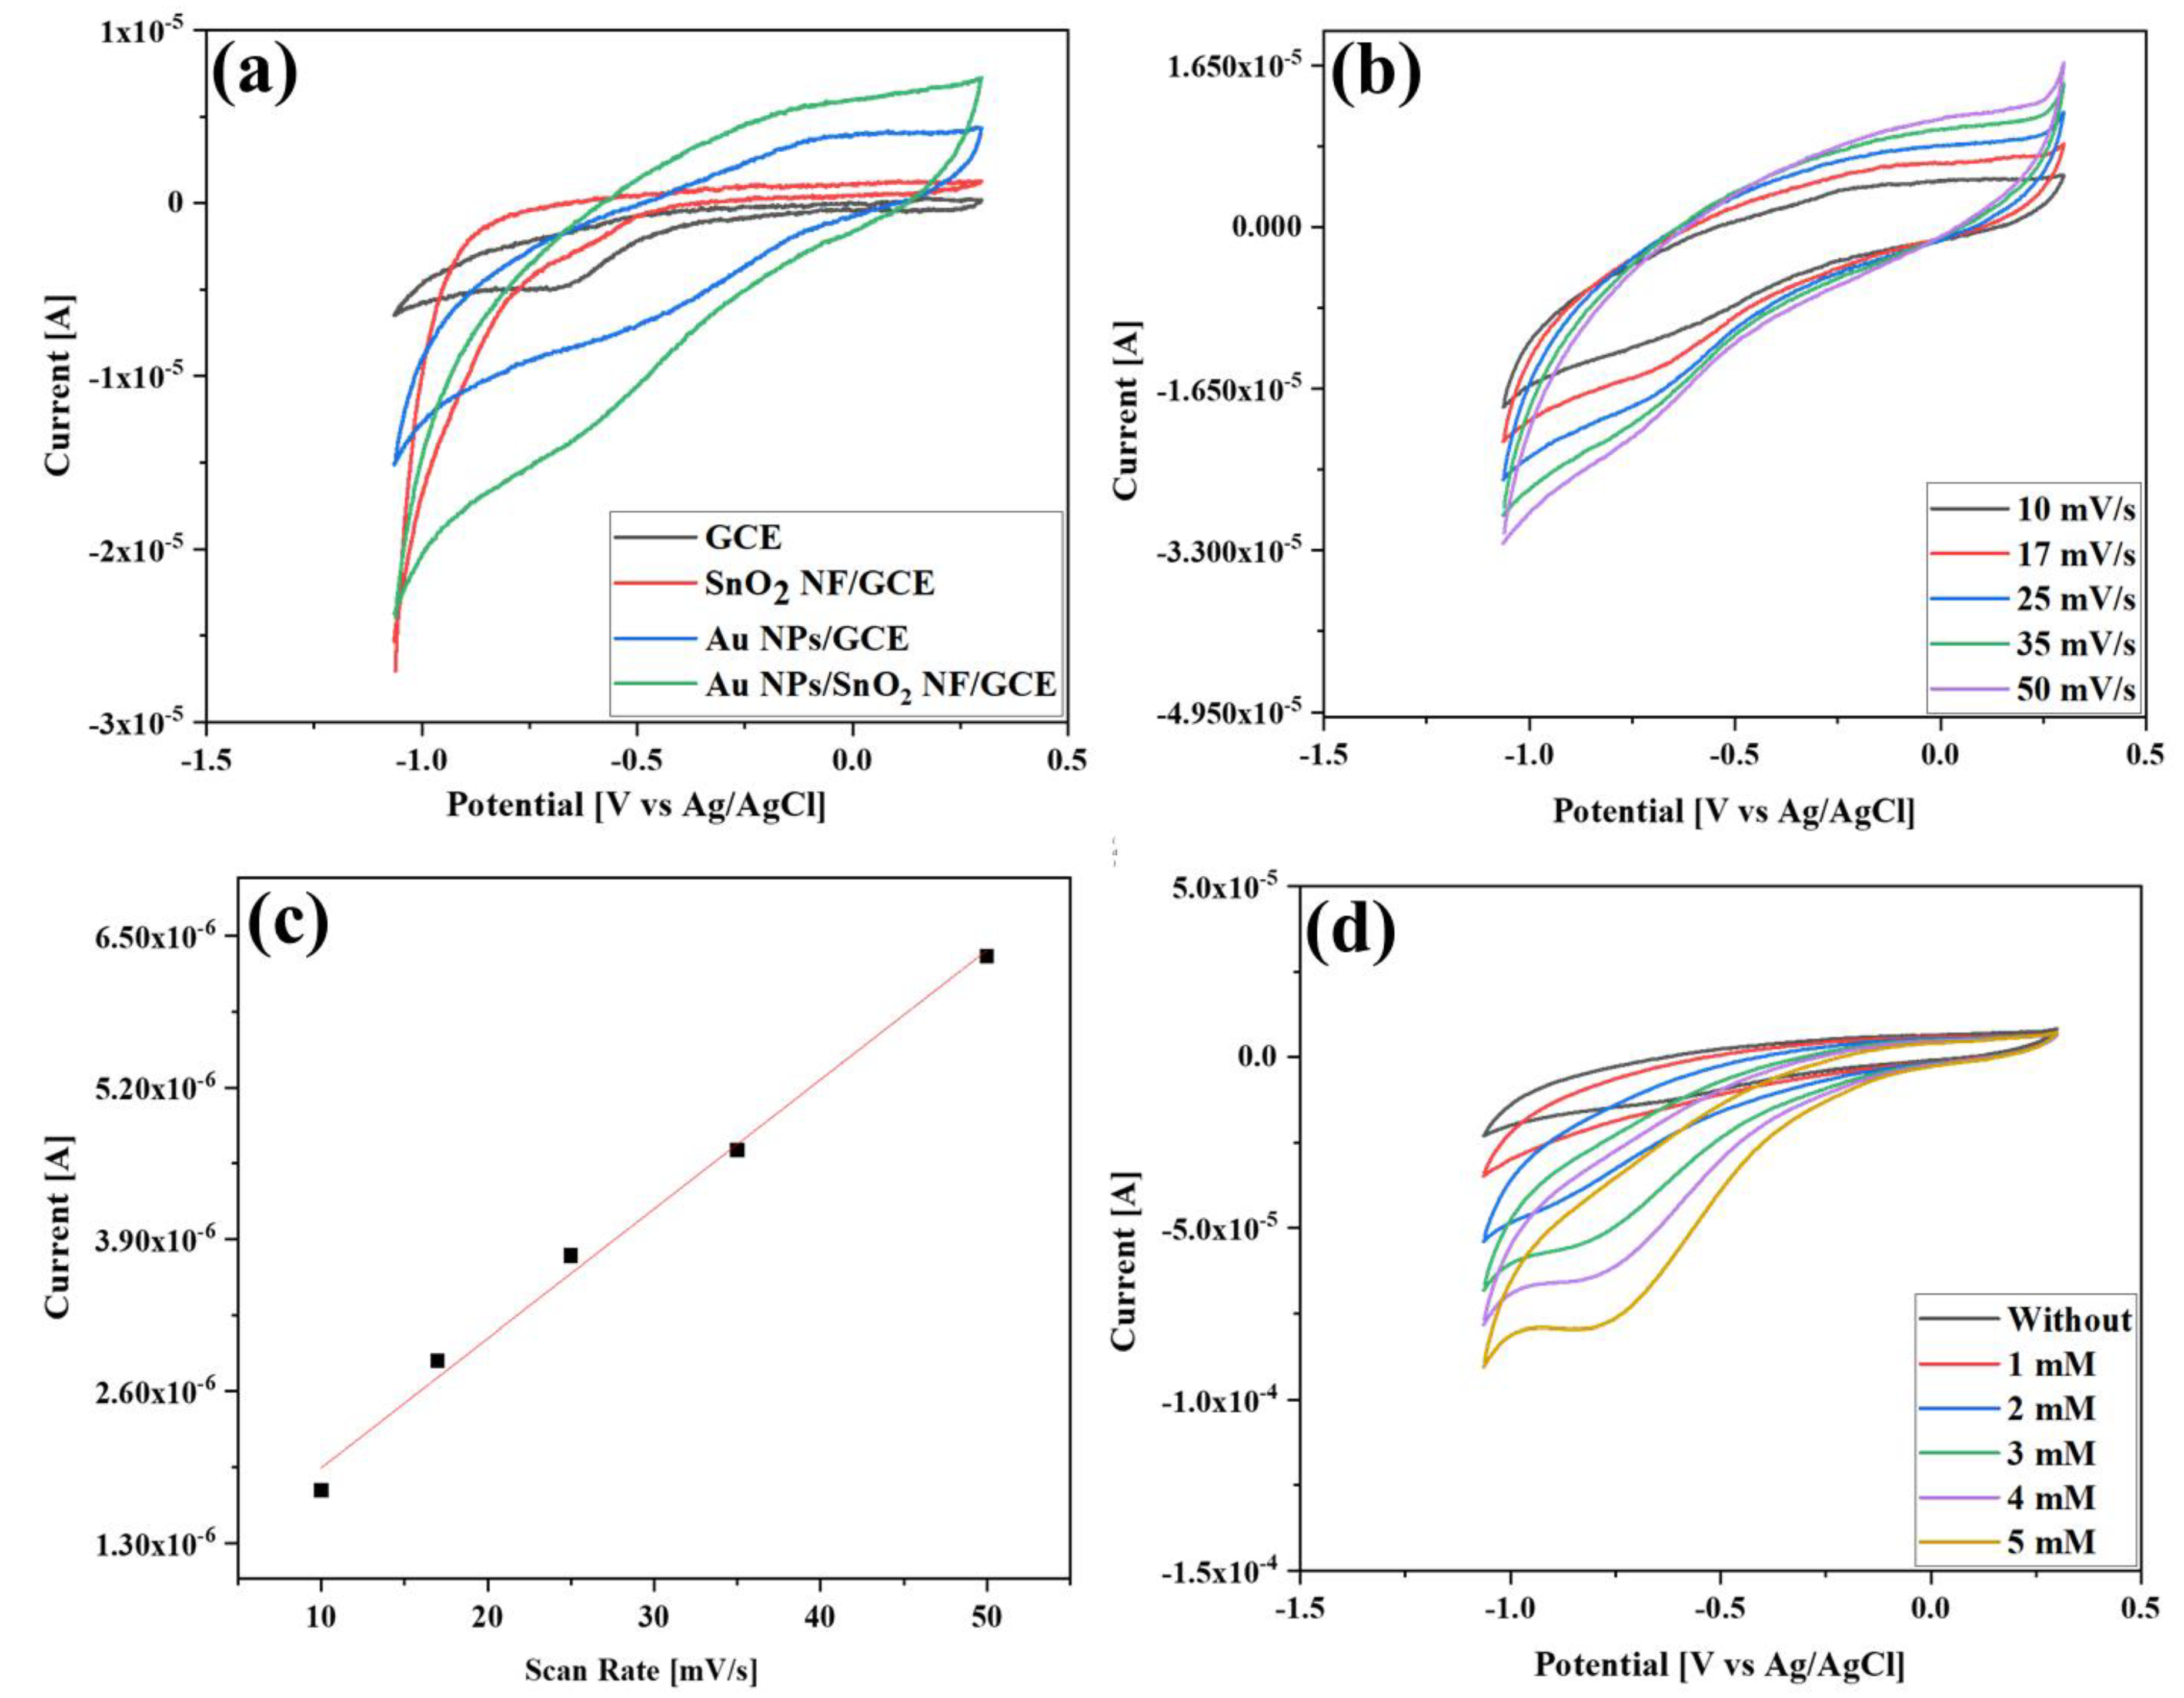
3.2. Electrochemical Properties of the Au NPs/SnO2 NFs Composite Electrode

The electrochemical properties of the Au NPs/SnO2 NFs composite and the role of SnO2 NFs on the catalytic activity of Au NPs was investigated through CV without H2O2 in a 0.1 M PBS (pH = 7.0) solution in the potential range of −1.064 V to 0.3 V at a 17 mV/s scan rate. Figure 4a illustrates the CV behavior of bare GCE, GCE/SnO2 NFs, GCE/Au NPs, and GCE/Au NPs/SnO2 NFs composite electrodes. As can be seen, the redox current of the GCE/Au NPs/SnO2 NFs composite electrode was much higher than the bare GCE, GCE/SnO2 NFs, and GCE/Au NPs electrode. The bare GCE had no noticeable response, and the GCE/SnO2 NFs electrode exhibited some current response with a narrower peak than that of the GCE. This could be because SnO2 is a semiconductor with less conductivity than carbon-based materials [48]. The CV of the GCE/Au NPs displayed higher peak currents than the GCE/SnO2 NFs, and the peak currents for the GCE/Au NPs/SnO2 NFs composite electrodes were further improved compared with that for the GCE/Au. The CV of the GCE/Au NPs/SnO2 NFs composite electrodes exhibited a certain degree of cathodic peak current which was attributed to the formation of a gold oxide monolayer through reduction during a positive-going potential scan [51,52]. This redox peak indicated the successful coating of Au NPs on the electrode, and the Au NPs were active on the electrode. This CV study indicated that the Au NPs were the sole material that showed redox properties, and that the SnO2 NFs only contributed to enhancing the current response of the Au NPs.
The outstanding electrocatalytic property can be attributed partly to the synergistic impact of the Au NPs and SnO2 NFs. Figure 4b illustrates the CV of the GCE/Au NPs/SnO2 NFs composite electrode without H2O2 in a 0.1 M PBS (pH = 7.0) solution at different scan rates. Both the electrochemical oxidation and reduction peak current climbed with an increase in the scan rate, where the cathodic peak current increment was linear with the scan rate, as displayed in Figure 4c. This outcome demonstrated that the electrochemical process occurring at the electrode was surface-controlled [51].

3.3. Electrochemical Reduction of H2O2 Using the Au NPs/SnO2 NFs Composite

The reduction of H2O2 by the GCE/Au NPs/SnO2 NFs composite electrode was examined by adding H2O2 in 0.1 M PBS (pH = 7.0) at 17 mV/s, as demonstrated in Figure 4d. Apparently, the developed sensor responded electrochemically to the addition of H2O2. When the concentration was increased from 1 to 5 mM, the reduction peak signal dramatically increased while there was a noticeable decrease in the oxidation current. These findings indicated the potential of the composite electrode for an electrocatalytic reduction of H2O2.

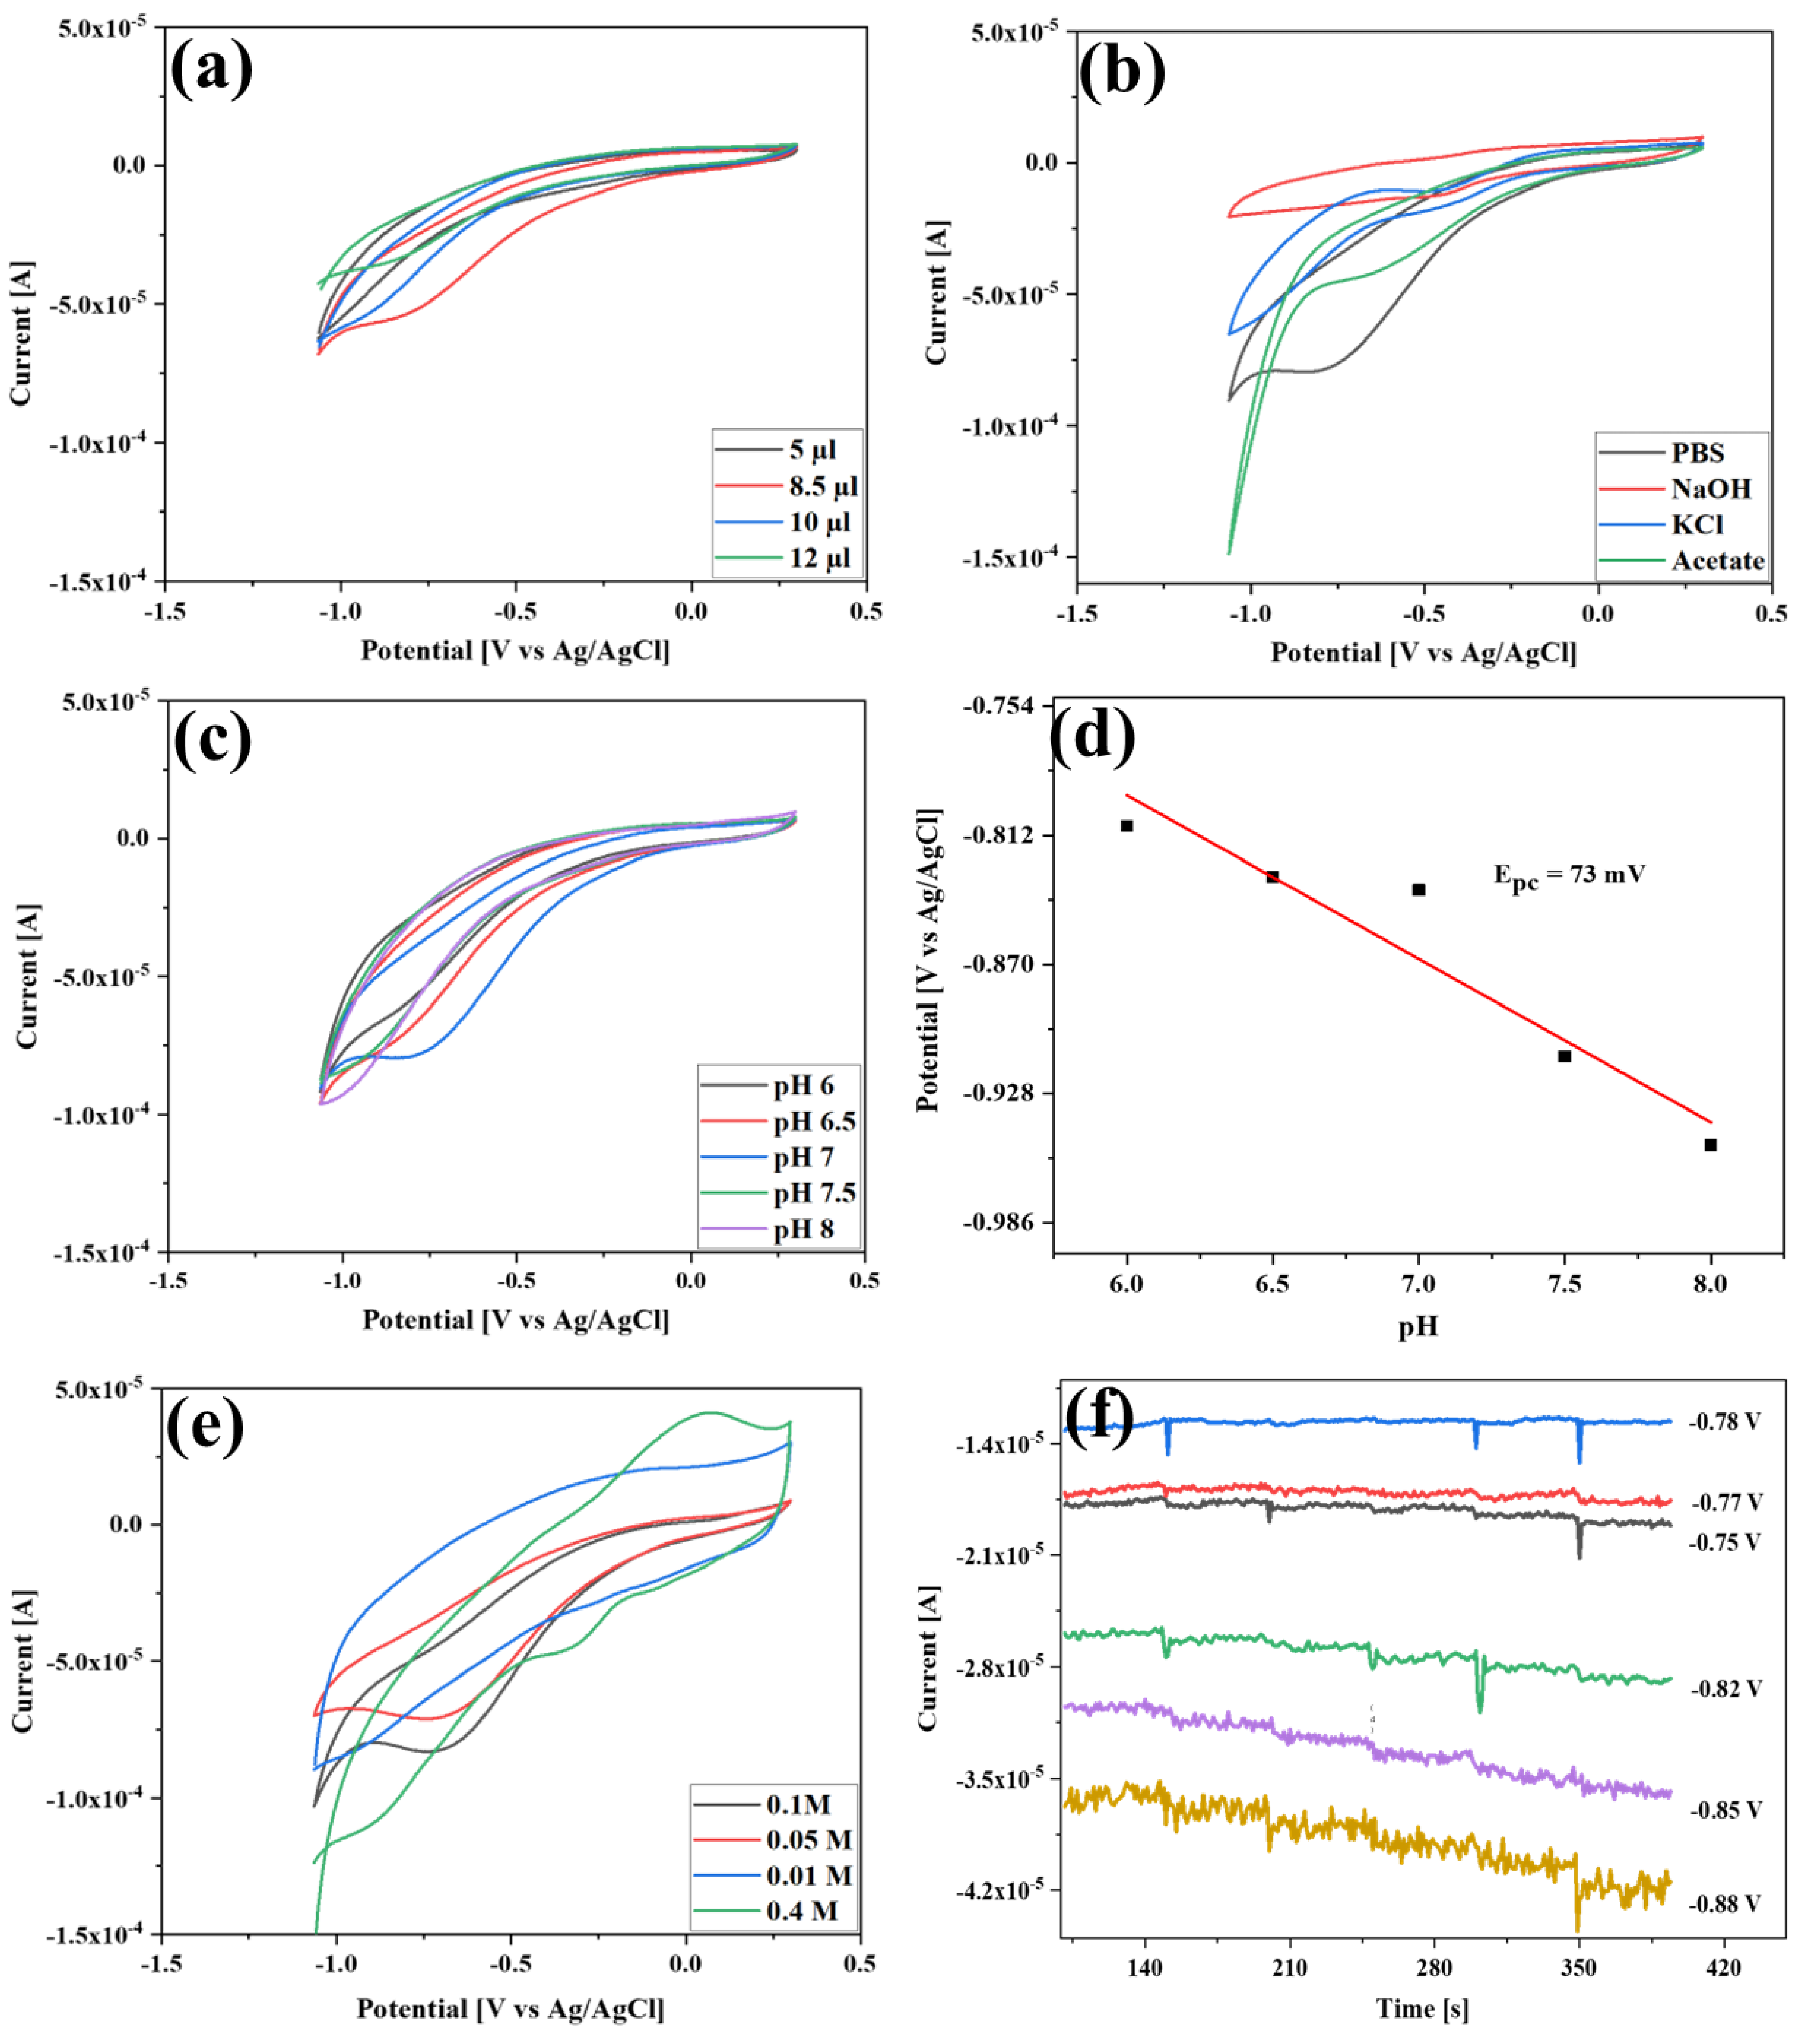
3.4. Optimization of Detection Circumstances

The choice of appropriate detection settings assists a sensor in achieving high sensitivity and low detection limits [53]. As the sensitivity of the electrochemical sensor significantly depends on the amount of a catalyst, the effect of the amount of the Au NPs was studied using CV in the presence of 3 mM of H2O2 in 0.1 M PBS (pH = 7.0) at a 17 mV/s scan rate. Figure 5a shows the CV behavior of the GCE/Au NPs/SnO2 NFs composite electrode prepared using different amounts of Au NPs. The reduction current gradually increased as the amount of the Au NPs increased from 5 to 8.5 μL, but the response decreased when it was further increased to 10 μL and 12 μL. This is because excess Au NPs thicken an electrode layer and limit the current response, which might further reduce the sensitivity and stability [54]. The volume of 8.5 μL was selected because it had the most significant probability for electron transfer. The influence of different supporting electrolytes on the sensing response was investigated using 0.1 M of PBS, 0.15 M of NaOH, 0.5 M of KCl, and 0.1 M of an acetate buffer in 5 mM of H2O2. It can be seen from Figure 5b that the composite electrode exhibited a reduction peak current in all the electrolytes during the CV but showed the highest current response in 0.1 M PBS; therefore, it was selected for this study. The effect of different pH values of PBS on the electrochemical reduction of H2O2 was examined via CV in the presence of 5 mM of H2O2, as displayed in Figure 5c. A discernable and higher reduction peak current was observed at pH 7 containing a 0.1 M PBS buffer, which was not observed at another pH. Since a pH of 7.0 exhibited the maximum reduction current and this study was intended to determine H2O2 in food and beverage samples, a pH of 7.0 was used throughout the study.
A further data analysis revealed a linear relationship between the pH and peak potential (as shown in Figure 5d), where the slope value was found to be 73 mV, which nearly matches the Nernst theoretical value. This indicates that H+ entered into the reaction, and that protons and electrons participated in the reaction in an equal proportion [55,56]. Figure 5e displays the CV results of the composite electrode at diverse PBS concentrations of 5 mM H2O2. Since the PBS concentration can affect the sensing performance, the optimum reduction peak current and peak shape calculated at 0.1 M were considered for this study.
Determining the appropriate reduction potential is paramount to obtaining a superior sensing performance with less noise. Figure 5f demonstrates the multiple-step chronoamperometry study of the GCE/Au NPs/SnO2 NFs composite electrode performed in 0.1 M PBS by adding 50 µM of H2O2 in potentials ranging from −0.75 V to −88 V. As the potential increased from −0.75 V to −0.82 V, the reduction current rose, while noise was also observed to varying degrees. Then, when the applied potentials were increased to −0.85 and −0.88 V, the amount of noise increased to such an extent that it diminished the current response. Thus, −0.82 V was selected as the ideal amperometric potential close to and even lower than many previously reported H2O2 sensors [57,58,59,60]. Low potentials can lessen an interference response as well as background noise, both of which enhance sensing performances [61].

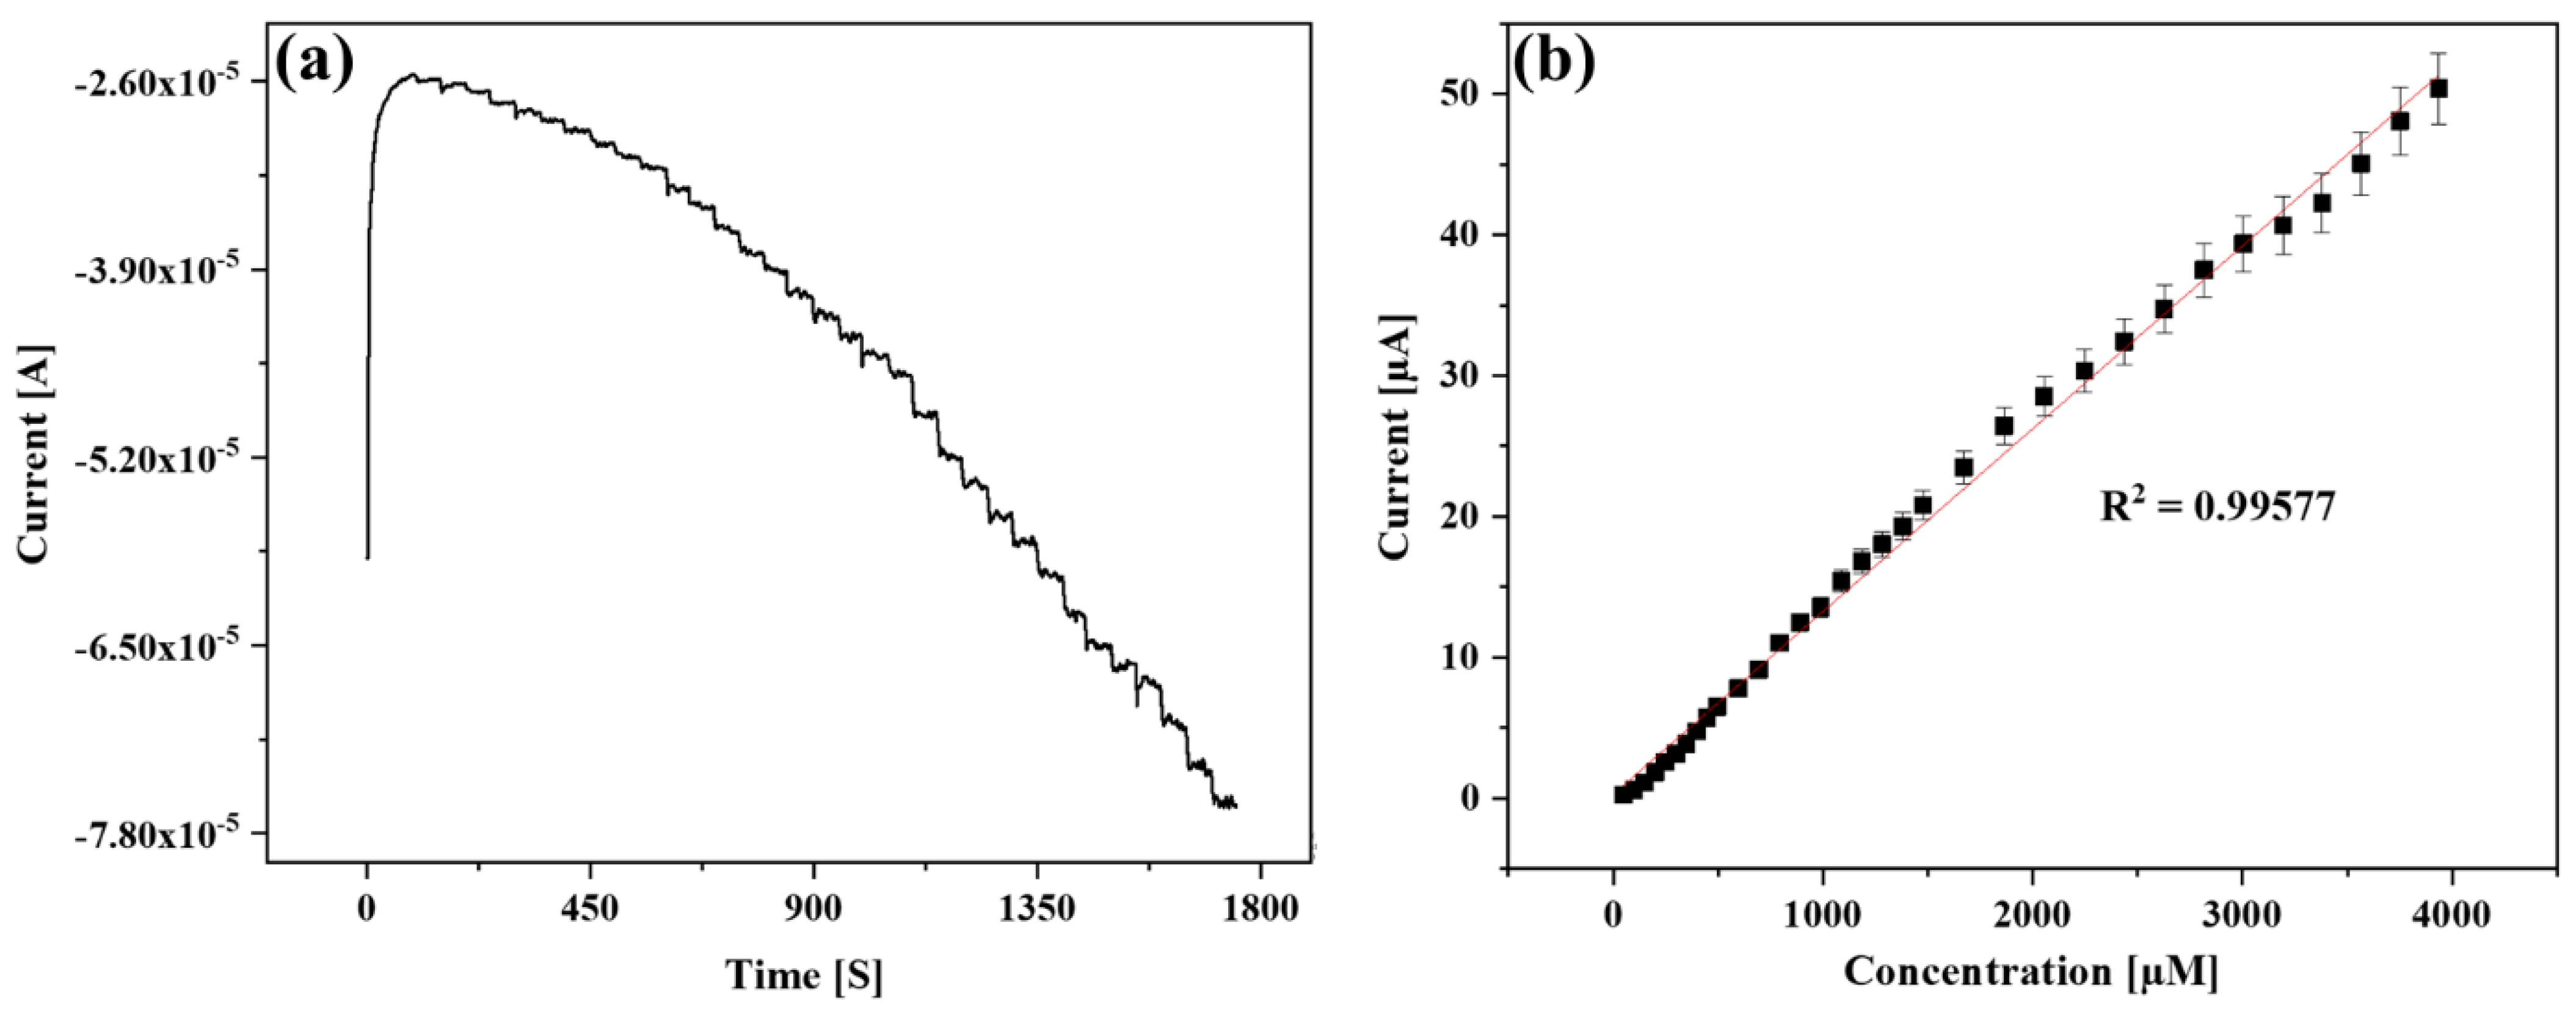
3.5. Amperometric Sensing of H2O2 Using the GCE/Au NPs/SnO2 NFs Composite

The sensitivity, detection range, and limit of the GCE/Au NPs/SnO2 NFs composite electrode were investigated using multiple-step chronoamperometry by continuously adding H2O2 to 0.1 M PBS (pH = 7.0) under stirring at −0.82 V. The current-time (i-t) curve is displayed in Figure 6a. The electrode displayed faster amperometric behavior and achieved a stable current (99%) within 6.5 s of adding 49.98 µM. This instantaneous response was attributed to the Au NPs because of their small conduction centers [62].
A calibration curve in Figure 6b depicts the relationship between the signal of the reduction current and the concentration of H2O2, where the current response was linear with a H2O2 addition from 49.98 µM to 3.93721 mM; thus, the linearity was from 49.98 µM to 3.93721 mM with a linear regression of 0.99577. The sensitivity calculated from the linear curve was found to be 14.157 µA/mM. The detection limit was estimated from the linearity curve by employing the following equation [63]:
L O D = 3 s b
where S is the standard deviation of the blank peak current and b is the slope of the calibration curve. The calculated LOD value was 6.67 µM. The reported sensing performances were all substantially higher than those of most sophisticated catalysts and even enzymes (Table 1).

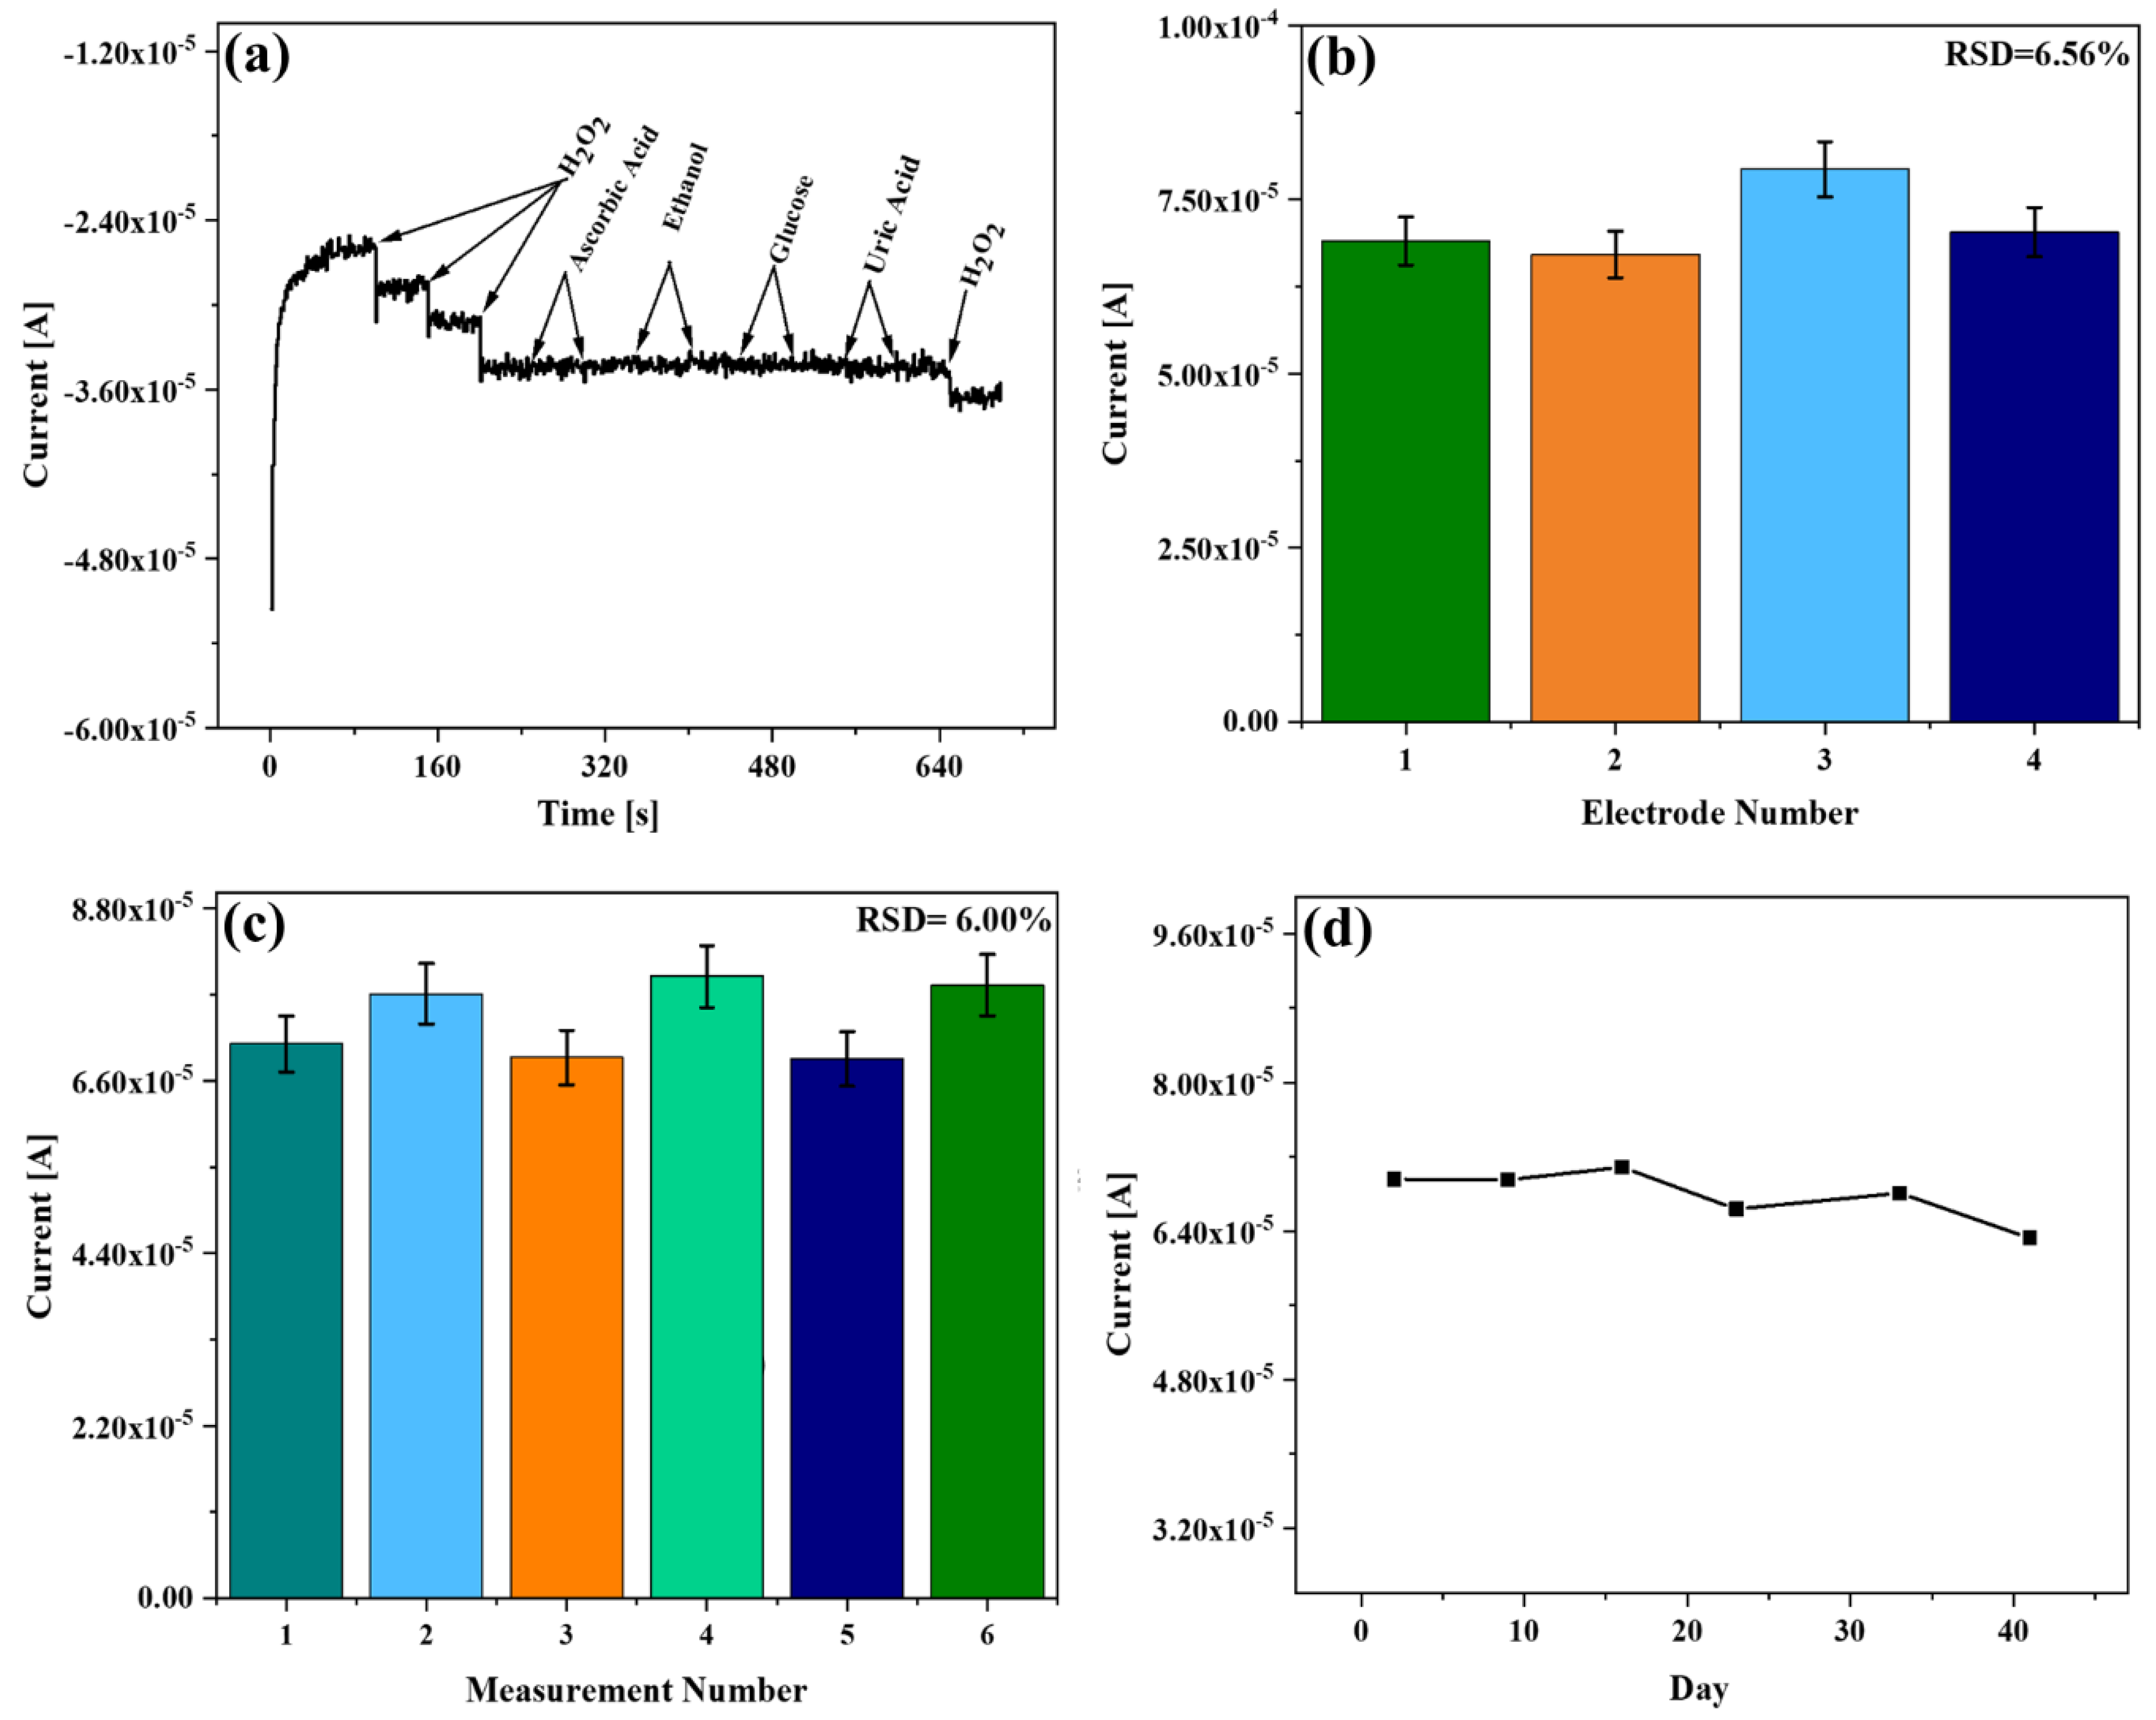
3.6. Study of Selectivity, Repeatability, Reproducibility, and Stability

The effects of interferences during sensing by the GCE/Au NPs/SnO2 NFs composite electrode were examined using multiple-step chronoamperometry at −0.82 V in 0.1 M PBS. The amperometric i-t curve plotted in Figure 7a showed no significant changes in the current signal with the addition of 400 and 800 µM of ascorbic acid and ethanol and 300 and 600 µM of glucose and uric acid. The addition of 100 µM of H2O2 was the only factor that changed the current response, and concentrations of interference that were four to eight times higher did not cause any apparent change. This demonstrates that the developed sensor had a strong selectivity for measuring H2O2. Four simultaneously-modified electrodes were used to assess the sensor repeatability in 5 mM of H2O2 through CV, as displayed in Figure 7b. All the modified electrodes had a negligible variation in the current change with an RSD value of 6.56%, which indicated a satisfactory reproducibility of the reported sensor.
The repeatability of the GCE/Au NPs/SnO2 NFs composite modified electrode was also investigated using CV as displayed in Figure 7c. The repeatability was examined using one electrode six times to reduce 5 mM of H2O2. The difference in the measured current was minimal, where the RSD was 6.00%. The developed GCE/Au NPs/SnO2 NFs sensor exhibited a much better reproducibility and repeatability value compared to other reported H2O2 sensors (Table 1) [81,82,83,84,85]. The stability of the GCE/Au NPs/SnO2 NFs composite electrode was examined by detecting 5 mM of H2O2 via CV and being kept at room temperature prior to the measurement. Figure 7d demonstrates that even after storage in air for up to 41 days, the sensor maintained roughly 90.2% of its initial current response. This is lower compared to the findings from a previous study, where the Au NPs-TiO2 NTs composite electrode was found to retain 96.4% of its initial current response for H2O2 up to 61 days [86]. This might have been because TiO2 has a more robust and crystalline structure than SnO2. Additionally, TiO2 has a higher resistance to degradation from environmental factors such as UV radiation and high temperatures, which can contribute to its stability.

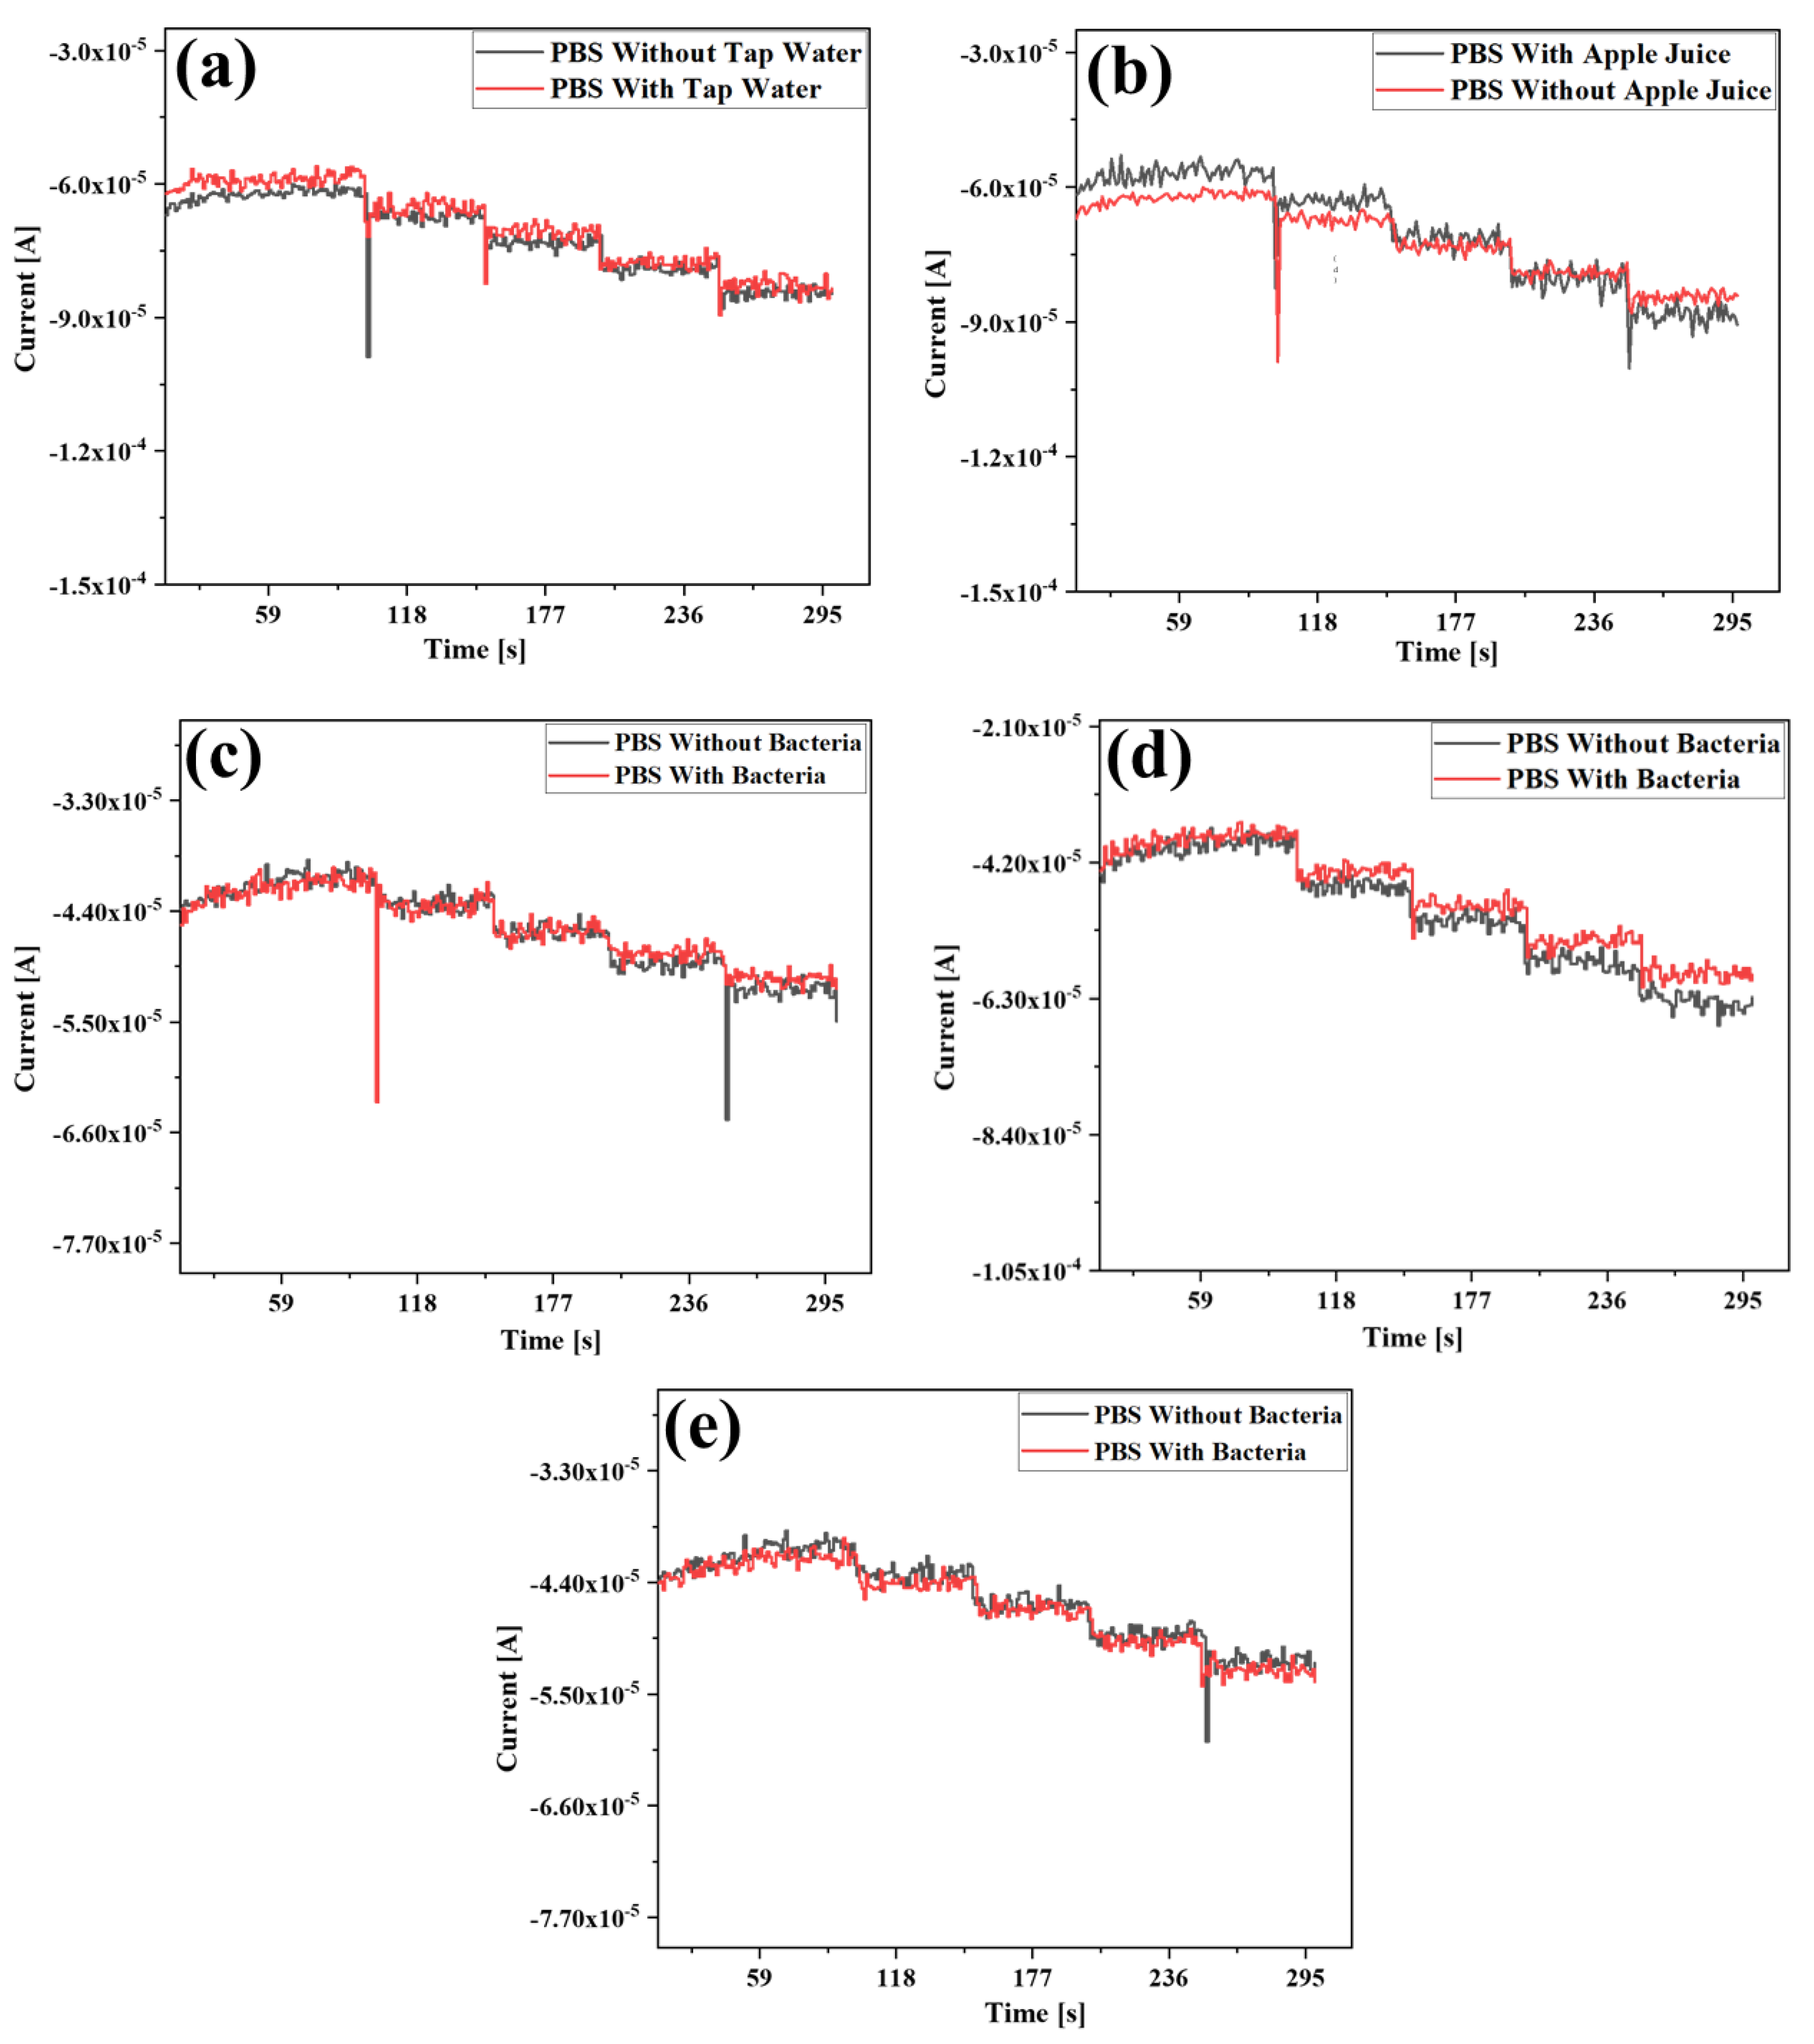
3.7. Electrochemical Detection of H2O2 in Practical Samples

The GCE/Au NPs/SnO2 NFs composite electrode was employed to detect H2O2 in tap water, apple juice, and bacteria samples containing 0.1 M PBS through multiple-step chronoamperometry at a potential of −0.82 V. The results presented in Figure 8a demonstrate the excellent detection performances of the sensor in tap water by adding 100 µM of H2O2. The recovery calculation tabulated in Table 2 displays a very good recovery of H2O2, ranging from 108.66% to 92.16%.
Figure 8b displays the electrode behavior towards H2O2 in an apple juice sample. The recovery percentage was 115.43% to 99.51% (Table 3). Three types of bacteria were used to assess the detection performance of the composite electrode in bacteria-containing samples. During the analysis, 200 μM of H2O2 was added to the electrolyte media. Figure 8c demonstrates the detection performances of the sensor on the L. plantarum collected from brown rice. The recovery calculation tabulated in Table 4 displays a recovery of H2O2 from 96.13% to 106.50%.
The GCE/Au NPs/SnO2 NFs composite electrode was also revealed to be very capable of detecting H2O2 in Bacillus subtilis, as shown in Figure 8d. The recovery calculation presented in Table 5 shows a very good recovery of H2O2 in the range of 99.57% to 96.66%. Similar to the other two bacteria, the composite electrode displayed a similar degree of recovery of H2O2 in the E. coli. The detail calculations are presented in Figure 8e and Table 6.
A real sample analysis of the GCE/Au NPs/SnO2 NFs composite electrodes using five different real samples showed similar trends during the H2O2 detection. This indicates that this real sample did not significantly affect the conductivity and resistance of the electrode. The bacteria were prepared in two different ways to be used in the real sample analysis, and the sensor showed similar recoveries in both cases, suggesting the versatility of the sensor. In a nutshell, SnO2 NFs spontaneously enhanced the sensing response of the Au NPs, maintained their electroactivity for a significant length of time, and opened the window to detect H2O2 in various matrices. The above-discussed H2O2 detection performances of Au NPs/SnO2 NFs using the real samples and an experimental results comparison (Table 1) reveals their possible application for assessing food quality.

4. Conclusions

This study reported that the SnO2 NFs-supported nonenzymatic Au NPs sensor demonstrated an improved sensing performance and showed potential as a promising alternative to natural enzyme-based sensors in detecting H2O2. The catalytically-active smaller Au NPs were coated on GCE and SnO2 NFs to detect H2O2 electrochemically. The catalytic activity was found to be more distinct in smaller Au NPs compared to larger ones. The fiber-like SnO2 helps to increase the catalytic activity of Au NPs and retains it for a more extended period, resulting in higher sensing performances in different matrices. Furthermore, these nanomaterial composites-based nonenzymatic sensors can open up a new market opportunity as an alternative to natural enzymes.

Author Contributions

Conceptualization, A.K.M.K. and N.S.A.; methodology, N.S.A. and M.A.K.; validation, N.S.A., M.S.H. and A.K.M.K.; formal analysis, M.A.K.; investigation, M.A.K. and M.F.B.M.; resources, N.S.A.; data curation, M.A.K. and M.S.H.; writing—original draft preparation, M.A.K.; writing—review and editing, M.S.H., N.S.A., C.S.T., A.N.M.R., M.F.B.M. and A.K.M.K.; visualization, M.A.K.; supervision, N.S.A.; project administration, N.S.A. and A.K.M.K.; funding acquisition, N.S.A., C.S.T. and M.S.H. All authors have read and agreed to the published version of the manuscript.

Funding

The authors would like to thank the Ministry of Higher Education for providing financial support under Fundamental Research Grant Scheme (FRGS) No. FRGS/1/2019/STG05/UMP/ 02/8 (University reference RDU1901189) and Universiti Malaysia Pahang for laboratory facilities as well as additional financial support under the Postgraduate Research Grant Scheme PGRS 2003114. A special thanks to Glycobio International Sdn Bhd for providing the lyophilized bacteria sample.

Institutional Review Board Statement

Not applicable.

Informed Consent Statement

Not applicable.

Data Availability Statement

Not applicable.

Acknowledgments

The authors are highly thankful to Glycobio International Sdn. Bhd. for providing bacteria. We are also grateful to Long Chiau Ming, Sunway University, Malaysia, for his kind guidance.

Conflicts of Interest

The authors declare no conflict of interest. The funders had no role in the design of the study; in the collection, analyses, or interpretation of data; in the writing of the manuscript; or in the decision to publish the results.

References

  1. Jiménez, M.J.; Lissarrague, M.S.; Bechthold, P.; González, E.A.; Jasen, P.V.; Juan, A. Ethanol adsorption on Ni doped Mo2C(001): A theoretical study. Top. Catal. 2022, 65, 839–847. [Google Scholar] [CrossRef]
  2. Hyslop, P.A.; Chaney, M.O. Mechanism of GAPDH Redox Signaling by H2O2 Activation of a Two-Cysteine Switch. Int. J. Mol. Sci. 2022, 23, 4604. [Google Scholar] [CrossRef] [PubMed]
  3. Ghanam, A.; Mohammadi, H.; Amine, A.; Haddour, N.; Buret, F. Chemical Sensors: Voltammetric and Amperometric Electrochemical Sensors. In Encyclopedia of Sensors and Biosensors; Narayan, R., Ed.; Elsevier: Oxford, UK, 2023; pp. 161–177. [Google Scholar]
  4. Watt, B.E.; Proudfoot, A.T.; Vale, J.A. Hydrogen Peroxide Poisoning. Toxicol. Rev. 2004, 23, 51–57. [Google Scholar] [CrossRef]
  5. Raffellini, S.; Schenk, M.; Guerrero, S.; Alzamora, S.M. Kinetics of Escherichia coli inactivation employing hydrogen peroxide at varying temperatures, pH and concentrations. Food Control 2011, 22, 920–932. [Google Scholar] [CrossRef]
  6. Swieca, M. Production of ready-to-eat lentil sprouts with improved antioxidant capacity: Optimization of elicitation conditions with hydrogen peroxide. Food Chem. 2015, 180, 219–226. [Google Scholar] [CrossRef]
  7. Khadhraoui, H.; Othmani, A.; Kouki, A.; Zouaoui, M. A Highly Sensitive and Selective Non-enzymatic Hydrogen Peroxide Sensor Based on Nanostructured Co3O4 Thin Films Using the Sol-gel Method. Electroanalysis 2020, 33, 152–159. [Google Scholar] [CrossRef]
  8. Luna-Guevara, J.J.; Arenas-Hernandez, M.M.P.; Martinez de la Pena, C.; Silva, J.L.; Luna-Guevara, M.L. The Role of Pathogenic E. coli in Fresh Vegetables: Behavior, Contamination Factors, and Preventive Measures. Int. J. Microbiol. 2019, 2019, 2894328. [Google Scholar] [CrossRef]
  9. Ravindra Kumar, S.; Imlay, J.A. How Escherichia coli tolerates profuse hydrogen peroxide formation by a catabolic pathway. J. Bacteriol. 2013, 195, 4569–4579. [Google Scholar] [CrossRef]
  10. Arasu, M.V.; Al-Dhabi, N.A.; Ilavenil, S.; Choi, K.C.; Srigopalram, S. In vitro importance of probiotic Lactobacillus plantarum related to medical field. Saudi J. Biol. Sci. 2016, 23, S6–S10. [Google Scholar] [CrossRef] [PubMed]
  11. Cornacchione, L.P.; Hu, L.T. Hydrogen peroxide-producing pyruvate oxidase from Lactobacillus delbrueckii is catalytically activated by phosphotidylethanolamine. BMC Microbiol. 2020, 20, 128. [Google Scholar] [CrossRef]
  12. Wen, F.; He, T.Y.Y.; Liu, H.C.; Chen, H.Y.; Zhang, T.; Lee, C.K. Advances in chemical sensing technology for enabling the next-generation self-sustainable integrated wearable system in the IoT era. Nano Energy 2020, 78, 105155. [Google Scholar] [CrossRef]
  13. Simões, F.R.; Xavier, M.G. Electrochemical Sensors. In Nanoscience and Its Applications; Da Róz, A.L., Ferreira, M., de Lima Leite, F., Oliveira, O.N., Eds.; William Andrew Publishing: Norwich, NY, USA, 2017; pp. 155–178. [Google Scholar]
  14. Clark, L.C., Jr.; Lyons, C. Electrode systems for continuous monitoring in cardiovascular surgery. Ann. N. Y. Acad. Sci. 1962, 102, 29–45. [Google Scholar] [CrossRef] [PubMed]
  15. Zhang, H.; Zhang, Y.; Liu, S. Preparation of Trace Fe2P Modified N,P Co-doped Carbon Materials and their Application to Hydrogen Peroxide Detection. Electroanalysis 2020, 33, 831–837. [Google Scholar] [CrossRef]
  16. Cheng, D.; Li, P.P.; Zhu, X.H.; Liu, M.L.; Zhang, Y.Y.; Liu, Y. Enzyme-free Electrochemical Detection of Hydrogen Peroxide Based on the Three-Dimensional Flower-like Cu-based Metal Organic Frameworks and MXene Nanosheets. Chin. J. Chem. 2021, 39, 2181–2187. [Google Scholar] [CrossRef]
  17. Zuccarello, L.; Barbosa, C.; Todorovic, S.; Silveira, C.M. Electrocatalysis by Heme Enzymes-Applications in Biosensing. Catalysts 2021, 11, 218. [Google Scholar] [CrossRef]
  18. Ding, S.; Lyu, Z.; Fang, L.; Li, T.; Zhu, W.; Li, S.; Li, X.; Li, J.C.; Du, D.; Lin, Y. Single-Atomic Site Catalyst with Heme Enzymes-Like Active Sites for Electrochemical Sensing of Hydrogen Peroxide. Small 2021, 17, e2100664. [Google Scholar] [CrossRef]
  19. Hu, F.X.; Kang, Y.J.; Du, F.; Zhu, L.; Xue, Y.H.; Chen, T.; Dai, L.M.; Li, C.M. Living Cells Directly Growing on a DNA/Mn3(PO4)2-Immobilized and Vertically Aligned CNT Array as a Free-Standing Hybrid Film for Highly Sensitive In Situ Detection of Released Superoxide Anions. Adv. Funct. Mater. 2015, 25, 5924–5932. [Google Scholar] [CrossRef]
  20. Dhara, K.; Mahapatra, D.R. Recent advances in electrochemical nonenzymatic hydrogen peroxide sensors based on nanomaterials: A review. J. Mater. Sci. 2019, 54, 12319–12357. [Google Scholar] [CrossRef]
  21. Chen, W.; Cai, S.; Ren, Q.Q.; Wen, W.; Zhao, Y.D. Recent advances in electrochemical sensing for hydrogen peroxide: A review. Analyst 2012, 137, 49–58. [Google Scholar] [CrossRef] [PubMed]
  22. Liu, H.; Weng, L.; Yang, C. A review on nanomaterial-based electrochemical sensors for H2O2, H2S and NO inside cells or released by cells. Microchim. Acta 2017, 184, 1267–1283. [Google Scholar] [CrossRef]
  23. Wang, P.; Lin, Z.; Su, X.; Tang, Z. Application of Au based nanomaterials in analytical science. Nano Today 2017, 12, 64–97. [Google Scholar] [CrossRef]
  24. Xiao, T.; Huang, J.; Wang, D.; Meng, T.; Yang, X. Au and Au-Based nanomaterials: Synthesis and recent progress in electrochemical sensor applications. Talanta 2020, 206, 120210. [Google Scholar] [CrossRef] [PubMed]
  25. Lou-Franco, J.; Das, B.; Elliott, C.; Cao, C. Gold Nanozymes: From Concept to Biomedical Applications. Nano-Micro Lett. 2020, 13, 10. [Google Scholar] [CrossRef] [PubMed]
  26. Dinu, L.; Pogacean, F.; Kurbanoglu, S.; Barbu-Tudoran, L.; Serban, A.; Kacso, I.; Pruneanu, S. Graphene-Gold Nanoparticles Nanozyme-Based Electrochemical Sensor with Enhanced Laccase-Like Activity for Determination of Phenolic Substrates. J. Electrochem. Soc. 2021, 168, 067523. [Google Scholar] [CrossRef]
  27. Berbeć, S.; Żołądek, S.; Jabłońska, A.; Pałys, B. Electrochemically reduced graphene oxide on gold nanoparticles modified with a polyoxomolybdate film. Highly sensitive non-enzymatic electrochemical detection of H2O2. Sens. Actuators B Chem. 2018, 258, 745–756. [Google Scholar] [CrossRef]
  28. Qi, Y.; Ma, J.; Xiu, F.-R.; Gao, X. Determination of Cr(VI) based on the peroxidase mimetic catalytic activity of citrate-capped gold nanoparticles. Microchim. Acta 2021, 188, 273. [Google Scholar] [CrossRef]
  29. Zhang, G. Functional gold nanoparticles for sensing applications. Nanotechnol. Rev. 2013, 2, 269–288. [Google Scholar] [CrossRef]
  30. He, Q.R.; Sun, H.; Shang, Y.X.; Tang, Y.N.; She, P.; Zeng, S.; Xu, K.L.; Lu, G.L.; Liang, S.; Yin, S.Y.; et al. Au@TiO2 yolk-shell nanostructures for enhanced performance in both photoelectric and photocatalytic solar conversion. Appl. Surf. Sci. 2018, 441, 458–465. [Google Scholar] [CrossRef]
  31. Zheng, N.; Stucky, G.D. A general synthetic strategy for oxide-supported metal nanoparticle catalysts. J. Am. Chem. Soc. 2006, 128, 14278–14280. [Google Scholar] [CrossRef]
  32. Wang, Q.; Zhang, X.; Chai, X.; Wang, T.; Cao, T.; Li, Y.; Zhang, L.; Fan, F.; Fu, Y.; Qi, W. An Electrochemical Sensor for H2O2 Based on Au Nanoparticles Embedded in UiO-66 Metal–Organic Framework Films. ACS Appl. Nano Mater. 2021, 4, 6103–6110. [Google Scholar] [CrossRef]
  33. Wang, K.; Li, J.; Li, W.; Wei, W.; Zhang, H.; Wang, L.L. Highly Active Co-Based Catalyst in Nanofiber Matrix as Advanced Sensing Layer for High Selectivity of Flexible Sensing Device. Adv. Mater. Technol.-Us 2019, 4, 1800521. [Google Scholar] [CrossRef]
  34. Wang, L.; Chai, R.; Lou, Z.; Shen, G. Highly sensitive hybrid nanofiber-based room-temperature CO sensors: Experiments and density functional theory simulations. Nano Res. 2018, 11, 1029–1037. [Google Scholar] [CrossRef]
  35. Wang, L.; Chen, S.; Li, W.; Wang, K.; Lou, Z.; Shen, G. Grain-Boundary-Induced Drastic Sensing Performance Enhancement of Polycrystalline-Microwire Printed Gas Sensors. Adv. Mater. 2019, 31, e1804583. [Google Scholar] [CrossRef]
  36. Horne, J.; McLoughlin, L.; Bridgers, B.; Wujcik, E.K.J.S.; Reports, A. Recent developments in nanofiber-based sensors for disease detection, immunosensing, and monitoring. Sens. Actuators Rep. 2020, 2, 100005. [Google Scholar] [CrossRef]
  37. Alim, S.; Kafi, A.K.M.; Rajan, J.; Yusoff, M.M. Application of polymerized multiporous nanofiber of SnO2 for designing a bienzyme glucose biosensor based on HRP/GOx. Int. J. Biol. Macromol. 2019, 123, 1028–1034. [Google Scholar] [CrossRef] [PubMed]
  38. Wang, R.; Di, J.; Ma, J.; Ma, Z. Highly sensitive detection of cancer cells by electrochemical impedance spectroscopy. J Electrochim. Acta 2012, 61, 179–184. [Google Scholar] [CrossRef]
  39. Kafi, A.K.M.; Wali, Q.; Jose, R.; Biswas, T.; Yusoff, M. A glassy carbon electrode modified with SnO2 nanofibers, polyaniline and hemoglobin for improved amperometric sensing of hydrogen peroxide. Microchim. Acta 2017, 184, 4443–4450. [Google Scholar] [CrossRef]
  40. Sophia, J.; Muralidharan, G. Gold nanoparticles for sensitive detection of hydrogen peroxide: A simple non-enzymatic approach. J. Appl. Electrochem. 2015, 45, 963–971. [Google Scholar] [CrossRef]
  41. Hu, M.; Chen, J.; Li, Z.-Y.; Au, L.; Hartland, G.V.; Li, X.; Marquez, M.; Xia, Y. Gold nanostructures: Engineering their plasmonic properties for biomedical applications. Chem. Soc. Rev. 2006, 35, 1084–1094. [Google Scholar] [CrossRef]
  42. Amendola, V.; Meneghetti, M. Size Evaluation of Gold Nanoparticles by UV−vis Spectroscopy. J. Phys. Chem. C 2009, 113, 4277–4285. [Google Scholar] [CrossRef]
  43. Suchomel, P.; Kvitek, L.; Prucek, R.; Panacek, A.; Halder, A.; Vajda, S.; Zboril, R. Simple size-controlled synthesis of Au nanoparticles and their size-dependent catalytic activity. Sci. Rep. 2018, 8, 4589. [Google Scholar] [CrossRef]
  44. Zhou, X.; Xu, W.; Liu, G.; Panda, D.; Chen, P. Size-Dependent Catalytic Activity and Dynamics of Gold Nanoparticles at the Single-Molecule Level. J. Am. Chem. Soc. 2010, 132, 138–146. [Google Scholar] [CrossRef]
  45. Wali, Q.; Fakharuddin, A.; Ahmed, I.; Ab Rahim, M.H.; Ismail, J.; Jose, R. Multiporous nanofibers of SnO2 by electrospinning for high efficiency dye-sensitized solar cells. J. Mater. Chem. A 2014, 2, 17427–17434. [Google Scholar] [CrossRef]
  46. Babu, B.; Koutavarapu, R.; Harish, V.V.N.; Shim, J.; Yoo, K. Novel in-situ synthesis of Au/SnO2 quantum dots for enhanced visible-light-driven photocatalytic applications. Ceram. Int. 2019, 45, 5743–5750. [Google Scholar] [CrossRef]
  47. Wang, L.; Dou, H.; Lou, Z.; Zhang, T. Encapsuled nanoreactors (Au@SnO2): A new sensing material for chemical sensors. Nanoscale 2013, 5, 2686–2691. [Google Scholar] [CrossRef]
  48. Duan, C.Q.; Bai, W.S.; Zheng, J.B. Non-enzymatic sensors based on a glassy carbon electrode modified with Au nanoparticles/polyaniline/SnO2 fibrous nanocomposites for nitrite sensing. New J. Chem. 2018, 42, 11516–11524. [Google Scholar] [CrossRef]
  49. Guo, J.; Zhang, J.; Gong, H.; Ju, D.; Cao, B. Au nanoparticle-functionalized 3D SnO2 microstructures for high performance gas sensor. Sens. Actuators B Chem. 2016, 226, 266–272. [Google Scholar] [CrossRef]
  50. Tripathy, S.K.; Mishra, A.; Jha, S.K.; Wahab, R.; Al-Khedhairy, A.A. Synthesis of thermally stable monodispersed Au@SnO2 core–shell structure nanoparticles by a sonochemical technique for detection and degradation of acetaldehyde. Anal. Methods 2013, 5, 1456–1462. [Google Scholar] [CrossRef]
  51. Zhu, Y.; Lu, S.; Gowri Manohari, A.; Dong, X.; Chen, F.; Xu, W.; Shi, Z.; Xu, C. Polydopamine interconnected graphene quantum dots and gold nanoparticles for enzymeless H2O2 detection. J. Electroanal. Chem. 2017, 796, 75–81. [Google Scholar] [CrossRef]
  52. Naseri, A.; Hormozi-Nezhad, M.R.; Shahrokhian, S.; Asadian, E. Silver nanowires immobilized on gold-modified glassy carbon electrode for electrochemical quantification of atorvastatin. J. Electroanal. Chem. 2020, 876, 114540. [Google Scholar] [CrossRef]
  53. Honeychurch, K. Trace Voltammetric Determination of Lead at a Recycled Battery Carbon Rod Electrode. Sensors 2019, 19, 770. [Google Scholar] [CrossRef]
  54. Ni, X.; Tian, M.; Sun, J.; Chen, X. A Novel Nonenzymatic Hydrogen Peroxide Sensor Based on Magnetic Core-Shell Fe3O4@C/Au Nanoparticle Nanocomposite. Int. J. Anal. Chem. 2021, 2021, 8839895. [Google Scholar] [CrossRef] [PubMed]
  55. Simioni, N.B.; Silva, T.A.; Oliveira, G.G.; Fatibello-Filho, O. A nanodiamond-based electrochemical sensor for the determination of pyrazinamide antibiotic. Sens. Actuators B Chem. 2017, 250, 315–323. [Google Scholar] [CrossRef]
  56. Karikalan, N.; Karthik, R.; Chen, S.-M.; Velmurugan, M.; Karuppiah, C. Electrochemical properties of the acetaminophen on the screen printed carbon electrode towards the high performance practical sensor applications. J. Colloid Interface Sci. 2016, 483, 109–117. [Google Scholar] [CrossRef] [PubMed]
  57. Ma, C.Y.; Yang, C.K.; Zhang, M.R. A Novel Electrochemical Hydrogen Peroxide Sensor Based on AuNPs/n-Type GaN Electrode. Chem. Lett. 2020, 49, 656–658. [Google Scholar] [CrossRef]
  58. Patella, B.; Buscetta, M.; Di Vincenzo, S.; Ferraro, M.; Aiello, G.; Sunseri, C.; Pace, E.; Inguanta, R.; Cipollina, C. Electrochemical sensor based on rGO/Au nanoparticles for monitoring H2O2 released by human macrophages. Sens. Actuat. B-Chem. 2021, 327, 128901. [Google Scholar] [CrossRef]
  59. Teker, M.S.; Karaca, E.; Pekmez, N.O.; Tamer, U.; Pekmez, K. An Enzyme-free H2O2 Sensor Based on Poly(2-Aminophenylbenzimidazole)/Gold Nanoparticles Coated Pencil Graphite Electrode. Electroanalysis 2019, 31, 75–82. [Google Scholar] [CrossRef]
  60. Yang, Z.; Li, J.; Liu, P.; Zhang, A.; Wang, J.; Huang, Y.; Wang, J.; Wang, Z. Highly sensitive non-enzymatic hydrogen peroxide monitoring platform based on nanoporous gold via a modified solid-phase reaction method. RSC Adv. 2021, 11, 36753–36759. [Google Scholar] [CrossRef] [PubMed]
  61. Du, X.; Chen, Y.; Dong, W.; Han, B.; Liu, M.; Chen, Q.; Zhou, J. A nanocomposite-based electrochemical sensor for non-enzymatic detection of hydrogen peroxide. Oncotarget 2017, 8, 13039–13047. [Google Scholar] [CrossRef]
  62. Bharathi, S.; Nogami, M.; Ikeda, S. Novel Electrochemical Interfaces with a Tunable Kinetic Barrier by Self-Assembling Organically Modified Silica Gel and Gold Nanoparticles. Langmuir 2001, 17, 1–4. [Google Scholar] [CrossRef]
  63. Elewi, A.S.; Al-Shammaree, S.A.W.; Al Sammarraie, A.K.M.A. Hydrogen peroxide biosensor based on hemoglobin-modified gold nanoparticles–screen printed carbon electrode. Sens. Bio-Sens. Res. 2020, 28, 100340. [Google Scholar] [CrossRef]
  64. Rao Vusa, C.S.; Manju, V.; Berchmans, S.; Arumugam, P. Electrochemical amination of graphene using nanosized PAMAM dendrimers for sensing applications. RSC Adv. 2016, 6, 33409–33418. [Google Scholar] [CrossRef]
  65. Xie, H.; Luo, G.; Niu, Y.; Weng, W.; Zhao, Y.; Ling, Z.; Ruan, C.; Li, G.; Sun, W. Synthesis and utilization of Co3O4 doped carbon nanofiber for fabrication of hemoglobin-based electrochemical sensor. Mater. Sci. Eng. C 2020, 107, 110209. [Google Scholar] [CrossRef]
  66. Asif, S.A.B.; Khan, S.B.; Asiri, A.M. Electrochemical sensor for H2O2 using a glassy carbon electrode modified with a nanocomposite consisting of graphene oxide, cobalt(III) oxide, horseradish peroxidase and nafion. Microchim. Acta 2016, 183, 3043–3052. [Google Scholar] [CrossRef]
  67. Lee, Y.J.; Park, J.Y.; Kim, Y.; Ko, J.W. Amperometric sensing of hydrogen peroxide via highly roughened macroporous Gold-/Platinum nanoparticles electrode. Curr. Appl. Phys. 2011, 11, 211–216. [Google Scholar] [CrossRef]
  68. Tomassetti, M.; Leonardi, C.; Pezzilli, R.; Prestopino, G.; Di Natale, C.; Medaglia, P.G. New Voltammetric Sensor Based on LDH and H2O2 for L-Proline Determination in Red and White Wines. Crystals 2022, 12, 1474. [Google Scholar] [CrossRef]
  69. Mazzotta, E.; Di Giulio, T.; Mastronardi, V.; Pompa, P.P.; Moglianetti, M.; Malitesta, C. Bare Platinum Nanoparticles Deposited on Glassy Carbon Electrodes for Electrocatalytic Detection of Hydrogen Peroxide. ACS Appl. Nano Mater. 2021, 4, 7650–7662. [Google Scholar] [CrossRef]
  70. Rashed, M.A.; Ahmed, J.; Faisal, M.; Alsareii, S.A.; Jalalah, M.; Tirth, V.; Harraz, F.A. Surface modification of CuO nanoparticles with conducting polythiophene as a non-enzymatic amperometric sensor for sensitive and selective determination of hydrogen peroxide. Surf. Interfaces 2022, 31, 101998. [Google Scholar] [CrossRef]
  71. Hu, J.; Zhang, C.; Li, X.; Du, X. An Electrochemical Sensor Based on Chalcogenide Molybdenum Disulfide-Gold-Silver Nanocomposite for Detection of Hydrogen Peroxide Released by Cancer Cells. Sensors 2020, 20, 6817. [Google Scholar] [CrossRef] [PubMed]
  72. Xu, M.Y.; Wu, Q.; Wei, W.; Liu, X.Y.; Li, X.J. Preparation and electrochemical application of an AgNW/graphene/SU-8 composite conductive photoresist. J. Appl. Polym. Sci. 2021, 138, 51205. [Google Scholar] [CrossRef]
  73. Lete, C.; Spinciu, A.M.; Alexandru, M.G.; Moreno, J.C.; Leau, S.A.; Marin, M.; Visinescu, D. Copper(II) Oxide Nanoparticles Embedded within a PEDOT Matrix for Hydrogen Peroxide Electrochemical Sensing. Sensors 2022, 22, 8252. [Google Scholar] [CrossRef] [PubMed]
  74. Rashed, M.A.; Harraz, F.A.; Faisal, M.; El-Toni, A.M.; Alsaiari, M.; Al-Assiri, M.S. Gold nanoparticles plated porous silicon nanopowder for nonenzymatic voltammetric detection of hydrogen peroxide. Anal. Biochem. 2021, 615, 114065. [Google Scholar] [CrossRef] [PubMed]
  75. Elancheziyan, M.; Theyagarajan, K.; Saravanakumar, D.; Thenmozhi, K.; Senthilkumar, S. Viologen-terminated polyamidoamine (PAMAM) dendrimer encapsulated with gold nanoparticles for nonenzymatic determination of hydrogen peroxide. Mater. Today Chem. 2020, 16, 100274. [Google Scholar] [CrossRef]
  76. Divya, P.M.; Roopa, B.S.; Manusha, C.; Balannara, P. A concise review on oil extraction methods, nutritional and therapeutic role of coconut products. J. Food Sci. Tech. Mys. 2022, 33, 8576. [Google Scholar] [CrossRef] [PubMed]
  77. Wang, J.; Zhou, Y.; Zeng, M.; Zhao, Y.; Zuo, X.; Meng, F.; Lv, F.; Lu, Y. Zr(IV)-based metal-organic framework nanocomposites with enhanced peroxidase-like activity as a colorimetric sensing platform for sensitive detection of hydrogen peroxide and phenol. Environ. Res. 2022, 203, 111818. [Google Scholar] [CrossRef]
  78. Ullah, R.; Rasheed, M.A.; Abbas, S.; Rehman, K.U.; Shah, A.; Ullah, K.; Khan, Y.; Bibi, M.; Ahmad, M.; Ali, G. Electrochemical sensing of H2O2 using cobalt oxide modified TiO2 nanotubes. Curr. Appl. Phys. 2022, 38, 40–48. [Google Scholar] [CrossRef]
  79. Mohammad, A.; Zamzami, M.A. Construction of carbon cloth modified-Al2O3-g-C3N4 sensor for non-enzymatic electrochemical detection of hydrogen peroxide. Diam. Relat. Mater. 2023, 132, 109600. [Google Scholar] [CrossRef]
  80. Liu, Y.H.; Cui, L.P.; Yu, K.; Wang, M.L.; Ma, Y.J.; Lv, J.H.; Liu, X.Z.; Zhou, B.B. The reduced phosphomolybdate as dual-functional electrocatalyst and electrochemical sensor for detecting hydrogen peroxide and dopamine. J. Solid State Chem. 2022, 312, 123209. [Google Scholar] [CrossRef]
  81. Hooch Antink, W.; Choi, Y.; Seong, K.-d.; Piao, Y. Simple synthesis of CuO/Ag nanocomposite electrode using precursor ink for non-enzymatic electrochemical hydrogen peroxide sensing. Sens. Actuators B Chem. 2018, 255, 1995–2001. [Google Scholar] [CrossRef]
  82. Mathew, M.; Sandhyarani, N. A novel electrochemical sensor surface for the detection of hydrogen peroxide using cyclic bisureas/gold nanoparticle composite. Biosens. Bioelectron. 2011, 28, 210–215. [Google Scholar] [CrossRef]
  83. Ma, J.; Zheng, J. Voltammetric determination of hydrogen peroxide using AuCu nanoparticles attached on polypyrrole-modified 2D metal-organic framework nanosheets. Microchim. Acta 2020, 187, 389. [Google Scholar] [CrossRef] [PubMed]
  84. Ma, X.; Tang, K.-l.; Lu, K.; Zhang, C.; Shi, W.; Zhao, W. Structural Engineering of Hollow Microflower-like CuS@C Hybrids as Versatile Electrochemical Sensing Platform for Highly Sensitive Hydrogen Peroxide and Hydrazine Detection. ACS Appl. Mater. Interfaces 2021, 13, 40942–40952. [Google Scholar] [CrossRef] [PubMed]
  85. Płócienniczak, P.; Rębiś, T.; Nowicki, M.; Milczarek, G. A green approach for hybrid material preparation based on carbon nanotubes/lignosulfonate decorated with silver nanostructures for electrocatalytic sensing of H2O2. J. Electroanal. Chem. 2021, 880, 114896. [Google Scholar] [CrossRef]
  86. Kader, M.A.; Azmi, N.S.; Kafi, A.K.M.; Hossain, M.S.; Jose, R.; Goh, K.W. Ultrasensitive Nonenzymatic Real-Time Hydrogen Peroxide Monitoring Using Gold Nanoparticles Decorated Titanium Dioxide Nanotube Electrodes. Biosensors 2023, 2071464. [Google Scholar]
Figure 1. (a) TEM image of Au NPs at 150,000× magnifications; (b) UV-Vis analysis of Au NPs; FESEM images of SnO2 nanofibers. (c) ×20,000 and (d) ×50,000 magnifications.
Chemosensors 11 00130 g001
Figure 2. Au NPs–SnO2 NFs composite under TEM analysis (a) ×5000, and (b) ×50,000.
Chemosensors 11 00130 g002
Figure 3. XRD Patterns of Au NPs/SnO2 NFs composite.
Chemosensors 11 00130 g003
Figure 4. (a) CV study of GCE, SnO2 NFs, Au NPs, and Au NPs/SnO2 NFs composite electrode in 0.1 M PBS (pH = 7.0) in the absence of H2O2 at a 17 mV/s scan rate; (b) CV study of Au NPs–SnO2 NFs composite electrode without H2O2 in 0.1 M PBS (pH = 7.0) at various scan rates; (c) corresponding linear plots of the cathodic peak current versus the scan rate; (d) CV study of Au NPs–SnO2 NFs composite electrode in the presence of varied H2O2 concentrations in a 0.1 M PBS (pH = 7.0) solution at 17 mV/s.
Chemosensors 11 00130 g004
Figure 5. CV-based identification of (a) a suitable Au NPs amount with 3 mM of H2O2; (b) a suitable electrolyte media; (c) a suitable pH; (d) the corresponding reduction peak vs. pH curve; (e) a suitable PBS (pH 7) concentration in the presence of 5 mM of H2O2 at a 17 mV/s at scan rate; (f) a suitable amperometric reduction potential by adding 50 µM of H2O2 in 0.1 M PBS (pH 7.0).
Chemosensors 11 00130 g005
Figure 6. (a) Amperometry analysis curve of GCE/Au NPs/SnO2 NFs composite electrode with continuous addition of H2O2 in PBS (pH 7.0) at the potential of −0.82 V; (b) corresponding current vs. concentration calibration plots.
Chemosensors 11 00130 g006
Figure 7. (a) Selectivity study of Au NPs/SnO2 NFs composite electrode exposed to H2O2, ascorbic acid, ethanol, glucose, and uric acid in 0.1 M PBS (pH 7.0) at E = −0.82 V; (b) CV-based reproducibility study; (c) repeatability study of the Au NPs/SnO2 NFs composite electrodes in 0.1 M PBS at a 17 mV/s scan rate containing 5 mM of H2O2; (d) CV based response stability study of Au NPs/SnO2 NFs composite electrode with 5 mM of H2O2 in 0.1 M PBS at 17 mV/s.
Chemosensors 11 00130 g007
Figure 8. Amperometric responses of Au NPs/SnO2 NFs composite electrode upon the addition of 100 μM of H2O2 in electrolyte media containing (a) tap water; (b) apple juice; and upon stepwise addition of 200 μM of H2O2 in electrolyte media containing (c) L. plantarum; (d) B. subtilis; and (e) E. coli, respectively.
Chemosensors 11 00130 g008
Table 1. Sensor performance comparison.
Electrode MaterialsLinear RangeDetection Limit
(µM)
Stability
(Days)
Ref.
GCE/Au NPs–SnO2 NFs composites49.98–3937.21 µM6.67 µM41Current study
GCE/CtRGO/PAMAM/GA/HRP50–800 μM29.86 μM33[64]
Nafion/Hb/Co3O4–CNF/CILE1–12 mM330 μM15[65]
HRP/GO-Co3O4-Nafion/GCE1–30 mM2 mM30[66]
Fe2P/NP C/GCE0.1–1 mM60 μM7[15]
Porous Au-PtNP0.3–10 mM50 μM [67]
P2AB/AuNPs/PGE0.06–100 μM36.7 μM3[59]
GC-Ag(paste)-LDH125–3200 μM85 µM5[68]
4 nm PtNPs/GCE0.025–0.75 mM10 µM10[69]
Pth-CuO/GCE0–3300 μM3.86 μM15[70]
MoS2-Au-Ag0.05–20 mM7.19 μM [71]
CuNPs/AgNW/GR/SU-8/ITO1–25 mM9 μM15[72]
PEDOT-CuO0.04–10 mM8.5 μM90[73]
AuNPs-PSi2.0–13.81 mM (LSV)
0.5–6.91 mM (SWV)
14.84 μM (LSV)
15.16 μM (SWV)
12[74]
G3.0 Vio-PAMAM-AuNPs/GCE0.1 mM–6.2 mM27 μM30[75]
ITO-rGO-AuNPs25 μM–3 mM6.55 μM [58]
AQ-PF6-IL/SPE10–1228 μM2.87 µM30[76]
Zr-MOF-PVP10–800 μM2.76 μM [77]
Co3O4/ATNTs1.27–26.80 mM6.71 μM35[78]
Al2O3/CC0.002–0.035 mM110 μM [79]
2-AB-GCE21 μM–34.648 mM7 μM31[80]
Table 2. Determination of H2O2 in Tap Water.
Addition No.H2O2 Added (μM)H2O2 Found (μM)Recovery (%)
1100.05108.71108.66
2199.90184.2292.16
3299.55289.2596.56
4399.00422.92105.99
Table 3. Determination of H2O2 in Apple Juice.
Addition No.H2O2 Added (μM)H2O2 Found (μM)Recovery (%)
1100.05110.14110.08
2199.90198.9399.51
3299.55318.42106.30
4399.00460.59115.43
Table 4. Determination of H2O2 in L. plantarum from Brown Rice.
Addition No.H2O2 Added (μM)H2O2 Found (μM)Recovery (%)
1200.29202.01100.86
2400.19426.18106.50
3599.69576.4996.13
4798.79772.8096.75
Table 5. Determination of H2O2 in B. subtilis.
Addition No.H2O2 Added (μM)H2O2 Found (μM)Recovery (%)
1199.70196.9798.64
2398.61396.9199.57
3596.73578.0796.87
4794.07767.5896.66
Table 6. Determination of H2O2 in E. coli.
Addition No.H2O2 Added (μM)H2O2 Found (μM)Recovery (%)
1200.29195.7497.73
2400.19406.29101.525
3599.69611.11101.90
4798.79839.78105.13
Disclaimer/Publisher’s Note: The statements, opinions and data contained in all publications are solely those of the individual author(s) and contributor(s) and not of MDPI and/or the editor(s). MDPI and/or the editor(s) disclaim responsibility for any injury to people or property resulting from any ideas, methods, instructions or products referred to in the content.

