Abstract
A novel electrochemical sensor based on Cu-loaded carbon nanospheres (Cu–CNSs) was designed and fabricated. Initially, the CNSs were synthesized using a natural or inexpensive carbon source (dark brown sugar), and Cu was loaded to enhance the electrocatalytic properties of the material. Subsequently, the synthesized Cu–CNSs were modified onto a screen-printed carbon electrode (SPCE), termed Cu–CNS/SPCE, to simultaneously detect the biomarkers dopamine (DA) and melatonin (MT) through differential pulse voltammetry. The surface characterization of the Cu–CNSs confirmed the formation of carbon spheres and Cu nanoparticles covering the spheres. Electrochemical studies showed that the Cu–CNS/SPCE had a high selectivity and sensitivity toward DA and MT, with a significant peak separation of 0.502 V. The two linear ranges of DA were 0.125–20 μM and 20–100 μM and the linear range of MT was 1.0–100 μM, with corresponding detection limits of 0.34 μM and 0.33 μM (S/N = 3), respectively. The quantification limits for DA and MT were 2.19 and 1.09 μM (S/N = 10), respectively. The sensor performance is attributed to the high conductivity and large, electrochemically active surface area of the Cu–CNS. In human serum samples, the Cu–CNS/SPCE exhibited good selectivity and satisfactory reproducibility for the simultaneous determination of DA and MT.
1. Introduction
The biomarkers dopamine (DA) and melatonin (MT) play important roles in almost all physiological functions of the central nervous system. The decline in the production of DA and MT in aged individuals is largely responsible for the development of neurodegenerative diseases (NDs), such as Alzheimer’s disease and Parkinson’s disease [1], and major depressive disorder (MDD) [2]. MDD comprises various forms of depression, including single-phase, bipolar, and psychotic depression [3]. Currently, there are no recognized biomarkers for diagnosing NDs or MDD. However, emerging evidence suggests that NDs and MDD are intricately linked to a variety of neurotransmitters and neurohormones [3]. Therefore, the simultaneous determination of relevant neurotransmitters and neurohormones is essential to support the clinical diagnoses of NDs and MDD. In this context, the development of inexpensive and simple electrochemical sensors capable of monitoring both DA (a neurotransmitter) and MT (a neurohormone) levels in human samples is currently receiving extensive attention [4].
DA, a catecholamine neurotransmitter, is synthesized mainly in the brain. The DA levels in healthy human serum lie between 0.01 and 10 μM [3,5]. Dysregulated DA levels can lead to NDs and MDD symptoms, including anhedonia (loss of interest) and sleep disturbances. However, these symptoms can be alleviated by regulating the levels of DA [6]. As DA stimulates the heartbeat, breathing, and digestion, it is a clinically important drug molecule used in the treatment of hypertension, bronchial asthma, cardiac surgery, and myocardial infarction [7]. MT, a neurohormone or a circadian hormone, is basically the chemical compound N-acetyl-5-methoxytryptamine. It is prominently synthesized in the pineal gland and is secreted in a phasic manner, being stimulated at night, and suppressed by daylight. Since the circulating levels of MT vary in a daily cycle, normal MT levels usually range from 0.043 μM during the day to 0.86 μM at night. Deviations from normal MT levels may cause MDD; therefore, MT is an important target for MDD diagnosis [8]. As DA and MT coexist in bodily fluids and have a significant impact on NDs and MDD, the development of an electrochemical sensor with a high sensitivity and selectivity for the simultaneous determination of DA and MT is of great importance.
Thus far, several analytical methods such as high-performance liquid chromatography [9], radioimmunoassays and calorimetric techniques [10], spectrofluorometric techniques [11], and electrochemical sensing methods [12] have been utilized for quantifying neurological biomarkers in biological samples. Among these methods, electrochemical sensing methods are highly preferable for the determination of neurological biomarkers due to their user-friendly operational process, ease of portability, fast-responding sensors, cost-effectiveness, and good stability in testing real samples [5,13]. Unwanted background signals can be eliminated by improving the real-time interactions between the target biomarkers and the sensor. Briefly, the bare or unmodified electrodes are susceptible to fouling by oxidation products of DA, thus complicating the electrochemistry of DA. However, the incorporation of nanomaterials can possibly improve the sensitivity and selectivity of the analysis, decreasing the extent of electrode fouling during DA redox recycling [7,14].
For a bare electrode, the simultaneous determination of two or more analytes is difficult because of overlapping electrooxidation peaks. Therefore, efforts have been made on a global scale to enhance the “4 s” characteristics of sensors, namely, stability, sensitivity, selectivity, and speed [15], by modifying nanomaterials. To improve the detection sensitivity, simultaneous electrochemical sensors have been modified using different nanomaterials that exhibit desirable properties for sensor fabrication and sensing mechanisms. Some examples of these nanomaterials include single elements, metal oxides, and carbon nanostructures, although they are not restricted to these materials alone. A unique preparation technique that has recently gained popularity is the combination of one or more metal/metal oxides with carbon materials. The advantage of this technique is that carbon materials, which have high electrical conductivities, play a crucial role in reducing recombination and promoting electron transport [16]. Metal/metal-oxide-loaded carbon materials possess distinct structural advantages, relatively small sizes, and prominent target-sensing capabilities originating from their nanoscale dimensions, rendering them an excellent choice for designing sensitive electrochemical sensors [15,17]. Nanostructured Cu has been used in combination with carbon materials for sensor fabrication because it is inexpensive and has electrocatalytic capabilities similar to those of noble metals [18]. Cu can endow carbon materials with specific catalytic and electronic properties, thereby expanding their utility for simultaneous electrochemical sensing applications.
In this work, we demonstrate a facile, rapid, sensitive, and cost-effective electrochemical sensor based on bioinspired Cu–carbon nanospheres (Cu–CNSs) for the simultaneous determination of DA and MT. Instead of glucose or sucrose, the carbon source utilized is dark brown sugar, which is relatively inexpensive compared to other commercial carbon sources. The synthesized Cu–CNSs demonstrate high electrocatalytic activity and a large active surface area, possibly because of the strong electronic interactions between Cu and the CNSs, which form heterojunctions at the electrode–analyte interface and accelerate the charge transfer capacity. The method used in this study is advantageous because the synthesis of Cu–CNSs necessitates no complicated steps, less time, and a natural or inexpensive carbon source, thus eliminating the need for commercial carbon sources. Differential pulse voltammetry (DPV) was employed for the simultaneous sensing of DA and MT at the Cu–CNS-modified screen-printed carbon electrode (SPCE). The schematic representation of the DA and MT electrochemical reactions on the fabricated Cu–CNS/SPCE is illustrated in Scheme 1.
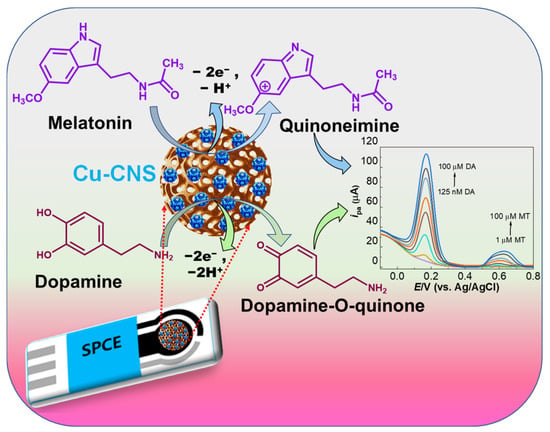
Scheme 1.
Schematic representation of the fabricated Cu–CNS/SPCE for the simultaneous detection of DA and MT. The orange line shows the drop casted Copper-loaded carbon nanospheres (Cu–CNS) material (Brown color sphere: CNS and Blue color spheres: the loaded Cu nanoparticles).
2. Materials and Methods
2.1. Reagents and Chemicals
Potassium ferricyanide and ferrocyanide [Fe(CN)6]3−/4−, hydrochloric acid (HCl, 37%), concentrated sulfuric acid (H2SO4), ethanol (99.5%), toluene (99.5%), and copper nitrate Cu(NO3)2 · H2O were procured from Sigma–Aldrich (Seoul, Republic of Korea). DA, MT, ascorbic acid (AA), uric acid (UA), urea, creatinine, epinephrine (EP), and glucose (Glu) were also purchased from Sigma–Aldrich and were used for the selectivity experiments. All reagents were used as received without further purification. The dark brown sugar (Quality No. 1) used was manufactured by a local sugar brand in South Korea.
The components of the buffer were also obtained from Sigma–Aldrich, Seoul, South Korea. Phosphate buffers (0.1 M) of varying pH were prepared as the supporting electrolyte by combining KH2PO4 and K2HPO4 with added KCl (0.1 M), following the standard protocol of our lab [19]. Sodium chloride, Magnesium chloride, or other ions were not added to the buffer. All the solutions were prepared using water (18.2 MΩ) obtained from a Milli–Q water purifier.
2.2. Synthesis of Cu-CNS
The carbon source (dark brown sugar, 4 g) and 140 mg of Cu(NO3)2 · H2O were separately dissolved in 30 mL of water and stirred (300 rpm) at room temperature (25 °C) for 60 min to obtain clear solutions. The two solutions were mixed by stirring (300 rpm) at 100 °C for 12 h. The solution mixture was placed in a 40 mL Teflon-sealed autoclave and heated to 180 °C for 24 h. The resultant product was separated by three centrifugation/washing/redispersion cycles in water, followed by centrifugation in ethanol to remove excess or unloaded copper ions. The product was oven-dried at 100 °C for 12 h. Subsequently, it was calcined in a tube furnace under an argon gas flow at 450 °C for 3 h. The resulting product was re-dispersed in ethanol and designated as Cu–CNS [20]. A schematic of this simple synthesis process is shown in Scheme 2.
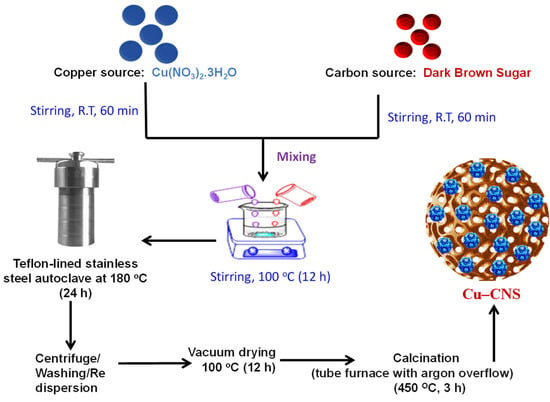
Scheme 2.
Synthesis scheme of Cu–CNS from a natural or inexpensive carbon source.
2.3. Fabrication of Voltammetric Sensor
An SPCE (Model name: C11L) procured from Metrohm DropSens (Oveido, Spain) was utilized as a base electrode material. The geometric area of the working electrode in the SPCE was 0.1256 cm2. Approximately 6 µL of Cu–CNSs (1.0 mg mL−1) were drop-cast over the SPCE. The large surface area of the Cu–CNSs favored an easy and stable layer formation on the SPCE via simple physical adsorption.
2.4. Characterization and Electrochemical Measurements
Surface analyses of the synthesized materials were performed using field emission scanning electron microscopy (FE–SEM; Zeiss GEMINI500, (Carl Zeiss Microscopy Deutschland GmbH., Oberkochen, Germany) coupled with energy dispersive X–ray spectroscopy (EDS). Transmission electron microscopy (TEM) images were acquired using a HITACHI H–7600 200 kV TEM, Hitachi High-Tech Corp., Tokyo, Japan. Cyclic voltammetry (CV) and electrochemical impedance spectroscopy (EIS) were performed using a potentiostat (model 604E, CH Instruments, Inc., Austin, TX, USA). Differential pulse voltammetry (DPV) was performed using an electrochemical apparatus (Compactstat.h standard, Ivium Technologies, B.V., Eindhoven, The Netherlands) interfaced with a personal computer, using the software from the same company for data acquisition and analysis.
A 2 mL disposable electrochemical cell was constructed for the CV, EIS, and DPV experiments. The sensor was placed in 2 mL of a 0.1 M KCl solution containing 5.0 mM [Fe(CN)6]3−/4−, and the potential was swept from −0.4 to +0.6 V at different scan rates. The EIS measurements were taken in the frequency range of 100 kHz to 0.1 Hz under the open circuit potential. For DPV, a 2 mL disposable well with phosphate buffer solution was set up; the sensor was polarized in the range of potential from −0.1 to 0.8 V. After 10 s of equilibration time, DPV scans were recorded upon the addition of the DA and MT solutions. The current responses after baseline subtraction are shown. For individual determinations, DPV scans were taken while maintaining one analyte at a fixed concentration and increasing the concentration of the other analyte. For simultaneous determination, DPV scans were obtained with increasing concentrations of both DA and MT. Finally, the calibration curves for each analyte were generated with a standard deviation of more than four values.
2.5. Preparation of Real Samples
A human serum sample (H4522; from male human AB plasma) was procured from Sigma-Aldrich (Seoul, Republic of Korea). Various dilutions were prepared and analyzed using the regular addition method to suppress the matrix effects of the serum samples. The 1:10 diluted sample demonstrated less interference than the undiluted serum and was chosen as the sample with the least matrix effects for further experiments. The dilution factor for the spiked samples was 8.0. The concentrations in the DA- and MT-spiked serum samples were also determined following the DPV measurement conditions described in the Section 2.4.
2.6. Data Analysis
A one-way analysis of variance was used to compare the differences in mean values of the three sensors (bare SPCE, CNS/SPCE, and Cu–CNS/SPCE). Tukey’s test was then used to estimate the differences between them.
3. Results and Discussion
3.1. Physicochemical Characterization
The morphology of the synthesized materials was examined by FE-SEM and TEM, as shown in Figure 1. In FE-SEM, at a scale of 1 µm, the CNSs material (Figure 1a) showed well-distributed nanospheres with slight aggregation and a rough surface, whilst the Cu–CNSs material (Figure 1b) showed a uniform formation of evenly distributed nanospheres with a much smoother morphology due to the Cu loadings. The Cu–CNSs material had more carbon spheres compared to the CNSs material, suggesting a slight decrease in the particle size after successful Cu loading. The TEM image in Figure 1c confirmed the presence of spherical CNSs with an ordered porous structure. The TEM image of the Cu–CNSs material (Figure 1d and inset) showed bright Cu particles with a size of 10–20 nm evenly spread over the carbon spheres.
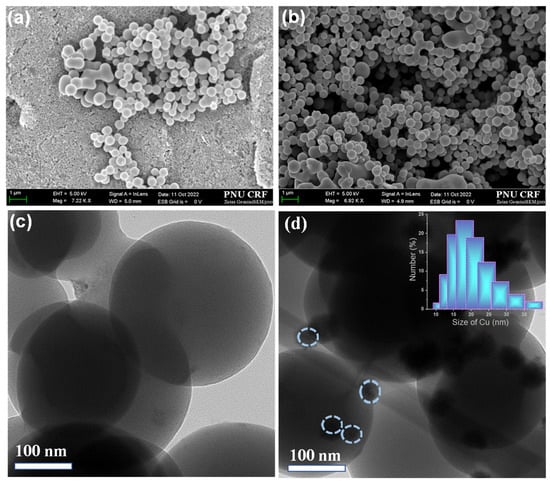
Figure 1.
FE–SEM images of (a) CNSs and (b) Cu–CNSs materials at a scale of 1 µm. FE–TEM images of (c) CNSs and (d) Cu–CNSs materials. Inset: the mean diameter of Cu nanoparticles loaded in the CNS. Highlighted blue circles denote the loaded Cu nanoparticles.
To study the detailed composition and structure of the CNSs material, high-angle annular dark-field (HAADF) scanning transmission electron microscopy (STEM) images and STEM-EDS elemental mapping spectra were obtained. As shown in Figure 2, all four elements (C, Cu, N, and O) were homogeneously distributed in the spherical particles, consistent with the conventional TEM images. The atomic percentages of C, Cu, N, and O were 96.76%, 1.77%, 0.3%, and 1.12%, respectively. These results indicate the successful incorporation of Cu ions into the carbon-rich matrix.
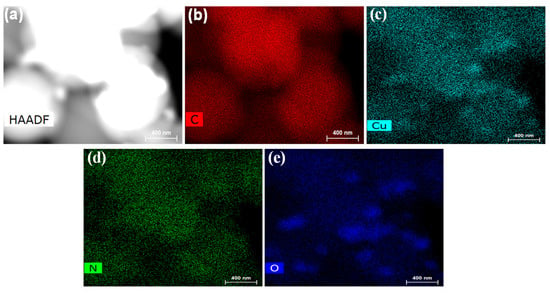
Figure 2.
(a) HAADF-STEM image of Cu–CNSs. (b–e) EDS elemental mapping images of Cu–CNSs displaying distribution of C, Cu, N, and O. Scale: 400 nm.
3.2. Electrochemical Performance of the Sensors
CV was used to characterize the modified sensors in 5.0 mM Fe(CN)6]3−/4− solution prepared in 0.1 M KCl at a 50 mV s−1 scan rate. Figure 3a compares the CV responses of the bare SPCE, CNS/SPCE, and Cu–CNS/SPCE. The bare SPCE exhibited weaker redox peaks compared to the modified sensors owing to sluggish/insufficient electron transfer kinetics. For the bare SPCE, CNS/SPCE, and Cu–CNS/SPCE, clear redox peaks with oxidation/anodic peak potentials (Epa) corresponding to 0.367, 0.360, and 0.305 V were recorded. Additionally, the peak-to-peak separation (ΔEp) of the three sensors was 0.27, 0.25, and 0.18 V. The low ∆Ep value of the Cu–CNS/SPCE signifies the fast electron transfer properties of the Cu–CNS modifications. Compared to the bare SPCE and CNS/SPCE, the Cu–CNS/SPCE exhibited a dominant, reversible redox peak, indicating the possibility of increased electron transfer between the sensor and redox probe. However, the anodic/oxidation peak current (Ipa) value for the Cu–CNS/SPCE was 198.27 μA, which was 1.7 times higher than the bare SPCE (115.215 μA) and 1.3 times higher than the CNS/SPCE (148.86 μA), indicating that the Cu–CNSs improved the conductivity of the sensor.
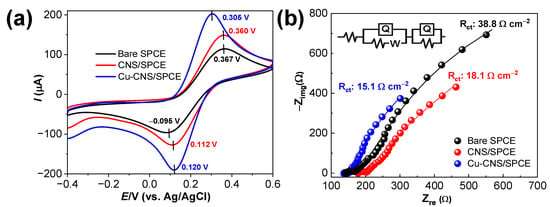
Figure 3.
(a) CV responses of the modified sensors in 5 mM of Fe(CN)6]3−/4− in 0.1 M KCl redox probe at 50 mV s−1 scan rate. (b) EIS responses of the modified sensors in the same redox probe. Inset: the fitted equivalent circuit.
EIS was performed to estimate the electron transfer properties of the sensors at the solution interface. The EIS profiles at the open-circuit potential in the frequency range of 100 kHz to 0.1 Hz are represented as Nyquist diagrams in Figure 3b. The total resistance depended on the solution resistance (Rs) and the resistance due to Cu and the CNSs. As is evident from Figure 3b, diffusion occurred at low frequencies, while resistance existed at higher frequencies at the sensor surface. The higher semicircular curve and high charge–transfer resistance (Rct) value around 38.8 Ω cm−2 correspond to the bare SPCE, indicating high resistance in this sensor. Fitting with the equivalent Randles circuit, R(Q(RW))(QR) exhibited smaller semicircular curves and lower Rct values of 18.1 and 15.1 Ω cm−2 for the CNS/SPCE and Cu–CNS/SPCE, respectively. As the solution resistance was slightly higher, it led to a slight increase in the surface resistance of the sensor, and additional capacitance and resistance elements were required. Therefore, a different circuit from the typical Randles circuit was applied to estimate the resistance and capacitance of the sensor. This may be considered as an inhomogeneous model because the properties of the first layer differ from those of the bulk layer. This concept is justified by the observation that the layer density decreases from the sensor surface in the direction of the electrolyte boundary. Owing to the better conductivity of the CNSs and the increased catalytic activity of Cu, the Cu–CNS/SPCE exhibited the lowest resistance, similar to the resistence reported previously [21]. The CV and EIS results for Fe(CN)6]3−/4− indicate the diffusion-controlled electron transport properties of the Cu–CNS/SPCE sensor.
Figure 4a,c,e show the electrochemical performance of the sensors at different scan rates in the same redox probe. The Epa and cathodic peak potentials (Epc) reveal notable shifts towards negative regions, with the general trend of increasing peak currents upon increasing the scan rates. As shown in Figure 4b,d,f, linear plots of the peak current as a function of the square root of the scan rate indicate a predominantly diffusion-controlled process in the Cu–CNS/SPCE sensor in contrast to the process in the other sensors. As the electron transfer at the sensors is a reversible process, the electrochemically active surface area (ECSA) of each sensor was calculated using the Randles–Ševčík equation [22,23]. The ECSAs of the bare SPCE, CNS/SPCE, and Cu–CNS/SPCE sensors were 0.1262, 0.1480, and 0.1964 cm2, respectively. The ECSAs of the CNS/SPCE and Cu–CNS/SPCE were 1.2 and 1.6 times larger, respectively, than that of the bare SPCE. The presence of Cu on the CNSs enhanced the number of active sites on the Cu–CNS/SPCE. The larger ECSA confirms the enhanced catalytic activity due to the Cu–CNSs.
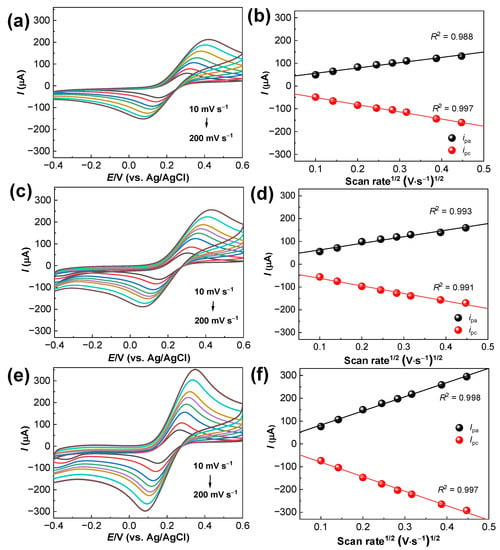
Figure 4.
(a) CV results of the Bare SPCE in 5 mM Fe(CN)6]3−/4− contained in 0.1 M KCl at increasingscan rates from 10 to 200 mVs−1 and (b) their corresponding calibration plot. CV results of (c) CNS/SPCE and (e) Cu-CNS/SPCE at different scan rates in the same redox probe. Calibration plots of (d) CNS/SPCE and (f) Cu-CNS/SPCE. In the calibration plots, Black: Ipa Red: Ipc.
The redox mechanisms of DA and the oxidation mechanism of MT on the bare SPCE, CNS/SPCE, and Cu–CNS/SPCE were examined using CV. Figure 5 shows the CV curves of the modified sensors against 2 μM DA and 6 μM MT in a deoxygenated 0.1 M phosphate buffer solution with a pH of 7.0. Weak redox peaks for DA and MT were recorded for the bare SPCE and CNS/SPCE sensors, whereas the Cu–CNS/SPCE exhibited a well-defined oxidation peak for DA at approximately +0.223 V and a cathodic peak at 0.1 V. A small and a broad irreversible oxidation peak for MT at approximately +0.710 V with no observable cathodic peak in the reverse scan was observed for MT. This behavior suggests that MT oxidation is an irreversible process (Figure 5a). The peak-to-peak separation (ΔEp) of the Cu–CNS/SPCE was 60.5 mV/z, where z is the number of electrons (n = 2) in a reversible redox system. The ΔEp value of 60.5 mV/z is slightly higher than the theoretical value of 59 mV/z (0.059 V/z). These results demonstrate that the Cu–CNS/SPCE can effectively catalyze the electrooxidation of DA. Additionally, the peak shapes of MT were significantly improved when compared to those observed for other modifications. This is attributed to the large surface area and catalytic effects of the Cu–CNSs. On the Cu–CNS/SPCE, the Epa of DA was negatively shifted (Figure 5b), while MT showed only a negligible negative shift (Figure 5c); this may be attributed to its hydrophobic nature, which warrants the application of a high potential. The electrocatalysis of DA was evident, while the electrocatalysis of MT was negligible.
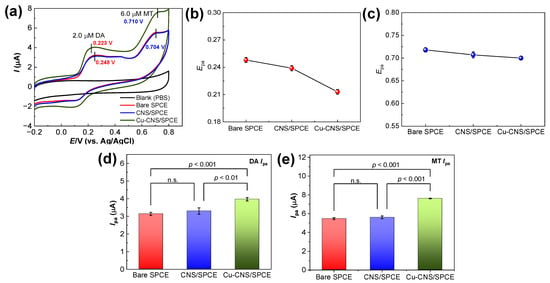
Figure 5.
(a) CV responses of Cu–CNS/SPCE in 0.1 M phosphate buffer solution, pH 7.0, containing 2.0 µM DA and 6.0 µM MT. The corresponding Epa plots of (b) DA and (c) MT, and Ipa values plots for (d) DA and (e) MT. The bar charts represent the mean ± s.d. (n = 3). A highly significant increase in current response (p < 0.001), a significant increase (p < 0.01), and no significant difference (n.s.; p > 0.05).
The significant differences in the Ipa responses for both targets against the three modified sensors were analyzed using a one-way ANOVA and Tukey’s test, and the results are shown in Figure 5d,e. The bare SPCE and CNS/SPCE sensors showed nearly similar current responses for both DA and MT (non-significant differences in mean values; n.s.; p > 0.05), while the Cu–CNS/SPCE demonstrated a significant increase in the current responses (p < 0.001) over the other two sensors. The redox peak currents and reversibility of the DA redox process were improved after the Cu–CNS modification (Figure 5d). The enhancements in the peak current and the decrease in overpotentials are clear evidence of the catalytic effects of the Cu–CNSs toward DA. The same increased trend in current responses was notable on the Cu–CNS/SPCE toward MT (Figure 5e). The loading of Cu onto the CNSs accelerated the electron transfer, resulting in remarkably increased peak currents for these targets.
3.3. Optimization of Solution PH
The supporting electrolyte pH plays a pivotal role in determining the oxidation potentials and currents of DA and MT on the Cu–CNS/SPCE. The influence of pH was studied using CV in the pH range of 6.0–8.0, and the voltammograms are provided in Figure 6a. CV measurements were performed at an increasing pH, and the DA and MT oxidation potentials were slightly shifted toward the negative potential region. A linear relationship was evident between the Epa and pH, as shown in Figure 6b. The slope (dEP/dpH) for DA was −50.0 mV/pH, indicating that the same number of electrons and protons (2e−; 2H+) was involved in the electrooxidation of DA to dopamine o-quinone [12]. The slope (dEP/dpH) for MT was −52.0 mV/pH, which clearly demonstrates the involvement of two electrons and one proton (2e; H+) in the oxidation of MT to form quinone imine; these results are consistent with those reported previously [24]. However, the slopes of −50.0 and −52.0 mV/pH for DA and MT, respectively, are nearer to the calculated Nernst value of −59 mV. Furthermore, the Ipa responses (Figure 6c) were enhanced only at an electrolyte pH of 7.0; reduced peak currents were observed at other pH values (6.0, 6.5, 7.5, and 8.0). Moreover, MT protonation is difficult at a slightly acidic pH (6.0), as previously observed [24,25]. At pH 7.0, DA has a pKa value of 8.9 [26], and MT has pKa values of 16.51 and −0.69. MT remains uncharged/neutral in the entire pH range [27]. In completely protected aqueous medium (without oxygen and exposure to light), MT has pKa values of 5.8 and 10.2. MT is known to interact with the nanomaterial (Cu-CNSs) at highly acidic (pH 1.0–3.0), near neutral (pH 7.0), and highly alkaline pH (pH 10.0–13.0) levels [28]. Hence, as our target was to measure MT in human sample matrices, pH 7.0 was selected as the optimum pH for the simultaneous sensing of these biomarkers.
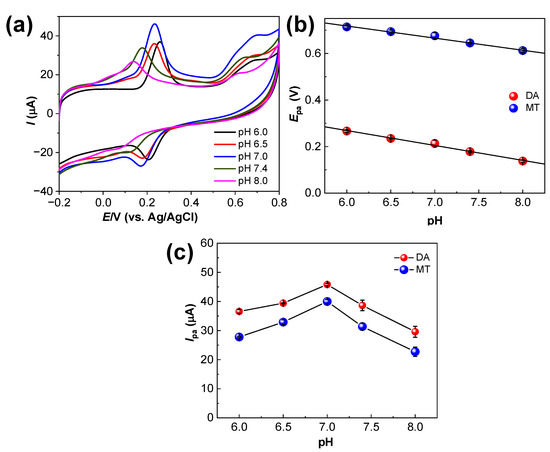
Figure 6.
(a) CVs of Cu–CNS/SPCE in 0.1 M phosphate buffer solution (pH 7.0) containing 25 µM DA and 50 µM MT and the corresponding plots of (b) Epa values and (c) Ipa values.
3.4. Effect of Scan Rates on Cu–CNS/SPCE
The influence of different scan rates on the peak currents and peak potentials of DA and MT on the Cu–CNS/SPCE was evaluated. As shown in Figure 7a, the redox peak currents of DA and the Ipa responses of MT increased with increasing scan rates. Additionally, the Epa of DA was slightly shifted toward the negative side with increasing scan rate, as shown in Figure 7b.
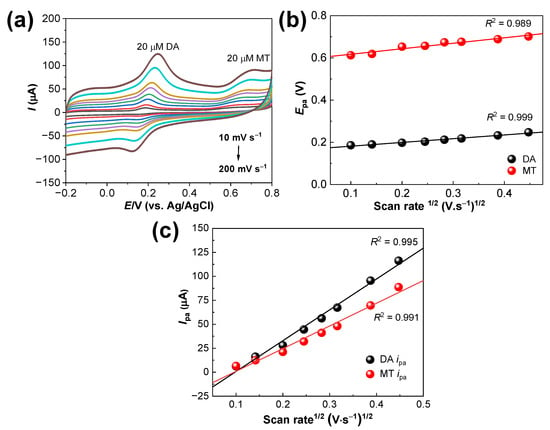
Figure 7.
(a) CV results of the modified sensors in 20 µM of DA and MT with increasing scan rates (10–200 mV. s−1) and the corresponding plots of (b) Epa values and (c) Ipa values.
The number of electrons required for the oxidation of MT on the Cu–CNS/SPCE could be ascertained by the shift in the Epa with respect to the scan rate in CV. The linear regression equations obtained by plotting the log of the scan rate versus the Epa are as follows:
Epa = 0.26002 ± 0.02442 × logv, R2 = 0.989 (MT)
The standard rate constant, Ks, for the irreversible voltammogram of MT alone was found using the Laviron equation, as follows:
Ep = E0 + (2.303RT/αnF) log(RTK0/αnF) + (2.303RT/αnF)logv
Here, Ep and E0 represent the anodic and formal potentials of the sensor; R is the universal gas constant, T represents the temperature, α is the electron transfer coefficient, F is the Faraday constant, and n is the number of electrons transferred [29]. The value of α is assumed to be 0.5. Using Equation (1), the number of electrons transferred for MT was calculated to be 2.1, suggesting a two-electron transfer mechanism coupled to a one-proton mechanism.
The linear relationship between the square root of the scan rates (10–200 mV s−1) and their respective peak currents against 20 µM of DA and MT is shown in Figure 7c. For these plots, the slopes of the Ipa values were nearly 0.4, and the electrochemical reaction of these biomarkers was predominantly a diffusion-controlled process rather than a surface-controlled process, similar to the results reported elsewhere [12]. These results suggested that the Ipa responses increased owing to the release of two electrons and one proton from and to the sensor and the MT. Therefore, the Cu–CNS/SPCE was not fouled by these biomarkers, and the selectivity of detection was not compromised during the analysis.
3.5. DPV Parameters Optimization
The DPV technique eliminates rectangular capacitive currents and is more sensitive than CV. To achieve optimum working conditions for the Cu–CNS/SPCE, the DPV parameters (pulse time, pulse amplitude, potential step, and scan rate) were varied against fixed concentrations of DA and MT (2.0 μM), following a previous report [30]. The obtained optimum DPV parameters after 10 s of equilibration in DA and MT were as follows: pulse time—25 ms; pulse amplitude—75 mV; potential step—5.0 mV; scan rate—20 mV s−1.
3.6. Voltammetric Estimation of DA and MT
Individual determinations of DA and MT on the Cu–CNS/SPCE were performed using the DPV method, within the potential window, −0.1 V to 0.8 V). Initially, the DPV responses to the addition of individual analytes, DA and MT, were tested, and their respective voltammograms are shown in Figure 8a,c. Well-resolved oxidation peaks of DA and MT were detected at 0.15 and 0.6 V (vs. Ag/AgCl), confirming the efficiency of the Cu–CNS in detecting both the analytes separately. The constructed calibration curves are shown in Figure 8b,d. The rationale behind the two linear ranges or the break in the calibration curve for DA reflects the formation of a sub-monolayer in the first range of calibration and the formation of a monolayer in the second range, which is similar to results reported elsewhere [31].
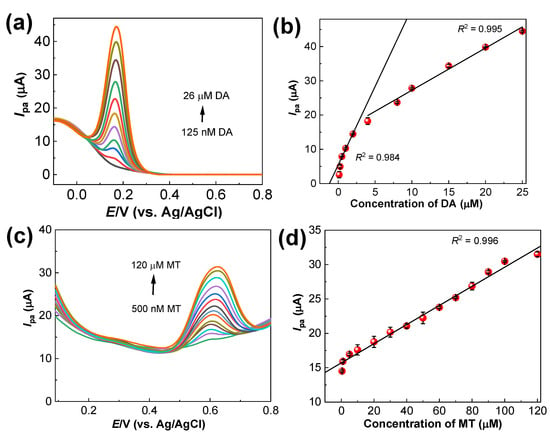
Figure 8.
(a) DPV responses of the Cu–CNS/SPCE in different DA concentrations (125 nM to 26 µM), (b) DA calibration plot in two linear concentration ranges (125 nM to 4.0 µM) and (5.0 to 26.0 µM), (c) DPV responses against different MT concentrations (500 nM to 120 µM), and (d) calibration plot of MT in a wide linear range from 500 nM to 120 µM.
Subsequently, DPV was performed for varying concentrations of one biomarker while maintaining a constant concentration of the other biomarker. At an MT concentration of 5.0 μM, the DA concentration was changed from 0.125 to 22.0 μM; the obtained voltammograms as presented in Figure 9a. Similarly, at a DA concentration of 5.0 μM, the MT concentration was changed from 2.0 to 100 μM; the voltammograms are shown in Figure 9c. The corresponding linear plots for DA and MT are displayed in Figure 9b,d. Distinguishable peak currents were observed for both DA (~0.15 V/vs. Ag/AgCl) and MT (~0.6 V/vs. Ag/AgCl) in the mixed analyte form. Therefore, no adsorption or fouling occurred in the examined concentration range.
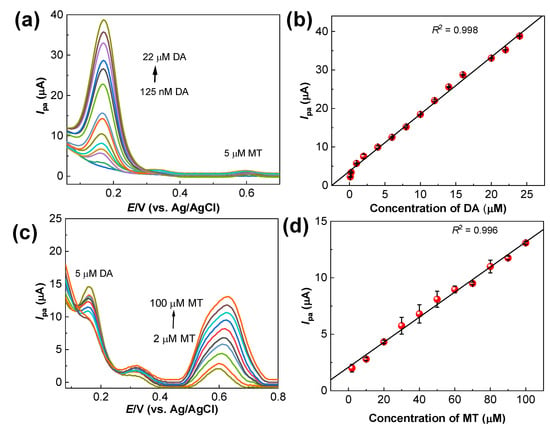
Figure 9.
(a) DPV responses of the Cu–CNS/SPCE in increasing concentrations of DA from 125 nM to 22 µM with a fixed 5 µM concentration of MT; (b) DA calibration plot. (c) DPV curves of the Cu–CNS/SPCE in increasing concentrations of MT from 2 µM to 100 µM with a fixed 5 µM concentration of DA; (d) MT calibration plot.
DPV was performed to detect the targets, DA and MT, simultaneously. The voltammograms are shown in Figure 10a, and the calibration curves are shown in Figure 10b,c. The two linear ranges for DA were 0.125–20.0 μM and 20.0–100.0 μM, with the linear regression equations being Ipa, DA (µA) = 2.010CDA + 0.8858 (R2 = 0.995) and Ipa, DA (µA) = 2.2672CDA + 0.1651 (R2 = 0.995), respectively. A sensitivity of 8.34 μA mM−1 cm−2 and a detection limit of 0.34 μM (S/N = 3) were obtained for DA. The linear range of MT was obtained in the concentration range of 1.0–100 μM, with the linear regression equation being Ip, MT (µA) = 0.155CMT + 0.2496 (R2 = 0.998). The sensitivity and detection limits for MT were 1.23 μA mM−1 cm−2 and 0.33 μM, respectively. The limits of quantification of DA and MT (S/N = 10) were 2.19 and 1.09 μM, respectively. The low detection and quantification limits further confirmed the high sensitivity of the Cu–CNS/SPCE. The recorded detection limits of the Cu–CNS/SPCE for DA were comparable to those in previous reports [4,26], and those of MT were much lower than those in previous reports [23,24,32] (Table 1). The high sensitivity and wide linear range of the Cu–CNS/SPCE were due to the enhanced ECSA and rapid electron transport between the Cu–CNS/SPCE and the targets.
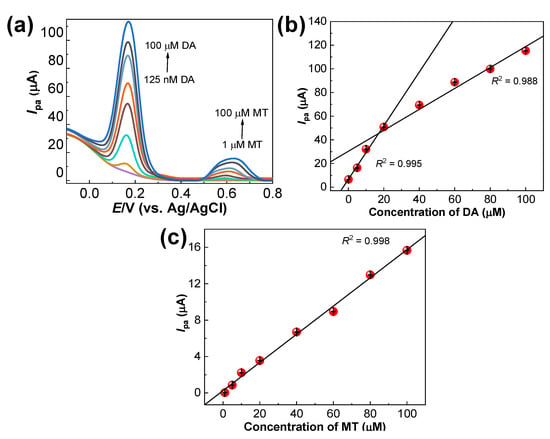
Figure 10.
(a) DPV responses of the Cu–CNS/SPCE for the simultaneous detection of DA from 125 nM to 100 µM and MT from 1 µM to 100 µM. (b) DA showing two linear ranges (125 nM to 20 µM) and (20 µM to 100 µM) (c) MT calibration plot illustrating a wide linear range from 1 µM to 100 µM concentrations.

Table 1.
Comparative study of the electrochemical sensors for the simultaneous determination of DA and MT.
3.7. Selectivity
Selectivity experiments using the Cu–CNS/SPCE for the simultaneous sensing of DA and MT were performed in the presence of interfering species such as ascorbic acid (AA), glucose, uric acid (UA), urea, and creatinine. the simultaneous determination of DA (20.0 µM) and MT (20.0 µM) in the presence of a ten-fold excess concentration (200 µM) of the mentioned species did not influence the oxidation currents of DA and MT (Figure 11a). AA and UA, which are negatively charged at pH 7.0, exhibited strong electrostatic repulsion, as previously reported [38]. The oxidation potentials of AA (−0.1 V) and UA (0.3 V) were distinguishable from those of DA and MT. Moreover, the addition of glucose, urea, and creatinine exhibited no significant changes in the peak currents of DA and MT. A fifteen-fold excess concentration (300 µM) of Na2+, Fe+, K+, and Mg2+ demonstrated no appreciable signals and therefore did not affect the oxidation of DA and MT (Figure 11b). Interference studies revealed the selectivity of the Cu–CNS/SPCE toward DA and MT.
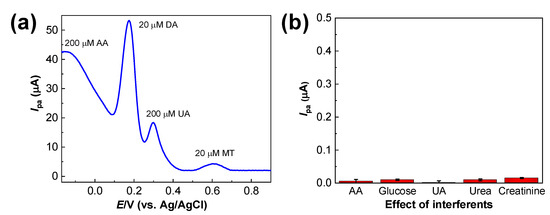
Figure 11.
(a) Selectivity results of the Cu–CNS/SPCE for the simultaneous determination of DA and MT in the presence of a ten-fold excess of various interfering compounds (AA, glucose, UA, urea, and creatinine). (b) Effect of other common interferents in DA and MT determination.
3.8. Possible Mechanism of Target Estimation Using Cu–CNS/SPCE
Cu–CNS materials possess a carbonized core with aromatic rings and a hydrophilic surface that readily interacts with DA and MT through aromatic and electrostatic π–π interactions [20]. Briefly, the aromatic interactions between the benzene ring of DA and the Cu–CNSs and the electrostatic π–π stacking interactions might facilitate fast electron transfer, improving the sensitivity of DA detection. At a neutral pH, DA is present in the pronated form (-NH3+), interacting with the π-electron clouds of Cu–CNSs [38]. At a neutral pH, MT can be easily oxidized to its intermediate quinoneimine ions, which are vulnerable to nucleophilic attack and form the corresponding dimers [25]. In contrast, at an acidic or alkaline pH, the protonation of MT is highly compromised. Similar to DA, the aromatic interactions between the benzene ring of MT and Cu–CNSs and the electrostatic π–π stacking interactions contribute to the fast electron transfer [25].
3.9. Reproducibility and Stability
DPV experiments were performed using four identically prepared Cu–CNS/SPCEs against 10 µM DA and MT. The voltammograms after baseline subtraction are shown in Figure 12a. The current responses for DA and MT were measured and are illustrated in Figure 12b,c, respectively. The relative standard deviation (RSD) values were 2.4% and 2.3% for DA and MT, respectively, suggesting a satisfactory reproducibility of the Cu–CNS/SPCE in simultaneously detecting DA and MT.
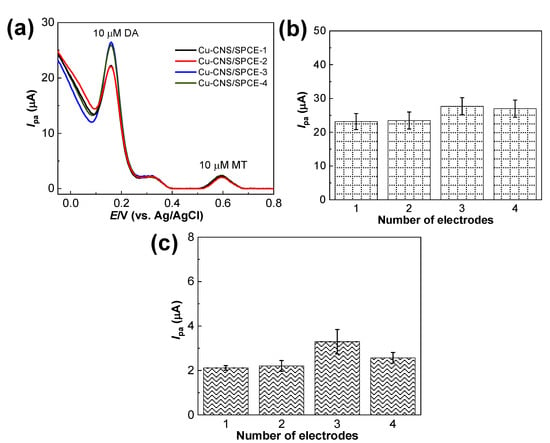
Figure 12.
(a) Reproducibility results of the four fabricated identical sensors against 10 µM DA and MT. The corresponding plots of Ipa values for (b) DA and (c) MT.
The long-term stability of the Cu–CNS/SPCE was examined over four weeks. The Cu–CNS/SPCE demonstrated that 82.5% and 81.8% of Ipa responses were retained for DA and MT, respectively. The Ipa decreased to 17.5% and 18.2% only. The Cu–CNS/SPCE sensor was stored under ambient conditions and was not used. Hence, these results confirm the stability properties of the sensor in the simultaneous determination of DA and MT.
3.10. Analysis of Real Samples
The practical applicability of the Cu–CNS/SPCE was tested by using the regular addition method to measure the concentrations of DA and MT in human serum samples. The same DPV measurement conditions were used for the spiked serum samples. The DPV results (Table 2) demonstrated satisfactory recovery percentages (approximately 100%), with a much lower relative standard deviation (RSD) value of less than 4.0%. The slightly higher recovery percentage of above 100% indicates the absence of matrix effects on these determinations, signifying the good performance of the sensor in the serum sample instead of the phosphate buffer [39]. Possibly, errors in the sensor’s repeatability (in several replications for each concentration) and instrumental errors could cause higher recovery percentages [40].

Table 2.
Comparison of DA and MT concentrations measured in human serum samples.
4. Conclusions
In this study, we have successfully synthesized Cu–CNS materials with a carbonized core and a hydrophilic surface that readily interacts with DA and MT through aromatic and electrostatic π–π interactions. Loading Cu onto the CNSs accelerated electron transfer, resulting in a remarkably increased Ipa responses with a peak-to-peak separation of 0.502 V. The enhanced electrochemical performance of the Cu–CNS/SPCE was attributed to its high ECSA of 0.1964 cm2. The Cu–CNS/SPCE exhibited wide linear ranges, a high sensitivity, and the lowest detection limits for both DA and MT. Additionally, the Cu–CNS/SPCE exhibited a high selectivity, satisfactory reproducibility, and long-term stability toward DA and MT. In human serum samples, the Cu–CNS/SPCE exhibited excellent recovery percentages and low relative standard deviations, signifying the reliability of the Cu–CNS/SPCE in sensing DA and MT. The recoveries were recorded in the range of 91.0–98.0%, with RSDs of less than 5.5% in the human serum samples. Thus, the Cu–CNS/SPCE can be applied for simultaneously detecting DA and MT in biological samples.
Author Contributions
Conceptualization, S.J., T.R. and S.-C.C.; methodology, S.J., T.R. and S.-C.C.; software, S.J.; investigation, S.J. and T.R.; validation, S.J. and T.R.; data curation, S.J. and T.R.; writing—original draft preparation, S.J.; writing—review and editing, T.R.; supervision, S.-C.C.; project administration, S.-C.C.; resources, S.-C.C.; funding acquisition, S.-C.C. All authors have read and agreed to the published version of the manuscript.
Funding
This research was supported by the Basic Science Research Program through the National Research Foundation of Korea (NRF), funded by the Ministry of Education (2022R1I1A3072535).
Institutional Review Board Statement
Not applicable.
Informed Consent Statement
Not applicable.
Data Availability Statement
Not applicable.
Conflicts of Interest
The authors declare no conflict of interest.
References
- Srinivasan, V.; Pandi-Perumal, S.R.; Maestroni, G.J.M.; Esquifino, A.I.; Hardeland, R.; Cardinali, D.P. Role of melatonin in neurodegenerative diseases. Neurotox. Res. 2005, 7, 293–318. [Google Scholar] [CrossRef]
- Tonon, A.C.; Pilz, L.K.; Markus, R.P.; Hidalgo, M.P.; Elisabetsky, E. Melatonin and depression: A translational perspective from animal models to clinical studies. Front. Psychiatry 2021, 12, 638981. [Google Scholar] [CrossRef] [PubMed]
- Deng, H.; Zhao, J.; Zhao, S.; Jiang, S.; Cui, G. A graphene-based electrochemical flow analysis device for simultaneous determination of dopamine, 5-hydroxytryptamine, and melatonin. Analyst 2022, 147, 1598–1610. [Google Scholar] [CrossRef]
- Ivandini, T.A.; Einaga, Y. Polycrystalline boron-doped diamond electrodes for electrocatalytic and electrosynthetic applications. Chem. Commun. 2017, 53, 1338–1347. [Google Scholar] [CrossRef]
- Lakard, S.; Pavel, I.-A.; Lakard, B. Electrochemical biosensing of dopamine neurotransmitter: A review. Sensors 2021, 11, 11060179. [Google Scholar] [CrossRef] [PubMed]
- Belujon, P.; Grace, A.A. Dopamine system dysregulation in major depressive disorders. Int. J. Neuropsychopharmacol. 2017, 20, 1036–1046. [Google Scholar] [CrossRef]
- Decarli, N.O.; Zapp, E.; de Souza, B.S.; Santana, E.R.; Winiarski, J.P.; Vieira, I.C. Biosensor based on laccase-halloysite nanotube and imidazolium zwitterionic surfactant for dopamine determination. Biochem. Eng. J. 2022, 186, 108565. [Google Scholar] [CrossRef]
- Cardinali, D.P.; Srinivasan, V.; Brzezinski, A.; Brown, G.M. Melatonin and its analogs in insomnia and depression. J. Pineal Res. 2012, 52, 365–375. [Google Scholar] [CrossRef] [PubMed]
- Yin, B.; Li, T.; Li, Z.; Dang, T.; He, P. Determination of melatonin and its metabolites in biological fluids and eggs using high-performance liquid chromatography with fluorescence and quadrupole-orbitrap high-resolution mass spectrometry. Food Anal. Methods 2015, 9, 1142–1149. [Google Scholar] [CrossRef]
- Bongiorno, D.; Ceraulo, L.; Mele, A.; Panzeri, W.; Selva, A.; Turco Liveri, V. Structural and physicochemical characterization of the inclusion complexes of cyclomaltooligosaccharides (cyclodextrins) with melatonin. Carbohydr. Res. 2002, 337, 743–754. [Google Scholar] [CrossRef]
- Dreux, C. Studies on the biochemistry of the methoxyindoles. Spectrofluorometric determination of N-acetyl-5-methoxytryptamine (melatonin). Clin. Chim. Acta 1969, 23, 177–187. [Google Scholar] [CrossRef]
- Tadayon, F.; Sepehri, Z. A new electrochemical sensor based on a nitrogen-doped graphene/CuCo2O4 nanocomposite for simultaneous determination of dopamine, melatonin and tryptophan. RSC Adv. 2015, 5, 65560–65568. [Google Scholar] [CrossRef]
- Sohouli, E.; Khosrowshahi, E.M.; Radi, P.; Naghian, E.; Rahimi-Nasrabadi, M.; Ahmadi, F. Electrochemical sensor based on modified methylcellulose by graphene oxide and Fe3O4 nanoparticles: Application in the analysis of uric acid content in urine. J. Electroanal. Chem. 2020, 877, 114503. [Google Scholar] [CrossRef]
- Ferapontova, E.E. Electrochemical analysis of dopamine: Perspectives of specific in vivo detection. Electrochim. Acta 2017, 245, 664–671. [Google Scholar] [CrossRef]
- Zhang, J.; Liu, X.; Neri, G.; Pinna, N. Nanostructured materials for room-temperature gas sensors. Adv. Mater. 2016, 28, 795–831. [Google Scholar] [CrossRef]
- Liu, X.; Ma, T.; Pinna, N.; Zhang, J. Two-dimensional nanostructured materials for gas sensing. Adv. Funct. Mater. 2017, 27, 1702168. [Google Scholar] [CrossRef]
- Tan, H.; Ma, C.; Gao, L.; Li, Q.; Song, Y.; Xu, F.; Wang, T.; Wang, L. Metal-organic framework-derived copper nanoparticle@carbon nanocomposites as peroxidase mimics for colorimetric sensing of ascorbic acid. Chemistry 2014, 20, 16377–16383. [Google Scholar] [CrossRef] [PubMed]
- Li, R.; Liang, H.; Zhu, M.; Lai, M.; Wang, S.; Zhang, H.; Ye, H.; Zhu, R.; Zhang, W. Electrochemical dual signal sensing platform for the simultaneous determination of dopamine, uric acid and glucose based on copper and cerium bimetallic carbon nanocomposites. Bioelectrochemistry 2021, 139, 107745. [Google Scholar] [CrossRef]
- Chang, S.-C.; Rawson, K.; McNeil, C.J. Disposable tyrosinase-peroxidase bi-enzyme sensor for amperometric detection of phenols. Biosens. Bioelectron. 2002, 17, 1015–1023. [Google Scholar] [CrossRef] [PubMed]
- Sun, X.; Li, Y. Colloidal carbon spheres and their core/shell structures with noble-metal nanoparticles. Angew. Chem. 2004, 43, 597–601. [Google Scholar] [CrossRef]
- Chen, T.W.; Rajaji, U.; Chen, S.M.; Muthumariyappan, A.; Mogren, M.M.A.; Jothi Ramalingam, R.; Hochlaf, M. Facile synthesis of copper(II) oxide nanospheres covered on functionalized multiwalled carbon nanotubes modified electrode as rapid electrochemical sensing platform for super-sensitive detection of antibiotic. Ultrason. Sonochem. 2019, 58, 104596. [Google Scholar] [CrossRef] [PubMed]
- Rajarathinam, T.; Kwon, M.; Thirumalai, D.; Kim, S.; Lee, S.; Yoon, J.H.; Paik, H.J.; Kim, S.; Lee, J.; Ha, H.K.; et al. Polymer-dispersed reduced graphene oxide nanosheets and Prussian blue modified sensor for amperometric detection of sarcosine. Anal. Chim. Acta 2021, 1175, 338749. [Google Scholar] [CrossRef]
- Apetrei, I.M.; Apetrei, C. Voltammetric determination of melatonin using a graphene-based sensor in pharmaceutical products. Int. J. Nanomed. 2016, 11, 1859–1866. [Google Scholar] [CrossRef]
- Santhan, A.; Hwa, K.-Y. Rational design of nanostructured copper phosphate nanoflakes supported niobium carbide for the selective electrochemical detection of melatonin. ACS Appl. Nano. Mater. 2022, 5, 18256–18269. [Google Scholar] [CrossRef]
- Fu, D.; Liu, H.; Chen, T.; Cheng, Y.; Cao, M.; Liu, J. A bio-analytic nanoplatform based on Au post-functionalized CeFeO3 for the simultaneous determination of melatonin and ascorbic acid through photo-assisted electrochemical technology. Biosens. Bioelectron. 2022, 213, 114457. [Google Scholar] [CrossRef]
- Thirumalai, D.; Lee, S.; Kwon, M.; Paik, H.J.; Lee, J.; Chang, S.C. Disposable voltammetric sensor modified with block copolymer-dispersed graphene for simultaneous determination of dopamine and ascorbic acid in ex vivo mouse brain tissue. Sensors 2021, 11, 11100368. [Google Scholar] [CrossRef]
- Available online: https://pubchem.ncbi.nlm.nih.gov/compound/Melatonin (accessed on 12 April 2023).
- Zafra-Roldán, A.; Corona-Avendaño, S.; Montes-Sánchez, R.; Palomar-Pardavé, M.; Romero-Romo, M.; Ramírez-Silva, M.T. New insights on the spectrophotometric determination of melatonin pKa values and melatonin-βCD inclusion complex formation constant. Spectrochim. Acta 2018, 190, 442–449. [Google Scholar] [CrossRef] [PubMed]
- Hayat, K.; Munawar, A.; Zulfiqar, A.; Akhtar, M.H.; Ahmad, H.B.; Shafiq, Z.; Akram, M.; Saleemi, A.S.; Akhtar, N. CuO Hollow Cubic Caves Wrapped with Biogenic N-Rich Graphitic C for Simultaneous Monitoring of Uric Acid and Xanthine. ACS Appl. Mater. Interfaces 2020, 12, 47320–47329. [Google Scholar] [CrossRef] [PubMed]
- Rajarathinam, T.; Thirumalai, D.; Kwon, M.; Lee, S.; Jayaraman, S.; Paik, H.J.; Lee, J.; Chang, S.-C. Screen-printed carbon electrode modified with de-bundled single-walled carbon nanotubes for voltammetric determination of norepinephrine in ex vivo rat tissue. Bioelectrochemistry 2022, 146, 108155. [Google Scholar] [CrossRef]
- Kachoosangi, R.T.; Wildgoose, G.G.; Compton, R.G. Sensitive adsorptive stripping voltammetric determination of paracetamol at multiwalled carbon nanotube modified basal plane pyrolytic graphite electrode. Anal. Chim. Acta 2008, 1, 54–60. [Google Scholar] [CrossRef]
- Zeinali, H.; Bagheri, H.; Monsef-Khoshhesab, Z.; Khoshsafar, H.; Hajian, A. Nanomolar simultaneous determination of tryptophan and melatonin by a new ionic liquid carbon paste electrode modified with SnO2-Co3O4@rGO nanocomposite. Mater. Sci. Eng. C Mater. Biol. Appl. 2017, 71, 386–394. [Google Scholar] [CrossRef]
- Mei, X.; Wei, Q.; Long, H.; Yu, Z.; Deng, Z.; Meng, L.; Wang, J.; Luo, J.; Lin, C.-T.; Ma, L.; et al. Long-term stability of Au nanoparticle-anchored porous boron-doped diamond hybrid electrode for enhanced dopamine detection. Electrochim. Acta 2018, 271, 84–91. [Google Scholar] [CrossRef]
- Selvam, S.P.; Hansa, M.; Yun, K. Simultaneous differential pulse voltammetric detection of uric acid and melatonin based on a self-assembled Au nanoparticle–MoS2 nanoflake sensing platform. Sens. Actuators B Chem. 2020, 307, 127683. [Google Scholar] [CrossRef]
- Soltani, N.; Tavakkoli, N.; Shahdost-Fard, F.; Salavati, H.; Abdoli, F. A carbon paste electrode modified with Al2O3-supported palladium nanoparticles for simultaneous voltammetric determination of melatonin, dopamine, and acetaminophen. Microchim. Acta 2019, 186, 540. [Google Scholar] [CrossRef]
- Gomez, F.J.V.; Martín, A.; Silva, M.F.; Escarpa, A. Screen-printed electrodes modified with carbon nanotubes or graphene for simultaneous determination of melatonin and serotonin. Microchim. Acta 2015, 182, 1925–1931. [Google Scholar] [CrossRef]
- Lawal, A.T. Synthesis and utilisation of graphene for fabrication of electrochemical sensors. Talanta 2015, 131, 424–443. [Google Scholar] [CrossRef] [PubMed]
- Li, X.-B.; Rahman, M.M.; Xu, G.-R.; Lee, J.-J. Highly sensitive and selective detection of dopamine at Poly(chromotrope 2B)-modified glassy carbon electrode in the presence of uric acid and ascorbic acid. Electrochim. Acta 2015, 173, 440–447. [Google Scholar] [CrossRef]
- Brondani, D.; Scheeren, C.W.; Dupont, J.; Vieira, I.C. Biosensor based on platinum nanoparticles dispersed in ionic liquid and laccase for determination of adrenaline. Sens. Actuators B Chem. 2009, 1, 252–259. [Google Scholar] [CrossRef]
- Seifati, S.M.; Nasirizadeh, N.; Azimzadeh, M. Nano-biosensor based on reduced graphene oxide and gold nanoparticles, for detection of phenylketonuria-associated DNA mutation. IET Nanobiotechnol. 2018, 12, 417–422. [Google Scholar] [CrossRef]
Disclaimer/Publisher’s Note: The statements, opinions and data contained in all publications are solely those of the individual author(s) and contributor(s) and not of MDPI and/or the editor(s). MDPI and/or the editor(s) disclaim responsibility for any injury to people or property resulting from any ideas, methods, instructions or products referred to in the content. |
© 2023 by the authors. Licensee MDPI, Basel, Switzerland. This article is an open access article distributed under the terms and conditions of the Creative Commons Attribution (CC BY) license (https://creativecommons.org/licenses/by/4.0/).