Abstract
Temperature- and humidity-sensing properties were evaluated of NixMg1-x spinel ferrites (0 ≤ x ≤ 1) synthesized by a sol-gel combustion method using citric acid as fuel and nitrate ions as oxidizing agents. After the exothermic reaction, amorphous powders were calcined at 700 °C followed by characterization with XRD, FTIR, XPS, EDS and Raman spectroscopy and FESEM microscopy. Synthesized powders were tested as humidity- and temperature-sensing materials in the form of thick films on interdigitated electrodes on alumina substrate in a climatic chamber. The physicochemical investigation of synthesized materials revealed a cubic spinel phase, nanosized but agglomerated particles with a partially to completely inverse spinel structure with increasing Ni content. Ni0.1Mg0.9Fe2O4 showed the highest material constant (B30,90) value of 3747 K and temperature sensitivity (α) of −4.08%/K compared to pure magnesium ferrite (B30,90 value of 3426 K and α of −3.73%/K) and the highest average sensitivity towards humidity of 922 kΩ/%RH in the relative humidity (RH) range of 40–90% at the working temperature of 25 °C.
1. Introduction
Spinel ferrites are metal oxides with the general formula MFe2O4, where M could be Cu, Mg, Ca, Co, Ni, Zn, Mn, Sr, Ba, etc., or may be a combination of different metal cations. Ferrites have a spinel structure, which is defined by 16 d octahedral positions, called B-sites, and 8 tetrahedral positions, called A-sites, occupied by metal cations, while 32 e positions at polyhedron vertexes are occupied by O ions []. Spinels can be normal, where all B-sites are occupied by Fe ions and all A-sites are occupied by other metal cations, wherein the inversion degree λ is zero and the formula is , or inverse, when iron ions occupy A-sites and more Fe ions and other cations occupy B-sites. Parameter λ is then 1, and the formula is []. Spinels can be partially inverse, with the inversion parameter ranging between 0 and 1; the resulting formula is , with λ representing the inversion degree.
Due to their magnetic, electric, dielectric and optical properties, natural abundance and also high biocompatibility, spinel ferrites, especially in nano form, have been the subject of much research for application in gas sensing [], water and wastewater treatment [], adsorption [], catalysis [] and photocatalysis [], as magnetic nanocarriers for medical applications [] and more recently for energy storage [].
Many different and versatile methods have been applied for the synthesis of ferrites and include high-temperature solid-state synthesis from oxides as precursors [,], thermal decomposition of metal nitrates [], pulsed laser deposition [], sol-gel synthesis [], co-precipitation [], chemical vapor deposition [] and others [], depending on the cost, simplicity and also the desired morphology and particle size. The electric, electromagnetic and optical characteristics of the resulting ferrites are dependent on their synthesis conditions, cation substitution, inversion degree and elemental composition []. Citrate combustion synthesis is a popular synthesis method because of the short reaction time, cheap chemicals and citrate serving as a chelating agent and fuel at the same time []. Citrate combustion synthesis, as a sol-gel synthesis, ensures the obtaining of highly crystalline nanoparticle powders [].
Monitoring humidity is a widespread necessity for the sake of human health and safety, and also for the quality of products and efficacy of industrial processes. Most of the commercially available humidity sensors measure relative humidity, and they can be categorized based on material types or operating principle. As for material types, those could be ceramic/semiconductor, polymer or hybrid materials. All of the mentioned detect and measure humidity by absorbing and desorbing water molecules, which change physical and electrical properties such as impedance, capacitance, electrical resistance and others []. Ceramic-type humidity sensors exhibit advantages over polymer films such as physical stability and chemical and thermal resistance [].
Temperature sensing is another scientific and engineering discipline employed in almost every aspect of human life. The main types of temperature sensors are thermocouples, RTDs, thermistors and semiconductor-based ICs. Thermistors respond to temperature with impedance and resistance changes. Metal oxide spinels are mainly NTC (negative temperature coefficient) thermistors, which means that with an increase in temperature, their electric impedance decreases. The change can be described by the Arrhenius equation, with the B-value determining the steepness of the temperature change. Ceramic NTC thermistors are low-cost, simple to synthesize and chemically and physically stable. “They offer the best sensitivity and accuracy at the lowest price” [].
We incorporated citrate synthesis into this work to synthesize mixed Ni-Mg ferrites. While both magnesium ferrite and nickel ferrite have been tested as humidity sensors [,], neither has been considered as a temperature sensor, so detailed research has been conducted in this work to comprehend the impact of combining nickel and magnesium in a ferrite material with regard to its sensing properties.
2. Materials and Methods
The materials used in this synthesis are citric acid (Sigma Aldrich, ACS, St. Louis, MI, USA) and the metal nitrates Mg(NO3)2 ·6 H2O (Sigma Aldrich, puriss, p. a.), Ni(NO3)2·6 H2O (Sigma Aldrich, purum, p. a.), and Fe(NO3)3 ·9 H2O (Sigma Aldrich, puriss, p. a.).
The sol-gel combustion method with citric acid as a reducing agent and nitrate ions as oxidizers was used to synthesize nickel–magnesium ferrites NixMg1-xFe2O4, with x = 0, 0.1, 0.3, 0.5, 0.7, 0.9 and 1. The precursory nickel, magnesium and iron nitrate 1 M aqueous solutions were mixed and put on a heated magnetic stirrer. Water was evaporated from the mixture at 80 °C until a gel was formed. Then, the temperature was set to 250 °C until the combustion reaction occurred. The resulting powders were amorphous, brown-black in color, very light and flaky. Powders were calcined in a chamber furnace for 3 h at 700 °C with a heating rate of 10 °C/min.
To study the powder structure, X-ray diffraction (XRD) data were acquired using a PANalytical X’Pert PRO diffractometer in Bragg–Bretano geometry with a scattering angle from 10 to 120°, a step of 0.017 s, a hold time of 24.76 s and Co K𝛼 radiation (wavelength of 1.78901 Å). Room temperature Raman spectra (Raman shift region of 150–1000 cm−1, 2.5 mW power at sample) were taken with an XploRA (Horiba Jobin Yvon) spectrometer with a 532 nm laser. An FTIR Nicolet 6700 ATR device (range 400–2000 cm−1, resolution 4 cm−1) was used to collect Fourier transform infrared (FTIR) spectra. To study the powder morphology and microstructure, field emission scanning electron microscopy (FESEM) was applied on a TESCAN MIRA3 XM and ZEISS GeminiSEM 360 with an Oxford Instruments EDX. An FEI Talos F200X microscope operated at 200 kV was used to collect transmission electron microscopy (TEM) micrographs. To study the elemental composition, X-ray photoelectron spectroscopy (XPS) was performed by a SPECS System with an XP50M X-ray source for a Focus 500 and PHOIBOS 100/150 analyzer (AlKα source (1486.74 eV) at 12.5 kV and 32 mA). A constant pass energy of 40 eV, step size of 0.5 eV and dwell time of 0.2 s in the FAT mode were applied to record survey spectra with a 0–1000 eV binding energy and at a pressure of 9 × 10⁻⁹ mbar using the SpecsLab data analysis software. A constant pass energy of 20 eV, step size of 0.1 eV and dwell time of 2 s in the FAT mode were applied to record detailed spectra of Mg 1s, Ni 2p, and Fe 2p peaks. All the peak positions were referenced against C 1s at 284.5 eV. The commercial CasaXPS software package was used to analyze all recorded spectra.
Humidity and temperature sensing measurements were performed in a JEIO TECH TH-KE-025 humidity and temperature climatic chamber with the relative humidity (RH) ranging from 40 to 90% (at T = 25 °C) and the temperature ranging from 25 to 90 °C (at RH = 40%). The spinel ferrite powders were mixed with water and ultrasonically dispersed to prepare a paste that was drop-cast on interdigitated Au electrodes on a ceramic substrate (Drop Sense IDEAU200). After drying at 50 °C, the paste formed a thick film (as shown in Figure 1). The thick film layer was measured with a laboratory micrometer, and the average thickness was estimated as 100 μm. Impedance was measured with a Hioki LCR 3536 analyzer in the frequency range of 8 Hz–1 MHz at a voltage of 1 V.
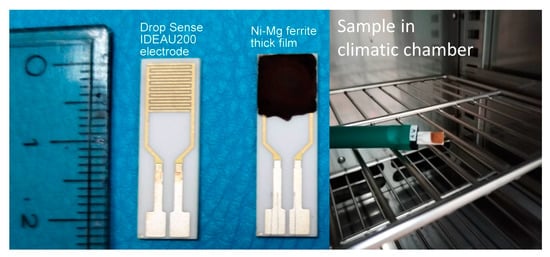
Figure 1.
Ni-Mg ferrite thick film sample, used electrodes and setup in climatic chamber.
3. Results and Discussion
3.1. Structural Characterization
Analysis of the measured XRD diffractograms of synthesized nickel–magnesium ferrite powders (Figure 2) using the HighScorePlus software showed well-resolved, highly crystalline peaks that can be indexed as a cubic spinel structure (space group ), taking into account ICSD cards 98-016-7491 and 98-024-6894 for MgFe2O4 and NiFe2O4, respectively. Traces of hematite (ICSD 98-002-2505) were noted also, and the hematite content varied depending on the composition (Table 1), which is in accordance with previous results []. The Scherrer equation was used to calculate the crystallite size, as shown in Table 1. It varied in the range 30–39 nm, with 39 nm obtained for pure nickel ferrite and 37 nm obtained for pure magnesium ferrite. If we observe the (311) peak of the cubic spinel structure more closely, as shown in Figure 2b, we can note that the substitution of magnesium for nickel in magnesium ferrite led to a slight shift of the diffraction peak to higher values. The shift of diffraction peaks can be attributed to the fact that Ni2+ has a smaller ionic radius of 0.69 Å compared to the Mg2+ ionic radius of 0.72 Å, so when nickel is exchanged for magnesium, the lattice volume shrinks slightly. This has been noted before for Mg- or Zn (A)-substituted Ni1-xAxFe2O4 [] and cobalt-substituted nickel ferrites []. The introduction of Mg or Zn with a larger ionic radius (0.72 and 0.74 Å) instead of Ni, with a smaller ionic radius (0.69 Å), led to a small distortion of the lattice and a shift of diffraction peaks []. Rietveld refinement enabled determination of the lattice constant and inversion degree, as shown in Table 1. Good agreement between measured and fitted data was observed, as shown in the example given in Figure 2c for Ni0.3Mg0.7Fe2O4.
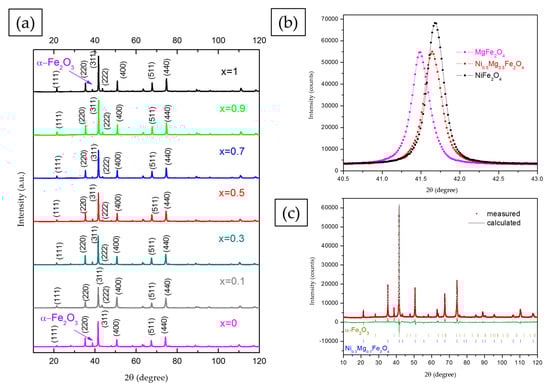
Figure 2.
XRD patterns of NixMg1-xFe2O4 (0 ≤ x ≤ 1) (a); (311) peak shift with magnesium substitution with nickel (b); and refined XRD diffractogram of Ni0.3Mg0.7Fe2O4 (c).

Table 1.
Lattice parameters, inversion degree, crystallite size and hematite content determined for NixMg1-xFe2O4 (0 ≤ x ≤ 1).
In cubic spinel ferrites the lattice constant, peak position, peak intensity ratio and inversion degree of the spinel structure also depend greatly on the cation distribution on A and B sites []. In the case of magnesium ferrite, there are varied opinions on the preference of magnesium ions for tetrahedral and octahedral sites, and magnesium ferrite has most often been described as a “partially inverse spinel” ferrite with magnesium ions present at both tetrahedral and octahedral sites [,]. In our previous work magnesium ferrite synthesized using the sol-gel combustion method and citric acid as fuel showed a partially inverse spinel structure, [Mg0.21Fe0.79]A[Mg0.79Fe1.21]BO4, with Mg2+ ions at both A and B sites []. The substitution of magnesium with nickel leads to changes in the lattice parameters, peak position, peak intensity ratio and other parameters of the cubic spinel structure [,]. Nickel ions show a strong preference for octahedral (B) sites both in pure nickel ferrite—where often all nickel ions are located at octahedral sites, with Fe3+ ions at both tetrahedral and octahedral sites []—and in mixed metal spinel structures such as magnesium–nickel ferrites [,,]. This was the case in this work, as Rietveld analysis showed that when nickel substituted Mg, it was located at octahedral sites, while Mg2+ and Fe3+ were distributed between octahedral and tetrahedral sites. The inversion degree was 0.8 for compositions with x = 0.1, 0.3 and 0.5, with the cation distribution as follows: [Mg0.2Fe0.8]A[Mg0.7Ni0.1Fe1.2]BO4, [Mg0.2Fe0.8]A[Mg0.5Ni0.3Fe1.2]BO4 and [Mg0.2Fe0.8]A[Mg0.3Ni0.5Fe1.2]BO4, respectively. For x = 0.7, 0.9 and 1 (pure nickel ferrite), the inversion degree was determined as 1, making the cation distribution [Fe1]A[Mg0.3Ni0.7Fe1]BO4, [Fe1]A[Mg0.1Ni0.9Fe0.5]BO4 and [Fe1]A[Ni1Fe1]BO4, respectively. The determined lattice parameter values for NixMg1-xFe2O4 powders also varied with the cation distribution and were higher for samples with higher Mg content, as noted before [,].
Raman spectra of synthesized samples are shown in Figure 3a. The spectra of MgFe2O4 and NiFe2O4 samples are similar to those already reported in the literature, when considering completely or partially inverse spinel structures [,,,,]. It is known that in the case of completely inverse or normal spinel structure, five first-order Raman-active modes are expected (A1g + Eg + 3T2g) [,,], and all of those five peaks are observed in spectra in Figure 3a, even though the T2g(3) mode becomes very weak in MgFe2O4.
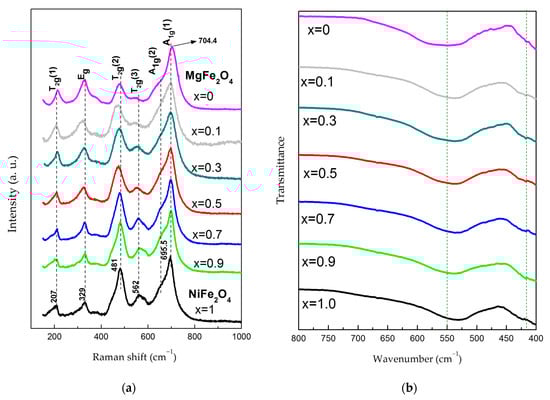
Figure 3.
(a) Raman spectra and (b) FTIR spectra of synthesized NixMg1-xFe2O4 (0 ≤ x ≤ 1).
According to the literature, the A1g peak originates from a symmetric stretching vibration of oxygen within the tetrahedral AO4 groups, i.e., symmetric stretching of (Fe/M)–O bonds for metal ions at the tetrahedral sites (tetrahedral breath mode) [,,]. Although some authors report that modes below 600 cm−1 originate from the vibrations of ions in the octahedral group [,,], others claim that this refers only to the T2g(2) and T2g(3) modes, which originate from asymmetric stretching and asymmetric bending of (Fe/M)–O bonds, respectively, while T2g (1) comes from translational vibration of the whole AO4 tetrahedron. The Eg mode is mostly attributed to symmetric bending vibrations of oxygen with respect to cations in tetrahedral surroundings [,,]. The spectra in Figure 3a show the asymmetry of Raman peaks, indicating the occurrence of the additional modes, which is common for spinel ferrites, especially nanocrystalline ferrites. Even though a certain asymmetry of Raman peaks for nanocrystalline samples may be caused by the confinement effect [,], the redistribution of cations (M2+ and Fe3+) between octahedral and tetrahedral sites has been recognized as the main reason for the asymmetry of Raman modes in spinel ferrites. In this regard, some authors assign the occurrence of additional modes to the non-equivalent bonds caused by different metal ions in octahedral positions (in partially or completely inverse spinels) and to the short-range ordering of M2+ and Fe3+ ions at the B site, which induces the lowering of the symmetry [,,,,]. On the other hand, the distribution of M2+ cations between A and B positions is also often reported as the cause of the appearance of additional modes [,,,,,]. Having in mind the latter, it is important to outline that the spectra of the ferrites NiFe2O4 and MgFe2O4 generally have a pronounced asymmetry of the A1g peak, indicating the splitting of this peak into the A1g(1) and A1g(2) modes, and such an effect is also perceived in our spectra. Considering the existence of different cations at tetrahedral positions as the possible reason for A1g peak splitting, in the case of partially inverse spinels, some authors attribute the Mg–O bond to the A1g(1) mode in MgFe2O4 [,], while others ascribe the same bond to the A1g(2) mode []. However, some research indicates that in completely inverse spinels, both the A1g (1) and A1g (2) modes can originate only from the contribution of Fe-O bonds in tetrahedral coordination [].
When considering the spectra of the NixMg1-xFe2O4 system in Figure 3a, it can be concluded that the addition of Ni to MgFe2O4 causes an alteration in the relative intensity, shape and position of Raman peaks. Namely, with increase in the x value from 0 to 0.5, an increase in relative intensity as well as a certain change of the shape of the T2g(3) and T2g(2) modes are observed, probably due to more pronounced incorporation of Ni2+ ions into octahedral positions, i.e., due to the occurrence of both Ni2+ and Mg2+ ions as M ions at these sites. Along with that, changes in the Eg mode are also noticed. When x exceeds the value of 0.5, a certain modification of the shape and width of the A1g peak becomes evident compared to the lower x values, which together with the results of Rietveld analysis may indicate that the incorporation of Mg2+ ions into the tetrahedral positions becomes negligible. There is also an additional difference in the relative intensity, shape and position of the T2g(3) and T2g(2) modes, with respect to the samples with x ≤ 0.5, which may be a consequence of the dominant presence of Ni2+ and Fe3+ ions at octahedral positions for the higher values of x. Taking into account the modifications of the shape and intensity of the T2g(3) mode with a change of x, it could be assumed that the shoulder effect detected at 585–590 cm−1 in NiFe2O4 originates from Ni2+ ions at B sites, while the mode at 562 cm−1 comes from Fe3+ ions at B sites. It is also possible that those modes are influenced by the creation of Fe2+ ions, as well as by the creation of pairs of Fe2+ and Ni3+ ions in NiFe2O4, because of the charge transfer between Fe3+ and Ni2+ at the B sites. Namely, the mentioned mechanism is a leading cause of conductivity in NiFe2O4 nanoparticles []. A slight shift of the A1g(1) mode towards lower values with an increase of x was also detected, which is in accordance with investigations by D. Varshney and K. Verma []. The shift may be a result of the higher atomic mass of Ni2+ as compared to the Mg2+ion. An analogous shift is also noted for the T2g(1) peak.
The measured FTIR spectra of calcined NixMg1-xFe2O4 powders are displayed in Figure 3b in the range of 400–800 cm−1. No other bands were detected because there are no organic phases present in the synthesized powders, but only peaks originating from the cubic spinel structure, as shown in Figure 3b. The band in the range of 400–450 cm−1 originates from metal–oxygen vibrations at the octahedral sites, while the band in the range of 510–550 cm−1 is due to stretching vibration of the metal–oxygen bond at tetrahedral sites [,]. Analysis of the band position shows that there is a peak shift to lower wavenumbers of the band showing Mg, Ni, Fe-O bonds at the tetrahedral sites with an increase in x starting from about 550 cm−1 for MgFe2O4 and ending at about 530 cm−1 for NiFe2O4. The lowering of the vibration frequency can be explained if we consider the higher atomic mass of Fe, which is 55.845 a.u. compared to the 24.305 a.u. of magnesium. Heavier iron ions replace magnesium ions at the tetrahedral sites (while nickel ions have a preference for octahedral sites and replace magnesium and iron ions), causing the vibration energy to decline and the band to move to lower wavenumbers. The bands showing metal–oxygen bonds at the octahedral sites are in similar positions, from 414 cm−1 for MgFe2O4 to 422 cm−1 for NiFe2O4. In MgFe2O4, the partially inverse structure means that most of the octahedral sites are occupied by Fe ions. With the addition of nickel, for x = 0.7, 0.9 and 1, the structure is completely inverse, and octahedral sites are evenly occupied by Ni and Fe ions. There is no significant shift due to the interchanging of iron ions with nickel ions at the octahedral sites, as they have similar ionic radii and atomic masses, 58.7 a.u. compared to 55.8 a.u., respectively.
3.2. Morphology
Obtained FESEM micrographs are displayed in Figure 4a–c and Figure S1. The synthesized NixMg1-xFe2O4 powders are composed of nanocrystalline particles with a spherical shape and noticeable agglomeration, similar to published research on magnesium and nickel spinel ferrites [,]. Calcination caused coarsening of the agglomerates in the synthesized powders []. As the nickel content was higher, the structure was more compact. A similar phenomenon was observed for mixed Mg-Co spinel ferrites when the cobalt amount increased []. Strong agglomeration in synthesized powders, especially in the ones with high nickel content, can be explained by the magnetic nature of the material []. A similar phenomenon was noticed in TEM images, where also agglomeration was the lowest for MgFe2O4 and the highest for NiFe2O4.
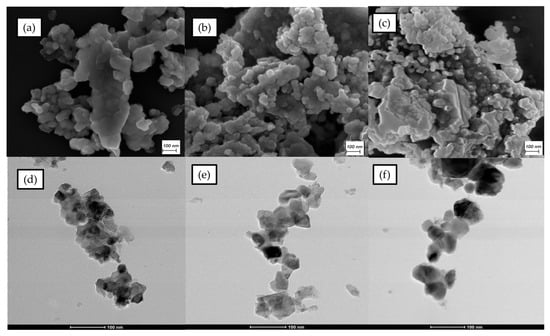
Figure 4.
FESEM and TEM images of MgFe2O4 (a,d); Ni0.5Mg0.5Fe2O4 (b,e); and NiFe2O4 (c,f).
High-resolution TEM (HRTEM) images of selected areas of MgFe2O4, Ni0.5Mg0.5Fe2O4 and NiFe2O4 individual particles are shown in Figure 5. Analysis of periodic lattice fringes was performed using fast Fourier transform (FFT) analysis (insets in Figure 5) and revealed crystal lattice spacings of the (311), (220) and (111) planes of the cubic spinel phase, measured as 0.25, 0.29 and 0.48 nm, respectively. Though analysis of XRD diffractograms showed that the cation (Mg, Ni and Fe) distribution and composition influenced the peak position, inversion degree and lattice parameter values (Figure 2 and Table 1), it was not possible to determine noticeable differences in crystal lattice spacing values, but the high crystallinity degree of the powder samples was confirmed.
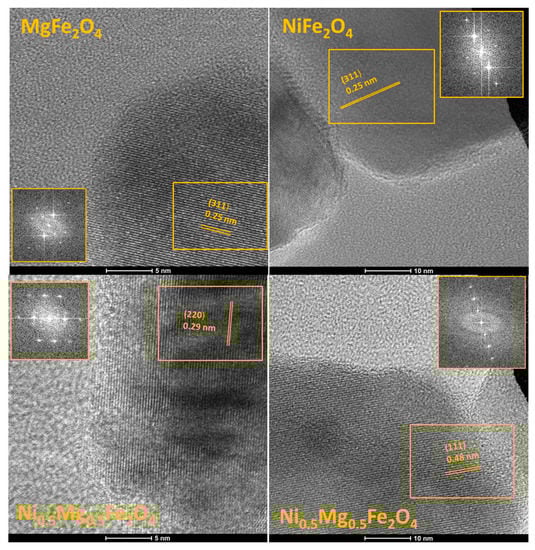
Figure 5.
HRTEM micrographs of selected MgFe2O4, Ni0.5Mg0.5Fe2O4 and NiFe2O4 particles showing crystal lattice planes with d-spacing of 0.25, 0.29 and 0.48 nm, confirming the presence of (311), (220) and (111) crystal faces of the cubic spinel lattice phase.
3.3. Elemental Composition and Surface Analysis
The elemental compositions of MgFe2O4, Ni0.5Mg0.5Fe2O4 and NiFe2O4 were determined by EDX analysis. The results showed that magnesium, nickel and iron were homogeneously distributed in the Ni5Mg0.5Fe2O4 powder samples (Figure 6a,b). The carbon present in the sample comes from the process of fuming the sample with carbon powder to enable the measurement. The silicon in the spectra comes from the supporting material for the measured samples and as shown in Figure 6b is surrounding the powder samples. Quantitative elemental analysis was conducted by measuring spectra on several points of each material and calculating the average elemental percentage, such as in Figure 6c for Ni0.5Mg0.5Fe2O4. Elemental quantitative analysis of all three investigated materials corresponded well to the desired stoichiometry, as presented in Figure 6d. A slight oxygen deficiency has been noted before in magnesium ferrite and nickel ferrite, and it may be explained by the abundance of oxygen vacancies which occur throughout the sol-gel combustion synthesis process and subsequent sintering treatment [,].
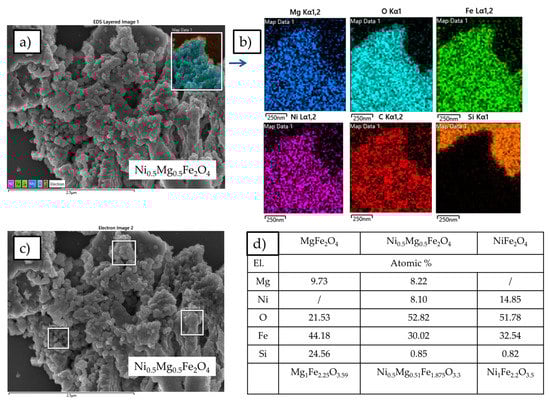
Figure 6.
(a) SEM micrograph collected on Ni0.5Mg0.5Fe2O4; (b) Elemental mapping of Mg0.5Ni0.5Fe2O4 inferred from Energy dispersive spectrometry (EDX) coupled to SEM; (c) Selected area for EDX analysis and (d) Table with quantitative elemental analysis and resulting stoichiometry.
The chemical states of the compositional elements contained in nickel–magnesium ferrites were analyzed by XPS, as illustrated in the survey scan spectrum in Figure 7. X-ray photoelectron spectroscopy can examine the elemental composition, oxidation states and chemical states of the elements in a sample by determining binding energies that correspond to the specific chemical bonds of present elements []. When considering spinel ferrite systems, XPS peak positions are dependent on cation distribution because the same cations, depending on their octahedral or tetrahedral coordination (A and B sites), have different cation–oxygen bond lengths and therefore different bond energies []. Because bonds in an octahedral coordination are longer and weaker than bonds in a tetrahedral coordination, we expect octahedral bonds to occur at lower binding energy values [,,].
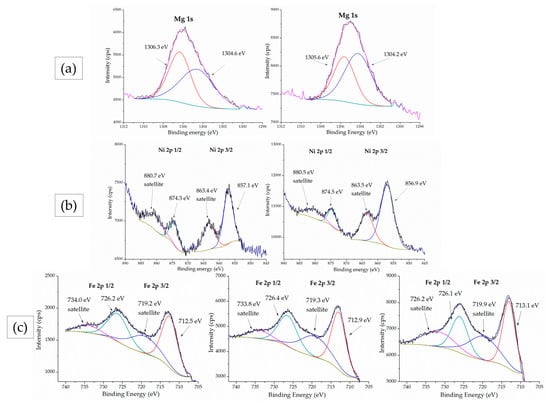
Figure 7.
XPS spectra of: (a) Mg 1s, (b) Ni 2p and (c) Fe 2p peaks for the materials MgFe2O4, Ni0.5Mg0.5Fe2O4 and NiFe2O4, from top to bottom.
The Mg 1s peak (Figure 7a) is found at 1306.1 eV for both MgFe2O4 and Ni0.5Mg0.5Fe2O4. The positions of the peaks indicate that all magnesium ions are in a 2+ oxidation state. The peak positions are in accordance with the results that were obtained by Mittal et al. []. Dhanyaprabha et al. [] attributed this peak to a purely tetrahedral Mg2+. On the other hand, Mittal et al. [] deconvoluted the Mg 1s peak into two components to obtain the distribution of Mg2+ ions at tetrahedral and octahedral sites. Similarly, we deconvoluted the Mg 1s peak into 1306.3 and 1305.6 eV (the left, tetrahedral component) and 1304.6 and 1304.2 eV (the right, octahedral component) for MgFe2O4 and Ni0.5Mg0.5Fe2O4, respectively. The results show that magnesium ions are coordinated at both tetrahedral and octahedral sites.
The nickel 2p peak is shown in Figure 7b for Mg0.5Ni0.5Fe2O4 and NiFe2O4. Ni 2p 1/2 and 3/2 peaks were identified at 857.1 eV (with its satellite peak at 863.4 eV) and 874.3 eV (with its satellite peak at 880.7 eV), respectively, for Ni0.5 Mg0.5Fe2O4 and at 856.9 eV (satellite 863.5 eV) and 874.5 eV (satellite 880.5 eV), respectively, for NiFe2O4. All of the peak positions are in accordance with the already published results and originate from the Ni2+ ion [,]. The distance between the main Ni 2p 3/2 peak and its satellite peak is 6.3 eV for Ni0.5Mg0.5Fe2O4 and 6.6 eV for NiFe2O4. Töpfer et al. [] attributed the increase in this distance to more octahedrally coordinated nickel ions and the increase in inversion degree, which is in accordance with our findings that all additional nickel ions prefer octahedral sites.
The Fe 3p spectra in Figure 7c show two characteristic doublet peaks, 2p ½ and 2p 3/2, along with their satellite peaks. The peaks were fitted, and their positions are located at 726.2 eV (satellite at 734.0 eV) and 712.5 eV (satellite 719.2 eV), respectively, for MgFe2O4; 726.4 eV (satellite 733.8 eV) and 712.9 eV (satellite 719.3 eV), respectively, for Mg0.5Ni0.5Fe2O4; and 726.1 eV (satellite 731.8 eV) and 713.1 eV (satellite 719.9 eV), respectively, for NiFe2O4. These peaks are attributed to Fe in a 3+ oxidation state []. The positions of the peaks are in good agreement with already published results for Fe in spinels [].
XPS enables quantitative elemental surface analysis. The results are summarized in Table 2. Both MgFe2O4 and Mg0.5Ni0.5Fe2O4 show higher Mg/Fe and Mg/Ni ratios than expected. The Mg/Fe ratio is 2.147 in MgFe2O4 and 0.6 in Mg0.5Ni0.5Fe2O4. The Mg/Ni ratio is 7.6 in Mg0.5Fe0.5Fe2O4, while the Ni/Fe ratio in NiFe2O4 is 0.58, which is close to the expected stoichiometric ratio of 0.5. The differences between values obtained by XPS and the expected stoichiometric values can be attributed to the fact that only the first 10 nm of surface are analyzed by XPS, which shows different values than the bulk material. The magnesium-rich surface has already been noted in the literature [,], and it is explained by the higher Mg2+ ion mobility [].
Table 2.
Quantitative surface elemental analysis obtained by X-ray photoelectron spectroscopy.
3.4. Temperature Sensing
In the measured temperature range (30–90 °C) at a set RH of 40% for all analyzed NixMg1-xFe2O4 thick film samples except pure NiFe2O4, we noted a noticeable decrease of DC resistance with an increase in temperature, indicating that nickel–magnesium ferrites show NTC thermistor properties. An example of the change of normalized electrical resistance for samples of Ni0.7Mg0.3Fe2O4, Ni0.5Mg0.5Fe2O4 and Ni0.1Mg0.9Fe2O4 is shown in Figure 8. The results show that the degree of change depended on the composition (Ni content). For pure NiFe2O4 the change of resistance with temperature was small. This is probably due to the fact that we obtained p-type nickel ferrite rather than n-type, which influences the materials’ conductivity. According to Sutka et al. [] nickel ferrite with an inverse spinel structure is commonly p-type. With an increase in environmental temperature, the resistance of NTC thermistors decreases in accordance with the Arrhenius equation []:
where B is the B-value, a material constant that describes the resistance change; is the resistance at infinite temperature; and T is the measured temperature. The slope of the linear fit of the graph of ln R = f(1/T) represents the B-value (as shown in the example given in the inset in Figure 8), which should be 2000–5000 K in order to be adequate for use in temperature sensors []. The calculated B30/90 values for the synthesized nickel–magnesium ferrites are shown in Table 3.
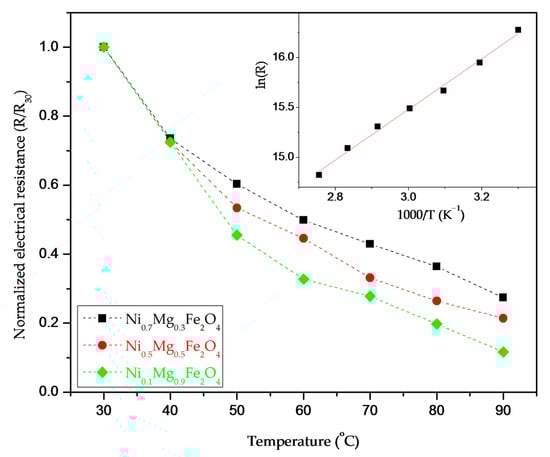
Figure 8.
Change of DC resistance of Ni0.7Mg0.3Fe2O4, Ni0.5Mg0.5Fe2O4 and Ni0.1Mg0.9Fe2O4 in the temperature range of 30–90 °C; inset represents estimation of the material constant for Ni0.7Mg0.3Fe2O4.
Table 3.
Material constant (B30/90), temperature sensitivity (α), activation energy for conduction (Ea) and activation energy for the relaxation process (Er).
The obtained values varied with the nickel content, and except for Ni0.9Mg0.1Fe2O4 and pure nickel ferrite, these values were within the range used in commercial NTC bulk ceramics (2000–5000 K), showing that magnesium ferrite and nickel–magnesium ferrites can be applied in temperature sensing as NTC materials []. The highest material constant B30/90 was obtained for Ni0.1Mg0.9Fe2O4 as 3747 K, followed by pure magnesium ferrite with a B30/90 of 3426 K. The temperature sensitivity at room temperature (30 °C) was determined as α = 1/R·dR/dT = −B/T2, and the obtained values are shown in Table 3. For Ni0.1Mg0.9Fe2O4 we obtained α = −4.08%/K, and this value is comparable with commercial NTC devices (−4%/K). This confirms the potential for applying Ni0.1Mg0.9Fe2O4 in temperature sensing, especially as these values were obtained for thick film samples composed of synthesized powder with no high-temperature treatment, thus enabling future application in flexible electronics where only low-temperature treatment of the sensing layer is possible [].
Further research will involve investigating the aging and resistivity of these materials, as these parameters are also of great significance when selecting NTC thermistor materials for temperature sensing [].
Analysis of the measured impedance for all samples showed a decrease of impedance with an increase in frequency and also with an increase in temperature, as shown in Figure 9a for Ni0.7Mg0.3Fe2O4. The change of impedance with temperature corresponded to the change of DC electrical resistance, so it reduced with increasing nickel content in nickel–magnesium ferrites. The measured complex impedance spectra (Figure 9b) were analyzed using an equivalent circuit (shown as inset in Figure 9b) consisting of a parallel resistance and constant phase element (CPE), reflecting the influence of both grain and grain boundary components and non-ideal Debye capacitance behavior [,]. The temperature dependence of the determined resistance was analyzed using the small-polaron hopping (SPH) model as described in []:
where A0 is the pre-exponential factor, k is the Boltzmann constant, and EA is the activation energy for conduction. The obtained values for the activation energy for conduction are given in Table 3. We can see that the activation energy values vary in relation to the nickel content and decrease with an increase of nickel in nickel–magnesium ferrite samples. The highest value was obtained for Ni0.1Mg0.9Fe2O4, again confirming that a small amount of added Ni improved the temperature-sensing properties of magnesium ferrite. The determined relaxation time also has an Arrhenius dependence on temperature []:
where τ0 is the pre-exponential factor, k is the Boltzmann constant, and Er is the activation energy for the relaxation process at grains and grain boundaries. The values obtained for the activation energy for the relaxation process are given also in Table 3. The highest value was obtained for Ni0.1Mg0.9Fe2O4.
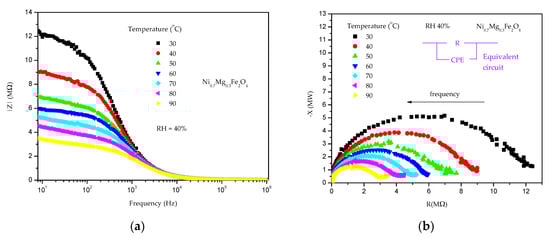
Figure 9.
Change of impedance component (a) and complex impedance (b) with the change in temperature at a constant RH of 40% for Ni0.7Mg0.3Fe2O4.
3.5. Humidity Sensing
Porous semiconducting materials can be used for sensing changes in ambient relative humidity (RH). The principle lying behind the sensing properties is the adsorption of water molecules on the surface of the material. Active sites on the metal oxide surface retain water molecules during humidity exposure. A detailed scheme of the humidity detection mechanism is shown in Figure 10. When the RH is low, water molecules interact with the porous sample surface by forming a chemisorbed layer on the sample surface. Water first dissociates to a hydroxyl that is firmly attached to the surface. The interaction energy is high, and significant energy is required for proton hopping. As the RH increases, a physisorbed layer of double hydrogen-bonded water molecules is formed, followed by further single hydrogen-bonded physisorbed layers. In the layers of the adsorbed water, the high mobility of water molecules and the Grotthus chain reaction cause low energy for proton hopping, increased conductivity and a decrease in the impedance value when the RH is high [,].
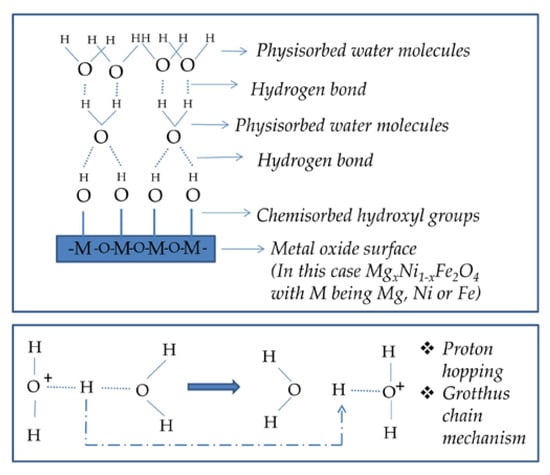
Figure 10.
Scheme of the humidity detection mechanism.
In the case of nickel–magnesium ferrites, all of the synthesized samples were tested at a constant temperature of 25 °C (room temperature). With an increase in relative humidity from 40% to 90%, there is a noticeable decrease in the impedance and complex impedance magnitude in each of the synthesized materials, as shown in Figure 11 for Ni07Mg0.3Fe2O4. The impedance of pure MgFe2O4 decreased 277 times with an RH increase from 40% to 90%, which corresponds well to and is higher than in the research of Jeseentharani et al. [], in whose case the impedance of MgFe2O4 in the form of pellets decreased 230 times from 5% to 98% RH.
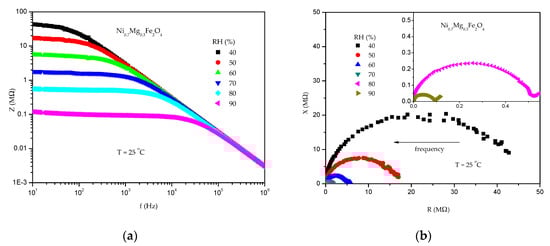
Figure 11.
Change of impedance with frequency (a) and complex impedance (b) in the RH range of 40–90% for Ni0.7Mg0.3Fe2O4.
The impedance decreased also with an increase in frequency (Figure 11a), and the change of the impedance with frequency is larger in the lower frequency range. We selected 100 Hz as the working frequency, and this is commonly the case for humidity sensing with metal oxides []. The complex impedance consisted of one semicircle, which can be noted in Figure 11b, and this can be attributed to overlapping dielectric relaxation processes due to highly conducting grains and the resistive nature of grain boundaries []. The semicircle magnitude decreases with an increase in RH due to the increase in ionic conductivity in accordance with the humidity-sensing mechanism of metal oxides []. The small tail at high RH of 80 and 90% (seen in the inset in Figure 11b) has been noted before for spinel metal oxides and can be attributed to a charge diffusion process [].
The change of impedance with RH at the frequency of 100 Hz is shown in Figure 12a. Magnesium ferrite and nickel–magnesium ferrites with varying nickel contents show a similar trend of impedance decrease with an increase in RH, with a rapid decrease in impedance as soon as the RH starts to increase from RH 40–70%, while the curve shape for nickel ferrite is different, and the impedance decreases only slightly until RH 70% and then more noticeably only in the high RH range of 70–90%. This difference is due to the different conducting mechanisms of p-type nickel ferrite and n-type magnesium ferrite and nickel–magnesium ferrites with varying nickel contents []. A lower impedance in MgFe2O4 compared to NiFe2O4 is also seen in [].
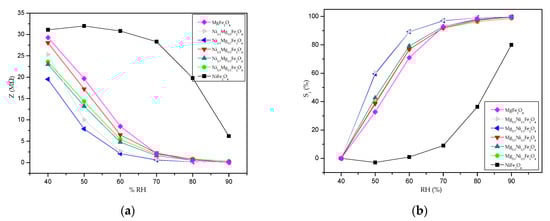
Figure 12.
Impedance change with the relative humidity at 100 Hz for NixMg1-xFe2O4 (a); sensitivity change with relative humidity at 100 Hz (b).
Sensitivity , calculated as:
is the parameter that shows how the impedance is changing in comparison to the starting value (Zmax). Calculated values are shown in Figure 12b. The greatest change in absolute impedance value can be attributed to MgFe2O4 (where it changes from 29.3 MΩ at 40% to 110 kΩ at 90%). All of the synthesized materials except nickel ferrite showed sensitivity values of nearly 100% and a similar trend, while the highest sensitivity of 99.4% is noted for Ni0.1Mg0.9Fe2O4 (where it changes from 25.3 MΩ at 40% to 40 kΩ at 90%); a value of 99.82% is noted for Ni0.5Mg0.5Fe2O4 (where it changes from 28 MΩ at 40% to 50 kΩ at 90%). The most rapid changes of sensitivity for RH in the range of 40–60% were noted for Ni0.1Mg0.9Fe2O4 and Ni0.3Mg0.7Fe2O4.The dissimilar and lower sensitivity of nickel ferrite can be explained by the differences due to p-type conductivity when cation vacancies are present due to oxygen attraction during the calcination/heating process [,].
Another sensitivity/sensor response parameter that is used to characterize the humidity response is , and it presents the ratio between the change of sensor impedance and the RH at 100 Hz [,]. The sensitivity value changed depending on the RH humidity region, in accordance with the humidity-sensing mechanism, as shown in Table 4. For magnesium ferrite and nickel–magnesium ferrites with varying nickel contents, the sensitivity was higher in the lower RH range, and this can be linked to the porous surface of the spinel ferrite thick film. The highest sensitivity towards change in the RH was shown by Ni0.1Mg0.9Fe2O4, with an average sensitivity of 922.6 kΩ/%RH.
Table 4.
Sensitivity of NixMg1-xFe2O4 samples in the RH range of 40–90%, calculated as ΔZ/ΔRH.
Table 5 shows a comparison between the resistance/impedance values in the measured RH range and the sensitivity values determined for different metal oxide humidity sensors in the available literature. The sensing material developed in this work shows good sensitivity and impedance reduction in the analyzed RH range, comparable with other humidity-sensing metal oxides.
Table 5.
Literature comparison of humidity sensing metal oxides.
The response time of a sensor can be measured as the time the sensor needs to reach 90% of the total response when subjected to a specific relative humidity value, while the time required to go back to 90% of the starting signal can be defined as the sensor recovery time. We measured this at 100 Hz with the thick film sensor at room temperature and ambient humidity (estimated at RH 45%) and exposed it to an RH of 90% in the humidity chamber, as shown in Figure 13 for Ni0.1MgFe2O4. The average response time was about 20 s, while the average recovery time was about 45 s. There was no noticeable drift in the signal. Similar results were obtained for the other nickel–magnesium ferrite samples and for magnesium ferrite.
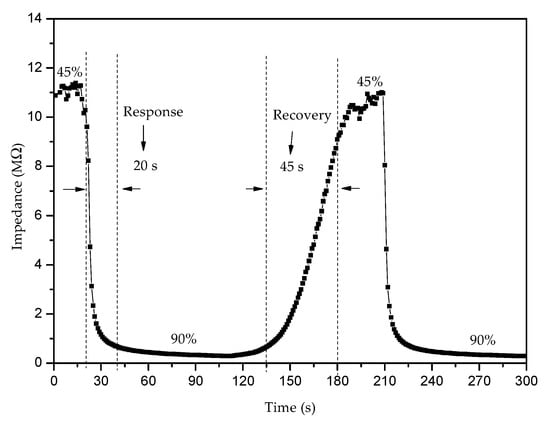
Figure 13.
Response and recovery times obtained for Ni0.1Mg0.9Fe2O4 in the RH range of 45–90% at the working temperature of 25 °C.
The results obtained both for temperature and humidity sensing of Ni0.1Mg0.9Fe2O4 show that this sensing material has potential as a multifunctional material for both temperature and humidity sensing.
4. Conclusions
Through sol-gel combustion synthesis with citric acid as fuel and subsequent calcination (annealing) at 700 °C, we successfully synthesized magnesium–nickel spinel ferrites, NixMg1-xFe2O4 (0 ≤ x ≤ 1). The obtained materials showed a partially or completely inverse cubic spinel structure, nanocrystalline but agglomerated particles and a magnesium-rich surface. All of the synthesized materials showed a response to changes in ambient temperature and humidity, with resistive properties decreasing with increases in relative humidity and temperature. Good sensitivity values were obtained for magnesium ferrite and nickel–magnesium ferrites, while nickel ferrite showed a different kind of conduction mechanism and therefore lower sensing performances. The best response toward temperature and relative humidity changes was shown by Ni0.1Mg0.9Fe2O4. The obtained results comprehensively indicate that doping magnesium ferrite with nickel in small amounts, x = 0.1, increases the activation energy for conduction and enhances the conductivity, which enables a better temperature- and humidity-sensing performance of Ni0.1Mg0.9Fe2O4.
Supplementary Materials
The following supporting information can be downloaded at: https://www.mdpi.com/article/10.3390/chemosensors11010034/s1, Figure S1: FESEM images of NixMg1-xFe2O4 (0 ≤ x ≤ 1).
Author Contributions
M.P.D.: conceptualization, data curation, investigation and writing—original draft; Z.Z.V.: investigation and writing—review and editing; L.R.: investigation and writing—review and editing; V.P.P.: investigation and writing—original draft; S.A.-M.: investigation and writing—review and editing; J.D.V.: investigation and writing—review and editing; M.V.N.: supervision, conceptualization, data curation, investigation, writing—original draft and writing—review and editing. All authors have read and agreed to the published version of the manuscript.
Funding
This research was funded by the Ministry for Education, Science and Technology Development of the Republic of Serbia under contracts 451-03-68/2022-14/200053 (M.P.D, Z.Z.V, M.V.N.), 451-03-68/2022-14/200105 (V.P.P.) and 451-03-68/2022-14/200175 (J.D.V.).
Institutional Review Board Statement
Not applicable.
Informed Consent Statement
Not applicable.
Data Availability Statement
The data presented in this study are available on request from the corresponding author. The data are not publicly available due to ongoing research.
Acknowledgments
We are grateful to Sarra Gam-Derouich and Alexandre Chevillot-Birraud at ITODYS, Université Paris Cité, for their help with SEM, EDS and FTIR measurements.
Conflicts of Interest
The authors declare no conflict of interest. The funders had no role in the design of the study; in the collection, analyses or interpretation of data; in the writing of the manuscript; or in the decision to publish the results.
References
- Zhao, Q.; Yan, Z.; Chen, C.; Chen, J. Spinels: Controlled Preparation, Oxygen Reduction/Evolution Reaction Application, and Beyond. Chem. Rev. 2017, 117, 10121–10211. [Google Scholar] [CrossRef]
- Šutka, A.; Gross, K.A. Spinel ferrite oxide semiconductor gas sensors. Sens. Actuators B Chem. 2016, 222, 95–105. [Google Scholar] [CrossRef]
- Kefeni, K.K.; Mamba, B.B.; Msagati, T.A. Application of spinel ferrite nanoparticles in water and wastewater treatment: A review. Sep. Purif. Technol. 2017, 188, 399–422. [Google Scholar] [CrossRef]
- Li, Y.; Wang, T.; Zhang, S.; Zhang, Y.; Yu, L.; Liu, R. Adsorption and electrochemical behavior investigation of methyl blue onto magnetic nickel-magnesium ferrites prepared via the rapid combustion process. J. Alloys Compd. 2021, 885, 160969. [Google Scholar] [CrossRef]
- Qin, H.; He, Y.; Xu, P.; Huang, D.; Wang, Z.; Wang, H.; Wang, Z.; Zhao, Y.; Tian, Q.; Wang, C. Spinel ferrites (MFe2O4): Synthesis, improvement and catalytic application in environment and energy field. Adv. Colloid Interface Sci. 2021, 294, 102486. [Google Scholar] [CrossRef] [PubMed]
- Kefeni, K.K.; Mamba, B.B. Photocatalytic application of spinel ferrite nanoparticles and nanocomposites in wastewater treatment: Review. Sustain. Mater. Technol. 2019, 23, e00140. [Google Scholar] [CrossRef]
- Amiri, M.; Salavati-Niasari, M.; Akbari, A. Magnetic nanocarriers: Evolution of spinel ferrites for medical applications. Adv. Colloid Interface Sci. 2019, 265, 29–44. [Google Scholar] [CrossRef] [PubMed]
- Malaie, K.; Ganjali, M.R. Spinel nano-ferrites for aqueous supercapacitors; linking abundant resources and low-cost processes for sustainable energy storage. J. Energy Storage 2020, 33, 102097. [Google Scholar] [CrossRef]
- Mittal, V.; Bera, S.; Nithya, R.; Srinivasan, M.; Velmurugan, S.; Narasimhan, S. Solid state synthesis of Mg–Ni ferrite and characterization by XRD and XPS. J. Nucl. Mater. 2004, 335, 302–310. [Google Scholar] [CrossRef]
- Anumol, C.N.; Chithra, M.; Rout, S.; Sahoo, S.C. Effect of Magnesium Substitution on Structural and Magnetic Properties of Nickel Ferrite Nanoparticles. J. Supercond. Nov. Magn. 2019, 33, 1611–1617. [Google Scholar] [CrossRef]
- Varshney, D.; Verma, K. Substitutional effect on structural and dielectric properties of Ni1−xAxFe2O4 (A = Mg, Zn) mixed spinel ferrites. Mater. Chem. Phys. 2013, 140, 412–418. [Google Scholar] [CrossRef]
- Almessiere, M.A.; Slimani, Y.A.; Hassan, M.; Gondal, M.A.; Cevik, E.; Baykal, A. Investigation of hard/soft CoFe2O4/NiSc0.03Fe1.97O4 nanocomposite for energy storage applications. Int. J. Energy Res. 2021, 45, 16691–16708. [Google Scholar] [CrossRef]
- Nair, V.; Jose, R.; Raju, K.; Wariar, P. Optimization of citrate complex combustion for synthesis of transition metal oxide nanostructures. J. Alloys Compd. 2013, 552, 180–185. [Google Scholar] [CrossRef]
- Farahani, H.; Wagiran, R.; Hamidon, M.N. Humidity Sensors Principle, Mechanism, and Fabrication Technologies: A Comprehensive Review. Sensors 2014, 14, 7881–7939. [Google Scholar] [CrossRef] [PubMed]
- Feteira, A. Negative Temperature Coefficient Resistance (NTCR) Ceramic Thermistors: An Industrial Perspective. J. Am. Ceram. Soc. 2009, 92, 967–983. [Google Scholar] [CrossRef]
- Priya, R.S.; Chaudhary, P.; Kumar, E.R.; Balamurugan, A.; Srinivas, C.; Prasad, G.; Yadav, B.; Sastry, D. Evaluation of structural, dielectric and electrical humidity sensor behaviour of MgFe2O4 ferrite nanoparticles. Ceram. Int. 2021, 47, 15995–16008. [Google Scholar] [CrossRef]
- Dumitrescu, A.; Lisa, G.; Iordan, A.; Tudorache, F.; Petrila, I.; Borhan, A.; Palamaru, M.; Mihailescu, C.; Leontie, L.; Munteanu, C. Ni ferrite highly organized as humidity sensors. Mater. Chem. Phys. 2015, 156, 170–179. [Google Scholar] [CrossRef]
- Nandan, B.; Bhatnagar, M.; Kashyap, S.C. Cation distribution in nanocrystalline cobalt substituted nickel ferrites: X-ray diffraction and Raman spectroscopic investigations. J. Phys. Chem. Solids 2019, 129, 298–306. [Google Scholar] [CrossRef]
- Henderson, C.M.B.; Charnock, J.M.; Plant, D.A. Cation occupancies in Mg, Co, Ni, Zn, Al ferrite spinels: A multi-element EXAFS study. J. Physics Condens. Matter 2007, 19, 076214. [Google Scholar] [CrossRef]
- Akbari, S.; Masoudpanah, S.; Mirkazemi, S.; Aliyan, N. PVA assisted coprecipitation synthesis and characterization of MgFe2O4 nanoparticles. Ceram. Int. 2017, 43, 6263–6267. [Google Scholar] [CrossRef]
- Gateshki, M.; Petkov, V.; Pradhan, S.K.; Vogt, T. Structure of nanocrystalline MgFe2O4from X-ray diffraction, Rietveld and atomic pair distribution function analysis. J. Appl. Crystallogr. 2005, 38, 772–779. [Google Scholar] [CrossRef]
- Dojcinovic, M.P.; Vasiljevic, Z.Z.; Pavlovic, V.P.; Barisic, D.; Pajic, D.; Tadic, N.B.; Nikolic, M.V. Mixed Mg–Co spinel ferrites: Structure, morphology, magnetic and photocatalytic properties. J. Alloys Compd. 2021, 855, 157429. [Google Scholar] [CrossRef]
- Deraz, N. Effects of magnesia addition on structural, morphological and magnetic properties of nano-crystalline nickel ferrite system. Ceram. Int. 2012, 38, 511–516. [Google Scholar] [CrossRef]
- Joshi, H.; Gowreesan, S.; Kumar, A.R. Influences of Ni2+ on magnetic property and dielectric property in spinel structure of Mg ferrite (Mg1−xNixFe2O4). J. Mater. Sci. Mater. Electron. 2017, 29, 3449–3457. [Google Scholar] [CrossRef]
- Ahlawat, A.; Sathe, V.G. Raman study of NiFe2 O4 nanoparticles, bulk and films: Effect of laser power. J. Raman Spectrosc. 2010, 42, 1087–1094. [Google Scholar] [CrossRef]
- Moradmard, H.; Shayesteh, S.F.; Tohidi, P.; Abbas, Z.; Khaleghi, M. Structural, magnetic and dielectric properties of magnesium doped nickel ferrite nanoparticles. J. Alloys Compd. 2015, 650, 116–122. [Google Scholar] [CrossRef]
- Chavan, P.; Naik, L.R. Investigation of energy band gap and conduction mechanism of magnesium substituted nickel ferrite nanoparticles. Phys. Status Solidi (A) 2017, 214, 1700077. [Google Scholar] [CrossRef]
- Shobana, M.; Kim, K.; Kim, J.-H. Impact of magnesium substitution in nickel ferrite: Optical and electrochemical studies. Phys. E Low-Dimens. Syst. Nanostructures 2018, 108, 100–104. [Google Scholar] [CrossRef]
- Chavan, P.; Naik, L.R.; Belavi, P.B.; Chavan, G.; Ramesha, C.K.; Kotnala, R.K. Studies on Electrical and Magnetic Properties of Mg-Substituted Nickel Ferrites. J. Electron. Mater. 2016, 46, 188–198. [Google Scholar] [CrossRef]
- Ugendar, K.; Samanta, S.; Rayaprol, S.; Siruguri, V.; Markandeyulu, G.; Nanda, B.R.K. Effect of frustrated exchange interactions and spin-half-impurity on the electronic structure of strongly correlated NiFe2O4. Phys. Rev. B 2017, 96, 035138. [Google Scholar] [CrossRef]
- Ortiz-Quiñonez, J.L.; Pal, U.; Villanueva, M.S. Structural, Magnetic, and Catalytic Evaluation of Spinel Co, Ni, and Co–Ni Ferrite Nanoparticles Fabricated by Low-Temperature Solution Combustion Process. ACS Omega 2018, 3, 14986–15001. [Google Scholar] [CrossRef] [PubMed]
- Yan, Z.; Gao, J.; Li, Y.; Zhang, M.; Guo, M. Hydrothermal synthesis and structure evolution of metal-doped magnesium ferrite from saprolite laterite. RSC Adv. 2015, 5, 92778–92787. [Google Scholar] [CrossRef]
- Mund, H.; Ahuja, B. Structural and magnetic properties of Mg doped cobalt ferrite nano particles prepared by sol-gel method. Mater. Res. Bull. 2016, 85, 228–233. [Google Scholar] [CrossRef]
- Yu, T.; Shen, Z.X.; Shi, Y.; Ding, J. Cation migration and magnetic ordering in spinel CoFe2O4powder: Micro-Raman scattering study. J. Physics Condens. Matter 2002, 14, L613–L618. [Google Scholar] [CrossRef]
- Singh, J.P.; Srivastava, R.C.; Agrawal, H.M.; Kumar, R. Micro-Raman investigation of nanosized zinc ferrite: Effect of crystallite size and fluence of irradiation. J. Raman Spectrosc. 2011, 42, 1510–1517. [Google Scholar] [CrossRef]
- Yadav, R.S.; Kuřitka, I.; Vilcakova, J.; Havlica, J.; Masilko, J.; Kalina, L.; Tkacz, J.; Enev, V.; Hajdúchová, M. Structural, magnetic, dielectric, and electrical properties of NiFe2O4 spinel ferrite nanoparticles prepared by honey-mediated sol-gel combustion. J. Phys. Chem. Solids 2017, 107, 150–161. [Google Scholar] [CrossRef]
- Lazarević, Z.Ž; Jovalekić, Č.; Milutinović, A.; Sekulić, D.; Ivanovski, V.N.; Rečnik, A.; Cekić, B.; Romčević, N. Nanodimensional spinel NiFe2O4 and ZnFe2O4 ferrites prepared by soft mechanochemical synthesis. J. Appl. Phys. 2013, 113, 187221. [Google Scholar] [CrossRef]
- Wang, T.; Zhu, T.; Brunet, M.; Deshayes, C.; Sciau, P. Raman study of Yuan Qinghua porcelain: The highlighting of dendritic CoFe2O4crystals in blue decorations. J. Raman Spectrosc. 2016, 48, 267–270. [Google Scholar] [CrossRef]
- Kumar, K.A.; Bhowmik, R. Micro-structural characterization and magnetic study of Ni1.5Fe1.5O4 ferrite synthesized through coprecipitation route at different pH values. Mater. Chem. Phys. 2014, 146, 159–169. [Google Scholar] [CrossRef]
- Gao, Y.; Yin, P. Origin of asymmetric broadening of Raman peak profiles in Si nanocrystals. Sci. Rep. 2017, 7, srep43602. [Google Scholar] [CrossRef]
- Tanwar, M.; Yogi, P.; Lambora, S.; Mishra, S.; Saxena, S.K.; Sagdeo, P.R.; Krylov, A.S.; Kumar, R. Generalisation of phonon confinement model for interpretation of Raman line-shape from nano-silicon. Adv. Mater. Process. Technol. 2018, 4, 227–233. [Google Scholar] [CrossRef]
- Himcinschi, C.; Vrejoiu, I.; Salvan, G.; Fronk, M.; Talkenberger, A.; Zahn, D.R.T.; Rafaja, D.; Kortus, J. Optical and magneto-optical study of nickel and cobalt ferrite epitaxial thin films and submicron structures. J. Appl. Phys. 2013, 113, 084101. [Google Scholar] [CrossRef]
- Ivanov, V.G.; Abrashev, M.V.; Iliev, M.N.; Gospodinov, M.M.; Meen, J.; Aroyo, M.I. Short-rangeB-site ordering in the inverse spinel ferriteNiFe2O4. Phys. Rev. B 2010, 82, 024104. [Google Scholar] [CrossRef]
- Iliev, M.N.; Mazumdar, D.; Ma, J.X.; Gupta, A.; Rigato, F.; Fontcuberta, J. MonitoringB-site ordering and strain relaxation in NiFe2O4epitaxial films by polarized Raman spectroscopy. Phys. Rev. B 2011, 83, 014108. [Google Scholar] [CrossRef]
- Fritsch, D.; Ederer, C. Effect of epitaxial strain on the cation distribution in spinel ferrites CoFe2O4 and NiFe2O4: A density functional theory study. Appl. Phys. Lett. 2011, 99, 081916. [Google Scholar] [CrossRef]
- Kirchberg, K.; Becker, A.; Bloesser, A.; Weller, T.; Timm, J.; Suchomski, C.; Marschall, R. Stabilization of Monodisperse, Phase-Pure MgFe2O4 Nanoparticles in Aqueous and Nonaqueous Media and Their Photocatalytic Behavior. J. Phys. Chem. C 2017, 121, 27126–27138. [Google Scholar] [CrossRef]
- Puli, V.S.; Adireddy, S.; Ramana, C. Chemical bonding and magnetic properties of gadolinium (Gd) substituted cobalt ferrite. J. Alloys Compd. 2015, 644, 470–475. [Google Scholar] [CrossRef]
- Da Silva, S.W.; Nakagomi, F.; Silva, M.S.; Franco, A.; Garg, V.K.; Oliveira, A.C.; Morais, P.C.; Jr., A.F. Raman study of cations’ distribution in Zn x Mg1−x Fe2O4 nanoparticles. J. Nanoparticle Res. 2012, 14, 798. [Google Scholar] [CrossRef]
- Wang, Z.; Lazor, P.; Saxena, S.; O’Neill, H.S. High pressure Raman spectroscopy of ferrite MgFe2O4. Mater. Res. Bull. 2002, 37, 1589–1602. [Google Scholar] [CrossRef]
- Gawas, S.G.; Meena, S.S.; Bhatt, P.; Verenkar, V.M.S. Nanoscale-driven structural changes and associated superparamagnetism in magnetically diluted Ni–Zn ferrites. Mater. Chem. Front. 2018, 2, 300–312. [Google Scholar] [CrossRef]
- Surya, R.M.; Yulizar, Y.; Cahyana, A.H.; Apriandanu, D.O.B. One-pot Cajanus cajan (L.) Millsp. leaf extract-mediated preparation of MgFe2O4 nanoparticles: Optical, structural, morphological and particle size analyses. Solid State Commun. 2020, 326, 114170. [Google Scholar] [CrossRef]
- Varma, A.; Mukasyan, A.S.; Rogachev, A.S.; Manukyan, K.V. Solution Combustion Synthesis of Nanoscale Materials. Chem. Rev. 2016, 116, 14493–14586. [Google Scholar] [CrossRef] [PubMed]
- Prabhakaran, T.; Hemalatha, J. Combustion synthesis and characterization of cobalt ferrite nanoparticles. Ceram. Int. 2016, 42, 14113–14120. [Google Scholar] [CrossRef]
- Nadargi, D.; Umar, A.; Nadargi, J.; Patil, J.; Mulla, I.; Akbar, S.; Suryavanshi, S. Spinel Magnesium Ferrite (MgFe2O4): A Glycine-Assisted Colloidal Combustion and Its Potentiality in Gas-Sensing Application. Chemosensors 2022, 10, 361. [Google Scholar] [CrossRef]
- He, Y.; Zhang, L.; Xiong, H.-W.; Kang, X. Evolution of lattice defects in nickel ferrite spinel: Oxygen vacancy and cation substitution. J. Alloys Compd. 2022, 917, 165494. [Google Scholar] [CrossRef]
- Dhanyaprabha, K.C.; Jacob, B.; Mohan, M.; Al-Omari, I.A.; Al-Harthi, S.H.; Myint, M.T.; Thomas, H. Structural, Magnetic, and Optical Studies of Ni–Mg Ferrites Synthesized by Polyol Method. Phys. Status Solidi (A) 2021, 218, 2100193. [Google Scholar] [CrossRef]
- Thota, S.; Kashyap, S.C.; Sharma, S.K.; Reddy, V. Cation distribution in Ni-substituted Mn0.5Zn0.5Fe2O4 nanoparticles: A Raman, Mössbauer, X-ray diffraction and electron spectroscopy study. Mater. Sci. Eng. B 2016, 206, 69–78. [Google Scholar] [CrossRef]
- Li, F.; Liu, X.; Yang, Q.; Liu, J.; Evans, D.G.; Duan, X. Synthesis and characterization of Ni1−xZnxFe2O4 spinel ferrites from tailored layered double hydroxide precursors. Mater. Res. Bull. 2005, 40, 1244–1255. [Google Scholar] [CrossRef]
- Arillo, M.; López, M.; Pico, C.; Veiga, M.; Jiménez-López, A.; Rodríguez-Castellón, E. Surface characterisation of spinels with Ti(IV) distributed in tetrahedral and octahedral sites. J. Alloys Compd. 2001, 317–318, 160–163. [Google Scholar] [CrossRef]
- Mittal, V.K.; Chandramohan, P.; Bera, S.; Srinivasan, M.P.; Velmurugan, S.; Narasimhan, S.V. Cation distribution in NixMg1−xFe2O4 studied by XPS and Mössbauer spectroscopy. Solid State Commun. 2006, 137, 6–10. [Google Scholar] [CrossRef]
- Li, W.; Li, F.; Yang, H.; Wu, X.; Zhang, P.; Shan, Y.; Sun, L. A bio-inspired coordination polymer as outstanding water oxidation catalyst via second coordination sphere engineering. Nat. Commun. 2019, 10, 5074. [Google Scholar] [CrossRef] [PubMed]
- Töpfer, J.; Feltz, A.; Gräf, D.; Hackl, B.; Raupach, L.; Weissbrodt, P. Cation Valencies and Distribution in the Spinels NiMn2O4 and MzNiMn2−zO4 (M = Li, Cu) Studied by XPS. Phys. Status Solidi (A) 1992, 134, 405–415. [Google Scholar] [CrossRef]
- Šutka, A.; Pärna, R.; Käämbre, T.; Kisand, V. Synthesis of p-type and n-type nickel ferrites and associated electrical properties. Phys. B Condens. Matter 2015, 456, 232–236. [Google Scholar] [CrossRef]
- Shin, J.; Jeong, B.; Kim, J.; Nam, V.B.; Yoon, Y.; Jung, J.; Hong, S.; Lee, H.; Eom, H.; Yeo, J.; et al. Sensitive Wearable Temperature Sensor with Seamless Monolithic Integration. Adv. Mater. 2020, 32, e1905527. [Google Scholar] [CrossRef] [PubMed]
- Liu, T.; Zhang, H.; Ma, P.; Chang, A.; Jiang, H. Core–shell NTC materials with low thermal constant and high resistivity for wide-temperature thermistor ceramics. J. Am. Ceram. Soc. 2019, 102, 4393–4398. [Google Scholar] [CrossRef]
- Dojcinovic, M.P.; Vasiljevic, Z.Z.; Krstic, J.B.; Vujancevic, J.D.; Markovic, S.; Tadic, N.B.; Nikolic, M.V. Electrospun Nickel Manganite (NiMn2O4) Nanocrystalline Fibers for Humidity and Temperature Sensing. Sensors 2021, 21, 4357. [Google Scholar] [CrossRef]
- Nikolic, M.V.; Labus, N.J.; Pavlovic, V.P.; Markovic, S.; Lukovic, M.D.; Tadic, N.B.; Vujancevic, J.D.; Vlahovic, B.; Pavlovic, V.B. Nanocrystalline Zn2SnO4/SnO2: Crystal structure and humidity influence on complex impedance. J. Electroceramics 2020, 45, 135–147. [Google Scholar] [CrossRef]
- Nikolic, M.V.; Sekulic, D.L.; Vasiljevic, Z.Z.; Lukovic, M.D.; Pavlović, V.B.; Aleksic, O.S. Dielectric properties, complex impedance and electrical conductivity of Fe2TiO5 nanopowder compacts and bulk samples at elevated temperatures. J. Mater. Sci. Mater. Electron. 2016, 28, 4796–4806. [Google Scholar] [CrossRef]
- Nikolic, M.V.; Lukovic, M.D.; Vasiljevic, Z.Z.; Labus, N.J.; Aleksic, O.S. Humidity sensing potential of Fe2TiO5—Pseudobrookite. J. Mater. Sci. Mater. Electron. 2018, 29, 9227–9238. [Google Scholar] [CrossRef]
- Jeseentharani, V.; George, M.; Jeyaraj, B.; Dayalan, A.; Nagaraja, K.S. Synthesis of metal ferrite (MFe2O4, M = Co, Cu, Mg, Ni, Zn) nanoparticles as humidity sensor materials. J. Exp. Nanosci. 2013, 8, 358–370. [Google Scholar] [CrossRef]
- Nikolic, M.V.; Dojcinovic, M.P.; Vasiljevic, Z.Z.; Lukovic, M.D.; Labus, N.J. Nanocomposite Zn2SnO4/SnO2 Thick Films as a Humidity Sensing Material. IEEE Sensors J. 2020, 20, 7509–7516. [Google Scholar] [CrossRef]
- Selmi, M.; Smida, A.; El Kossi, S. Effect of Polaron formation in conduction and dielectric behavior in La0.7Sr0.25K0.05MnO3 oxide. J. Mater. Sci. Mater. Electron. 2021, 32, 6014–6027. [Google Scholar] [CrossRef]
- Mocanu, Z.V.; Airimioaei, M.; Ciomaga, C.E.; Curecheriu, L.; Tudorache, F.; Tascu, S.; Iordan, A.R.; Palamaru, N.M.; Mitoseriu, L. Investigation of the functional properties of Mg x Ni1−x Fe2O4 ceramics. J. Mater. Sci. 2014, 49, 3276–3286. [Google Scholar] [CrossRef]
- Sutka, A. The Role of Stoichiometry on Gas Response of Nanostructured Sol–Gel Auto Combustion Derived Nickel Ferrite. Sens. Lett. 2013, 11, 2010–2013. [Google Scholar] [CrossRef]
- Kotnala, R.K.; Shah, J.; Mathpal, M.C.; Verma, K.C.; Singh, S.; Lovkush. Influence of annealing on humidity response of RF sputtered nanocrystalline MgFe2O4 thin films. Thin Solid Film. 2011, 519, 6135–6139. [Google Scholar] [CrossRef]
- Sekulic, D.L.; Lazarevic, Z.Z.; Romcevic, N.Z. Nanocrystalline Porous Nickel Ferrite Ceramics for Humidity Sensing Applications. In Proceedings of the IEEE 31st International Conference on Microelectronics (MIEL), Nis, Serbia, 16–18 September 2019; pp. 95–98. [Google Scholar] [CrossRef]
- Nikolic, M.V.; Lukovic, M.D. Influence of SnO2 Content on the Humidity Dependent Impedance of the MgFe2O4-Fe2O3-SnO2 Compound. Chemosensors 2020, 8, 39. [Google Scholar] [CrossRef]
- Arshaka, K.; Twomey, K.; Egan, D. A Ceramic Thick Film Humidity Sensor Based on MnZn Ferrite. Sensors 2002, 2, 50–61. [Google Scholar] [CrossRef]
- Patil, S.; Pawar, A.; Tilekar, S.; Ladgaonkar, B. Investigation of magnesium substituted nano particle zinc ferrites for relative humidity sensors. Sensors Actuators A Phys. 2016, 244, 35–43. [Google Scholar] [CrossRef]
Disclaimer/Publisher’s Note: The statements, opinions and data contained in all publications are solely those of the individual author(s) and contributor(s) and not of MDPI and/or the editor(s). MDPI and/or the editor(s) disclaim responsibility for any injury to people or property resulting from any ideas, methods, instructions or products referred to in the content. |
© 2023 by the authors. Licensee MDPI, Basel, Switzerland. This article is an open access article distributed under the terms and conditions of the Creative Commons Attribution (CC BY) license (https://creativecommons.org/licenses/by/4.0/).