Article

A Silver Nanoparticles-Based Selective and Sensitive Colorimetric Assay for Ciprofloxacin in Biological, Environmental, and Commercial Samples

1
Third World Centre for Science and Technology, International Centre for Chemical and Biological Sciences (ICCBS), University of Karachi, Karachi 75270, Pakistan
2
H.E.J. Research Institute of Chemistry, International Centre for Chemical and Biological Sciences (ICCBS), University of Karachi, Karachi 75270, Pakistan
3
UNESCO Laboratory of Environmental Electrochemistry, Department of Analytical Chemistry, Faculty of Science, Charles University, Albertov 6, 12843 Prague, Czech Republic
*
Authors to whom correspondence should be addressed.
Chemosensors 2023, 11(2), 91; https://doi.org/10.3390/chemosensors11020091
Submission received: 15 November 2022 / Revised: 22 December 2022 / Accepted: 9 January 2023 / Published: 25 January 2023
(This article belongs to the Special Issue Nanoparticles in Chemical and Biological Sensing)

Abstract

:
The wide-spread usage of ciprofloxacin (CIP) resulted in its presence in different parts of the ecosystem. Thus, a simple, reliable, on-spot detection method for CIP is required in environmental context. Herein, a colorimetric assay is developed for the detection of CIP based on the branched polyethyleneimine (PEI) conjugated silver nanoparticles (PEI-AgNPs). AgNPs are prepared using PEI as stabilizing agent following a simple one-pot two-phase procedure. The prepared PEI-AgNPs are subsequently used for an efficient and selective detection of CIP. The characteristic yellow colour of PEI-AgNPs changed to colourless when CIP was added which was further confirmed by quenching in the intensity of the SPR (surface plasmon resonance) band (hypochromic shift). The proposed method is efficient for the quantitation of CIP in a linear dynamic range (LDR) of 0.1–200 µM with a limit of detection (LOD) of 0.038 µM, and limit of quantification (LOQ) of 0.12 µM. The developed method is selective, efficient, and sensitive to CIP in the presence of numerous interfering species and in real biological, environmental, and commercial pharmaceutical samples. Excellent performance of the proposed method compared to UV-Vis spectroscopy and UPLC in environmental, biological, and commercial pharmaceutical samples is demonstrated.

1. Introduction

Fluoroquinolones are drugs effectively used for the treatment of bacterial infections such as gastroenteritis, and other infections of urinary tract, soft tissues, and respiratory tract. These drugs are subsequently excreted from the body of the infected persons or animals in partially metabolized or unmetabolized forms [1]. Ciprofloxacin (CIP), 1-cyclopropyl-6-fluoro-4-oxo-7-(piperazine-1-yl)-quinoline-3-carboxylic acid (see Figure S4, Supplementary Material) is a third generation fluoroquinolone antibiotic [2,3] that is approved by Food and Drug Administration (FDA) for the management of post-exposure inhalation of anthrax [4]. It is extensively used for the treatment of urinary tract and kidney infections in human and veterinary medicine. Unique pharmacokinetic profile, higher bioavailability, increased tissue penetration, and higher plasma concentrations are the major merits of CIP for its wide use for treatment of multiple infections [5,6,7]. Due to its widespread applications, CIP may leach into the water resources resulting in the ever-increasing demand for the development of fast, facile, and cost-effective methods for its detection [8]. It is worth mentioning that a relatively high concentration (0.16 g/mL) of CIP was found in water ecosystem while maximum detected concentration in water resources was 6.5 mg/L (19.61 µM) [9].
The excessive use of such drugs has a great impact on the environment that directly influences human, animal, and plant life. Hence, methods capable of selective detection of these drugs in biological, environmental, and commercial samples are exceedingly required. Several instrumental methods have been reported for the detection of CIP, which include electrochemical sensing [10], spectrophotometry [11], spectrofluorometry [12], high-performance liquid chromatography with fluorescence detection (HPLC-FLD) [13], ultra-performance liquid chromatography-tandem mass spectrometry (UPLC MS/MS) [14], capillary zone electrophoresis [15], atomic absorption spectroscopy [16], etc. Although the above-mentioned methods are accurate and reliable, they require expensive instrumentation, expert operators, and costly reagents that lead to considerably high capital and running costs [17]. These inherent hurdles associated with the instrumental methods applications for on-site assays stimulate the development of colorimetric assays that are fast, low-cost, and facile for monitoring CIP. With the advancement in the field of nanotechnology, a wide range of nanoparticle applications is explored. The surface electrons on metal nanoparticles (MNPs) jump from the valence band to the conduction band in response to the electromagnetic radiation that instigates their remarkable optical and catalytic properties. MNPs have been employed for sensing and drug delivery due to the aforementioned special characteristics [18,19]. Recently, silver (Ag) and gold (Au) nanoparticles (NPs) in particular have attracted great attention in the field of sensing. AuNPs and AgNPs have a characteristic SPR band in a wavelength range of 300–800 nm that may shift in any direction by the change in the core environment of the MNPs [20,21].
A general tendency of MNPs is their quick agglomeration into bulk materials. In this context, different stabilizing agents are being used, such as proteins, polysaccharides, flavonoids, liposomes, and synthetic polymers [22,23,24]. The AgNPs/AuNPs stabilized with numerous capping agents can be employed for sensing applications because of their activated stabilization/aggregation due to interaction between the functional groups present at the surface of MNPs and the analyte. In particular, AgNPs have been used for sensing and detection of analytes of various types such as cephalexin detection by poly(ethylene oxide)-b-poly(ε-caprolactone) conjugated AgNPs [25], colorimetric sensing of cartap by poly(styrene)-b-poly(2-vinyl pyridine) conjugated AgNPs [26], colorimetric detection of citrate by dual-surfactant-capped AgNPs [27], alkaline phosphatase biosensor based on p-aminophenol-mediated AgNPs [28], and many more. The driving forces in sensing applications are usually secondary interactions such as antigen–antibodies interactions, charge transfers, electrostatic interactions, hydrogen bonding, Van der Waals forces, and host–guest interactions [29].
To increase the stability of MNPs, numerous polymers of different natures have been used by our group. Polymer-stabilized MNPs are subsequently employed for the selective detection and quantification of a variety of analytes such as drugs, pesticides, and metals [25,26,30,31]. Polymers not only hinder the self-aggregation of nanoparticles, but also enhance the selectivity against a particular analyte [32]. Polymers having electron pair donating ability are promising candidates for MNPs stabilization due to their capacity to make chelates [30,31]. Numerous synthetic polymers have been used for stabilizing MNPs such as poly(propylene glycol) [31], poly(ethyleneglycol) [24], poly(2-vinylpyridine) [26], poly(ethylene oxide)-b-poly(ε-capro-lactone) [25], poly(styrene)-b-poly(2-vinylpyridine) [26], poly(2-vinylpyridine)-b-poly(methyl-methacrylate) [33], and many more [34,35]. A common feature of the polymers used for the stabilization of MNPs is the presence of sulphur, oxygen, and/or nitrogen atoms in their repeated units, which can provide an electron pair for the chelation of metals [21,23].
In the above-iterated context, polyethyleneimine (PEI) is a synthetic polymer that possesses a high cationic charge density. PEIs can be synthesized as linear or branched structures and have great potential for gene delivery. Both branched and linear PEI can deliver nucleic acid either in vitro or in vivo, especially the molecular weight of 25 kDa is considered the gold standard in gene delivery [36,37,38]. The presence of nitrogen atoms in the repeated units of PEI induces a great metal chelation capacity. PEI-capped silver nanoparticles (PEI-AgNPs) have been prepared using sodium borohydride as a reducing agent and used for multiple applications, such as antimicrobial agents [39], fluorescence sensors [40], and as a catalyst for treating wastewater [41]. Recently, we have reported a prominent hyperchromic shift in the SPR band of PEI-AgNPs by the addition of promethazine [21]. Herein, we explore the colorimetric sensing potential of PEI-AgNPs based on another colorimetric sensing mechanism, such as, hypochromic, bathochromic, or hypsochromic shifts.
In this study, we have employed a quick, one-step, and facile approach for the synthesis of PEI-AgNPs using silver nitrate as a precursor, PEI as a stabilizing agent, and sodium borohydride as a reducing agent [21]. PEI-AgNPs were subsequently employed for evaluation of their potential to detect CIP. Different analytical aspects, such as linear dynamic range (LDR), the limit of detection (LOD), and the limit of quantification (LOQ) were evaluated. The selectivity of the proposed method using PEI-AgNPs was also evaluated in the presence of other drugs, inorganic salts, and bases as model interferents. Eventually, the proposed method for CIP determination has been assessed for its effectiveness in environmental (tap water), biological (serum, urine, and plasma), and pharmaceutical (infusion) samples. Complementary techniques, such as UV-Vis and UPLC, were used for validation of the newly developed method in standard conditions. The excellent reliability of the proposed method for quantification of CIP in environmental, biological, and commercial samples was confirmed by comparing them with UPLC and UV-Vis spectrophotometry. In this context, colorimetric sensing of CIP based on an unmodified aptamer and the aggregation of gold nanoparticles has been reported [42]. However, this method requires correct sequence of CIP–aptamer, gold nanoparticles are relatively expensive, and both interference study and practical applications on biological samples are missing in this paper. In our presented study, less expensive PEI-AgNPs are used to detect CIP with some added advantages over the previously reported method; the LOD achieved in the present work is slightly higher compared to previously published aptamer-based colorimetric method, nonetheless, sufficiently low for practical applications. Moreover, in this paper, we also report a comprehensive interference study along with practical application of the newly developed method for CPI determination in environmental, pharmaceutical, and biological samples.

2. Experimental

2.1. Materials and Instruments

Silver nitrate [AgNO3 (>99.5%)], sodium borohydride [NaBH4 (99%)], and PEI branched (Mn = 10,000 g/mol, Mw = 25,000 g/mol) were purchased from Sigma Aldrich, St. Louis, MO, USA. All the standard drugs were obtained from a local company and a local pharmacy provided CIP commercial sample (Novidat-Sami Pharmaceuticals). All the glassware was washed using 10% nitric acid solution and rinsed with DI water and acetone, and further dried in an oven to avoid any possible contamination. The pH was monitored using a pH meter (model HI2211 pH/ORP Meter Hanna instruments, Woonsocket, Rhode Island, USA), as well as by using a glass working and Ag|AgCl reference electrode. Shimadzu UV-1800 UV-Vis spectrophotometer (Kyoto, Japan) having a quartz cuvette with a path length of 1 cm was used to record the spectra in the range of 200–800 nm.
FT-IR analysis was performed in a mid-IR region having a range of 400–4000 cm−1, using potassium bromide (KBr) disk. Bruker Vector 22 FT-IR spectrometer with a deuterated triglycine sulphate (DTGS) detector was used to perform the FT-IR study. Ten scans were performed to achieve 0.1 cm−1 spectral resolution.
Malvern Instruments Nano-ZSP zeta sizer was used for the examination of particle size distribution and zeta potential for the prepared PEI-AgNPs. These studies were conducted at 25 °C with a fixed diffraction angle of 90°. A disposable cuvette was used to determine the particle size, and for zeta potential determination cell was immersed in it.
The topographical images and size of PEI-AgNPs were compared before and after the addition of drug using SEM-EDX (Thermo Fisher Scientific, Apreo 2 C LoVac, Waltham, MA, USA). The samples were coated with gold using a sputter coater JEOL (SC7620-Quorum Technologies) ion sputtering device; the coating thickness was 153 Å. The substrate was prepared by dropping a drop of sample solution onto a silicon wafer, which was then air-dried for 24 h before the experiment.
Atomic Force Microscope (AFM, Agilent 5500, Chandler, AZ, USA) with a triangular silicon nitride cantilever (Veeco, model MLCT-AUHW) having a spring constant of 0.1 Nm−1 in a tapping mode was used to confirm the topographical changes of PEI-AgNPs before and after the addition of drugs. The substrate was prepared by dropping a drop of sample solution onto a silicon wafer, which was then air-dried for 24 h before the experiment.

2.2. Preparation of PEI-AgNPs

PEI-AgNPs were synthesized by using our recently reported method [21]. Briefly, 1.8 mM solution of AgNO3 in de-ionized (DI) water, 0.1 mM solution of PEI in boiling DI water, and 2.0 mM NaBH4 solution in DI water were prepared. The solutions of 1.8 mM AgNO3 and 0.1 mM PEI were mixed with the fixed optimized ratio of 1:15 (v/v). After two hours of stirring, 2.0 mM solution of sodium borohydride was added dropwise to the above-prepared solution and the resulting solution was stirred further for 24 h. After the appearance of the characteristic yellow colour of AgNPs, the UV-Vis spectrum was recorded to confirm the formation of AgNPs. Variations in different experimental parameters such as pH, temperature, and electrolyte concentration were examined to test the stability of the PEI-AgNPs.

2.3. Applicability of PEI-AgNPs as a Colorimetric Sensing Material for CIP

For sensing purpose, the aqueous solution of CIP and other drugs having 1.0 mM concentration were prepared and added to the PEI-AgNPs dispersion in equal volume proportions. The UV-Vis spectra were recorded to monitor changes in the SPR band.
The same process was used for the determination of CIP in tap water, except for preparing CIP concentrations (1, 75 and 175 µM) in the tap water (taken from the University of Karachi).
For monitoring CIP in biological samples, a vein puncture procedure was utilized to collect a blood sample from a healthy volunteer at the Centre for Bioequivalence Studies and Clinical Research (CBSCR), International Centre for Chemical and Biological Sciences (ICCBS), University of Karachi, after receiving official approval from the institute’s ethical committee. The extraction of plasma from the blood was followed by centrifugation at 4000 rpm for 5 min at 25 °C.
A control was prepared by adding 2.0 mL plasma (diluted with deionized water in a ratio of 1:5) to a 2.0 mL PEI-AgNPs dispersion and diluting it to 10.0 mL with DI water. In the experimental solution, 2.0 mL of CIP solution in diluted plasma having concentrations 1, 75, and 175 µM were added in parallel to 2.0 mL PEI-AgNPs followed by its dilution to 10 mL. UV-Vis spectra were recorded for both solutions. The same procedure was used for blood serum and urine samples. All the biological samples were diluted five-fold with DI water before making the mentioned concentration of CIP.
To measure CIP content in the pharmaceutical formulation, a commercial sample was purchased from a local pharmaceutical store (Novidat-Sami Pharmaceuticals). A calculated amount of commercial infusion sample (Novidat-Sami Pharmaceuticals) was used to prepare 1, 75 and 175 µM CIP in DI water as per concentration information provided by the producer. 2.0 mL of the diluted solution was then added to 2.0 mL of PEI-AgNPs. After 5 min, the solution was examined using UV-vis spectrophotometry. The CIP content of the commercial sample was calculated using the calibration curve.

3. Results and Discussion

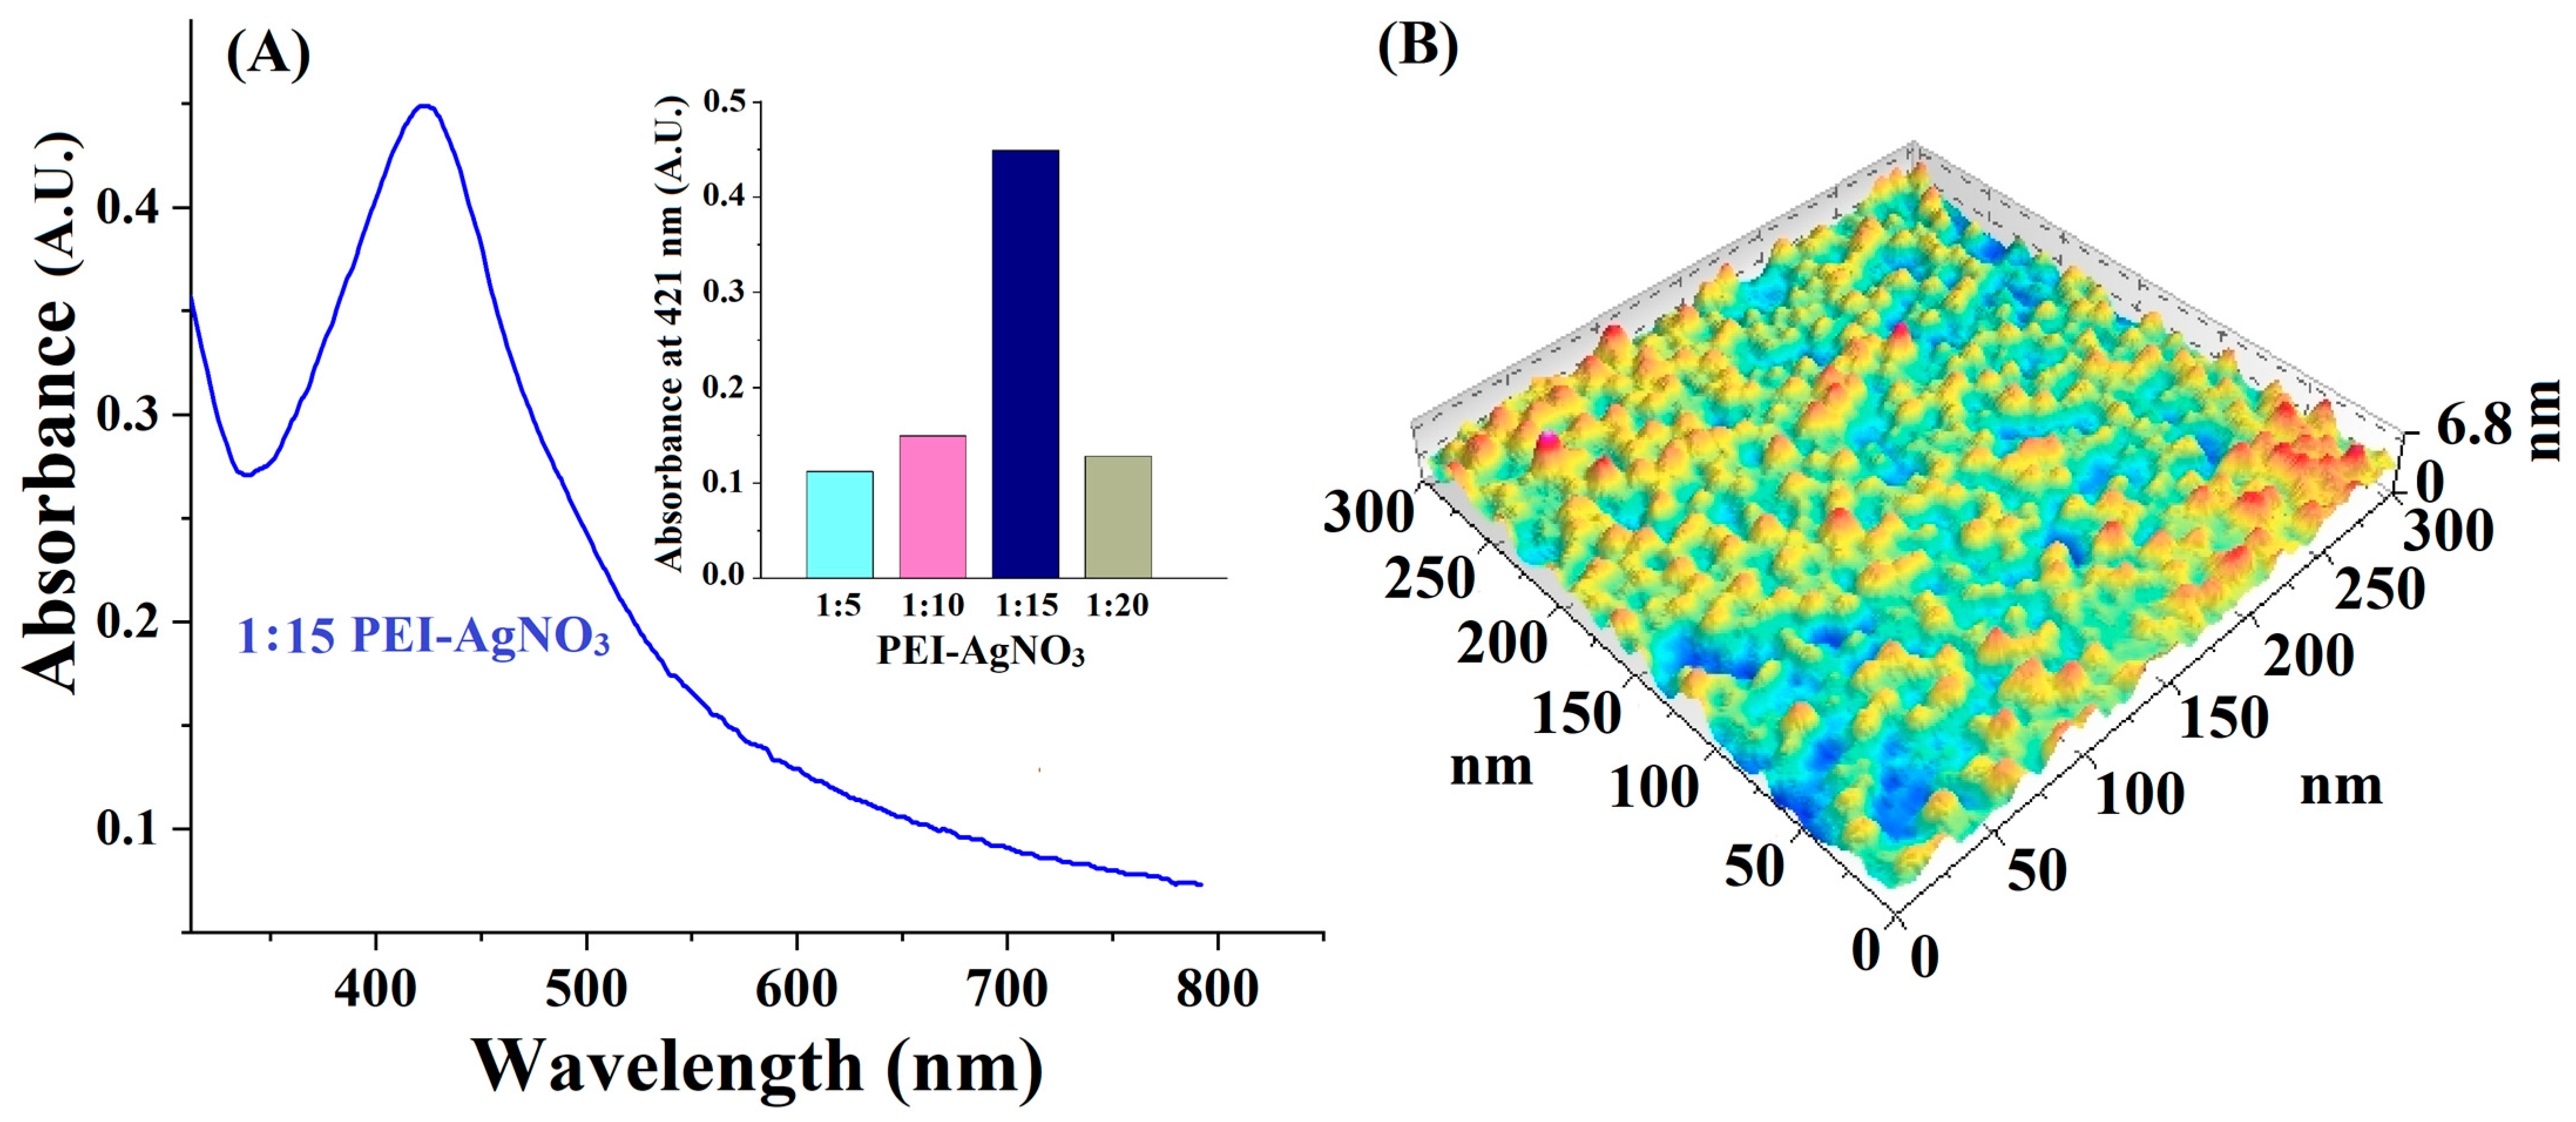
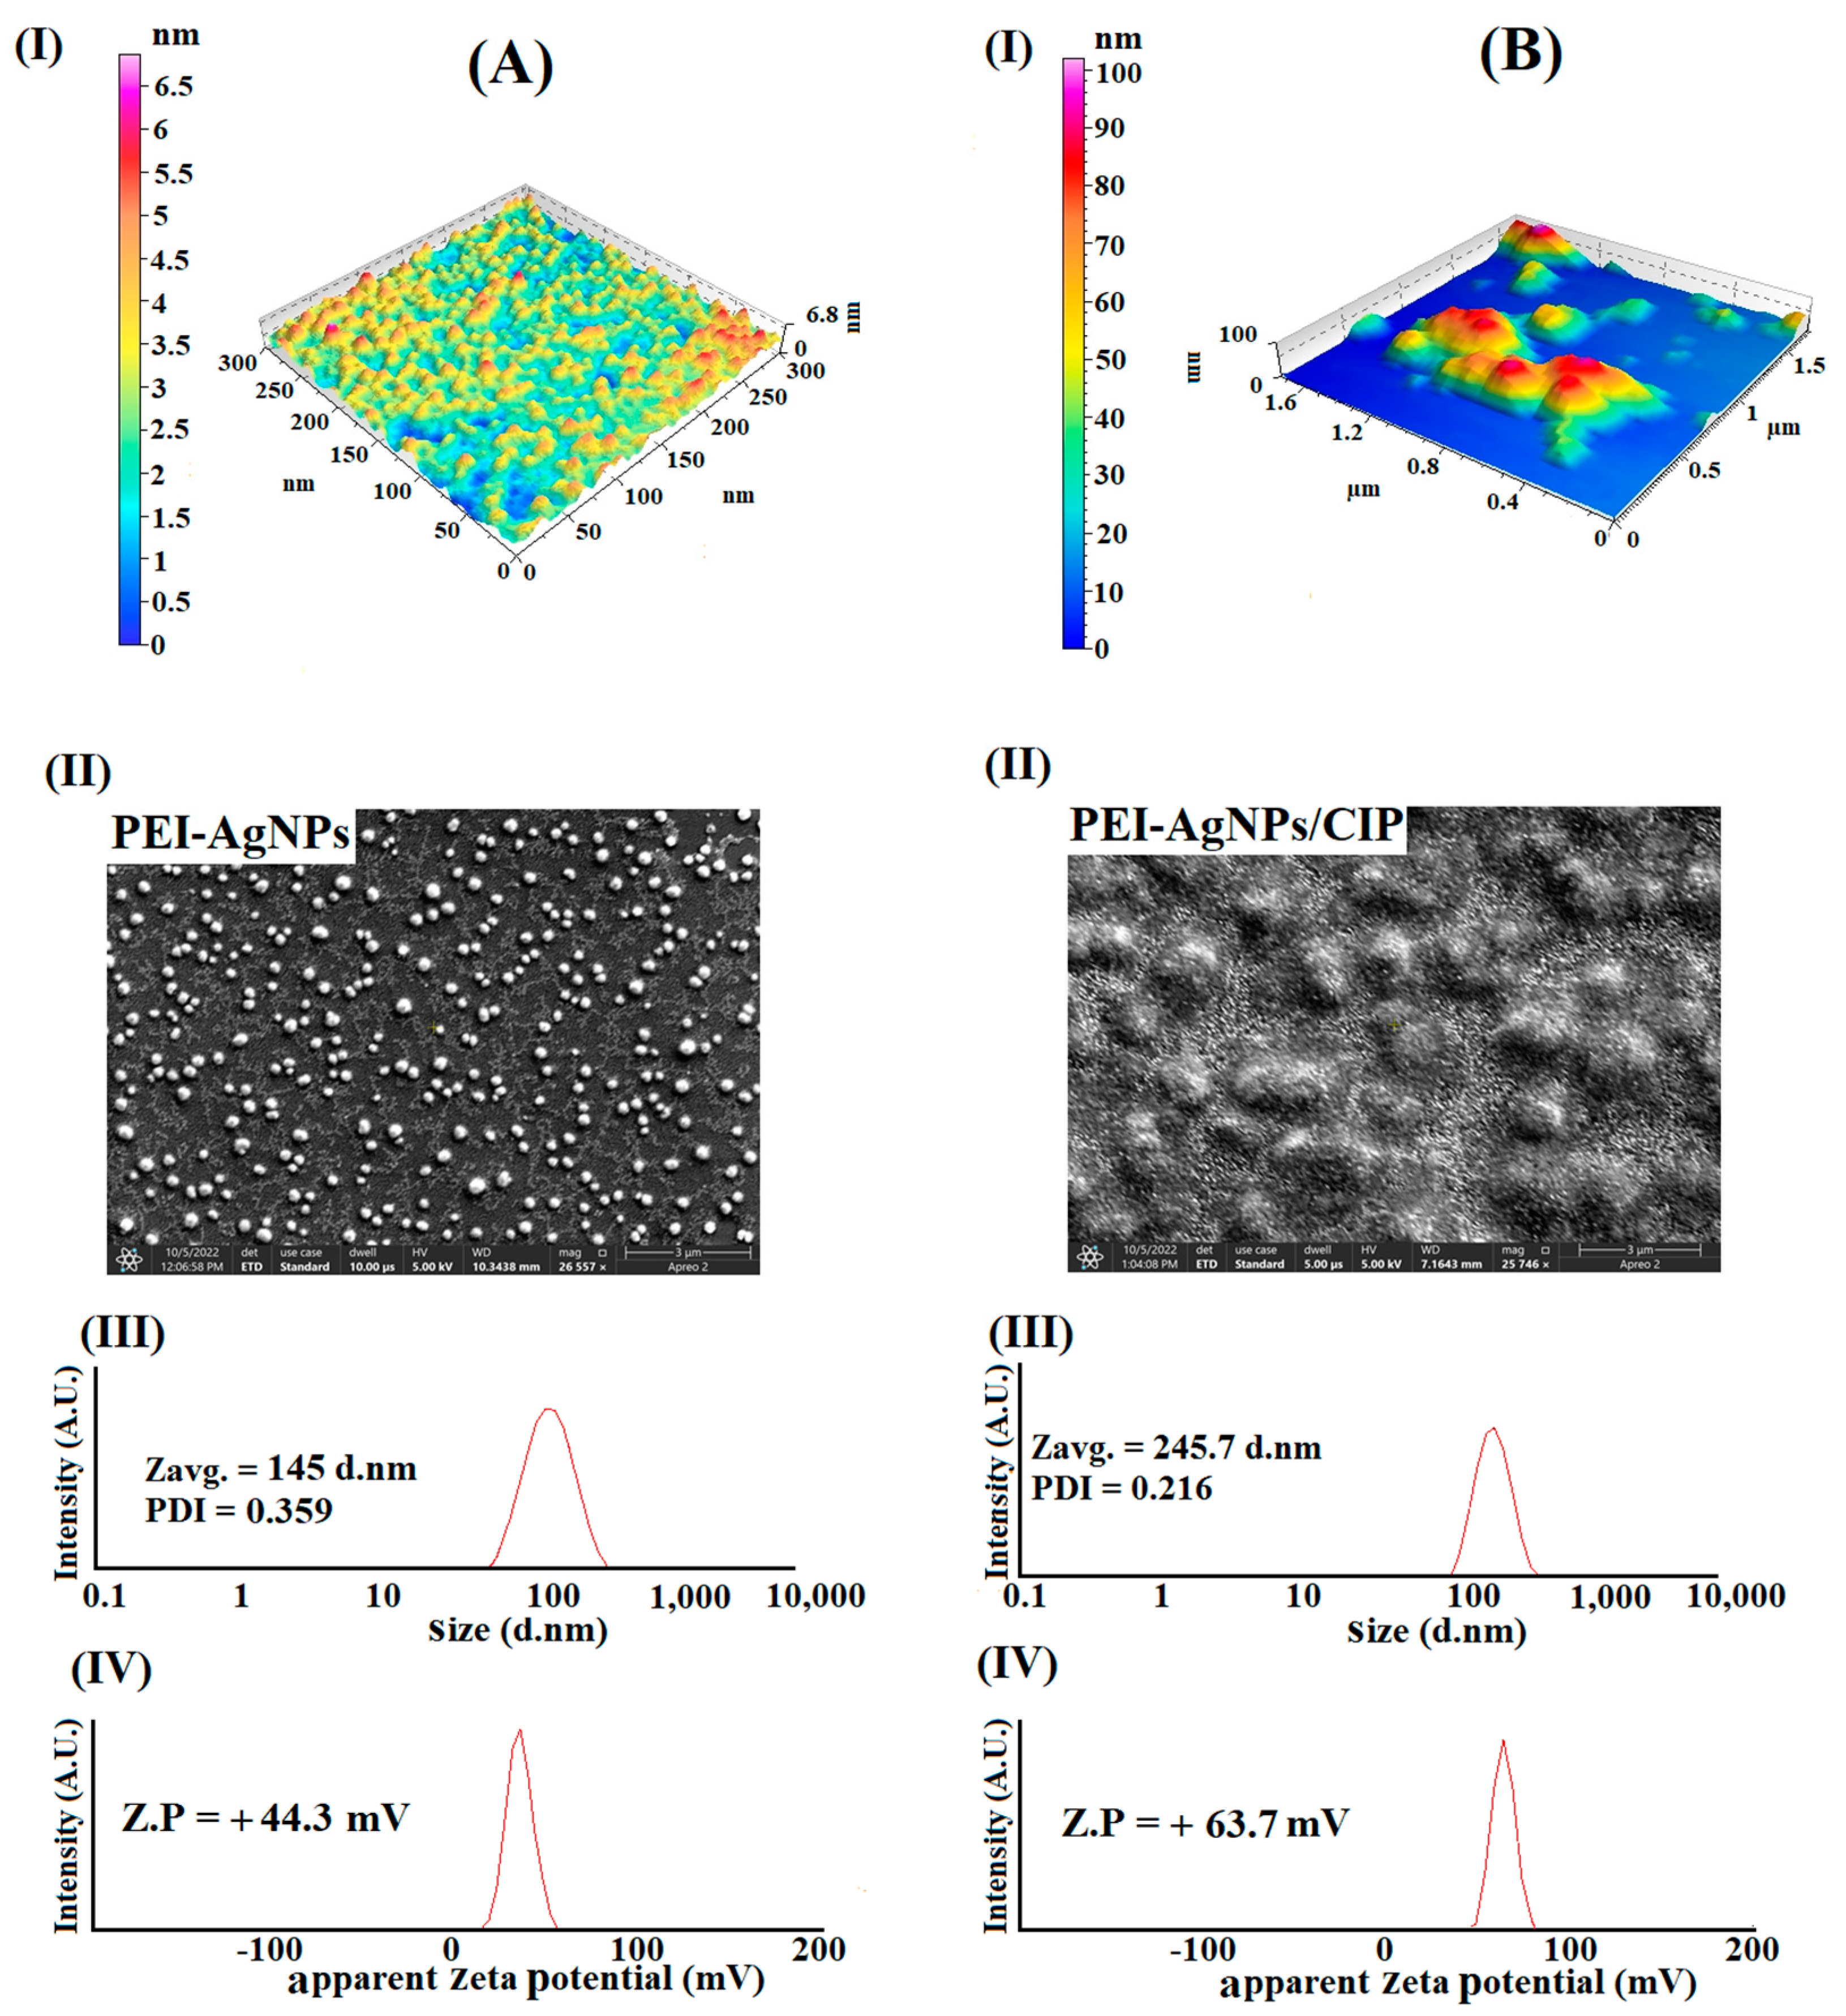
3.1. Preparation and Characterization of PEI-AgNPs

Polyethylenimine (PEI) is a synthetic cationic polymer that can be synthesized by ring-opening polymerization of N-(2-tetrahydropyranyl)aziridine. The presence of primary, secondary, and tertiary amine groups in branched PEI enhances its capacity to form a complex with metal ions [43]. In this study, branched PEI was used as a stabilizing agent for the synthesis of AgNPs. The appearance of yellow colour in the solution after 24 h stirring indicates the formation of PEI-AgNPs which was further confirmed by a strong SPR band at 421 nm [21,44]. Maximum absorbance intensity of the SPR band for PEI-AgNPs was observed at a ratio of 1:15 [PEI:AgNO3] (v/v), which indicates the optimum reduction of Ag+ ions (see Figure 1A) [21]. Increasing the ratio beyond (1:15) for PEI and silver salt resulted in a decrease in the intensity of the SPR band that might be attributed to the presence of free Ag+ and NO3 ions. The intensity of the SPR band as a function of the ratio of PEI and AgNO3 is depicted in Figure 1A inset. As discussed earlier, the maximum absorbance intensity of PEI-AgNPs is achieved using the optimum ratio of PEI and silver salt [39,45]. Therefore, PEI-AgNPs 1:15 [PEI:AgNO3] (v/v) were used for further experiments. AFM topographical image further confirmed the formation of PEI-AgNPs, see Figure 1B.
The stability of as-prepared PEI-AgNPs in dependence on the changes in the external variables such as electrolyte concentration, pH, and temperature is essential for their potential applications [21]. PEI-AgNPs were heated for 20 min at 100 °C. Thermal treatment of PEI-AgNPs resulted in an increased intensity of the SPR band from 0.45 A.U. to 0.54 A.U. at a wavelength of 421 nm (see Figure S1, Supplementary Material). Increased solubility of the polymer and availability for metal chelation at higher temperature may be the most probable reason of the increased SPR band intensity. Moreover, the storage stability of PEI-AgNPs is confirmed by keeping them for more than six months at ambient temperature. MNPs tend to agglomerate in the presence of electrolytes. In this context, a comprehensive study was carried out by adding different concentrations of NaCl in a range of 0.01 M–5 M to the PEI-AgNPs solution. The SPR band intensity of PEI-AgNPs was enhanced by the addition of NaCl up to a concentration of 0.2 M (see Figure S2, Supplementary Material). However, by the addition of NaCl concentration beyond 0.2 M, a rather sharp peak of PEI-AgNPs began to deform into a shoulder. The SPR band deformation may be attributed to the presence of Cl ions. The excess Cl ions may interact with the highly positive charge PEI-AgNPs and induce aggregation [46].
Another important parameter in this context is the pH of the medium. Variation in the pH range of 2–12 resulted in a decrease in the intensity of the SPR band. The highest intensity of the SPR band was observed for the original pH of PEI-AgNPs i.e., 7.2 (see Figure S3, Supplementary Material). Moving in any direction from the original pH resulted in a significant decrease in the intensity of the SPR band.

3.2. PEI-AgNPs as a Colorimetric Sensing Material

The major aim of this study is to assess the applicability of PEI-AgNPs as a colorimetric sensing material. For this purpose, several drugs having different structures, such as cefixime, levofloxacin, cephradine, diazepam, levetiracetam, cefaclor, theophylline, phenobarbital, pregabalin, salbutamol, aspirin, pyrazinamide, sulphonamide, neomycin, aminophylline, celecoxib, and ciprofloxacin, which were added to the PEI-AgNPs solution. It is pertinent to mention here that the addition of promethazine in PEI-AgNPs renders an immediate colour change from typical yellow to orange-brown, which is further associated with a prominent hyperchromic shift in the SPR band [21]. While exploring further, we noticed that the yellow colour of PEI-AgNPs solution immediately disappears by the addition of CIP compared to no change for all the other above-mentioned tested drugs. Moreover, the SPR band of PEI-AgNPs disappeared (hypochromic shift) by the addition of CIP, while no significant change in the SPR band intensity was observed by individual addition of the same quantity of the other drugs (see Figure 2). The structures of the drugs used in this study are shown in Figure S4, Supplementary Material.
Furthermore, DLS, AFM, SEM-EDX, and FT-IR studies were performed to observe the change in the size, zeta potential, topography, and functional group interactions before and after the addition of CIP to PEI-AgNPs. A clear agglomeration and change in the morphological structure of PEI-AgNPs by the addition of CIP to PEI-AgNPs is demonstrated by AFM topographical images (see Figure 3(AI,BI)). The image of the control silicon wafer (with no sample deposition) is shown in Figure S5A, Supplementary Material. Meanwhile, the maxima of AFM histogram showed an increase in the size from ~4.5 nm to ~100.0 nm after the addition of CIP to PEI-AgNPs, Figure S5B,C, Supplementary Material. An increase in the size of PEI-AgNPs after addition of CIP is further confirmed by SEM, Figure 3(AII,BII). SEM analysis has shown an increase in the average size of PEI-AgNPs from ~100 nm to ~900 nm after the addition of CIP. The results obtained by AFM and SEM are further endorsed by zeta sizer analysis that has also shown an increase in the average size from 145.0 nm to 245.7 nm by the addition of CIP in PEI-AgNPs (see Figure 3(AIII,BIII). The surface charge of PEI-AgNPs was found to be +44.3 mV, which indicates that coating of highly cationic PEI on the surface of AgNPs provides good colloidal stability [39]. The value of zeta potential has also increased from +44.3 mV to +63.7 mV upon the addition of CIP indicating an increase in their stability (see Figure 3(AIV,BIV). To assess the presence of elements before and after CIP addition to PEI-AgNPs, elemental mapping was carried out for PEI-AgNPs and PEI-AgNPs/CIP using SEM-EDX. The elemental mapping revealed the presence of carbon (C), nitrogen (N), oxygen (O), and silver (Ag) in PEI-AgNPs. All of the aforementioned elements are present along with fluorine (F) in PEI-AgNPs/CIP, supporting the interaction between CIP and PEI-AgNPs, Figure S6, Supplementary Material. Additionally, the elemental analysis revealed that Ag content of PEI-AgNPs is higher compared to PEI-AgNPs/CIP, and the presence of additional moieties on the surface of AgNPs may be attributed to the lower Ag content after addition of CIP, Figure S6, Supplementary Material.
Moreover, FT-IR analysis was performed to identify the functional group involved in the stabilization of AgNPs with PEI and the sensing mechanism of CIP. The comparison of FTIR spectra of PEI, PEI-AgNPs, CIP, and PEI-AgNPs/CIP is shown in Figure 4. The peak of PEI at 3366 cm−1 (corresponds to NH stretching) shifted to 3040 cm−1 in the PEI-AgNPs spectrum. The intensity of NH2 peak at 1590 cm−1 in the PEI spectrum decreased in the PEI-AgNPs spectrum, indicating the involvement of primary amine in the stabilization of AgNPs [21]. The typical peak of AgNPs at 1630 cm−1 in PEI-AgNPs, changed its behaviour in the PEI-AgNPs/CIP spectrum, indicating the direct interaction of CIP with AgNPs. Meanwhile, peaks at 3366, 1700, 1454, and 1250 cm−1 in the CIP spectrum are attributed to the secondary amine, carboxyl group stretching, benzene double stretching, and C-F stretching, respectively. Similar spectra of PEI-AgNPs and PEI-AgNPs/CIP indicate the unchanged core structure of PEI-AgNPs. However, some changes in the PEI-AgNPs/CIP spectrum compared to PEI-AgNPs may correspond to the electrostatic interaction of terminal amine group of PEI with carboxyl and C-F groups of CIP. Moreover, the carbonyl and secondary amine groups of CIP might interact directly with AgNPs due to their electron-donating ability, as indicated by the change in behaviour of the typical peak of AgNPs at 1630 cm−1, see Scheme 1. An increase in the zeta potential and the average hydrodynamic size of PEI-AgNPs/CIP further support the hypothesis of the addition of more positive (-NH) functionalities that may be attributed to the direct additional interaction of AgNPs with CIP. The mechanism is different from promethazine sensing using PEI-AgNPs [21]. In this case, promethazine replaced PEI as a ligand for the stabilization of AgNPs. The hypothesis was supported by the presence of free PEI in PEI-AgNPs/PRO and a significant decrease in the hydrodynamic size.
As described earlier, the addition of CIP in PEI-AgNPs induces a hypochromic shift in the SPR band. The silver ions sterically stabilize in the microdomains of PEI through electrostatic forces. The CIP addition in PEI-AgNPs increased the hydrodynamic size and apparent zeta potential. These changes might be attributed to the presence of amine, carboxyl, C-F, and benzene groups on CIP. The electron donating ability of secondary amine and carbonyl groups on the CIP render a possibility of their direct interaction with AgNPs as indicated by the change in the behaviour of the typical AgNPs peak at 1630 nm in FTIR spectra. On the other hand, carboxyl and C-F groups of CIP can interact electrostatically with the amine groups of PEI. Consequently, an increase in the average hydrodynamic size and zeta potential is observed, see Scheme 1.

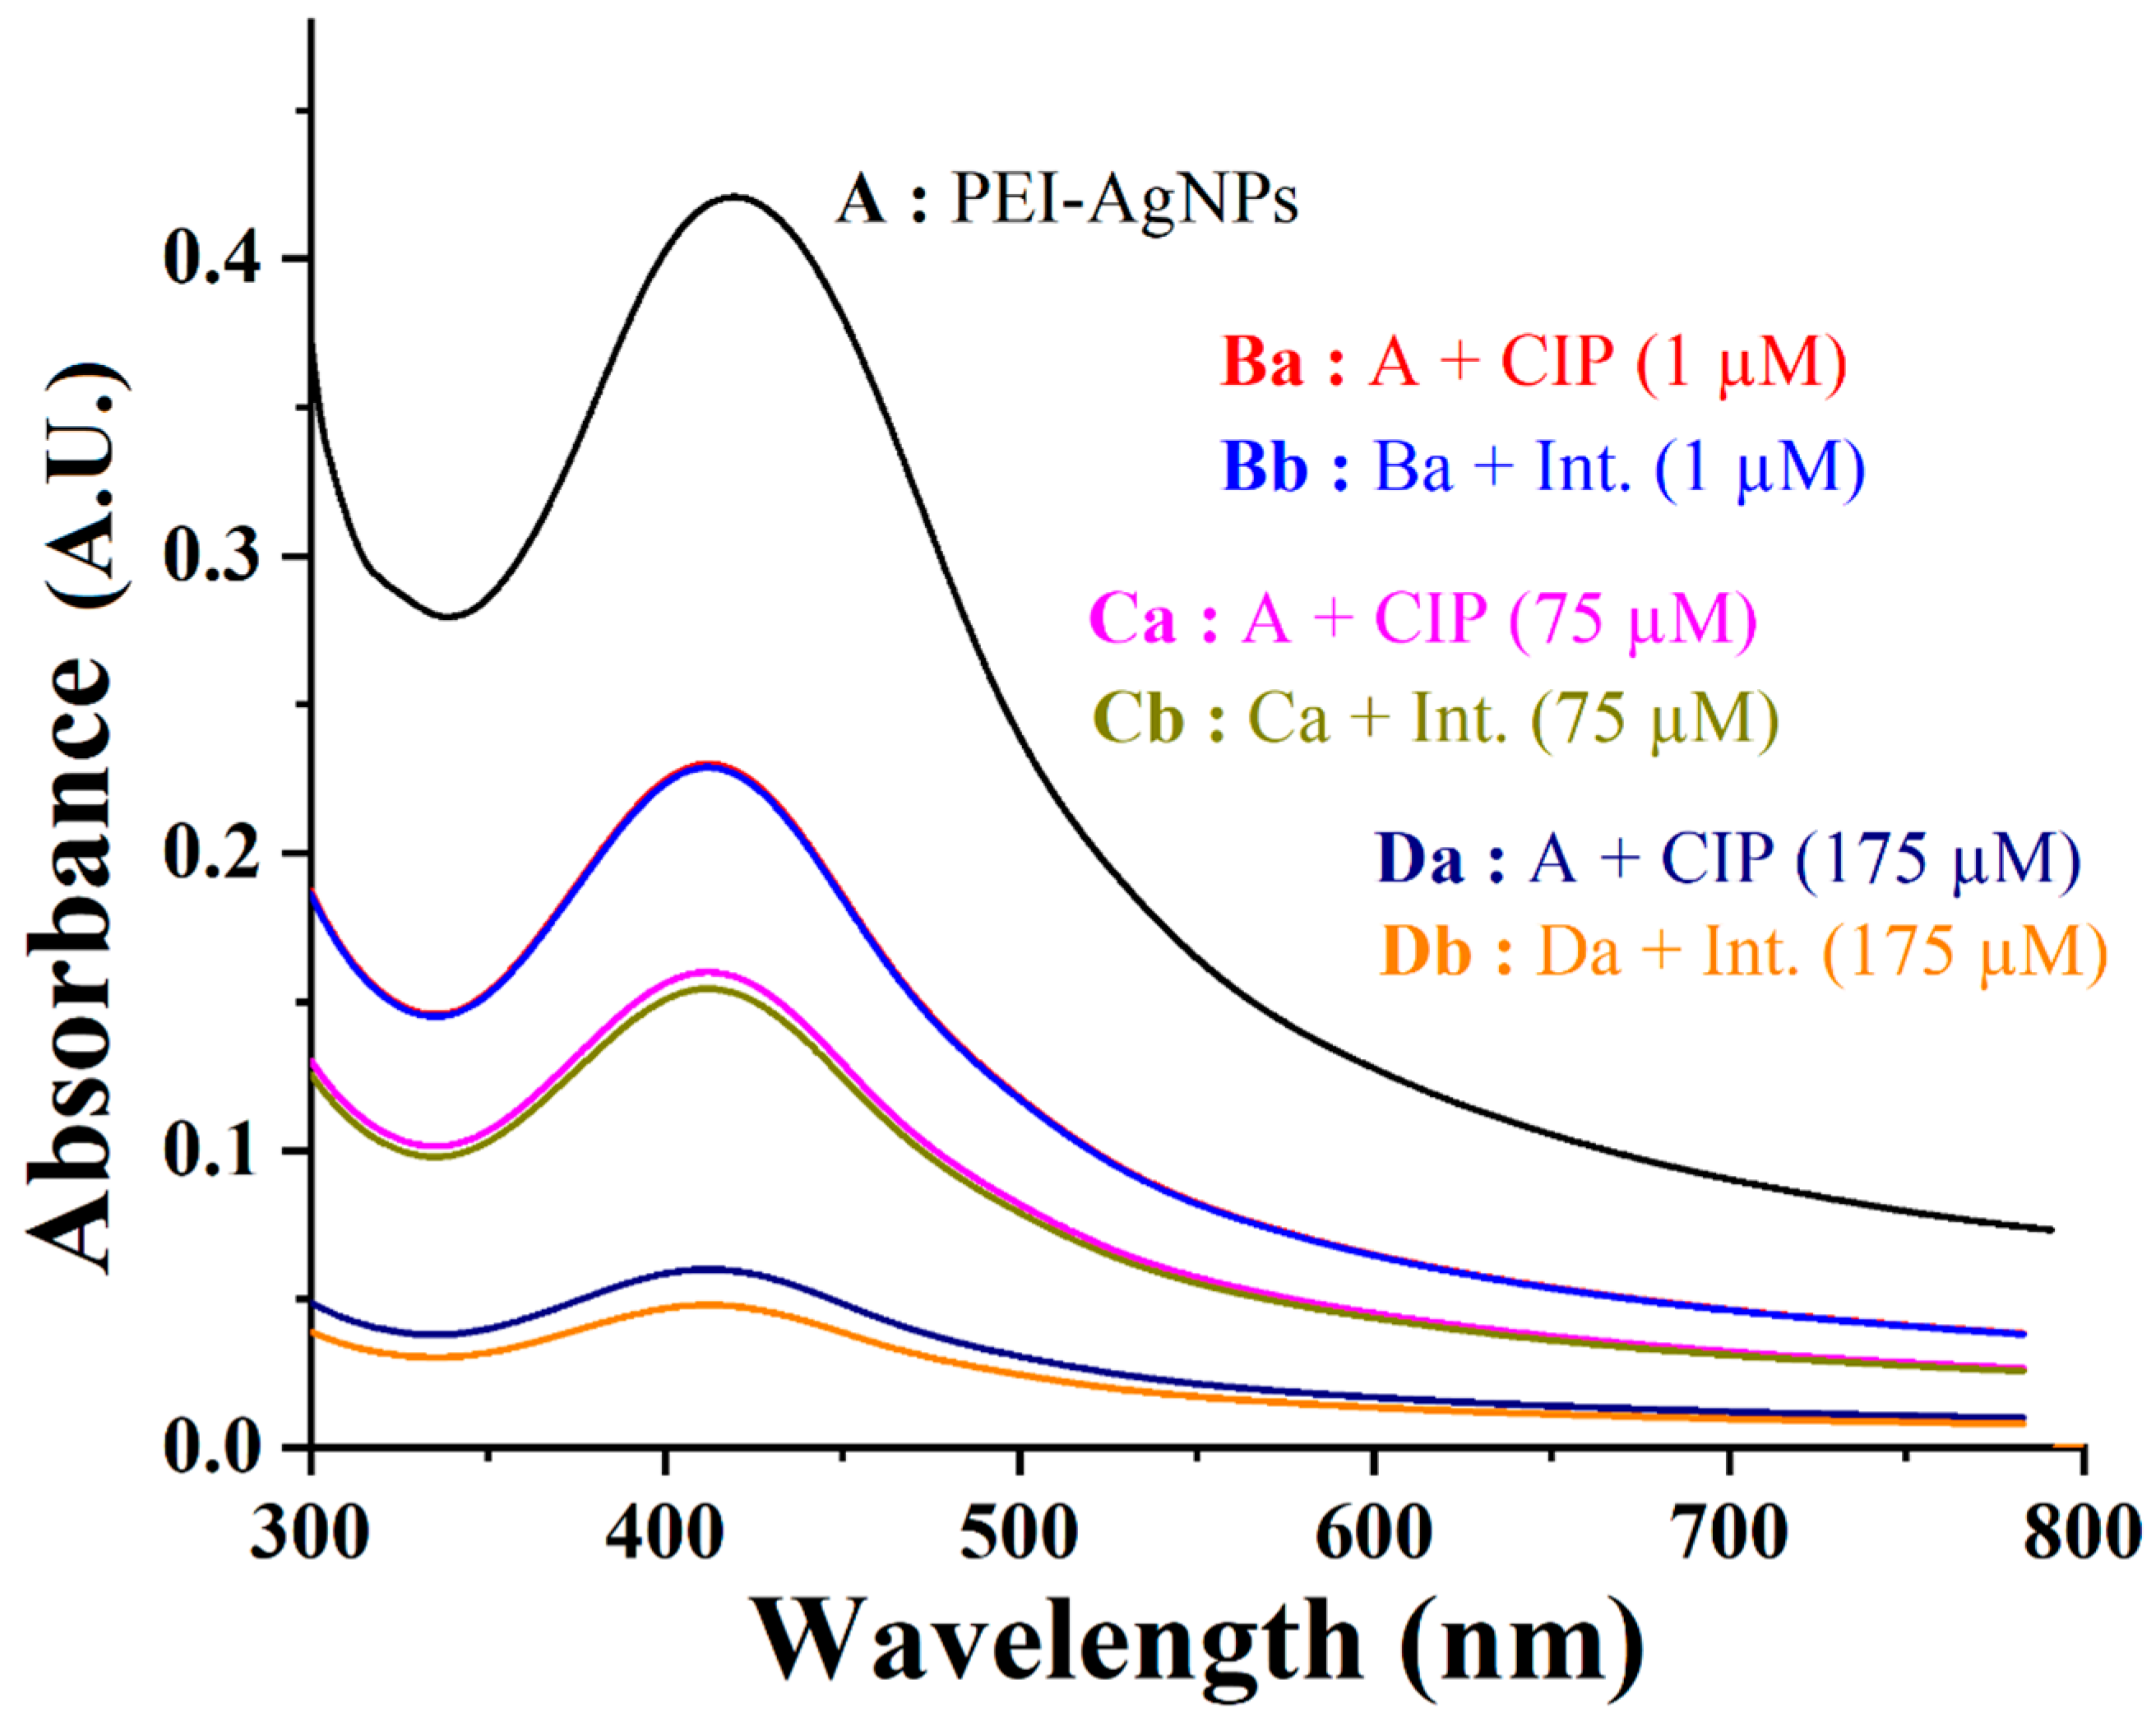
3.3. PEI-AgNPs as Ciprofloxacin Sensing Material

As mentioned earlier, the major target of this study was to develop a selective, sensitive, and specific sensing material for CIP. The addition of CIP in PEI-AgNPs resulted in an immediate visual change that was further endorsed by hypochromic SPR band shift (see Figure 2). The excellent selectivity of PEI-AgNPs was further evaluated in the context of quantitation. In this context, different concentrations of CIP were added to PEI-AgNPs in order to evaluate its quantitative performance. The SPR band of PEI-AgNPs remained unaffected by the addition of 0.05 µM CIP (see Figure 5A). However, the addition of 0.1 µM CIP resulted in a clear hypochromic shift from 0.42 A.U. to 0.24 A.U. A continuous increase in the quenching intensity is confirmed by further increase in the CIP concentration up to 200 µM. Moreover, the intensity of the SPR band after the addition of CIP in the concentration range of 0.1 to 200 µM has an inverse linear correlation with the quantity of added CIP (see Figure 5B). LOD (3.3σ/S) and LOQ (10σ/S) of the newly developed method for CIP sensing were 0.038 µM and 0.12 µM, respectively, and LDR was from 0.1 to 200 µM [47]. Moreover, the stoichiometric binding ratio of PEI-AgNPs and CIP was found to be 1:1 as per the Job plot (see Figure S7, Supplementary Material).
Two complementary techniques, UV-Vis spectrophotometry and UPLC, were used to validate the quantitative results of the proposed CIP sensing material. In UV-Vis spectra, CIP has two distinct absorption peaks at 276 nm and 322 nm. The peak at 276 nm has reliable concentration dependence and it is used for quantification (see Figure S8, Supplementary Material). To calculate the analytical parameters, a calibration curve was plotted—the absorbance at 276 nm against CIP concentration (10–150 µM). In LDR of 10–150 µM, LOD (3.3σ/S) and LOQ (10σ/S) for CIP using UV-Vis spectrophotometry were 0.128 µM and 0.4 µM, respectively.
Additionally, UPLC was also used to validate the quantitative results of the proposed colorimetric CIP assay. As discussed earlier, CIP has two distinct absorption peaks at 276 nm and 322 nm. A reliable linear dependence of absorbance at 276 nm on CIP concentration was used for its UV-vis detection. The UPLC chromatograms of CIP at different concentrations are shown in Figure S9A, Supplementary Material. A calibration curve was plotted—peak area at 270 nm against CIP concentration in the range of 75 to 200 µM (see Figure S9B, Supplementary Material). In LDR of 75–200 µM, LOD (3.3σ/S) and LOQ (10σ/S) were found to be 0.0018 µM and 0.006 µM, respectively.
Selectivity of any suggested method towards a certain analyte in the presence of additional interferents, both inorganic and organic, is the most important merit of any sensing method. In this context, the proposed method was evaluated for its specificity and selectivity using the same, double, and quadruple concentration of interferents compared to CIP. The addition of 175 µM interferent (Int.) along with the same amount of CIP increased the hypochromic shift in the SPR band compared to the addition of CIP alone to some extent that is similar for all the tested interferents (see Figure 6). However, the effect of interferents on the quantitative performance of the PEI-AgNPs-based colorimetric method for a lower concentration of CIP and interferents (1 and 75 µM) is not significant. Hence, the PEI-AgNPs-based sensing approach can detect CIP selectively and quantitatively in the presence of several interfering drugs and inorganic salts. The drugs and inorganic salts used in this study include cefixime, aspirin, cephradine, diazepam, levetiracetam, neomycin, cefaclor, theophylline, pregabalin, salbutamol, pyrazinamide, promethazine, sulphonamide, aminophylline, celecoxib, phenobarbital, levofloxacin, KCO3, NaHCO3, KOH, KI, and KCl. It is important to mention here that PEI-AgNPs have been reported for sensing of promethazine based on a prominent hyperchromic shift in the SPR band [21]. Herein, we noticed that the SPR band shift by simultaneous addition of promethazine and CIP is dominated by effect generated by the addition of CIP, indicating preferred interaction of CIP with PEI-AgNPs compared to promethazine. The addition of promethazine in the same amount as of CIP has similar effect on the SPR band shift as found for any other interferent. In order to clearly demonstrate the dominance of the effect induced by CIP over promethazine in the SPR band of PEI-AGNPs, the results of SPR band shift by individual addition of CIP are compared with simultaneous addition of CIP and promethazine, Figure S10-Supplementary Material.
Finally, a mixture of all interfering species (175 µM) and CIP (175 µM) was added to the PEI-AgNPs solution. The obtained results are similar to as if the same amount of interferents is present individually (see Figure S11, Supplementary Material). Hence, the PEI-AgNPs-based CIP sensing method proved to be quantitatively reliable in the presence of number of interfering species.
Until here, all the investigations were carried out in DI water. The major goal of this research was to evaluate the performance of the proposed PEI-AgNPs-based sensing system for biological and environmental samples such as blood serum, blood plasma, urine, and tap water. Blood serum, blood plasma, urine, and tap water samples spiked with different concentrations of CIP were mixed with PEI-AgNPs solution. The immediate disappearance of the typical yellow colour of PEI-AgNPs indicates the presence of CIP. The next pertinent question is the reliability of the proposed method for quantitation in these complex matrices. The decrease in the SPR band intensity in biological (plasma, serum, and urine) and environmental (tap water) samples follow the calibration curve as obtained in DI water (see Figure 7). The recoveries (amount of CIP detected as a percentage of the spiked amount) for different concentrations of CIP in tap water, blood serum, blood plasma, and urine are more than 98%, 96%, 95%, and 95%, respectively (see Table S1, Supplementary Material). The obtained data unambiguously demonstrate the applicability of the proposed CIP sensing method for the determination of CIP in environmental and biological samples.
Furthermore, the determination of CIP using the same concentrations was unsuccessful by UV-Vis spectrophotometry and UPLC. The UV-Vis spectrophotometry was able to detect CIP in biological, environmental, and commercial samples only at 75 µM concentration (see Figure S12, Supplementary Material). However, recovery in the case of urine samples was as low as 80% and only slightly higher for other samples (see Table S2, Supplementary Material). Moreover, UPLC was not able to detect CIP for all the used concentrations in biological and environmental samples except in serum at 75 µM. The recovery, in this case, was found to be as low as 35% (see Figure S13, Supplementary Material).
Finally, the PEI-AgNPs-based colorimetric sensing technique for CIP was compared with the complementary techniques UV-Vis spectrosphotometry and UPLC for quantitative analysis of commercial syrup in the context of quick quality control at any production facility (see Figure S14, Supplementary Material). An immediate disappearance of colour followed by an expected hypochromic shift for the PEI-AgNPs-based method for all tested concentrations endorse its applicability at a production facility for quick quality control. The recoveries for the spiked concentrations remained above 92% (see Table S1, Supplementary Material). On the other hand, UV-vis spectroscopy was able to detect only 75 µM concentration with a recovery of only 87% (see Table S1, Supplementary Material), while UPLC was unable to detect any of the tested concentrations. It is pertinent to mention here that we have employed a reported method of UPLC just for the comparison and validation of the results especially under standard conditions. The method can be further optimized for detection of CIP in real and pharmaceutical samples; however, it is beyond the scope of our current focus.
The quantitative performance of CIP detection methods is compared in Figure 8. In DI water, the results obtained for all the used concentrations are comparable by all three techniques, which validates the results obtained by the proposed method. However, UPLC was unsuccessful for all the real samples except for serum at 75 µM, while UV-Vis spectrophotometry could only detect 75 µM of CIP in all real samples. However, as discussed earlier, the recovery by UV-Vis spectrophotometry is lower for all cases. On the other hand, the newly proposed PEI-AgNPs-based sensing method for CIP has good performance for the tested concentrations in the biological, environmental, and commercial samples. Hence, the proposed method provides a simple, facile, and inexpensive approach for the determination of CIP and thus can be used in combination with the alarm systems.
Several methods, such as HPLC-FLD, UPLC MS/MS, atomic absorption spectroscopy, capillary zone electrophoresis, electrochemical method, and the spectrofluorometric method, have been reported for the detection of CIP in different samples (Table 1). These methods require a large quantity of solvents, an expensive instrumentation, and have lengthy analysis protocols. In comparison to the aforementioned methodologies, the currently developed method is efficient, rapid, affordable, simple, and applicable to on-the-spot analysis of biological, environmental, and commercial samples on a small scale. An important merit of the proposed colorimetric sensing approach is its applicability to real environmental, biological, and commercial samples with a reasonably low LOD compared to other reported methods that have sometimes higher LOD and can be applied only to commercial samples.

4. Conclusions

In this study, we have proposed a quick, simple, and on-the-spot method for the determination of CIP. The method is based on a systematic quenching of the SPR band of PEI-AgNPs by the addition of CIP. The first immediate indication of CIP sensing is the abrupt disappearance of the characteristic yellow colour of PEI-AgNPs. LOD and LOQ of the proposed method are 0.038 µM and 0.12 µM, respectively, and LDR is 0.1 to 200 µM. The developed sensing method is selective, efficient, and sensitive to CIP compared to the poor performance of UV-Vis spectrophotommetry and UPLC, especially in the presence of numerous interfering species and in real environmental, biological, and commercial pharmaceutical samples. In comparison to the previously reported methods, the current method is inexpensive, suitable for on-the-spot analysis, and facile, requiring simple instrumentation and less-trained operators. Moreover, the current method is applicable to real environmental, biological, and commercial pharmaceutical samples, which is the major merit compared to other reported methods. Hence, the CIP sensing method proposed in this study provides an excellent platform for facile quantitative detection of CIP in the envisaged alarm system.

Supplementary Materials

The following supporting information can be downloaded at: https://www.mdpi.com/article/10.3390/chemosensors11020091/s1, Figure S1: SPR band spectrum of PEI-AgNPs before and after incubation at 100 °C for 20 minutes; PEI-AgNPs (1:15), optical path length 1 cm; Figure S2: SPR band spectrum of PEI-AgNPs after addition of various concentration NaCl solution in a range of 0.01M-5M; PEI-AgNPs (1:15), optical path length 1 cm; Figure S3: SPR band spectrum of PEI-AgNPs at different pH; PEI-AgNPs (1:15), optical path length 1 cm; Figure S4: Structures of the drugs used in this study; Figure S5: AFM images of control (with no sample deposition) and size histogram showing an increase in the size of PEI-AgNPs before and after the addition of CIP; Figure S6: Results from EDX and mapping analysis of PEI-AgNPs and PEI-AgNPs/CIP; Figure S7: Job plot for binding ratio of PEI-AgNPs and CIP; Figure S8: (A) UV-Visible spectra of different concentrations of CIP; (B) calibration curve CIP - UV absorbance at 421 nm as a function of CIP concentration; Figure S9: (A) Detector response of the UPLC chromatogram at 276 nm; (B) Calibration curve of CIP for peak area as a function of CIP concentration; Figure S10: UV-Vis spectra showing the effect of added promethazine as an interfering drug on CIP sensing; Figure S11: UV-Vis spectra showing the effect of added mixture of interfering drugs on CIP sensing, total amount of mixture of interferents is equal to amount of CIP. Mixture of interferents includes cefixime, cephradine, diazepam, promethazine, levetiracetam, pregabalin, pyrazinamide, salbutamol, theophylline, sulfonamide, neomycin, aminophylline, aspirin, celecoxib, cefaclor, phenobarbital, levofloxacin, KCO3, NaHCO3, KOH, KI, and KCl; Figure S12: UV-Vis spectra of CIP in (A) tap water; (B) blood plasma; (C) urine; (D) serum; plasma, urine and serum samples were diluted with deionized water in a ratio of 1:5 before adding the mentioned amount of CIP; Figure S13: UPLC analysis of CIP (75 µM) in (A) tap water; (B) blood plasma; (C) urine; (D) serum; Figure S14: Commercial pharmaceuticals sample analysis using (A) PEI-AgNPs; (B) UV-Vis; (C) UPLC, Different concentrations of CIP were prepared using concentration information provided by producer; Table S1: Determination of CIP in environmental and biological samples by PEI-AgNPs based colorimetric sensor, all values are average of three determinations; Table S2: Determination of CIP in environmental and biological samples by UV-Vis spectrophotometry for the sake of comparison and validity of the developed sensor, all values are average of three determinations.

Author Contributions

Conceptualization, M.I.M. and J.B.; methodology, A.A. and D.A.R.; software, D.A.R.; validation, A.A., D.A.R. and F.-A.K.; formal analysis, A.A. and D.A.R.; investigation, A.A. and D.A.R.; resources, M.I.M., F.-A.K. and J.B.; data curation, A.A. and D.A.R.; writing—original draft preparation, A.A. and D.A.R.; writing—review and editing, M.I.M., F.-A.K. and J.B; visualization, M.I.M., F.-A.K. and J.B; supervision, M.I.M. and F.-A.K.; project administration, M.I.M.; funding acquisition, M.I.M. and J.B. All authors have read and agreed to the published version of the manuscript.

Funding

This research received no external funding.

Institutional Review Board Statement

The human study protocol was approved by the Institutional Ethical Committee of Centre for Bioequivalence Studies and Clinical Research (CBSCR), International Centre for Chemistry and Biological Sciences (ICCBS), University of Karachi (CB-033-CIP(N)-2020/Protocol/1.0 dated June 19, 2020) for studies involving human samples.

Informed Consent Statement

Informed consent was obtained from all subjects involved in the study.

Data Availability Statement

The data presented in this study are available in the article and Supplementary Material.

Conflicts of Interest

The authors declare no conflict of interest.

References

  1. Zhang, R.; Zhang, R.; Li, J.; Cheng, Z.; Luo, C.; Wang, Y.; Yu, K.; Zhang, G. Occurrence and distribution of antibiotics in multiple environmental media of the East River (Dongjiang) catchment, South China. Environ. Sci. Pollut. Res. 2017, 24, 9690–9701. [Google Scholar]
  2. Paton, J.; Reeves, D. Fluoroquinolone antibiotics. Drugs 1988, 36, 193–228. [Google Scholar] [CrossRef] [PubMed]
  3. Pascual-Reguera, M.I.; Parras, G.P.; Díaz, A.M. Solid-phase UV spectrophotometric method for determination of ciprofloxacin. Microchem. J. 2004, 77, 79–84. [Google Scholar]
  4. Meyerhoff, A.; Albrecht, R.; Meyer, J.M.; Dionne, P.; Higgins, K.; Murphy, D. US Food and Drug Administration approval of ciprofloxacin hydrochloride for management of postexposure inhalational anthrax. Clin. Infect. Dis. 2004, 39, 303–308. [Google Scholar] [PubMed]
  5. Sharma, P.C.; Jain, A.; Jain, S.; Pahwa, R.; Yar, M.S. Ciprofloxacin: Review on developments in synthetic, analytical, and medicinal aspects. J. Enzym. Inhib. Med. Chem. 2010, 25, 577–589. [Google Scholar]
  6. Castro, W.; Navarro, M.; Biot, C. Medicinal potential of ciprofloxacin and its derivatives. Future Med. Chem. 2013, 5, 81–96. [Google Scholar]
  7. Cao, X.-L.; Zhang, Q.-H.; Pan, X.-H.; Chen, Z.; Lü, J. Mechanochemical synthesis of nano–ciprofloxacin with enhanced antibacterial activity. Inorg. Chem. Commun. 2019, 102, 66–69. [Google Scholar]
  8. Sha, J.; Lin, H.; Timira, V.; Sui, J. The Construction and Application of Aptamer to Simultaneous Identification of Enrofloxacin and Ciprofloxacin Residues in Fish. Food Anal. Methods 2021, 14, 957–967. [Google Scholar]
  9. Xiong, J.-Q.; Kurade, M.B.; Kim, J.R.; Roh, H.-S.; Jeon, B.-H. Ciprofloxacin toxicity and its co-metabolic removal by a freshwater microalga Chlamydomonas mexicana. J. Hazard. Mater. 2017, 323, 212–219. [Google Scholar] [CrossRef]
  10. Rahimpour, R.; Sabeti, B.; Chekin, F. Electrochemical sensor based on nitrogen doped porous reduced graphene oxide to detection of ciprofloxacin in pharmaceutical samples. Russ. J. Electrochem. 2021, 57, 654–662. [Google Scholar]
  11. Taghizade, M.; Ebrahimi, M.; Fooladi, E.; Yoosefian, M. Simultaneous spectrophotometric determination of the residual of ciprofloxacin, famotidine, and tramadol using magnetic solid phase extraction coupled with multivariate calibration methods. Microchem. J. 2021, 160, 105627. [Google Scholar]
  12. Yuan, X.; Lv, W.; Wang, B.; Yan, C.; Ma, Q.; Zheng, B.; Du, J.; Xiao, D. Silicon nanoparticles-based ratiometric fluorescence platform: Real-time visual sensing to ciprofloxacin and Cu2+. Spectrochim. Acta Part A 2021, 253, 119599. [Google Scholar] [CrossRef] [PubMed]
  13. Brito, J.; Bernardoni, V.; da Silva, T.M.; Ramos, L.S.; Gomes, M.P.; Assis, D. Development and Validation of a Rapid and Reliable HPLC-FLD Method for the Quantification of Ciprofloxacin and Enrofloxacin Residues in Zea mays. J. Braz. Chem. Soc. 2022, 33, 128–134. [Google Scholar] [CrossRef]
  14. Sharma, P.; Kumar, D.; Mutnuri, S. UPLC–MS/MS method validation of ciprofloxacin in human urine: Application to biodegradability study in microbial fuel cell. Biomed. Chromatogr. 2019, 33, e4392. [Google Scholar]
  15. Faria, A.F.; de Souza, M.V.; de Oliveira, M.A. Validation of a capillary zone electrophoresis method for the determination of ciprofloxacin, gatifloxacin, moxifloxacin and ofloxacin in pharmaceutical formulations. J. Braz. Chem. Soc. 2008, 19, 389–396. [Google Scholar]
  16. Ragab, G.H.; Amin, A.S. Atomic absorption spectroscopic, conductometric and colorimetric methods for determination of fluoroquinolone antibiotics using ammonium reineckate ion-pair complex formation. Spectrochim. Acta Part A 2004, 60, 973–978. [Google Scholar]
  17. Cancino, J.; Razzino, C.A.; Zucolotto, V.; Machado, S.A. The use of mixed self-assembled monolayers as a strategy to improve the efficiency of carbamate detection in environmental monitoring. Electrochim. Acta 2013, 87, 717–723. [Google Scholar]
  18. Caro, C.; Castillo, P.M.; Klippstein, R.; Pozo, D.; Zaderenko, A.P. Silver nanoparticles: Sensing and imaging applications. Silver Nanoparticles 2010, 201–223. [Google Scholar]
  19. Prasher, P.; Sharma, M.; Mudila, H.; Gupta, G.; Sharma, A.K.; Kumar, D.; Bakshi, H.A.; Negi, P.; Kapoor, D.N.; Chellappan, D.K. Emerging trends in clinical implications of bio-conjugated silver nanoparticles in drug delivery. Colloid Interface Sci. Commun. 2020, 35, 100244. [Google Scholar]
  20. Alberti, G.; Zanoni, C.; Magnaghi, L.R.; Biesuz, R. Gold and silver nanoparticle-based colorimetric sensors: New trends and applications. Chemosensors 2021, 9, 305. [Google Scholar] [CrossRef]
  21. Raja, D.A.; Shah, M.R.; Malik, M.I. Polyethyleneimine stabilized silver nanoparticles as an efficient and selective colorimetric assay for promethazine. Anal. Chim. Acta 2022, 1223, 340216. [Google Scholar] [PubMed]
  22. Fang, R.; Jing, H.; Chai, Z.; Zhao, G.; Stoll, S.; Ren, F.; Liu, F.; Leng, X. Study of the physicochemical properties of the BSA: Flavonoid nanoparticle. Eur. Food Res. Technol. 2011, 233, 275–283. [Google Scholar]
  23. Jamal, H.S.; Raja, R.; Ahmed, S.W.; Shah, M.R.; Ahmed, S.; Ali, S.A. Simultaneous Colorimetric Sensing of Anion (I) and Cation (Fe2+) by Protein Functionalized Silver Nanoparticles in Real Samples. J. Clust. Sci. 2022, 33, 1501–1514. [Google Scholar] [CrossRef]
  24. Xue, Y.; Dong, B.; Liu, X.; Wang, F.; Yang, J.; Liu, D. Using selenium-conjugated polyethylene glycol to enhance the stability of gold nanoparticles in biologically relevant samples. Sci. China Chem. 2019, 62, 280–286. [Google Scholar]
  25. Rahim, S.; Bhayo, A.M.; Shah, M.R.; Malik, M.I. Star-shaped poly (ethylene oxide)-block-poly (caprolactone) conjugated silver nanoparticles: A colorimetric probe for cephalexin in environmental, biological and pharmaceutical samples. Microchem. J. 2019, 149, 104048. [Google Scholar]
  26. Rahim, S.; Khalid, S.; Bhanger, M.I.; Shah, M.R.; Malik, M.I. Polystyrene-block-poly (2-vinylpyridine)-conjugated silver nanoparticles as colorimetric sensor for quantitative determination of Cartap in aqueous media and blood plasma. Sens. Actuators B 2018, 259, 878–887. [Google Scholar] [CrossRef]
  27. Shaban, S.M.; Lee, J.Y.; Kim, D.-H. Dual-surfactant-capped Ag nanoparticles as a highly selective and sensitive colorimetric sensor for citrate detection. ACS Omega 2020, 5, 10696–10703. [Google Scholar]
  28. Shaban, S.M.; Moon, B.-S.; Pyun, D.-G.; Kim, D.-H. A colorimetric alkaline phosphatase biosensor based on p-aminophenol-mediated growth of silver nanoparticles. Colloids Surf. B 2021, 205, 111835. [Google Scholar]
  29. Sapsford, K.E.; Algar, W.R.; Berti, L.; Gemmill, K.B.; Casey, B.J.; Oh, E.; Stewart, M.H.; Medintz, I.L. Functionalizing nanoparticles with biological molecules: Developing chemistries that facilitate nanotechnology. Chem. Rev. 2013, 113, 1904–2074. [Google Scholar]
  30. Raja, D.A.; Munir, F.; Shah, M.R.; Bhanger, M.I.; Malik, M.I. Colorimetric sensing of cephradine through polypropylene glycol functionalized gold nanoparticles. R. Soc. Open Sci. 2021, 8, 210185. [Google Scholar]
  31. Raja, D.A.; Musharraf, S.G.; Shah, M.R.; Jabbar, A.; Bhanger, M.I.; Malik, M.I. Poly (propylene glycol) stabilized gold nanoparticles: An efficient colorimetric assay for ceftriaxone. J. Ind. Eng. Chem. 2020, 87, 180–186. [Google Scholar]
  32. Sarkar, B.; Mondal, P. Colorimetric Sensors of Hg2+ Ion Based on Functionalized Gold and Silver Nanoparticles. J. Water Environ. Nanotechnol. 2021, 6, 22–40. [Google Scholar]
  33. Rahim, S.; Rauf, A.; Rauf, S.; Shah, M.R.; Malik, M.I. Enhanced electrochemical response of a modified glassy carbon electrode by poly (2-vinlypyridine-b-methyl methacrylate) conjugated gold nanoparticles for detection of nicotine. RSC Adv. 2018, 8, 35776–35786. [Google Scholar] [CrossRef] [PubMed] [Green Version]
  34. Maruthupandi, M.; Chandhru, M.; Rani, S.K.; Vasimalai, N. Highly selective detection of iodide in biological, food, and environmental samples using polymer-capped silver nanoparticles: Preparation of a paper-based testing kit for on-site monitoring. ACS Omega 2019, 4, 11372–11379. [Google Scholar]
  35. Jäger, M.; Schubert, S.; Ochrimenko, S.; Fischer, D.; Schubert, U.S. Branched and linear poly (ethylene imine)-based conjugates: Synthetic modification, characterization, and application. Chem. Soc. Rev. 2012, 41, 4755–4767. [Google Scholar] [CrossRef]
  36. Patnaik, S.; Gupta, K.C. Novel polyethylenimine-derived nanoparticles for in vivo gene delivery. Expert Opin. Drug Deliv. 2013, 10, 215–228. [Google Scholar] [CrossRef]
  37. Akinc, A.; Thomas, M.; Klibanov, A.M.; Langer, R. Exploring polyethylenimine-mediated DNA transfection and the proton sponge hypothesis. J. Gene Med. A Cross-Discip. J. Res. Sci. Gene Transf. Its Clin. Appl. 2005, 7, 657–663. [Google Scholar] [CrossRef]
  38. Kang, J.-H.; Tachibana, Y.; Kamata, W.; Mahara, A.; Harada-Shiba, M.; Yamaoka, T. Liver-targeted siRNA delivery by polyethylenimine (PEI)-pullulan carrier. Bioorg. Med. Chem. 2010, 18, 3946–3950. [Google Scholar] [CrossRef]
  39. Lee, H.J.; Lee, S.G.; Oh, E.J.; Chung, H.Y.; Han, S.I.; Kim, E.J.; Seo, S.Y.; Do Ghim, H.; Yeum, J.H.; Choi, J.H. Antimicrobial polyethyleneimine-silver nanoparticles in a stable colloidal dispersion. Colloids Surf. B Biointerfaces 2011, 88, 505–511. [Google Scholar] [CrossRef]
  40. Zhou, T.; Su, Z.; Wang, X.; Luo, M.; Tu, Y.; Yan, J. Fluorescence detections of hydrogen peroxide and glucose with polyethyleneimine-capped silver nanoclusters. Spectrochim. Acta Part A Mol. Biomol. Spectrosc. 2021, 244, 118881. [Google Scholar] [CrossRef]
  41. Yee, M.S.-L.; Khiew, P.-S.; Chiu, W.S.; Tan, Y.-F.; Leong, C.-O. Polyethyleneimine-capped silver nanoparticles as antifouling photocatalyst for wastewater treatment. Mater. Today Proc. 2019, 19, 1497–1506. [Google Scholar]
  42. Huang, W.; Wang, Y.; Wang, L.; Pan, C.; Shen, G. Colorimetric detection of ciprofloxacin in aqueous solution based on an unmodified aptamer and the aggregation of gold nanoparticles. Anal. Methods 2021, 13, 90–98. [Google Scholar] [PubMed]
  43. Kobayashi, S.; Hiroishi, K.; Tokunoh, M.; Saegusa, T. Chelating properties of linear and branched poly (ethylenimines). Macromolecules 1987, 20, 1496–1500. [Google Scholar]
  44. Evanoff Jr, D.D.; Chumanov, G. Synthesis and optical properties of silver nanoparticles and arrays. ChemPhysChem 2005, 6, 1221–1231. [Google Scholar] [CrossRef]
  45. Liu, B.; Liu, J. Surface modification of nanozymes. Nano Res. 2017, 10, 1125–1148. [Google Scholar] [CrossRef]
  46. Bélteky, P.; Rónavári, A.; Igaz, N.; Szerencsés, B.; Tóth, I.Y.; Pfeiffer, I.; Kiricsi, M.; Kónya, Z. Silver nanoparticles: Aggregation behavior in biorelevant conditions and its impact on biological activity. Int. J. Nanomed. 2019, 14, 667. [Google Scholar] [CrossRef] [Green Version]
  47. Sarkar, M.; Khandavilli, S.; Panchagnula, R. Development and validation of RP-HPLC and ultraviolet spectrophotometric methods of analysis for the quantitative estimation of antiretroviral drugs in pharmaceutical dosage forms. J. Chromatogr. B 2006, 830, 349–354. [Google Scholar]
Figure 1. (A) UV-visible spectrum of the PEI-AgNPs; inset shows absorbance while using different ratios of PEI and AgNO3; (B) 3D AFM image of PEI-AgNPs [PEI:AgNO3 = 1:15 (v/v)].
Chemosensors 11 00091 g001
Figure 2. UV-visible spectra of PEI-AgNPs before and after individual addition of CIP and other pharmaceutical drugs; Drug concentration: 1.0 mM, PEI-AgNPs (1:15), optical path length 1 cm.
Chemosensors 11 00091 g002
Figure 3. Effect of addition of CIP in PEI-AgNPs. (A) PEI-AgNPs (1:15), (B) PEI-AgNPs (1:15)/CIP (1.0 mM); (I) AFM, (II) SEM, (III) Average size by zeta sizer, (IV) Zeta potential.
Chemosensors 11 00091 g003
Figure 4. FTIR spectra of PEI, PEI-AgNPs (1:15), CIP, and PEI-AgNPs (1:15)/CIP (1.0 mM).
Chemosensors 11 00091 g004
Scheme 1. Scheme for the stabilization of AgNPs with PEI and sensing of CIP.
Chemosensors 11 00091 sch001
Figure 5. (A) UV-visible spectra of PEI-AgNPs alone and after adding different concentrations of CIP in PEI-AgNPs (B) plot of absorbance versus different concentrations of CIP ranging from 0.1–200 µM, inset shows a magnified view of the concentration dependence of absorbance in the range of 0.1–10 µM.
Chemosensors 11 00091 g005
Figure 6. The quantitative effect of interfering drugs on CIP sensing by PEI-AgNPs through UV-Vis spectrophotometry, wherein A represents PEI-AgNPs; addition of different amounts of CIP in PEI-AgNPs is represented by Ba, Ca, and Da; addition of CIP to PEI-AgNPs along with the same amount of the interferents is represented by Bb, Cb, and Db. Individually added interferents were cefixime, aspirin, cephradine, diazepam, promethazine, levetiracetam, neomycin, cefaclor, theophylline, pregabalin, salbutamol, pyrazinamide, sulphonamide, aminophylline, celecoxib, phenobarbital, levofloxacin, KCO3, NaHCO3, KOH, KI, and KCl.
Chemosensors 11 00091 g006
Figure 7. SPR band of PEI-AgNPs after the addition of different concentrations of CIP in (A) tap water, (B) plasma, (C) urine, (D) blood serum; plasma, urine, and serum samples were diluted with deionized water in a ratio of 1:5 before making the mentioned concentration of CIP.
Chemosensors 11 00091 g007
Figure 8. Quantitative performance of PEI-AgNPs based colorimetric sensing method for CIP compared to UV-Vis spectrophotometry and UPLC-based methods in tap water, blood serum, blood plasma, urine, and commercial pharmaceutical sample with reference to their response in DI water.
Chemosensors 11 00091 g008
Table 1. Comparison of the analytical methods for the determination of CIP.
MethodLDR
(nM) *
a LODb LOD (nM) *SamplesRemarksReferences
Electrochemical sensing (Nitrogen-doped porous RGO)1.0 × 10²–1.0 × 10439 nM39Pharmaceutical sampleExpensive instrumentation, high-cost electrodes, trained operators, no interference study, no environmental and biological sample study.[10]
Spectrophotometry
(Solid-phase extraction)
4.5 × 10³–90.5 × 1030.005 mg/L15.1Pharmaceutical sampleTedious protocol, no naked eye detection, no interference study, no environmental and biological sample study.[11]
Spectrofluorometry2.1 × 102–1.3 × 10589 nM89Pure drug sampleInstrument-based analysis, no naked eye detection, trained personnel, no interference study, no environmental and biological sample study.[12]
HPLC-FLD90.5–3.0 × 10216.65 μg/kg50.2Standard drug sampleExpensive instrumentation, no naked eye detection, trained personnel, no interference study, no environmental and biological sample study.[13]
Colorimetric sensing (aptasensor-based AuNPs)20–3.0 × 1020.215 nM0.215Aqueous sampleRequirement of sequence of CIP–aptamer, no comprehensive interference study, no study in biological sample.[23,42]
UPLC MS/MS4.7–3.0 × 1020.76 ng/mL2.2Human urine sampleExpensive instrumentation, no naked eye detection, trained personnel, no interference study, no environmental and biological sample study.[14]
Capillary Zone ElectrophoresisN/A2.72 mg/L8209Pharmaceutical SampleExpensive instrumentation, no naked eye detection, trained personnel, no interference study, no environmental and biological sample study.[15]
Atomic absorption spectroscopy1.5 × 104–4.2 × 10⁵ 1.4 µg/mL 4225Pharmaceutical sampleExpensive instrumentation, no naked eye detection, trained personnel, no interference study, no environmental and biological sample study.[16]
Colorimetric sensing (PEI-AgNPs)1.0 × 10²–2.0 × 1050.038 µM38Tap Water, Blood Plasma, Serum, Urine, and Pharmaceutical FormulationsQuick and easy method, low-cost, on-site naked eye detection, highly selective and sensitive, reliable quantitation, interferences study, real sample such as biological, environmental, and commercial drug samples[Present work]
a LOD as given in the reference; b LOD expressed in nM for better comparison; * LDR Converted to nM for better comparison.
Disclaimer/Publisher’s Note: The statements, opinions and data contained in all publications are solely those of the individual author(s) and contributor(s) and not of MDPI and/or the editor(s). MDPI and/or the editor(s) disclaim responsibility for any injury to people or property resulting from any ideas, methods, instructions or products referred to in the content.

