Abstract
Femtosecond laser ablation spark-induced breakdown spectroscopy (fs LA-SIBS) was developed to quantitatively analyze vanadium, molybdenum, chromium, manganese, aluminum, nickel, and copper in a steel alloy. In the experiment, a femtosecond laser operating at a repetition rate of 1 kHz was used as the laser ablation source, and spark discharge was utilized to re-excite the plasma and enhance the atomic intensity. A compact fiber spectrometer was used to record and analyze the plasma emission spectra in a nongated signal-recording mode. The calibration curves of V, Mo, Cr, Mn, Al, Ni, and Cu elements in steel alloy samples were established, and the detection limits of these elements were determined to be 10.9, 12.6, 4.0, 5.7, 8.7, 7.9, and 3.1 ppm with fs LA-SIBS, respectively, which were 4–12-fold better than those achieved with femtosecond laser-induced breakdown spectroscopy (fs LIBS). Compared with conventional LIBS, the fs LA-SIBS technique provided a rapid and high spatial resolution approach to quantitative elemental analysis, with better analytical sensitivity.
1. Introduction
Laser-induced breakdown spectroscopy (LIBS) is a qualitative detection and quantitative analysis technique based on the interaction between a laser and a material [1,2,3,4]. A focused laser is used to produce plasma by ablating the surface of the samples. The elemental composition and content of the samples are obtained by collecting and analyzing the plasma spectrum. Its advantages include simultaneous multielement analysis [5], minimal sample preparation, and fast, online, and in situ analysis [6,7]. LIBS has achieved rapid development and found wide applications in many fields, including the metallurgical [8], energy [9], environment [10,11], archeology [12,13], food analysis [14], and biomedicine [15,16] industries.
Steel alloys are widely used in modern industries, such as for mechanical parts, construction, bridges, ships, automobiles, aerospace, etc. Having a rapid and sensitive elemental analysis for steel alloys is very important and necessary. However, conducting a quantitative analysis of the elements found in a steel alloy is challenging because of their complex elemental composition and serious matrix effects [17,18]. The traditional spectroscopic techniques for directly analyzing alloy elements are spark discharge optical emission spectroscopy (spark-OES) and X-ray fluorescence (XRF). These two techniques have been widely used in the metallurgical industry. However, the spark-OES instrument is too large, which is inconvenient for in situ analysis, and the surface of the test sample needs to be polished before the analysis. Additionally, the sensitivity of XRF for light element analysis is usually poor. In recent decades, LIBS was developed and successfully applied to the in situ quantitative analysis of steel alloys [19]. Most LIBS studies on steel alloys are based on a Q-switch Nd:YAG laser operated at a low repetition rate (generally at 5–20 Hz), and a pulse width of the laser in the range of several nanoseconds to more than dozens of nanoseconds [20]. Liu et al. performed LIBS analyses of Mn, Ni, Cr, and Cu in steel with reported calibrations within the concentration range of 0.013–2.51%, and the limits of detection of LIBS in this work were sufficient to meet the requirements for an in situ steel analysis [21]. Aragon et al. performed a LIBS analysis for Cr and Ni in low-alloy steels with calibration curves in the range of 0.0016–2.3% and detection limits between 6 and 50 ppm, respectively [22]. As reported by Stipe, a standard LIBS calibration technique using peak area integration normalized with an internal standard was carried out to quantify chromium, nickel, and manganese in a steel alloy, with detection limits of 213, 72, and 13 ppm for Cr, Ni, and Mn, respectively [23]. In a study by Sturm et al., two-pulse Q-switched Nd:YAG laser beams (wavelength 1064 nm) were used to locally ablate the scale layer of steel samples in the first step, and the LIBS technique was utilized to analyze the bulk material in the second step. The detection limits for Al, Cr, Cu, Mn, and Mo were 7, 7, 6, 4, and 31 μg/g−1, respectively. The values correlated with a coefficient of determination greater than 0.99, averaged over the observed elements [24]. LIBS with a ring-magnet confinement approach was used to improve the detection sensitivity of V and Mn elements in steel. The optical emission and signal-to-noise ratio (SNR) for both V and Mn were enhanced with ring-magnet confinement. The detection limits of V and Mn in the steels were 11 and 30 ppm, respectively, with the ring magnet, which was better than that in a degaussed magnet or open air [25].
The interaction of the nanosecond laser with matter was much greater than that of the femtosecond laser. LIBS using a nanosecond or femtosecond laser is usually referred to as ns (nanosecond) LIBS or fs (femtosecond) LIBS. Fs LIBS has some important advantages over nanosecond LIBS, such as better reproducibility [26,27], high peak power, low thermal effect, and high spatial resolution [28,29,30,31]. Therefore, fs LIBS is particularly useful for elemental microanalysis, chemical imaging, and mapping and depth profiling applications with high spatial resolution in steel alloys. As reported in an earlier fs LIBS study, the duration of the spectral emission was shorter than 1 μs [32]. In addition, if the femtosecond laser single-pulse energy is low, which may not be enough to thoroughly break down an atom or atomization, it can lead to a weak plasma emission, which is insufficient for ensuring the attainment of the sensitive elemental analysis in a steel alloy. To improve the sensitivity of elemental analysis, a high-voltage spark discharge-assisted fs LIBS is used to re-excite and significantly enhance the plasma emission after femtosecond laser ablation and induced plasma; thus, it is more suitable to be termed femtosecond laser ablation (LA) spark-induced breakdown spectroscopy (fs LA-SIBS). The spark discharge technique is demonstrated to be a valuable method for the enhancement of the line emission for laser-induced plasma. It can also operate under low and high repetition rates [33,34,35,36].
In this work, fs LA-SIBS was used to quantitatively analyze elements in steel alloy samples. The femtosecond laser was operated at a 1 kHz pulse repetition rate. The calibration curves of V I 427.92 nm, Mo I 379.82 nm, Cr I 425.43 nm, Mn I 403.08 nm, Al I 394.40 nm, Ni I 352.45 nm, and Cu I 324.75 nm elements in steel alloy samples were eventually established, and the detection limits of these elements were determined in order to evaluate and discuss the spectral analytical performance of this technique.
2. Experiment
2.1. Experimental Setup
The experimental setup of the fs LA-SIBS in this study is schematically shown in Figure 1. An ultrafast femtosecond laser (Astrella-Tunable-USP-1K, Coherent Inc., Santa Clara, CA, USA), operated at a repetition rate of 1 kHz, was used as the laser source to ablate the sample. The central wavelength of the femtosecond laser was 800 nm, and the pulse of this laser was approximately 35 fs, with a maximum output pulse energy of 7.5 mJ. The output laser beam had a diameter of 10 mm. The laser was tightly focused on the sample surface using a quartz lens L1 (f = 50 mm) to ablate the sample and produce laser-induced plasma. The laser single-pulse energy was adjusted using an energy attenuation system consisting of two Glan–Taylor linear polarizers, P1 and P2. The single-pulse laser energy was detected using an energy meter (Vega, Ophir Optronics Solutions Company Limited, Jerusalem, Israel). The standard steel alloy sample was mounted on a 2D moving platform at a moving speed of 2 mm/s. The platform was electrically insulated from the steel alloy sample using an acrylic plate.
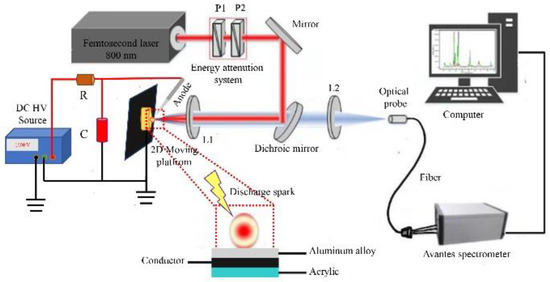
Figure 1.
Schematic diagram of fs LA-SIBS. P1 and P2: Glan–Taylor polarizer; L1 and L2: quartz lens; R: resistor; C: capacitor.
The spark discharge unit consisted of a direct current (DC) high-voltage power source (10 kV, 0.2 A), current-limiting resistor R (R = 100 kΩ), and capacitance C. In the spark discharge unit, a tungsten needle with a diameter of 2 mm was used as the anode, and a sample plate was selected as the cathode. A spark discharge was ignited simultaneously once the plasma was generated with the laser irradiation of the sample surface. Thus, an enhanced optical spectral emission could be detected in the experiment.
The optical spectral emission of the plasma was collimated with a dichroic mirror and collected and focused with a quartz lens L2 (f = 50 mm) onto the optical probe of a three-channel compact fiber spectrometer (Avantes, Netherlands, model 1202156U3, 1202157U3, and 1202158U3) coupled with linear array charge-coupled device (CCD) detectors in each channel. The wavelength range of this fiber spectrometer was 200–500 nm. Each CCD had 2048 pixels, and its spectral resolution was better than 0.1 nm. In the experiment, the spectrometer was operated in a nongated signal recording and analysis mode; thus, no synchronization was requested with a femtosecond laser. The data stored in the fiber spectrometer could finally be transferred to a computer for further processing.
2.2. Sample Preparation
A set of certified steel alloy standard samples (GBW(E)01249a, 010381a, 010383a, 010384a, 010459a, 010426, 010460, 010495, 010499, and 010503) was purchased from Zhongbiao Technology Co., Ltd., Jinan, China. The steel alloy samples were analyzed to evaluate the analytical performance of the femtosecond LA-SIBS technique. The concentrations of V, Mo, Cr, Mn, Al, Ni, and Cu elements in the steel alloy samples are listed in Table 1.

Table 1.
List of mass concentrations (wt%) of constituent elements in certified steel alloy samples.
3. Results and Discussion
3.1. Observation of Plasma Emission Enhancement
Figure 2 shows the plasma emission spectra of fs LA-SIBS and fs LIBS. Standard steel alloy sample no. GBW(E)010499 was used for the analysis. An Avantes multichannel spectrometer was used to record the plasma optical emission in the wavelength region of 280–500 nm. Because the atomic lines were relatively weak in the wavelength region of 200–280 nm, and the continuum background intensity was stronger, the spectra in this area were not considered here. The observed lines included the V, Mo, Cr, Mn, Al, Ni, and Cu elements in the steel alloy. These chosen atomic wavelengths were referenced from the NIST database. In this step, the integration time of the CCD was 2 ms, and the average number of repetitions for each measurement while recording the spectra was 500. The single-pulse energy of the femtosecond laser was 0.4 mJ, and the discharge voltage and capacitance were 2.4 kV and 20 nF, respectively. In Figure 2, it can be observed that the spectrum intensity achieved using the fs LA-SIBS technique was a factor of nine greater than the peak intensity of that obtained using the fs LIBS technique.
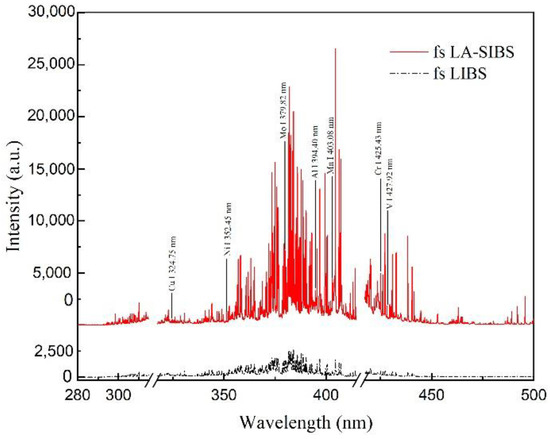
Figure 2.
Plasma emission spectra recorded in fs LA-SIBS and fs LIBS. The integral time of CCD was 2 ms, and each spectrum was averaged for 500 repeated measurements.
3.2. The Effect of Discharge Voltage on Spectral Intensity
In fs LA-SIBS experiments, the capacitance and voltage are important parameters to determine the electrical energy deposited into the laser-induced plasma. Discharge characteristics have been previously studied [30], including the voltage variation between electrodes, the discharge current in the circuit, and the electrical power deposited into the discharge gap. The discharge voltage effect on the signal intensity was investigated while analyzing the steel alloy using the fs LA-SIBS technique. Figure 3 shows the net signal intensities of V I 427.92 nm, Mo I 379.82 nm, Cr I 425.43 nm, Mn I 403.08 nm, Al I 394.40 nm, Ni I 352.45 nm, and Cu I 324.75 nm analytical lines observed under different discharge voltages. Here, the femtosecond laser single pulse energy was 0.4 mJ, and the capacitance value was 20 nF. The parameters of the fiber spectrometer, including the integration time of the CCD and the average number of repetitions for each measurement, were 2 ms and 500, respectively. The experimental results are shown in Figure 3, displaying seven atomic line intensities that increased with the increment of discharge voltage. The error bars in this figure and in Figure 4, Figure 5 and Figure 6 indicate the signal deviations within multiple repeated measurements.
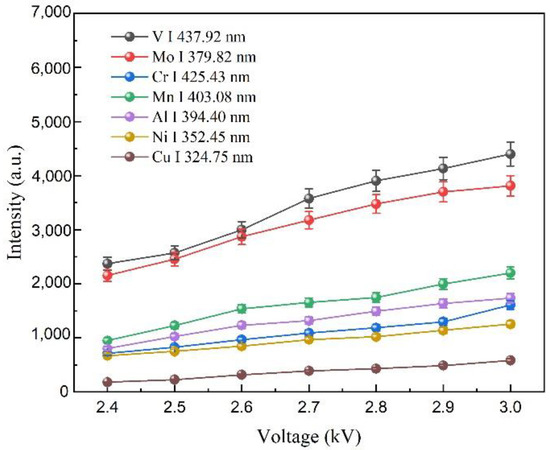
Figure 3.
Seven atomic line intensities of V I 427.92 nm, Mo I 379.82 nm, Cr I 425.43 nm, Mn I 403.08 nm, Al I 394.40 nm, Ni I 352.45 nm, and Cu I 324.75 nm observed in fs LA-SIBS while using different discharge voltages.
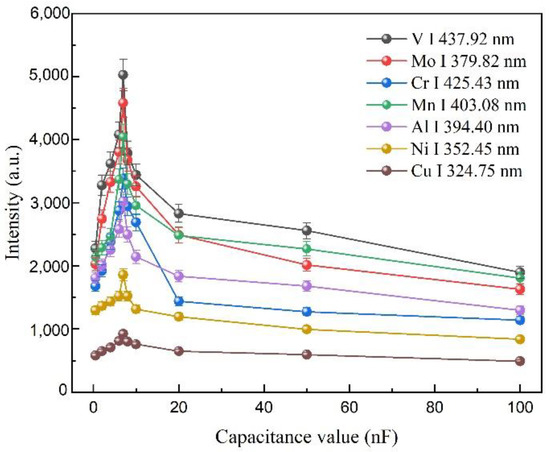
Figure 4.
Plots of V, Mo, Cr, Mn, Al, Ni, and Cu elements spectrum signal intensities observed in fs LA-SIBS under different discharge capacitances.
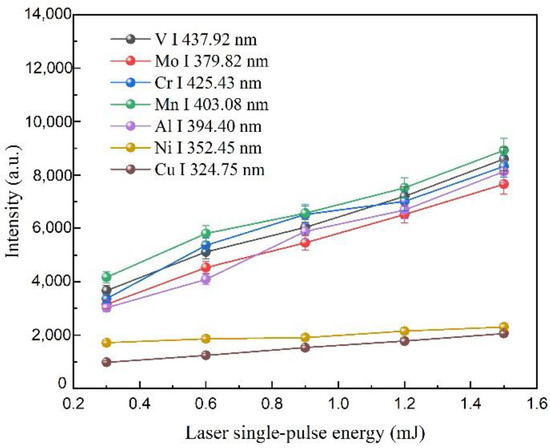
Figure 5.
Plots of V, Mo, Cr, Mn, Al, Ni, and Cu elements spectrum signal intensities observed in fs LA-SIBS under different laser single-pulse energy.
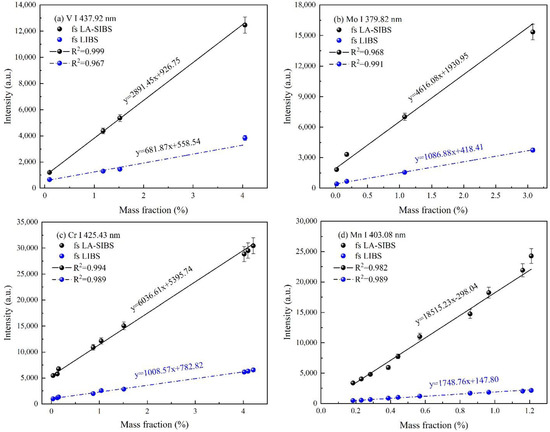
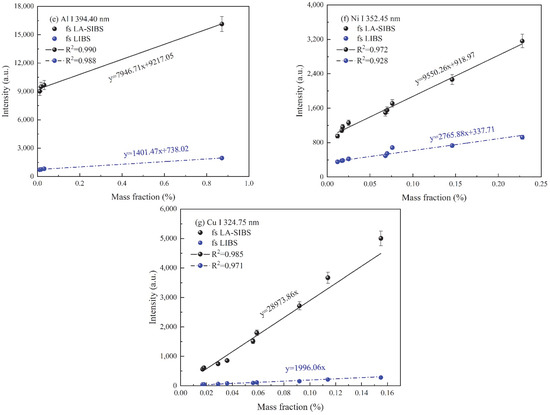
Figure 6.
Calibration curves of vanadium, molybdenum, chromium, manganese, aluminum, nickel, and copper in steel alloy standard samples obtained in fs LA-SIBS and fs LIBS. (a) V I 437.92 nm, (b) Mo I 379.82 nm, (c) Cr I 425.43 nm, (d) Mn I 403.08 nm, (e) I Al I 394.40 nm, (f) Ni I 352.45 nm, and (g) Cu I 324.75 nm.
3.3. The Effect of Discharge Capacitance on Spectral Intensity
The discharge capacitance is a very important parameter for a spark discharge unit due to the time constant of the discharge and the storage of electrical energy depending on the capacitance. Figure 4 shows the plots of signal intensities of seven atom lines, including V I 427.92 nm, Mo I 379.82 nm, Cr I 425.43 nm, Mn I 403.08 nm, Al I 394.40 nm, Ni I 352.45 nm, and Cu I 324.75 nm, versus the different values of capacitance, where the femtosecond laser single-pulse energy, the discharge voltage, the integration time of the CCD, and the average number of repetitions for each measurement were 0.4 W, 2.4 kV, 2, and 500, respectively. The net signal was observed to be maximal at 7 nF. This result could be explained by the relationship between the dynamic energy storage and the discharge time constant of the capacitance. For a small capacitance, almost all the electrical energy could be stored in the capacitance, and the electrical energy would be deposited into the laser-induced plasma, enhancing the intensities of the analytical lines. Additionally, a small capacitance shortened the discharge time constant over which the spark discharge unit occurred. Hence, a 7 nF capacitance was selected in the following experiments.
3.4. The Effect of Laser Single-Pulse Energy on Spectral Intensity
As shown in Figure 5, the effect of the femtosecond laser single-pulse energy on the signal intensities of the seven atomic lines was investigated experimentally. The discharge voltage, capacitance, the integration time of the CCD, and the average number of repetitions for each measurement were 2.4 kV, 20 nF, 2 ms, and 500, respectively. From the results of the experiments, it could be observed that the signal intensities of V I 427.92 nm, Mo I 379.82 nm, Cr I 425.43 nm, Mn I 403.08 nm, Al I 394.40 nm, Ni I 352.45 nm, and Cu I 324.75 nm increased with the increasing laser single-pulse energy. This result indicated that a larger sample mass could be ablated using a higher laser pulse energy. Here, to protect this femtosecond laser, a 1.5 mJ laser single-pulse energy was selected in the calibration curves and detection limit experiments.
3.5. Quantitative Analysis and Limits of Detection
The results of the experimental work outlined above revealed the considerations that were used to determine the experimental condition used for the quantitative analysis of the seven elements in the steel alloy samples using the fs LA-SIBS technique. In the calibration curve experiment, the laser single-pulse energy, capacitance, voltage, the integration time of the spectrometer’s CCD, and the average number of repetitions for each measurement were selected to be 1.5 mJ, 7 nF, 3.0 kV, 2 ms, and 500, respectively. The calibration curves of ten reference steel alloy samples for V I 427.92 nm, Mo I 379.82 nm, Cr I 425.43 nm, Mn I 403.08 nm, Al I 394.40 nm, Ni I 352.45 nm, and Cu I 324.75 nm with fs LA-SIBS and fs LIBS are shown in Figure 6. The limits of detection (LODs) of these elements were estimated according to the well-known 3σ criteria in the following expression [37]:
where is the standard deviation of the background and S is the slope of the calibration curve. As can be seen in Figure 6a–g, the slope of the calibration curves in the case of fs LA-SIBS and fs LIBS decreased gradually. The LOD results for the seven elements achieved with the fs LA-SIBS and fs LIBS techniques are listed in Table 2. According to the results, the LODs of the V, Mo, Cr, Mn, Al, Ni, and Cu elements obtained with the fs LA-SIBS technique were determined to be 10.9, 12.6, 4.0, 5.7, 8.7, 7.9, and 3.1 ppm, respectively, which were better than those obtained via the fs LIBS technique by a factor of 4–12 under the current experimental conditions, except for with the assistance of the spark discharge.

Table 2.
LODs of vanadium, molybdenum, chromium, manganese, aluminum, nickel, and copper in steel alloy obtained with fs LIBS and fs LA-SIBS techniques.
Although a femtosecond laser is not appropriate for building a portable LIBS system, there were three apparent advantages of this femtosecond LA-SIBS technique: first, the spectra could be rapidly recorded with a compact multichannel fiber spectrometer using a nongated signal recording mode under the high repetition rate working condition; second, once the laser-induced plasma was produced on the sample surface, spark discharge units would be operated immediately, and the optical emission could be enhanced in the experiment, and, thus, the elemental analytical sensitivity of the steel alloy analysis was improved; finally, a femtosecond laser was used as the laser ablation source, which has great potential for the microanalysis of elements in different alloy samples.
4. Conclusions
In summary, an fs LA-SIBS system operated with a repetition rate of 1 kHz was developed for the quantitative analyses of the V, Mo, Cr, Mn, Al, Ni, and Cu elements in steel alloy samples. The intensity enhancement effect was attributed to the spark discharge unit, which increased the temperature and electron density of the laser-induced plasma. Finally, with and without spark discharge assistance, the calibration curves of V I 427.92 nm, Mo I 379.82 nm, Cr I 425.43 nm, Mn I 403.08 nm, Al I 394.40 nm, Ni I 352.45 nm, and Cu I 324.75 nm elements were established. The LODs of these elements were also estimated using the 3σ criterion. The LODs of the V, Mo, Cr, Mn, Al, Ni, and Cu elements in the steel alloy samples obtained with fs LA-SIBS were determined to be 10.9, 12.6, 4.0, 5.7, 8.7, 7.9, and 3.1 ppm, respectively. However, the LODs of these elements were 40.0, 51.9, 20.8, 36.0, 42.7, 62.8, and 36.1 ppm in fs LIBS. The analytical sensitivity of fs LA-SIBS was significantly better than that obtained in fs LIBS. The development of the fs LA-SIBS technique should help to realize the fast elemental analysis of solid samples with good analytical sensitivity in the future. Additionally, this technique has great potential in the field of high spatial resolution microarea element analysis, due to the low thermal effect of the femtosecond laser.
Author Contributions
This article was written by a total of five authors, each of whom undertook the following major contributions: conceptualization, H.W.; methodology, D.L. and D.W.; software, Q.Y.; validation, X.H. and Q.Y.; formal analysis, X.H.; resources, D.L. and H.W.; data curation, X.H.; writing—original draft preparation, X.H.; writing—review and editing, X.H. and D.L. All authors have read and agreed to the published version of the manuscript.
Funding
This research was funded by the Dongguan Social Development Science and Technology Funds (20211800904632), the Guangdong Basic and Applied Basic Research Foundation (2019A1515110978 and 2021B1515140018), and the Youth Talents Foundation for Guangdong University (2021KQNCX097).
Institutional Review Board Statement
Not applicable.
Informed Consent Statement
Not applicable.
Data Availability Statement
Not applicable.
Acknowledgments
The authors thank the Dongguan Social Development Science and Technology Funds.
Conflicts of Interest
The authors declare no conflict of interest.
References
- Russo, R.E.; Mao, X.L.; Yoo, J.; Gonzalez, J.J. Laser Ablation. In Laser-Induced Breakdown Spectroscopy, 1st ed.; Singh, J.P., Ed.; Elsevier: Amsterdam, The Netherlands, 2007; pp. 49–82. [Google Scholar]
- Miziolek, A.W.; Palleschi, V.; Schechter, I. Laser Induced Breakdown Spectroscopy; Cambridge University Press: Cambridge, UK, 2006. [Google Scholar]
- Cremers, D.A.; Radziemski, L.J. Handbook of Laser-Induced Breakdown Spectroscopy; Wiley: Hoboken, NJ, USA, 2013. [Google Scholar]
- Singh, J.P.; Thakur, S.N. Laser-Induced Breakdown Spectroscopy; Elsevier: Amsterdam, The Netherlands, 2007. [Google Scholar]
- Killinger, D.K.; Allen, S.D.; Waterbury, R.D.; Stefano, C.E.; Dottery, L. Enhancement of Nd: YAG LIBS emission of a remote target using a simultaneous CO2 laser pulse. Opt. Express. 2007, 15, 12905–12915. [Google Scholar] [CrossRef] [PubMed]
- Lednev, V.N.; Sdvizhenskii, P.A.; Stavertiy, A.Y.; Grishin, M.Y.; Tretyakov, R.S.; Asyutin, R.D.; Pershin, S.M. Online and in situ laser-induced breakdown spectroscopy for laser welding monitoring. Spectrochim. Acta Part B At. Spectrosc. 2021, 175, 106032. [Google Scholar] [CrossRef]
- Lorenzetti, G.; Legnaioli, S.; Grifoni, E.; Pagnotta, S.; Palleschi, V. Laser-based continuous monitoring and resolution of steel grades in sequence casting machines. Spectrochim. Acta Part B At. Spectrosc. 2015, 112, 1–5. [Google Scholar] [CrossRef]
- Wang, Z.; Yuan, T.; Hou, Z.; Zhou, W.; Lu, J.; Ding, H.; Zeng, X. Laser-induced breakdown spectroscopy in China. Front. Phys. 2014, 9, 419–438. [Google Scholar] [CrossRef]
- Kautz, E.J.; Devaraj, A.; Senor, D.J.; Harilal, S.S. Hydrogen isotopic analysis of nuclear reactor materials using ultrafast laser-induced breakdown spectroscopy. Opt. Express 2021, 29, 4936–4946. [Google Scholar] [CrossRef] [PubMed]
- Sirven, J.B.; Dewalle, P.; Quere, C.; Fauvet, V.; Tabarant, M.; Motellier, S.; Golanski, L.; Guiot, A.; Amdaoud, M.; Clavaguera, S.; et al. Assessment of exposure to airborne carbon nanotubes by laser-induced breakdown spectroscopy analysis of filter samples. J. Anal. At. Spectrom. 2017, 32, 1868–1877. [Google Scholar] [CrossRef]
- Li, Y.; Gu, Y.; Zhang, Y.; Li, Y.D.; Lu, Y. Analytical study of seashell using laser-induced breakdown spectroscopy. Plasma Sci. Technol. 2017, 19, 25501. [Google Scholar]
- Melessanaki, K.; Mateo, M.; Ferrence, S.C.; Betancourt, P.P.; Anglos, D. The application of LIBS for the analysis of archaeological ceramic and metal artifacts. Appl. Surf. Sci. 2002, 197, 156–163. [Google Scholar] [CrossRef]
- Giakoumaki, A.; Melessanaki, K.; Anglos, D. Laser-induced breakdown spectroscopy (LIBS) in archaeological science-applications and prospects. Anal. Bioanal. Chem. 2007, 387, 749–760. [Google Scholar] [CrossRef]
- Moncayo, S.; Rosales, J.D.; Izquierdo-Hornillos, R.; Anzano, J.; Caceres, J.O. Classification of red wine based on its protected designation of origin (PDO) using Laser-induced Breakdown Spectroscopy (LIBS). Talanta 2016, 158, 185–191. [Google Scholar] [CrossRef]
- Yu, Y.; Guo, L.; Hao, Z.; Li, X.; Shen, M.; Zeng, Q.; Li, K.; Zeng, X.; Lu, Y.; Ren, Z. Accuracy improvement on polymer identification using laser-induced breakdown spectroscopy with adjusting spectral weightings. Opt. Express 2014, 22, 3895–3901. [Google Scholar] [CrossRef] [PubMed]
- Tzortzakis, S.; Anglos, D.; Gray, D. Ultraviolet laser filaments for remote laser-induced breakdown spectroscopy (LIBS) analysis: Applications in cultural heritage monitoring. Opt. Lett. 2006, 31, 1139–1141. [Google Scholar] [CrossRef] [PubMed]
- Lasheras, R.J.; Bello-Galvez, C.; Anzano, J.M. Quantitative analysis of oxide materials by laser-induced breakdown spectroscopy with argon as an internal standard. Spectrochim. Acta Part B At. Spectrosc. 2013, 82, 65–70. [Google Scholar] [CrossRef]
- Aguilera, J.A.; Aragon, C.; Madurga, V.; Manrique, J. Study of matrix effects in laser induced breakdown spectroscopy on metallic samples using plasma characterization by emission spectroscopy. Spectrochim. Acta Part B At. Spectrosc. 2009, 64, 993–998. [Google Scholar] [CrossRef]
- Anabitarte, F.; Cobo, A.; Lopez-Higuera, J.M. Laser-Induced Breakdown Spectroscopy: Fundamentals, Applications, and Challenges. ISRN Spectrosc. 2012, 2012, 1–12. [Google Scholar] [CrossRef]
- Legnaioli, S.; Campanella, B.; Poggialini, F.; Pagnotta, S.; Harith, M.A.; Abdel-Salam, Z.A.; Palleschi, V. Industrial applications of laser-induced breakdown spectroscopy: A review. Anal. Methods. 2020, 12, 1014–1029. [Google Scholar] [CrossRef]
- Luo, D.; Liu, Y.; Li, X.; Zhao, Z.; Wang, S.; Zhang, Y. Quantitative analysis of C, Si, Mn, Ni, Cr and Cu in low-alloy steel under ambient conditions via laser-induced breakdown spectroscopy. Plasma Sci. Technol. 2018, 20, 75504. [Google Scholar] [CrossRef]
- Aragon, C.; Aguilera, J.A.; Penalba, F. Improvements in quantitative analysis of steel composition by laser-induced breakdown spectroscopy at atmospheric pressure using an infrared Nd: YAG laser. Appl. Spectrosc. 1999, 53, 1259–1267. [Google Scholar] [CrossRef]
- Stipe, C.B.; Hensley, B.D.; Boersema, J.L.; Buckley, S.G. Laser-induced breakdown spectroscopy of steel: A comparison of univariate and multivariate calibration methods. Appl. Spectrosc. 2010, 64, 154–160. [Google Scholar] [CrossRef]
- Sturm, V.; Vrenegor, J.; Noll, R.; Hemmerlin, M. Bulk analysis of steel samples with surface scale layers by enhanced laser ablation and LIBS analysis of C, P, S, Al, Cr, Cu, Mn and Mo. J. Anal. At. Spectrom. 2004, 19, 451–456. [Google Scholar] [CrossRef]
- Hao, Z.; Guo, L.; Li, C.; Shen, M.; Zou, X.; Li, X.; Lu, Y.; Zeng, X. Sensitivity improvement in the detection of V and Mn elements in steel using laser-induced breakdown spectroscopy with ring-magnet confinement. J. Anal. At. Spectrom. 2014, 29, 2309–2314. [Google Scholar] [CrossRef]
- Gurevich, E.L.; Hergenroder, R. Femtosecond laser-induced breakdown spectroscopy: Physics; applications; and perspectives. Appl. Spectrosc. 2007, 61, 233A–242A. [Google Scholar] [CrossRef] [PubMed]
- Labutin, T.A.; Lednev, V.N.; Ilyin, A.A.; Popov, A.M. Femtosecond laser-induced breakdown spectroscopy. J. Anal. At. Spectrom. 2016, 31, 90–118. [Google Scholar] [CrossRef]
- Lu, Y.; Zorba, V.; Mao, X.; Zheng, R.; Russo, R.E. UV fs-ns double-pulse laser induced breakdown spectroscopy for high spatial resolution chemical analysis. J. Anal. At. Spectrom. 2013, 28, 743–748. [Google Scholar] [CrossRef]
- Banerjee, S.P.; Chen, Z.; Fedosejevs, R. High resolution scanning microanalysis on material surfaces using UV femtosecond laser induced breakdown spectroscopy. Opt. Lasers Eng. 2015, 68, 1–6. [Google Scholar] [CrossRef]
- Hou, H.; Cheng, L.; Richardson, T.; Chen, G.; Doeff, M.; Zheng, R.; Russo, R.E.; Zorba, V. Three-dimensional elemental imaging of Li-ion solid-state electrolytes using fs-laser induced breakdown spectroscopy (LIBS). J. Anal. At. Spectrom. 2015, 30, 2295–2302. [Google Scholar] [CrossRef]
- Ahamer, C.M.; Riepl, K.M.; Huber, N.; Pedarnig, J.D. Femtosecond laser-induced breakdown spectroscopy: Elemental imaging of thin films with high spatial resolution. Spectrochim. Acta Part B At. Spectrosc. 2017, 136, 56–65. [Google Scholar] [CrossRef]
- Eland, K.L.; Stratis, D.N.; Gold, D.M.; Goode, S.R.; Angel, S.M. Energy dependence of emission intensity and temperature in a LIBS plasma using femtosecond excitation. Appl. Spectrosc. 2001, 55, 286–291. [Google Scholar] [CrossRef]
- Nassef, O.A.; Elsayed-Ali, H.E. Spark discharge assisted laser induced breakdown spectroscopy. Spectrochim. Acta Part B At. Spectrosc. 2005, 60, 1564–1572. [Google Scholar] [CrossRef]
- Zhou, W.; Li, K.; Qian, H.; Ren, Z.; Yu, Y. Effect of voltage and capacitance in nanosecond pulse discharge enhanced laser-induced breakdown spectroscopy. Appl. Opt. 2012, 51, B42–B48. [Google Scholar] [CrossRef]
- Zhou, W.; Li, K.; Shen, Q.; Chen, Q.; Long, J. Optical emission enhancement using laser ablation combined with fast pulse discharge. Opt. Express. 2012, 18, 2573–2578. [Google Scholar] [CrossRef] [PubMed]
- He, X.; Dong, B.; Chen, Y.; Li, R.; Wang, F.; Li, J.; Cai, Z. Analysis of magnesium and copper in aluminum alloys with high repetition rate laser-ablation spark-induced breakdown spectroscopy. Spectrochim. Acta Part B At. Spectrosc. 2018, 141, 34–43. [Google Scholar] [CrossRef]
- Voigtman, E. Limits of detection and decision. Spectrochim. Acta Part B At. Spectrosc. 2008, 63, 154–165. [Google Scholar] [CrossRef]
Publisher’s Note: MDPI stays neutral with regard to jurisdictional claims in published maps and institutional affiliations. |
© 2022 by the authors. Licensee MDPI, Basel, Switzerland. This article is an open access article distributed under the terms and conditions of the Creative Commons Attribution (CC BY) license (https://creativecommons.org/licenses/by/4.0/).