Abstract
The increasing demand for rare earth elements (REE) requires faster analysis techniques for their rapid exploration. Laser-induced breakdown spectroscopy (LIBS) has on-site and real time analysis capability. However, interference and the weaker emission of minor REEs are key challenges for the complex REE emission spectra. Using simulations and experimental results, we presented essential principles for improved line identification in the transient spectra of complicated samples, such as those of REE ores (e.g., monazite). Knowledge of plasma conditions, spectral collection setup, and capability of the spectral system are key parameters to consider for the identification of an emission line in such spectra. Furthermore, emission intensity dependence on laser wavelength was analyzed for major and minor REEs using IR (1064 nm), visible (532 nm) and UV (266 nm) irradiation. A higher plasma temperature was found with the IR laser, while stronger material ablation was observed by UV irradiation. Higher particle density by UV laser ablation was the key factor in the higher signal intensity of the minor elements, and this laser can improve the emission signals for LIBS use as an REE analyzer.
1. Introduction
Rare-earth elements (REE) [1] are becoming critical in today’s world due to their ever-increasing utilization in modern electronics, smart devices, renewable energy, advanced technologies [2] and indirect grounding role in the internet of everything [3] revolution taking place. The high demand and expanding market [4] of REEs fuels the thrust of rapid REE mineral extraction. China has dominated the REE market for the past three decades as the leading REE producer in the world, and resource exploration continues [5,6] Major analytical techniques which are currently deployed for REE content determination in mineral resources include inductively coupled plasma (ICP) mass spectroscopy (-MS) and optical emission spectroscopy (-OES); instrumental neutron activation analysis (INAA); X-ray fluorescence (XRF); [2] and laser-induced fluorescence (LIF) [7]. Most of these techniques generally require a well-established laboratory setup with analysis time ranging from several minutes to hours, which also includes sample preparation time. An alternate analytical technique that can provide much faster REE content estimation—preferably on-site or in situ analysis—in real time will be highly advantageous in the accelerated REE exploration.
Laser-induced breakdown spectroscopy (LIBS) is a maturing quantitative optical spectroscopy technique which has the capability of on-site, in situ, and remote elemental analysis in real time, since the only essential requirement is the optical access to the sample [8,9]. The unique advantage of LIBS has resulted in the diverse deployment of this technique in areas from oceanic exploration to extraterritorial adventures [10,11,12,13]. After laser excitation to the sample, the radiation emission is collected at a suitable delayed time ranging from a few nanoseconds to several microseconds. Another advantageous aspect of LIBS for REE analysis is minimal to no sample preparation, and the ability of single pulse on-site mineral measurement which reduces the acquisition time to below a 1 s time scale. In addition, to improve statistical significance, several pulse spectra can be averaged together, and the analysis time remains in seconds. The LIBS performance is maturing in the quantitative domain with new progress in the fundamental insights of the laser ablation process [14,15,16], while the current technology is adequate for fast REE resource exploration to an acceptable level [17,18]. X-ray fluorescence provides similar capabilities of on-site and in situ analysis [19]. However, LIBS is more suitable for lighter element detection, as the present case of complex mineral ores. Moreover, XRF utilizes harmful invisible radiation, which poses a continuous safety hazard.
Another important technique for REE identification, similar to LIBS, is laser-induced fluorescence, which relies on florescence emission instead of atomic emission spectra. The fluorescence life time is much longer than that of characteristic spectra, and LIF is widely used for various REE element detection [7,20]. Reisfeld et al. used LIF for the detection of several REEs in natural flour-apatites. Gaft et al. determined that time-resolved LIF can discriminate the fluorescence signatures of various REEs with highly overlapping spectral ranges [20]. Recently, they proposed the combined use of both the molecular emission and the fluorescence spectra from a laser-induced plasma for various REE detection, which has the capability of spectral identification with relatively low-resolution spectrometers [21]. Nevertheless, several researchers have applied LIBS for mineral exploration [22]. Alvarez et al. classified copper-based minerals in sulfide rocks with 100% achieved accuracy using some multivariate models [23]. Romppanen et al. prepared mineral maps of yttrium ore using LIBS using the single-value decomposition approach [24]. Similarly, LIBS has been applied for REE detection in several minerals. Muller et al. applied a custom LIBS-based drill ore scanner for REE detection in different drill ores [25], which shows the LIBS potential as a fast primary tool for mineral exploration.
Monazite is a major resource for several rare-earth elements with a general chemical composition of (Cerium, Lanthanum, Neodymium)phosphate or (Ce, La, Nd)PO4 [26]. Abedin et al. successfully applied LIBS to identify 11 REEs and 14 other elements in raw monazite sand [27]. The REEs include cerium (Ce); lanthanum (La); neodymium (Nd); praseodymium (Pr); yttrium (Y); ytterbium (Yb); gadolinium (Gd); dysprosium (Dy); erbium (Er); samarium (Sm); and europium (Eu). Other elements include magnesium (Mg); chromium (Cr); aluminum (Al); zirconium (Zr); manganese (Mn); niobium (Nb); tantalum (Ta); copper (Cu); zinc (Zn); silicon (Si); phosphorus (P); titanium (Ti); and iron (Fe). Their identification of multiple REE lines has caveats, as discussed in the next sections. In addition to the conventional mineral resources, REE in different non-traditional sources including coal and uranium ores have been determined using LIBS. Phuoc et al. identified the emission lines of several REEs and other elements in a sub-bituminous coal and coal ash [28]. They also highlighted the fundamental issue of REE lines interference. Manard et al. observed several REE lines in several standard or spiked samples of uranium ore employing a handheld (HH) LIBS device [29]. In their case, spiking a rare-earth element was helpful in identifying the variable signature of that REE. However, the spectral interference was inevitably present in their identified lines due to the limited available resolution provided by a handheld spectrometer (0.1–0.3 nm). Similarly, laboratory REE samples in a graphite matrix were prepared by Martin et al. for their quantification campaign [30]. Bhatt et al. determined strong and weak lines of REEs in miscellaneous REE samples, and multivariate methods were used for quantification [31]. Recently, Bhatt et al. applied DP-LIBS for the intensity enhancement of several REE lines [32]. One of the primary issues for REE ores analysis by LIBS is their complex spectra, higher spectral overlapping/interference, comparatively lower line intensities, and conflicting lines identification. A summary of the used samples, studied REEs, and the employed laser wavelengths in various LIBS studies on REEs is given in Table 1. The majority of these studies used the fundamental or second laser wavelength (1064 or 532 nm) for REE analysis, as seen in Table 1. Thus, a systematic comparison of different laser wavelengths for the better identification and quantification of REE ore material is needed to improve the LIBS performance as an REE analyzer.

Table 1.
Laser wavelengths used for REE analysis in other LIBS studies.
In this paper, we explore the effect of different laser wavelengths on the analytical emission signal of major and minor REEs in a monazite ore. Prior to this, the fundamentally important discussion on the line identification and selection is presented by comparing the simulated and experimental spectra from a high- and a low-resolution spectral system.
2. Experimental Section
Figure 1 shows the simplified schematic of the experimental setup developed for this experiment. The laser used was a Q-switched Nd:YAG laser (Beamteach Inc., Beijing, China) with a pulse duration of 8 ns, which can be configured for multiple harmonics of 1064 nm. The beam quality factor or M2 factor of this laser was ~26 for a 1064 nm wavelength. This shows that the laser beam had a single mode profile and relative Gaussian energy distribution [38,39]. The laser wavelength was changed from fundamental harmonic (IR, 1064 nm) to second (visible, 532 nm), and later to fourth harmonic (UV, 266 nm) by changing the laser configuration. For laser transmission, the set of laser line mirrors in the optical path were replaced for each wavelength and are collectively represented as a laser line mirror (B) in Figure 1. An adjustable plano-convex lens (A) of the focal length 100 mm was used to focus the laser radiation on the sample surface. Two spectral collection systems, including a commercial grade Czerny–Turner (CT) spectrometer (Avantes Inc., Apeldoorn, The Netherlands) and a high-resolution echelle spectrograph, (LTB Inc., Berlin, Germany) were employed for the spectral collection. The prior spectrometer system consisted of 7 spectrometers with an aggregate spectral range of 190–930 nm and a spectral resolution of 0.08–0.13 nm, depending upon the grating arrangement, while the echelle spectrograph had a resolving power λ/Δλ of 14,000 and a spectral resolution of 13–24 pm in the spectral region of 190–433 nm. Two pairs of UV-fused silica plano-convex lenses (f = 75 mm) were used to collect the plasma emission to the spectrometers. These spectral collection lenses were focused toward the laser-ablation region using a 635 nm diode laser (LDM635, Thorlabs, Newton, NJ, USA), and were placed at approximately 60° to the sample surface. A careful optical adjustment was made to ensure that both collection setups scanned the same part of the plasma. This was further confirmed by exchanging the optical fibers for both spectral collection systems, and no change in the collected spectra was observed. A UV-grade optical fiber with 1-to-7 configuration (core diameter 400 µm) was mounted at the focal point of the first collection lens pair to fetch the plasma emission to the CT spectrometer, while a 1-to-1 UV-grade optical fiber was utilized for spectral collection to the echelle spectrograph.
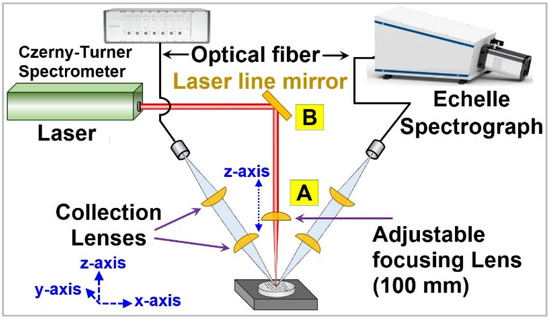
Figure 1.
A simplified schematic of the LIBS system used in the experiment. For each laser wavelength, the set of laser mirrors (B) were changed, and laser focusing lens (A) was adjusted.
A real monazite ore in powdered form was used as the analytical sample in this experiment. Standard analysis procedure GB/T 18114.2-2010 was adopted for the REE concentration measurement [40]. In particular, ICP-OES was used to determine the REE content, as given in Table 2. For ICP, the powdered sample was dissolved in a calibrated mixture of HNO3 and HF acids before microwave digestion. Afterwards, the samples were diluted with de-ionized water and analyzed using an ICP-OES system. For the LIBS analysis, the sample was pelletized in a cylindrical aluminum container by pressing with a 26 Newton force for 1 min in a hydraulic press. A total of 4 identical pellets were used for the experiment, with each pellet containing approx. 6–7 g of REE sample. The first pellet was used for setup optimization and laser energy selection for the REE analysis, while the remaining three were used for an analysis by each of the laser wavelengths. The spectra were collected at variable delays and a fixed integration time. Generally, the life time of a laser-induced plasma is a few hundred nanoseconds; however, the minimum integration time of the charged-coupled device (CCD) of the CT spectrometer was 1.05 millisecond (ms), which was selected for analysis, while 1 microsecond (µs) was selected for the echelle spectrograph. The preliminary experiments with the 1064 nm laser showed an intense emission for the CT spectrometer with 10 mJ laser energy, and detector saturation was observed for energies higher than 10 mJ (with a step of 10 mJ). Thus, 10 mJ energy (50 J/m2 fluence) was selected as an optimal laser energy for this experiment. Another key point was the adjustment of the laser focal point for different laser wavelengths. The refractive index of a plano-convex lens changes with the laser wavelength, which will change the focusing point location. Thus, the focal point was reduced with lowering the laser wavelength. Therefore, the lens (A) was adjusted to obtain the same spot size of ~200 µm for all the laser wavelengths. A spectrum was collected by 10 ablations on the same spot, and then 5 spectra were averaged to improve the measurement.

Table 2.
Concentration of different REEs in the analyzed monazite sample.
3. Spectral Lines Identification
The emission spectra of lanthanide REEs is very complex due to a plethora of emission lines from the high density of energy levels [41]. The complexity and chore of line identification can easily lead to misidentification in the case of complex REE spectra such as monazite ore. Mis-identification is easily possible for low concentration REEs, while in the case of high concentration REEs, interference is the biggest concern for line selection as an analytical marker. Detailed work has been carried out on the spectral interferences, especially for ICP-OES; [42] however, this issue is not very often tackled in the LIBS literature. Nevertheless, accurate line selection is one of the most challenging steps in the case of complex REE ore spectra and should be handled with solicitude. Laser-induced plasmas (LIP) are a highly transient and matrix-dependent source of irradiation, since the laser directly ablates the sample matrix. This situation is very different to the stable ICP plasms and prepared ICP samples in a known solvent. The spectral complexity of monazite ore exacerbates this situation and limits the ability to accurately detect a suitable analytical line without spectral interferences.
The line selection in LIBS is a subjective problem and the appearance of an emission line highly depends upon specific plasma conditions, thus, on used delay and gate duration. Plasma temperature is a key parameter defining relative line intensities. We obtained the simulated REE spectra of our sample composition using the NIST database [43]. The relative concentration of the elements used for this simulated spectrum is given in Supplementary Table S1. These ideal spectra are based on Saha–Boltzmann statistics [44] without considering any experimental factors or self-absorption for the known REE concentration of our sample. Spectral resolution similar to the echelle spectral system was considered. Figure 2 shows a narrow spectral region delineating the normalized emission intensity of two moderate Ce (II) 370.929 nm and 370.993 nm lines, and a strong Y (II) 371.029 nm line at two temperatures commonly encountered in LIBS. In the sample used, Ce was the most abundant REE with 23.4% content, while Y can be considered as a trace element with 0.4% concentration. With the increase in plasma temperature from 5000 K to 10,000 K, the relative intensities of the emission lines altogether changed. The Ce (II) 370.993 nm line was more than three times stronger than Y (II) 371.029 nm at 5000 K. Conversely, the Y (II) 371.029 nm line had a 1.5 times higher relative intensity at 10,000 K in spite of the minute concentration. With the increase in electron number density, the overall intensity was varied, while the relative position was not changed, as shown in Supplementary Figure S3. This shows that the appearance of a relative line intensity is highly dependent on the plasma temperature, rather than electron density. It is worth mentioning that the simulation results are not directly comparable with the experimental data, since self-absorption, detector spectral response, and the line-of-sight of spectral measurements are additional key factors in an experimental measurement. On the contrary, the simulated results highly depend upon the accuracy of the spectral parameters available in the NIST database.
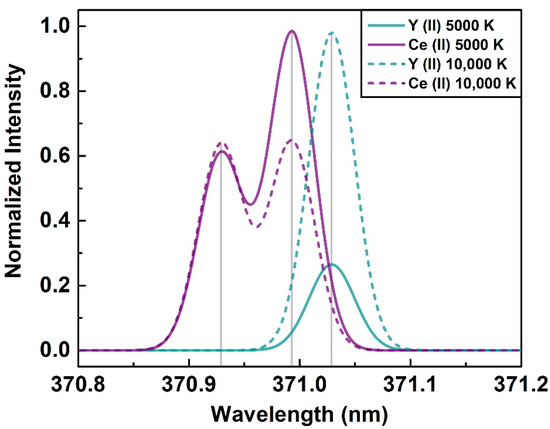
Figure 2.
Simulated emission spectra of Ce (II) 370.929 nm, 370.993 nm and Y (II) 371.029 nm at different plasma temperatures.
The experimental arrangement of the spectral collection system is equally important in the appearance of the emission lines in LIPs. In a previous work, it was demonstrated that the intense region of the spectra was shifted from UV to IR with the increased delay time, as LIP loses energy and decays with time [45]. In a similar manner, the intensity of the lines from ambient can be increased if the collecting lens focuses on the more turbulent plasma periphery [12], and this may appear to be the better spectra of the sample in some cases, or a desired plasma region can be focused based on the experimental requirements. Therefore, improved spectral arrangement and awareness of the spectral collection system is another key feature in spectral line identification.
The spectral resolving power of a spectrometer is the third essential aspect to consider in spectral line selection. In particular, for minute or trace element lines in the complex emission spectra, accurate identification is a more challenging task. In the literature, many different identified lines are attributed to REEs. We compared both high-(echelle) and low-resolution (CT spectrometer) spectra to exemplify how a relative low-resolution spectrometer may be insufficient to accurately identify several REE emission lines. Figure 3a shows a narrow spectral region in the 399–400 nm range, which contains spectral lines of three major REEs present in the used sample at the gate delay of 3 µs. The lines of La (II) 399.575 nm, Nd (II) 399.468 nm and Ce (II) 399.382 nm were clearly distinguished in the echelle spectrum, as opposed to a bulky line with a peak near La (II) 399.575 nm in the CT spectrum, which can easily be mis-identified. For qualitative comparison, we have presented the simulated spectra of these lines in Figure 4 with two different spectral resolutions. The spectra with λ/Δλ of 14,000 is shown in the Figure 4a, which is the resolution of the echelle spectrograph, while Figure 4b simulates the resolution of the CT spectrometer with λ/Δλ of 3000. For higher resolution spectra, the orange spectral line showing the cumulative spectra was offset, since it perfectly coincided with the individual ionic lines of Ce, Nd, and La. On the contrary, the cumulative spectra for λ/Δλ of 3000 was clearly higher than the individual emission lines due to the mixing of several emission lines. The Ce (II) 399.382 nm line was not resolved and was mixed with another line, which is out of the presentation window, and the Nd (II) 399.468 nm line was masked by the La (II) 399.575 nm line.
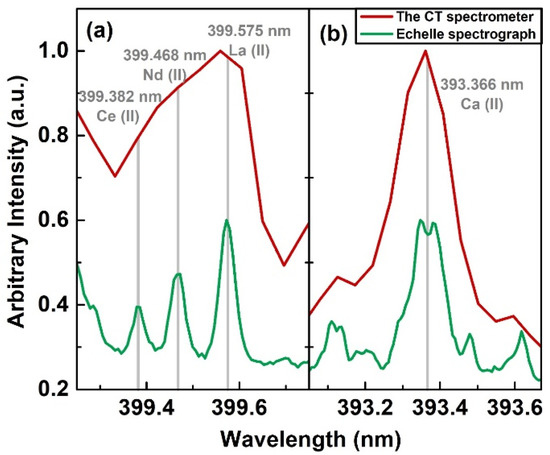
Figure 3.
(a) Comparison of spectral resolution of the CT spectrometer and echelle spectrograph for lines of three major REEs; (b) apparent absence and clear observation of self-reversal for strong Ca (II) 393.366 nm line by the CT spectrometer and echelle spectrograph, respectively.
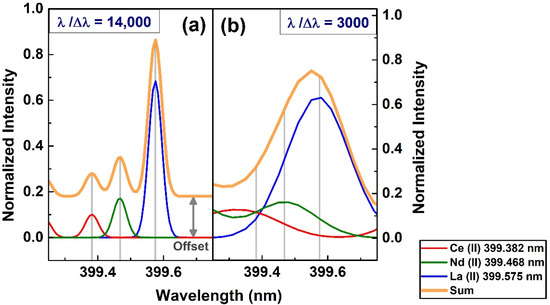
Figure 4.
The simulated spectra of Ce (II), Nd (II) and La (II) in our sample with two different spectral resolutions in the spectral range of 399–400 nm. For echelle spectrograph in (a) and for the CT spectrometer in (b). The spectral parameters were: T = 5500 K and ne = 1 × 1017 cm−3.
Likewise, a very strong and distinct Ca (II) 393.366 nm line is shown in Figure 3b. A clear self-reversal was overlooked by the CT spectrometer, and the use of this spectrum for parametric analysis such as electron number density can make the analysis significantly erroneous. It is important to emphasize that both spectra were taken from the same plasma region by careful adjustment of the spectral collection setup. This comparison elucidated that a relative low-resolution spectrometer may not be appropriate for the identification of relatively weaker emission lines. In addition, the long-term spectrometer drift should be carefully taken into account using standard light sources or obvious emission lines; overlooking spectral drift is another source of mis-classification of the emission lines in a complex spectrum.
In this section, we have stated some essential aspects to consider during spectral line identification for a complex LIBS spectrum, namely: (1) knowledge of the plasma conditions in the highly temporally and spatially transient LIP by means of plasma parameters; (2) awareness of the optical arrangement for spectral collection; (3) the capability of the spectrometer in the line discrimination. This is schematically shown in Figure 5. A complex interplay between these factors plays the pivotal role in correct line identification. The perplexing determination of the REE emission lines in the contemporary literature can also be explained by the aforementioned points. Moreover, the presence or absence of different lines and their relative intensities presented in the literature cannot be analogized for the same reason.
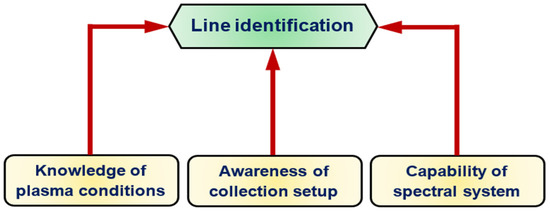
Figure 5.
Key factors to be considered for the line identification in a complex spectrum.
4. Results and Discussions
A specimen spectrum and the identified emission lines of REEs using the echelle spectrograph are given in Figure 6. The spectral region of 375–433 nm shown in Figure 6g is taken at a 3 µs delay by the 266 nm laser. Apparently, an intense background and an obvious intensity difference between different echelle orders is visible. A longer delay was not helpful in reducing the background of the monazite sample. The spectral complexity of REE ores such as the used monazite sample is higher than that of other mineral ores [23] due to the atomic and electronic properties of the abundant f-shell elements. Analogously, complex spectra were obtained by Martin et al. for a synthetic sample of REE oxides [30]. A list of selected REE emission lines in the present sample is given in Table 3. These lines were carefully selected based on the principles explained in Section 3 considering plasma conditions, the capabilities of the spectral system, and our knowledge of the experimental setup. For example, our plasma temperature range lay between 5000 K and 7000 K (see Figure 8 below). Therefore, a simulated spectrum at 6000 K was constantly consulted during the selection of the emission lines. Similarly, it was observed that the time-integrated CT spectrometer was not adequate in distinguishing multiple emission lines, except some strong lines of the major elements, and line selection was clearly erroneous, so it was avoided from the point-on for atomic spectra. Furthermore, long-term drift was also observed in the CT spectrometer used. A spectrum from 250 to 433 nm from the echelle spectrograph for all three laser wavelengths is given in Supplementary Figure S1. A complete spectrum from the CT spectrometer in the spectral range of 190–930 nm is also given in Supplementary Figure S2 for comparison.
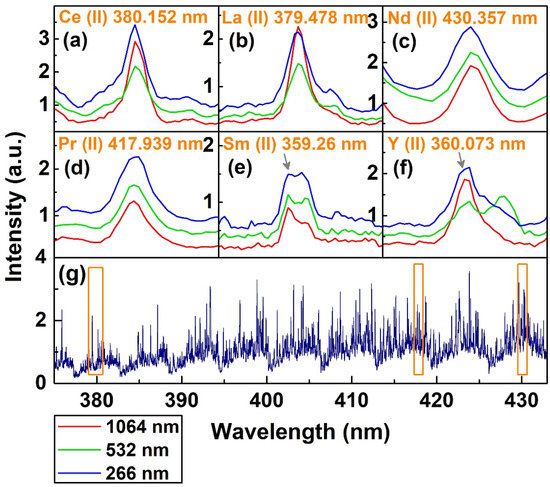
Figure 6.
(a–f) Variation in intensity of different emission lines with changing laser wavelength, and (g) a representative spectrum of monazite with 266 nm laser ablation. The orange squares highlighted 4 of the 6 lines presented in Figure 6 (a–f).

Table 3.
The emission lines of different REEs in monazite.
Figure 6a–d shows the emission lines of six REEs at different laser wavelengths; four of these lines resided on the orange boxed region of the spectra presented in Figure 6g. All the presented and most of the observed emission lines were ionic in nature. The abundance of ionic lines, intense emission and the complex spectra emanated from the easy ionization of REEs [46,47] and high overlapping of the involved transition levels [48]. Strong emission lines of the major REEs such as Ce (II) 380.152 nm and La (II) 379.478 nm showed no significant change for 1064 and 266 nm, while the intensity was clearly lower for the 532 nm laser. The Nd (II) 430.357 nm, and minor Pr (II) 417.939 nm and Sm (II) 359.26 nm showed increased intensity with a decreasing wavelength. For trace Y (II) 360.073 nm, the intensity was lowest with 532 nm excitation. Overall, the luminosity was increased with lowering the laser wavelength. Moreover, for a 60 pm window around an emission line, several lines of elements in the sample were generally present, which made interference-free line identification next to impossible with ~0.1 nm spectral resolution of the CT spectrometer. Hence, despite the detection of some strong emission lines by the CT spectrometer, only the results of the higher-resolution echelle spectrum were presented, in order to minimize interference problems and to focus on studying the laser wavelength effect on individual species. Phouc et al. addressed this problem by considering only those REEs which have at least three identified emission lines [28]. In our opinion, this may not be self-sufficient without considering the plasma conditions. Furthermore, the relatively lower resolution (~0.1 nm) of the used spectrometer may not be suitable for minor or trace amounts of REEs due to the excessive interference [48]. In fact, Carre et al. communicated that the interference cannot be ruled out for any spectral line, and this is especially true for the complex emission spectra such as REE spectra [49].
The temporal trend of these emission lines was analyzed to further investigate the emission intensity variation with delay. Figure 7 shows the temporal decay of the six emission lines from a 0.4 µs to 4 µs delay with a 1 µs gate width. Generally, the emission intensity was higher with lowering the plasma wavelength, and it was particularly visible for minor elements. This trend was not very clear for some major elements at a shorter delay. However, overall emissivity was increased with decreasing the laser wavelength since more material was ablated from the sample. These emission intensity trends were explained by plasma temperature and electron number density, as evinced in Figure 8. Figure 8a shows the temporal decay of plasma temperature determined by the Boltzmann plot method [50] using 10 Nd (II) emission lines, as given in Table 3. The neodymium lines were selected since these were relatively isolated with a clear background, and spectral parameters were also easily accessible. Nd (II) 386.341 nm and Nd (II) 430.357 nm were not used since these were resonant lines and prone to self-absorption. A representative Boltzmann plot at a 2.5 µs delay and details of the spectroscopic parameters is given in Supplementary Figure S4 and Table S2, respectively. The plasma temperature was highest for the 1064 nm laser and decayed from 6278 ± 774 K at 0.4 µs to 5137 ± 150 K at 4.0 µs decay. Similarly, the decay was from 5307 ± 134 to 4538 ± 223 K for 532 nm and 5467 ± 79 to 4737 ± 164 K for the 266 nm laser. The exponential decay rates, shown by the dashed line in Figure 8a, were −0.01, −0.4 and −0.6 for 1064 nm, 532 nm and 266 nm, respectively. The negligible exponential value (−0.01) for 1064 nm indicates an almost linear temperature decay for the 1064 nm laser. The temperature was lowest for 532 nm ablation, showing slightly weaker excitation to that of the 266 nm laser, which showed the least exponent (−0.6) and relatively longest plasma lifetime. The half-error bars in Figure 8a show the half-standard deviation (SD) of five repeated temperature measurements. Full bars were not shown for the clarity of the figures. The average RSD varies from ~9% at 0.4 µs to ~2.5% at 4 µs. The overall statistical precision of the temperature at all delays was 4.81%. Nonetheless, the absolute accuracy of temperature measurements depends on multiple factors, including the accuracy of the emission line transition probability and other statistical parameters, and it was estimated to vary between 15 and 25% for our measurements.
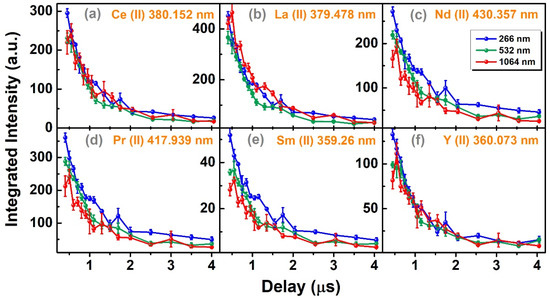
Figure 7.
Temporal decay of 6 REE emission lines from 0.4 µs to 4.0 µs.
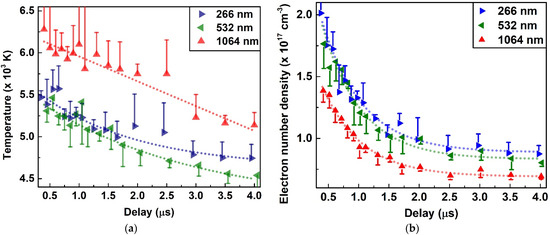
Figure 8.
Plasma temperature (a) and electron number density (b) as a function of delay time from 0.4 µs to 4.0 µs. The half-y-axis error bars are shown for clarity and x-axis error bars are not shown for the same reason.
Electron number density was calculated from a carefully chosen La (II) 387.166 nm line using the Stark broadening method [50]. Supplementary Figure S5 shows a representative Lorentz fit to the selected spectral line at a 2.5 µs delay. The McWhirter’s criterion was satisfied for all the electron number density values at different delays [51]. Figure 8b shows the temporal decay of electron number density. The electron density decay was lowest for the 1064 nm laser from 1.38 × 10¹⁷ ± 9.18 × 1015 cm−3 at 0.4 µs to 6.93 × 10¹⁶ ± 2.17 × 1015 cm−3 at 4.0 µs. The highest value was found for UV irradiation which decayed from 2.01 × 10¹⁷ ± 2.01 × 106 cm−3 to 8.75 × 10¹⁶ ± 6.78 × 1015 cm−3 for the same temporal window. The average statistical precision of electron number density was 8.5%; however, it was higher at shorter delays and decreased with the increase in delay time. The exponential decay rate was ~−1.5 for all three laser wavelengths showing a symmetrical temporal decay. Nonetheless, a monotonic electron density increase was evident with shortening the laser wavelength. A similar trend of temperature and electron number density was observed by Shaikh et al. using a mercury chloride sample for 355, 532 and 1064 nm lasers [52]. The absorption coefficient of the sample material increases with a decreasing laser wavelength, as evidenced by Cabalin and Laserna for different metals using 1064, 532 and 266 nm lasers on metallic samples [53]. A higher photon energy of 4.66 eV at 266 nm reduced the ablation threshold compared to 1.16 eV photons generated at 1064 nm laser [10,54]. The higher energy UV photons favor direct bond-breaking via non-thermal ablation with reduced fractional ablation, compared to a primarily thermal excitation process ignited by lower energy IR photons. In the context of an ICP-AES analysis, Geertsen et al. comprehensively summarized the higher ablation rate, and reduced the matrix effect and superior analytical performance of UV ablation relative to IR laser ablation [55]. In addition, improved spatial resolution gives more control over ablation area, and higher analytical signal reproducibility may be achieved by UV irradiation [56,57]. For coal samples, Li et al. determined that the 266 nm laser had lower thermal effects, plasma shielding, and higher laser-sample coupling relative to the 1064 nm laser [58].
The plasma temperature rise for the 1064 nm laser was caused by a higher laser absorption of the trailing part of the laser pulse inside the plasma, which elevates the plasma shielding effect. This hampers further sample ablation [53], which was also observed by Geertsen et al. [55]. Inverse Bremsstrahlung absorption is the major ablation contributor for relatively lower energy IR photons. The inverse Bremsstrahlung absorption coefficient increased by a third power of the wavelength (λ3), enabling more efficient absorption of 1064 nm photons in the plasma. Thus, the increase in minor element lines by the UV laser was due to the enhanced material ablation, while the higher intensity of major element lines by IR irradiation was due to higher excitation by plasma heating. Increased ablation was also eminent by the significant enhancement of molecular bands derived from the recombination of excited sample constituents with ambient species, as shown in Supplementary Figure S2. High density and low temperature plasma by UV irradiation favored higher self-absorption, especially for easily excitable major species such as calcium (Ca), for which self-absorption was increased for all the protrudent emission lines with a laser wavelength decrease, as shown in Supplementary Figure S1. A similar trend was recently reported for potassium (K) lines in potassium feldspar samples [59]. The schematic Figure 9 manifested this ablation difference at different laser wavelengths. Plasma temperature (Te) and electron umber density (ne) are ranked in descending order from 1 to 3 with the first being the highest. The reduction in the focal length and increase in material ablation with wavelength are illustrated using two blue dotted lines.
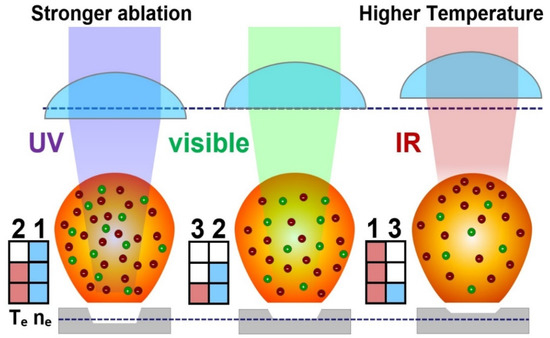
Figure 9.
Schematic of the change in the laser ablation process of the monazite sample using a UV (266 nm), visible (532 nm) and IR (1064 nm) laser with the same laser energy and spot size. The dark red dots (−) in the schematic plasma plume show electrons, while the green dots (+) show ions. The red colored column in the matrix shows Te and the blue color shows ne.
Higher material ablation is more suitable for improvement in the emission intensity with data analysis, or auxiliary excitation or stabilization methods such as double-pulse [8] or spatial confinement [60], etc. The application of these methods is beyond the scope of the present work. The present results shed light on REE ablation mechanisms with different laser wavelengths and will boost LIBS prospects as an on-site and real time analyzer for REE resource exploration. However, precision improvements of the LIBS quantitative analysis are required for its implementation in on-site REE resource exploration.
5. Conclusions
A real REE ore (monazite) was analyzed for improved line identification and the emission enhancement of various rare-earth elements. Using simulations and experimental results, principles for improved line identification in a highly transient and complex laser-induced spectra were presented. Knowledge of the plasma conditions, the arrangement of spectral collection setup, and the spectral resolving capability of the spectrometer are the key parameters to consider for line identification in a complex spectrum. The effect of laser wavelengths on the analytical emission was systematically studied for UV (266 nm), visible (532 nm) and IR (1064 nm) irradiation with the same laser energy and spot size. The UV laser wavelength favored stronger material ablation, while the IR laser produced a higher plasma temperature due to the increased inverse Bremsstrahlung absorption in the plasma. Increased particle density inside plasma by UV laser ablation elevated the emission intensity of minor elements, and this laser can improve the LIBS capability of on-site REE analysis during resource exploration. However, further efforts are required to improve LIBS quantification precision for on-site REE resource exploration.
Supplementary Materials
The following supporting information can be downloaded at: https://www.mdpi.com/article/10.3390/chemosensors10090350/s1, Figure S1: The monazite ore spectra with 1064 nm, 532 nm and 266 nm laser wavelengths at the same laser fluence in the spectral range of 250–433 nm of the echelle spectrograph. The inset shows a major element emission line Ca (II) 393.366 nm. The higher intensity with 1064 nm shows higher temperature, while self-reversal with 266 nm indicates stronger ablation conditions, as described in the manuscript; Figure S2: The monazite ore spectra with 1064 nm, 532 nm and 266 nm laser wavelengths at the same laser fluence in the spectral range 190–930 nm of the Czerny–Turner spectrometer. The inset shows Ca (II) 393.366 nm and the self-reversals are masked due to the limited spectrometer resolution. The laser line was also observed at 266 nm, which is marked in the figure; Figure S3: Change in emission intensity at constant temperature conditions (T = 6000 K) and different electron number density (ne) conditions; Figure S4: The Boltzmann plot of twelve Nd (II) lines used to calculate the temperature. On the x-axis, Ek is the upper energy level in eV. On the y-axis, λ is wavelength, I is intensity, g is the statistical weight of the upper level and A is the transition pobability; Figure S5: The Lorentz Fit of La (II) 387.166 nm line for electron number density calculation. The delay time for the line shown was a 2.5 µs and the electron number density was 1.0 × 107 cm−3; Table S1: The relative concentration of elements (total 100%) used to obtain the simulated spectra of REE ore; Table S2: The spectroscopic data of the Nd (II) lines used to measure temperature.
Author Contributions
Conceptualization, M.S.A. and Z.W.; methodology, M.S.A., W.S. and Z.H.; software, W.S. and W.G.; validation, J.L., Y.S. and W.G.; formal analysis, M.S.A.; investigation, J.L. and Y.S.; resources, Z.W.; data curation, W.S. and W.G.; writing—original draft preparation, M.S.A.; writing—review and editing, M.S.A., W.S.; visualization, M.S.A. and Z.H.; supervision, Z.W.; project administration, Z.H. and Z.W.; funding acquisition, Z.W. All authors have read and agreed to the published version of the manuscript.
Funding
The authors thank the National Natural Science Foundation of China (No. 51906124) for the financial support, Shanxi Province Science and Technology Department (20201101013), and the Scientific Research Program for Young Talents of China National Nuclear Corporation (2020).
Institutional Review Board Statement
Not applicable.
Informed Consent Statement
Not applicable.
Data Availability Statement
The data are available upon a reasonable request from the first or corresponding author.
Conflicts of Interest
The authors declare no conflict of interest.
References
- Nomenclature of Inorganic Chemistry; Connelly, N.G.; Damhus, T.; Hartshorn, R.M.; Hutton, A.T. (Eds.) Royal Society of Chemistry Publishing: Cambridge, UK; IUPAC: Research Triangle, NC, USA, 2005. [Google Scholar]
- Balaram, V. Rare earth elements: A review of applications, occurrence, exploration, analysis, recycling, and environmental impact. Geosci. Front. 2019, 10, 1285–1303. [Google Scholar] [CrossRef]
- Miraz, M.H.; Ali, M.; Excell, P.S.; Picking, R. A review on Internet of Things (IoT), Internet of Everything (IoE) and Internet of Nano Things (IoNT). In Proceedings of the 2015 Internet Technologies and Applications (ITA), Wrexham, UK, 8–11 September 2015; pp. 219–224. [Google Scholar]
- Fernandez, V. Rare-earth elements market: A historical and financial perspective. Resour. Policy 2017, 53, 26–45. [Google Scholar] [CrossRef]
- Li, X.; Zhang, R.; Li, Q.; Wu, P.; Ye, H. Rare earth elements and yttrium (REY) in coal mine drainage from Southwest China: Geochemical distribution and resource evaluation. Sci. Total Environ. 2021, 782, 146904. [Google Scholar] [CrossRef]
- Zheng, B.; Zhang, Y.; Chen, Y. Asymmetric connectedness and dynamic spillovers between renewable energy and rare earth markets in China: Evidence from firms’ high-frequency data. Resour. Policy 2021, 71, 101996. [Google Scholar] [CrossRef]
- Reisfeld, R.; Gaft, M.; Boulon, G.; Panczer, C.; Jørgensen, C.K. Laser-induced luminescence of rare-earth elements in natural fluor-apatites. J. Lumin. 1996, 69, 343–353. [Google Scholar] [CrossRef]
- Wang, Z.; Afgan, M.S.; Gu, W.; Song, Y.; Wang, Y.; Hou, Z.; Song, W.; Li, Z. Recent advances in laser-induced breakdown spectroscopy quantification: From fundamental understanding to data processing. TrAC Trends Anal. Chem. 2021, 143, 116385. [Google Scholar] [CrossRef]
- Hou, Z.; Jeong, S.; Deguchi, Y.; Wang, Z. Way-out for laser-induced breakdown spectroscopy. Plasma Sci. Technol. 2020, 22, 070101. [Google Scholar] [CrossRef]
- Laser-Induced Breakdown Spectroscopy, 2nd ed.; Singh, J.P.; Thakur, S.N. (Eds.) Elsevier: Amsterdam, The Netherland, 2020; p. 429. [Google Scholar]
- Fortes, F.J.; Moros, J.; Lucena, P.; Cabalín, L.M.; Laserna, J.J. Laser-Induced Breakdown Spectroscopy. Anal. Chem. 2013, 85, 640–669. [Google Scholar] [CrossRef]
- Sheta, S.; Afgan, M.S.; Hou, Z.; Yao, S.-C.; Zhang, L.; Li, Z.; Wang, Z. Coal analysis by laser-induced breakdown spectroscopy: A tutorial review. J. Anal. At. Spectrom. 2019, 34, 1047–1082. [Google Scholar] [CrossRef]
- Hou, Z.; Wang, Z.; Li, L.; Yu, X.; Li, T.; Yao, H.; Yan, G.; Ye, Q.; Liu, Z.; Zheng, H. Fast measurement of coking properties of coal using laser induced breakdown spectroscopy. Spectrochim. Acta Part B At. Spectrosc. 2022, 191, 106406. [Google Scholar] [CrossRef]
- Fu, Y.-T.; Gu, W.-L.; Hou, Z.-Y.; Muhammed, S.A.; Li, T.-Q.; Wang, Y.; Wang, Z. Mechanism of signal uncertainty generation for laser-induced breakdown spectroscopy. Front. Phys. 2020, 16, 22502. [Google Scholar] [CrossRef]
- Fu, Y.; Hou, Z.; Li, T.; Li, Z.; Wang, Z. Investigation of intrinsic origins of the signal uncertainty for laser-induced breakdown spectroscopy. Spectrochim. Acta Part B At. Spectrosc. 2019, 155, 67–78. [Google Scholar] [CrossRef]
- Gu, W.; Hou, Z.; Song, W.; Li, L.; Yu, X.; Liu, J.; Song, Y.; Afgan, M.S.; Li, Z.; Liu, Z.; et al. Compensation for the variation of total number density to improve signal repeatability for laser-induced breakdown spectroscopy. Anal. Chim. Acta 2022, 1205, 339752. [Google Scholar] [CrossRef]
- Harmon, R.S.; Senesi, G.S. Laser-Induced Breakdown Spectroscopy—A geochemical tool for the 21st century. Appl. Geochem. 2021, 128, 104929. [Google Scholar] [CrossRef]
- Song, W.; Afgan, M.S.; Yun, Y.-H.; Wang, H.; Cui, J.; Gu, W.; Hou, Z.; Wang, Z. Spectral knowledge-based regression for laser-induced breakdown spectroscopy quantitative analysis. Expert Syst. Appl. 2022, 205, 117756. [Google Scholar] [CrossRef]
- Afgan, M.S.; Hou, Z.; Wang, Z. Quantitative analysis of common elements in steel using a handheld μ-LIBS instrument. J. Anal. At. Spectrom. 2017, 32, 1905–1915. [Google Scholar] [CrossRef]
- Gaft, M.; Panczer, G.; Reisfeld, R.; Uspensky, E. Laser-induced time-resolved luminescence as a tool for rare-earth element identification in minerals. Phys. Chem. Miner. 2001, 28, 347–363. [Google Scholar] [CrossRef]
- Gaft, M.; Raichlin, Y.; Pelascini, F.; Panzer, G.; Motto Ros, V. Imaging rare-earth elements in minerals by laser-induced plasma spectroscopy: Molecular emission and plasma-induced luminescence. Spectrochim. Acta Part B At. Spectrosc. 2019, 151, 12–19. [Google Scholar] [CrossRef]
- Harmon, R.S.; Lawley, C.J.M.; Watts, J.; Harraden, C.L.; Somers, A.M.; Hark, R.R. Laser-Induced Breakdown Spectroscopy—An Emerging Analytical Tool for Mineral Exploration. Minerals 2019, 9, 718. [Google Scholar] [CrossRef]
- Álvarez, J.; Velásquez, M.; Myakalwar, A.K.; Sandoval, C.; Fuentes, R.; Castillo, R.; Sbarbaro, D.; Yáñez, J. Determination of copper-based mineral species by laser induced breakdown spectroscopy and chemometric methods. J. Anal. At. Spectrom. 2019, 34, 2459–2468. [Google Scholar] [CrossRef]
- Romppanen, S.; Häkkänen, H.; Kaski, S. Singular value decomposition approach to the yttrium occurrence in mineral maps of rare earth element ores using laser-induced breakdown spectroscopy. Spectrochim. Acta Part B At. Spectrosc. 2017, 134, 69–74. [Google Scholar] [CrossRef]
- Müller, S.; Meima, J.A.; Rammlmair, D. Detecting REE-rich areas in heterogeneous drill cores from Storkwitz using LIBS and a combination of k-means clustering and spatial raster analysis. J. Geochem. Explor. 2021, 221, 106697. [Google Scholar] [CrossRef]
- Teixeira, L.A.V.; Silva, R.G.; Avelar, A.; Majuste, D.; Ciminelli, V.S.T. Selective Extraction of Rare Earth Elements from Monazite Ores with High Iron Content. Min. Metall. Explor. 2019, 36, 235–244. [Google Scholar] [CrossRef]
- Abedin, K.M.; Haider, A.F.M.Y.; Rony, M.A.; Khan, Z.H. Identification of multiple rare earths and associated elements in raw monazite sands by laser-induced breakdown spectroscopy. Opt. Laser Technol. 2011, 43, 45–49. [Google Scholar] [CrossRef]
- Phuoc, T.X.; Wang, P.; McIntyre, D. Detection of rare earth elements in Powder River Basin sub-bituminous coal ash using laser-induced breakdown spectroscopy (LIBS). Fuel 2016, 163, 129–132. [Google Scholar] [CrossRef]
- Manard, B.T.; Wylie, E.M.; Willson, S.P. Analysis of Rare Earth Elements in Uranium Using Handheld Laser-Induced Breakdown Spectroscopy (HH LIBS). Appl. Spectrosc. 2018, 72, 1653–1660. [Google Scholar] [CrossRef] [PubMed]
- Martin, M.; Martin, R.C.; Allman, S.; Brice, D.; Wymore, A.; Andre, N. Quantification of rare earth elements using laser-induced breakdown spectroscopy. Spectrochim. Acta Part B At. Spectrosc. 2015, 114, 65–73. [Google Scholar] [CrossRef]
- Bhatt, C.R.; Jain, J.C.; Goueguel, C.L.; McIntyre, D.L.; Singh, J.P. Determination of Rare Earth Elements in Geological Samples Using Laser-Induced Breakdown Spectroscopy (LIBS). Appl. Spectrosc. 2017, 72, 114–121. [Google Scholar] [CrossRef]
- Bhatt, C.R.; Hartzler, D.; Jain, J.C.; McIntyre, D.L. Evaluation of analytical performance of double pulse laser-induced breakdown spectroscopy for the detection of rare earth elements. Opt. Laser Technol. 2020, 126, 106110. [Google Scholar] [CrossRef]
- Weisberg, A.; Lakis, R.E.; Simpson, M.F.; Horowitz, L.; Craparo, J. Measuring Lanthanide Concentrations in Molten Salt Using Laser-Induced Breakdown Spectroscopy (LIBS). Appl. Spectrosc. 2014, 68, 937–948. [Google Scholar] [CrossRef]
- Labutin, T.A.; Zaytsev, S.M.; Popov, A.M.; Zorov, N.B. A novel approach to sensitivity evaluation of laser-induced breakdown spectroscopy for rare earth elements determination. J. Anal. At. Spectrom. 2016, 31, 2223–2226. [Google Scholar] [CrossRef]
- Yang, X.; Hao, Z.; Shen, M.; Yi, R.; Li, J.; Yu, H.; Guo, L.; Li, X.; Zeng, X.; Lu, Y. Simultaneous determination of La, Ce, Pr, and Nd elements in aqueous solution using surface-enhanced laser-induced breakdown spectroscopy. Talanta 2017, 163, 127–131. [Google Scholar] [CrossRef] [PubMed]
- Rethfeldt, N.; Brinkmann, P.; Riebe, D.; Beitz, T.; Köllner, N.; Altenberger, U.; Löhmannsröben, H.-G. Detection of Rare Earth Elements in Minerals and Soils by Laser-Induced Breakdown Spectroscopy (LIBS) Using Interval PLS. Minerals 2021, 11, 1379. [Google Scholar] [CrossRef]
- Maity, U.K.; Manoravi, P.; Joseph, M.; Sivaraman, N. Laser-induced breakdown spectroscopy for simultaneous determination of lighter lanthanides in actinide matrix in aqueous medium. Spectrochim. Acta Part B At. Spectrosc. 2022, 190, 106393. [Google Scholar] [CrossRef]
- Lednev, V.; Pershin, S.M.; Bunkin, A.F. Laser beam profile influence on LIBS analytical capabilities: Single vs. multimode beam. J. Anal. At. Spectrom. 2010, 25, 1745–1757. [Google Scholar] [CrossRef]
- Hou, Z.; Afgan, M.S.; Sheta, S.; Liu, J.; Wang, Z. Plasma modulation using beam shaping to improve signal quality for laser induced breakdown spectroscopy. J. Anal. At. Spectrom. 2020, 35, 1671–1677. [Google Scholar] [CrossRef]
- Chemical Analysis Method of Rare Earth Concentrates, National Standards of People’s Republic of China. Available online: https://www.chinesestandard.net/PDF/English.aspx/GBT18114.2-2010 (accessed on 21 June 2022).
- Goldschmidt, Z.B. Chapter 1 Atomic properties (free atom). In Handbook on the Physics and Chemistry of Rare Earths; Elsevier: Amsterdam, The Netherlands, 1978; pp. 1–171. [Google Scholar]
- Winge, R.K.; Fassel, V.A.; Peterson, V.J.; Floyd, M.A. Inductively Coupled Plasma—Atomic Emission Spectroscopy: An Atlas of Spectral Information; Elsevier: Amsterdam, The Netherlands, 1985; p. 584. [Google Scholar]
- Kramida, A.; Ralchenko, Y.; Reader, J.; Team, N.A. NIST Atomic Spectra Database (ver. 5.9), [Online]. Available online: https://physics.nist.gov/asd (accessed on 8 February 2022).
- Griem, H.R. Principles of Plasma Spectroscopy; Cambridge University Press: Cambridge, UK, 1997. [Google Scholar]
- Sheta, S.; Afgan, M.S.; Jiacen, L.; Gu, W.; Hou, Z.; Wang, Z. Insights into Enhanced Repeatability of Femtosecond Laser-Induced Plasmas. ACS Omega 2020, 5, 30425–30435. [Google Scholar] [CrossRef]
- Meggers, W.F. Emission Spectra of the Rare Earth Elements*. J. Opt. Soc. Am. 1941, 31, 157–159. [Google Scholar] [CrossRef]
- Houk, R.S. Chapter 91 Elemental analysis by atomic emission and mass spectrometry with inductively coupled plasmas. In Handbook on the Physics and Chemistry of Rare Earths; Elsevier: Amsterdam, The Netherlands, 1990; pp. 385–421. [Google Scholar]
- Cowan, R.D. The theory of rare earth eaergy levels and spectra. Nucl. Instrum. Methods 1973, 110, 173–182. [Google Scholar] [CrossRef]
- Carre, M.; de Rodriguez, O.D.; Mermet, J.-M.; Bridenne, M.; Marot, Y. Line selection and determination of trace amounts of elements in tungsten by inductively coupled plasma atomic emission spectrometry. J. Anal. At. Spectrom. 1991, 6, 49–55. [Google Scholar] [CrossRef]
- Cremers, D.A.; Radziemski, L.J. Handbook of Laser-Induced Breakdown Spectroscopy, 2nd ed.; John Wiley & Sons, Ltd: New York, NY, USA, 2013. [Google Scholar]
- McWhirter, R.W.P. Plasma Diagnostic Techniques; Academic Press: New York, NY, USA, 1965. [Google Scholar]
- Shaikh, N.M.; Hafeez, S.; Rashid, B.; Mahmood, S.; Baig, M.A. Optical emission studies of the mercury plasma generated by the fundamental, second and third harmonics of a Nd: YAG laser. J. Phys. D Appl. Phys. 2006, 39, 4377–4385. [Google Scholar] [CrossRef]
- Cabalín, L.M.; Laserna, J.J. Experimental determination of laser induced breakdown thresholds of metals under nanosecond Q-switched laser operation. Spectrochim. Acta Part B At. Spectrosc. 1998, 53, 723–730. [Google Scholar] [CrossRef]
- Simeonsson, J.B.; Miziolek, A.W. Spectroscopic studies of laser-produced plasmas formed in CO and CO2 using 193, 266, 355, 532 and 1064 nm laser radiation. Appl. Phys. B 1994, 59, 1–9. [Google Scholar] [CrossRef]
- Geertsen, C.; Briand, A.; Chartier, F.; Lacour, J.-L.; Mauchien, P.; Sjöström, S.; Mermet, J.-M. Comparison between infrared and ultraviolet laser ablation at atmospheric pressure—implications for solid sampling inductively coupled plasma spectrometry. J. Anal. At. Spectrom. 1994, 9, 17–22. [Google Scholar] [CrossRef]
- Kasem, M.A.; Gonzalez, J.J.; Russo, R.E.; Harith, M.A. Effect of the wavelength on laser induced breakdown spectrometric analysis of archaeological bone. Spectrochim. Acta Part B At. Spectrosc. 2014, 101, 26–31. [Google Scholar] [CrossRef]
- Russo, R.E.; Mao, X.L.; Borisov, O.V.; Liu, H. Influence of wavelength on fractionation in laser ablation ICP-MS. J. Anal. At. Spectrom. 2000, 15, 1115–1120. [Google Scholar] [CrossRef]
- Li, X.; Wang, Z.; Fu, Y.; Li, Z.; Ni, W. Wavelength Dependence in the Analysis of Carbon Content in Coal by Nanosecond 266 nm and 1064 nm Laser Induced Breakdown Spectroscopy. Plasma Sci. Technol. 2015, 17, 621–624. [Google Scholar] [CrossRef]
- Cui, H.; Tang, Y.; Ma, S.; Ma, Y.; Zhang, D.; Hu, Z.; Wang, Z.; Guo, L. Influence of laser wavelength on self-absorption effect in laser-induced breakdown spectroscopy. Optik 2020, 204, 164144. [Google Scholar] [CrossRef]
- Hou, Z.; Wang, Z.; Liu, J.; Ni, W.; Li, Z. Combination of cylindrical confinement and spark discharge for signal improvement using laser induced breakdown spectroscopy. Opt. Express 2014, 22, 12909–12914. [Google Scholar] [CrossRef]
Publisher’s Note: MDPI stays neutral with regard to jurisdictional claims in published maps and institutional affiliations. |
© 2022 by the authors. Licensee MDPI, Basel, Switzerland. This article is an open access article distributed under the terms and conditions of the Creative Commons Attribution (CC BY) license (https://creativecommons.org/licenses/by/4.0/).