Abstract
Inorganic lead-halide perovskite, cesium lead bromide (CsPbBr3), shows outstanding optoelectronic properties. Both solution- and melt-based methods have been proposed for CsPbBr3 crystal growth. The solution-based growth was done at low-temperature, whereas the melt-based growth was done at high-temperature. However, the comparison of optical, physical, and defect states using these two different growth conditions has been scarcely studied. Here, we have compared the thermal and optical properties of solution-grown and melt-grown single crystals of CsPbBr3. Positron Annihilation Lifetime Spectroscopy (PALS) analysis showed that melt-grown crystal has a relatively smaller number of defects than the chemical synthesis method. In addition, crystals grown using the chemical method showed a higher fluorescence lifetime than melt-grown CsPbBr3.
1. Introduction
Thin-film-based lead halide perovskite has long been used in the construction of solar cells [1]. Because of the improvement in the synthesis and understanding of the perovskite, the light conversion efficiency has increased from 3.8% (2009) [1] to 25.7% (2021) [2]. The stability and performance of the device could be further improved by employing single crystal perovskite [3,4]. The synthesis of single crystal perovskite can be divided into four categories: (i) slow crystallization [5,6,7], (ii) antisolvent crystallization [8,9], (iii) inverse temperature crystallization [10,11,12], and (iv) melt method [13,14,15,16,17]. A comparison of hybrid organic-inorganic perovskite (e.g., MAPbBr3) and complete inorganic perovskite (CsPbBr3) showed that the organic elements might potentially decrease stability [9,18,19,20].
Due to defect tolerance [21,22] of halide perovskite materials, they have been proposed in various optoelectronics applications such as high-efficiency solar cells [23,24], LED [25,26], laser [27], UV-NIR photodetectors [28,29,30,31,32], X-ray detector [33,34], and γ-ray detector [13,17,35,36,37]. In spite of the presence of a large number of point defects, remarkably, halide perovskite materials have a low density of trap states (~109–1011/cm3) [8,11]. For comparison, trap density of some materials are- monocrystalline Si: 108–1015/cm3 [38,39]; polycrystalline Si: 1013–1014/cm3 [40,41], CdTe/CdS: 1011–1013/cm3 [42], MAPbBr3: 5.8 × 10⁹/cm3 [8], and MAPbI3: 3.3 × 10¹⁰/cm3 [8]. Furthermore, perovskite single crystal offers better electronic properties compared to their nanocrystals and thin-film counterparts. The carrier mobility of single crystal MAPbI3 is ~200 cm2 V−1 s−1, whereas that of thin films is up to 40 cm2 V−1 s−1. Similarly, the carrier lifetime in a single crystal can reach up to 500 µs [5], whereas the lifetimes in nanocrystals and thin films are limited to about 1 µs [22].
Although the synthesis of CsPbBr3 using both solution-based [9,18,43,44] and melt-based methods [3,13,37,45] has been reported for CsPbBr3, detailed comparison of their performance has not been made yet. Here, we have compared the optical performance of solution-grown and melt-grown single crystals of CsPbBr3. Further, we have compared the thermal, and structural properties of solution grown and melt-grown single crystals of CsPbBr3. We have used several structural (XRD, EDX, WSAXS), thermal (specific heat, thermal conductivity, thermopower, DSC, TGA), electrical (XAS), and optical (Raman, PALS, UV-Vis, PL, FLIM) measurements to understand the potential of CsPbBr3 crystals for optoelectronics applications.
2. Materials and Methods
Synthesis: CsBr (Alfa Aesar, 99.9%) and PbBr2 (Alfa Aesar, 99.998%) were mixed in a molar ratio of 1:1 and placed in an evacuated quartz tube. The tube was heated up to 580 °C at a rate of 60 °C/h and remained at that temperature for 24 h. The sample was then cooled down at a rate of 20 °C/h to room temperature. The obtained polycrystalline product was orange in color. Next, the polycrystalline CsPbBr3 was sealed in a quartz tube. Single crystals were grown in a floating zone furnace using a growth speed of 0.5 mm/h. The obtained crystals have an orange color and are transparent.
PXRD and EDX measurement: The powder X-ray diffraction has been performed on a grounded piece of a single crystal and on a flat surface of a single crystal. The LeBail analysis was done using FullProf software. CsPbBr3 crystallizes in an orthorhombic crystal structure Pnma (#62) with lattice parameters: a = 8.2055(3) Å, b = 8.2580(4) Å, and c = 11.7568(3) Å, which is in good agreement with the previously reported data. The crystal cleaved along (010), which was determined from PXRD obtained from a flat surface.
WSAXS measurement and analysis: The wide-angle X-ray measurements were performed with grounded polycrystalline pieces of the sample. The powder sample was measured at CAMD, LSU. The Ganesha beamline system (Xenocs) is equipped with a Pilatus3 R 300 K detector (Dectris) and a Cu-Kα X-ray source (Xenocs) running at 50 W. In order to enhance the measurement range to higher angles, several detector pictures were set together to cover a 2θ range from 0.5° to 33°. Data reduction was performed with the SAXSGUI program (Xenocs).
Specific heat and thermal transport measurements: Specific heat, thermopower, and thermal conductivity were measured using a Physical Property Measurement System (PPMS). Specific heat was carried out using the standard relaxation method, while thermopower and thermal conductivity by the four-probe method.
XAS measurement: The sample current was measured at the varied-line-space plane grating monochromator (VLSPGM: 200−1100 eV) beamline at CAMD, LSU. The sample was placed on a stainless-steel sample holder and held on the holder by two tantalum strips spot welded onto it. The electron yield detection mode was employed, and the sample current was recorded with a Keithley-6514 programmable electrometer. The high energy grating (500–1100 eV) and a 100 μm slit width were used for the sample current measurement.
Differential Scanning Calorimetry (DSC): DSC analysis was conducted on a TA Instruments (New Castle, DE) TA Discovery DSC250 calorimeter under nitrogen (50 mL/min), using T Zero Aluminum pans. The following program was used: (1) Equilibrate at –40 °C; (2) Ramp to 150 °C at 10 °C/min; (3) Ramp to –40 °C at 10 °C/min; (4) Ramp to 400 °C at 10 °C/min; (5) Ramp to –40 °C at 10 °C/min.
Thermogravimetric Analysis (TGA): TGA analysis of solid samples was conducted on a TA Instruments (New Castle, DE) TA Discovery TGA550 under nitrogen purge (60 mL/min furnace, 40 mL/min balance) at a heating rate of 10 °C/min. The decomposition temperature (Td) can be obtained at the onset point of the maximum weight loss rate.
Positron Annihilation Lifetime Spectroscopy (PALS): A custom-made PALS system with a PALS spectrometer having two scintillator detectors, one Na22 source, and a time-correlated single photon counting (TCSPC) unit were used. PALS system measures the lifetime of the positron (time interval between the implantation of the positron in the materials and the annihilation of the positron). The pore size in the materials (atomic defect, point defect) can be inferred from the positron lifetime.
Raman Spectroscopy: The Raman measurements were performed using a Renishaw inVia Reflex system. The laser excitation wavelength was λ = 633 nm, objective: 50× long working distance (air). The acquisition time per spectrum was 10 s.
Solid State Photoluminescence (PL) measurement (Low and High Temperature): Edinburgh FLS1000 PL was used for the photoluminescence experiments. The instrument uses a 450 W Xenon excitation source. Powder samples (using a Starna Cells holder) were used for the measurements with a pixel dwelling time of 0.5 s. A step size of 1 nm was used. The low temperatures were achieved using liquid nitrogen on a temperature-controlled stage (Linkam THMS600).
Fluorescence Lifetime Imaging Microscopy (FLIM): The FLIM measurements were performed using a Leica SP8 Confocal with White Light Laser system (470 to 670 nm tunable in steps of 1 nm).
3. Results and Discussion
Figure 1a shows the schematic of the floating zone setup. A single crystal obtained by the floating zone method is shown in Figure 1b. The crystal structure is determined using powder X-ray diffraction (PXRD), and the PXRD pattern is analyzed using the LeBail method [46]. Figure 1c shows the comparison of crystal synthesized by chemical synthesis (brown curve) and floating zone (melt method) (pink curve). The vertical red lines show the expected Bragg positions for the Pnma space group (#62) that CsPbBr3 forms at room temperature (PDF#18-0364). The corresponding lattice parameters are a = 8.2055(3) Å, b = 8.2580(4) Å, and c = 11.7568(3) Å, which is in good agreement with the previous report [47]. The phase composition is determined by energy dispersive X-ray measurements, resulting in an average elemental ratio corresponding to CsPbBr3. Figure 1d shows the SEM image of the location from which EDX spectra were taken. The corresponding composition spectra and table are shown in Figure 1e. EDX yields a Cs:Pb:Br atomic ratio of (1.00):(1.38):(3.17). The excess in the Pb signal is due to the reabsorption of X-ray emission by Cs. Similarly, the excess in the Br signal is because of the reabsorption of X-rays from Cs and Pb. The wide angle scattering data for CsPbBr3 is shown in Figure 2a. The corresponding I vs. 2θ is shown in Figure 2b. The WSAXS data for the crystal in Figure 2b matches well with the XRD data in Figure 1c.
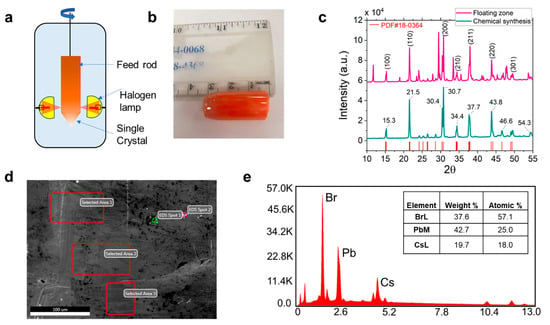
Figure 1.
Synthesis of CsPbBr3 using: (a) floating zone method; (b) Bright field image of single crystal perovskite, and the corresponding (c) X-ray diffraction (XRD) pattern of CsPbBr3. An example of the Energy Dispersive X-ray Spectroscopy (EDX) result is shown in (d). In addition, the composition of several crystals in different areas (red box) yielded a consistent chemical composition, as shown in (e).
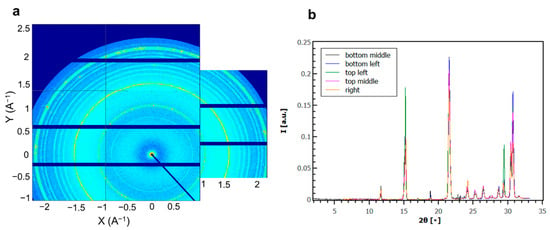
Figure 2.
(a) Wide angle scattering data for grounded CsPbBr3 set together from several detector pictures. The blue horizontal lines are non-sensitive positions of the Pilatus3 R 300K detector; (b) I(q) vs. 2q for the detector pictures depicted in (a).
The thermogravimetric (TG) and differential scanning calorimetry (DSC) analyses of the CsPbBr3 crystal are shown in Figure 3a,b, respectively. CsPbBr3 was stable up to 465 °C, and about 40% mass loss was observed at the melting temperature [9,13] (567 °C) (Figure 3a). DSC analysis showed tetragonal (P4/mbm) ↔ cubic (Pm3m) phase transformation at 132 °C and orthorhombic (Pbnm) ↔ tetragonal (P4/mbm) phase transformation (Figure 3c) at 88 °C, which agrees with the literature observation [9,13,47,48,49,50]. The other peaks at 332 and 335 °C might be due to the melting of PbBr2 [51]. The temperature dependence of the specific heat (Cp) is presented in Figure 3d. Note that, above ~150 K, Cp reaches the expected Dulong-Petit value of 3nR = 124.65 J/mol K, where R is the universal gas constant and n is the number of atoms per formula unit. In the measured temperature range, there is no sign for any phase transition. To check its low-temperature behavior, we plot Cp/T3 versus T, which severely deviates from the Debye model (i.e., constant Cp/T3). Such deviation has been previously reported for CsPbBr3 and CsPbI3 and was explained by possible vibrations of heavy atoms or acoustic phonon modes with low dispersion at zone boundaries [52,53].
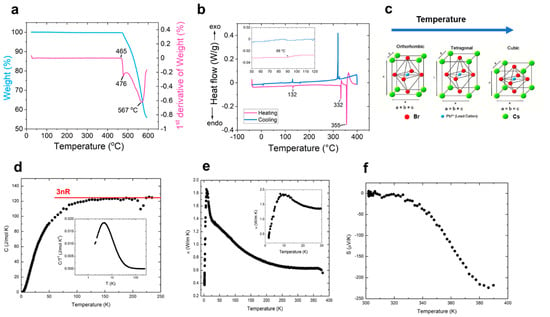
Figure 3.
Thermal analysis of CsPbBr3. (a) TGA; (b) DSC; (c) schematic of different phases as a function of temperature; (d) temperature dependence of the specific heat. Inset: Cp/T3 versus temperature; (e) temperature dependence of the thermal conductivity. Inset: low-temperature thermal conductivity; (f) Seebeck coefficient versus temperature.
Figure 3e shows the temperature dependence of the thermal conductivity (k), typical for a single crystal sample. The peak around 10 K indicates that the system reaches the longest phonon mean-free path. The magnitude and the temperature dependence of the thermal conductivity is almost the same as that reported for CsPbI3 [54]. For crystalline CsPbBr3, the thermal conductivity is low in the entire temperature range measured, likely related to heavy Cs and Pb and/or the unusual acoustic phonon modes.
The temperature dependence of the Seebeck coefficient (S) is presented in Figure 3f. It is unmeasurable due to electrical insulation until ~320 K, above which its magnitude increases with increasing temperature. The negative thermopower indicates that the leading charge carriers in the system are electrons above 320 K. Note that there is a minimum at around 385 K, which is close to the reported structural transition to a cubic Pm-3m space group3. However, measurements at higher temperatures are needed to confirm such structural transition.
The positron in the PALS system is generated by the decay of Na22 to Ne22 with the equation: . The positron is subsequently annihilated by combining with the electron in the medium, which emits a pair of photons with an energy of 511 keV. The time elapsed between the production of 1274 keV photon and the emission of 511 keV photon signifies the positron lifetime. The TCSPC of the PALS system with picosecond resolution measures this lifetime. The positron may undergo quick thermalization with a lifetime of ~10 ps. The positron may form a pair with the electrons (called positronium) near the void in the material, whose lifetime may vary from 0.125–142 ns [55]. The positronium exists in a singlet state (para-positronium with antiparallel orientation ), or as a triplet state (ortho-positronium with parallel orientation, ). Para-positronium has a lifetime of 0.125 ns, and ortho-positronium has a lifetime of 125 ns in a vacuum. The backscattered positron in a vacuum has a lifetime of 142 ns. The triplet state (ortho-Ps) prefers defects or pores, where the lifetime is reduced by interacting with the electrons. Typically, the lifetime is increased with the size of the void. With the same size of void, the lifetime is decreased with the increase in temperature. As shown in Figure 4a (crystal from the floating zone), the yield counts of the system can be fitted with the following function: Here, τ3 is of interest (inverse slope of the o-Ps components) and the intensity I3 is the area under the slope. Figure 4b represents the corresponding plot of the lifetime components for the crystal made using the chemical synthesis method. The fitting parameters are presented in Table S1. Figure 4c illustrates the comparison of lifetime for the two synthesis methods. The floating zone method showed a shorter lifetime compared to the chemical synthesis method. τ1 represents para-positrons, and τ2 represents free-positrons. τ3 is directly proportional to the size of the void, and I3 is related to the concentration of voids. In addition, τav > τb indicates that vacancy type defects are present in the sample.
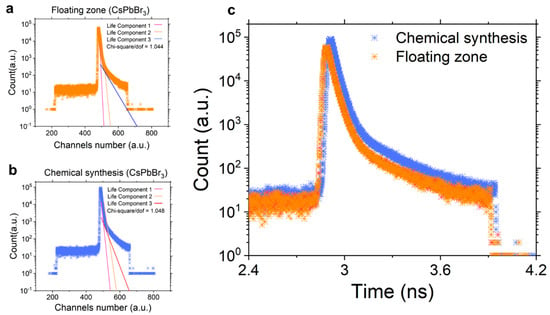
Figure 4.
Positron Annihilation Lifetime Spectroscopy (PALS) analysis for CsPbBr3 depicting the three-lifetime components for crystal obtained using (a) floating zone and (b) chemical synthesis method. (c) comparison of positron lifetime from chemical synthesis and floating zone method.
Figure 5a compares the transmission spectrum of CsPbBr3 synthesized using chemical synthesis and using the floating zone (melt) route. The floating zone method showed a considerably higher transmission between λ = 300–550 nm. The crystal made with the chemical synthesis method showed a smaller bandgap (Eg = 2.25 eV) (Figure 5b) compared to the melt method (Eg = 2.27 eV) (Figure 5c), which agrees with the previous literature [13,18,43,56]. The band gap was calculated using the Tauc plot by transforming the data in Figure 5a through the Kubelka–Munk equation [57]. Next, to understand the phonon modes in the sample, we performed Raman spectroscopy on the CsPbBr3 crystal. Theoretically, there are 24 Raman active modes in CsPbBr3 [58]. The Raman mode at 77 cm−1 signifies the vibrational mode of octahedron [58,59]. The mode at 132 cm−1 (~16.4 meV) is the transverse optical (TO) phonon due to Pb-Br stretching. The weak Raman modes at ~150 cm−1 (18.6 meV) and 314 cm−1 are due to the first and second-order longitudinal optical (LO) phonon modes, respectively [60]. CsPbBr3 crystal was exposed to soft X-ray light at the plane grating monochromator beamline at CAMD, and the resultant sample current shown in Figure 5e was measured with a programmable electrometer. The sample current was collected using the high-energy monochromator of the beamline over a photon energy range between 500 and 1100 eV. The monochromator provides its highest photon flux throughput between 700–800 eV. At this range, ~3 pA sample current is measured from CsPbBr3. The spectrum also reveals the Cs M5,4 absorption edges at around 750 eV. The dips that appear at around 540 eV and 870 eV are from oxygen and nickel elements, respectively, located on the surfaces of the focusing mirrors that the beamline encompasses. The photoluminescence (PL) measurements of CsPbBr3 powder in solution form (Figure 5f) in a cuvette yields four distinct peaks at 453 nm (2.74 eV), 564 nm (2.2 eV), 682 nm (1.82 eV), and 736 nm (1.68 eV).
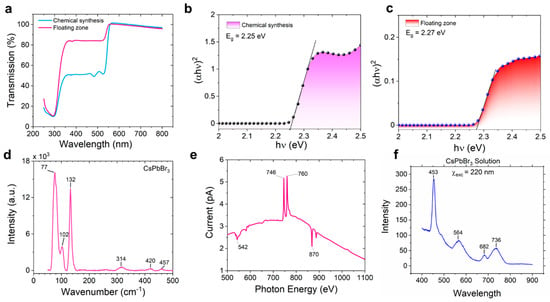
Figure 5.
(a) The transmittance spectra of CsPbBr3 crystal, synthesized using the chemical (blue curve) and floating zone (pink curve) method. The bandgap of the (b) chemically synthesized and (c) floating zone synthesized CsPbBr3 was calculated using the Tauc plot. (d) Raman spectra show the phonon modes of CsPbBr3. (e) CsPbBr3 crystal was exposed to soft X-ray light using a plane grating monochromator beamline, and the resultant sample current was measured with a programmable electrometer; (f) the PL spectra of CsPbBr3 solution using an excitation of λ = 220 nm.
The solid-state PL measurements (Figure 6a,b) showed two distinct peaks at 530 nm (2.34 eV) and 620 nm (2 eV). The peak at 2 eV remains invariant with the temperature change. The temperature-dependent PL measurements showed a decrease in PL intensity with temperature (Figure 6a,b). The peak at 2.34 eV (curve for −190 °C) continuously red-shifted to lower energy with the rise of temperature and reached 2.18 eV at 110 °C. The trends are consistent in the samples obtained using chemical synthesis and melt methods. The melt method showed higher PL intensity compared to the chemical synthesis method. The peak at 2.25 eV (λ = 550 nm) is also generally observed in room-temperature PL experiments reported in the literature [9,13,18,43,56]. The peak near the bandgap (~2.27 eV) is due to the free-exciton emission, and the peak around ~2 eV is due to bound-exciton emission. The free to bound-exciton peak ratio at low temperature (–190 °C) is close to 1, whereas at higher temperatures (110 °C), the free to bound–exciton peak ratio decreases to <0.5. The FWHM of the free exciton emission is ~89–96 meV and changes with temperature. The FWHM of bound exciton emission is ~70 meV and remains invariant with temperature. The electron–phonon coupling can be calculated using the temperature-dependent PL data by using the Huang–Rhys factor (S) with the relationship [61]: . Higher S-factor signifies a higher amount of self-trapped excitons (STE). Here, S-factor at lower temperatures is greater than that at higher temperatures. Therefore, the PL emission is higher at lower temperatures. However, the formation of STE might impede carrier mobility and degrade the detector’s performance.
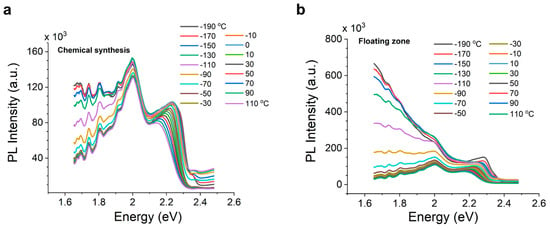
Figure 6.
Temperature-dependent solid state PL spectra of CsPbBr3 obtained from (a) chemical synthesis, λex = 293 nm and (b) floating zone method; λex = 291 nm.
Figure 7a,b show the FLIM image and phasor plot of the CsPbBr3 sample prepared using the floating zone method. The corresponding FLIM image and phasor plot of the CsPbBr3 sample prepared using the chemical synthesis method is shown in Figure 7d,e, respectively. Figure 7c shows the fit for the FLIM spectrum for the floating zone (pink curve) and chemical synthesis (brown curve) method. The corresponding fit parameters are provided in Table S2. The lifetime is fitted with the function: . The mean intensity weighted lifetime was calculated using:
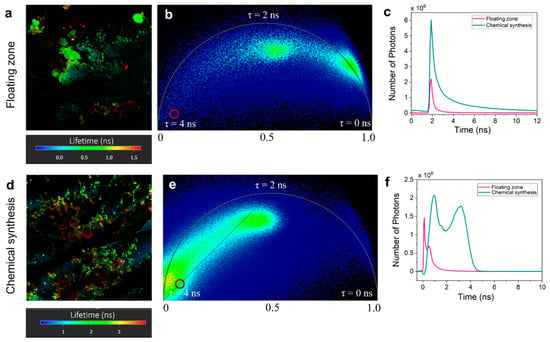
Figure 7.
Comparison of FLIM results for CsPbBr3 obtained through the floating zone and chemical synthesis method; (a) lifetime image and (b) phasor plot for floating zone method; (c) lifetime fitting comparing floating zone and chemical synthesis method; (d) lifetime image and (e) phasor plot for chemical synthesis method; (f) photon distribution with lifetime comparing the floating zone and chemical synthesis method.
Here, floating zone synthesized crystal showed shorter intensity weighted mean lifetime of (1.092 ns) compared to the chemical synthesis method ( of 3.791 ns). This may be due to the efficient capture of free excitons by trap states in crystals made using floating zone [58,62,63]. Figure 7f shows the distribution of photons emitted from the sample with different lifetimes for the two synthesis methods. The floating zone method showed less efficient fluorescence photon emission than the chemical synthesis method.
4. Conclusions
We measured the structural, thermal, electrical, and optical properties of CsPbBr3. The crystal shows low thermal conductivity and high thermopower. The crystal-synthesized using the floating zone method showed a lower positron lifetime compared to samples obtained using chemical synthesis methods. The PALS measurement signifies a smaller defect size in floating zone-grown crystals compared to the chemical synthesis method. The floating zone method showed higher PL intensity than the chemical synthesis method. The mean fluorescence lifetime of the floating zone synthesized crystal was lower than the crystal-synthesized using the chemical synthesis method. The temperature-dependent PL and FLIM measurements showed that the luminescence property of the crystal originates from the trapped excitons.
Supplementary Materials
The following supporting information can be downloaded at: https://www.mdpi.com/article/10.3390/chemosensors10090369/s1, Table S1: Positron Annihilation Lifetime Spectroscopy (PALS) data analysis; Table S2: Fit parameters for the Fluorescence Lifetime Imaging Microscopy (FLIM) data for CsPbBr3 synthesized with melt and solution-based methods.
Author Contributions
Conceptualization, M.R.G.; methodology, R.C., M.S., O.K., R.J., J.D. and M.R.G.; validation, K.A., S.M.A.H., J.B., N.M. and Y.W.; formal analysis, K.A., S.M.A.H., J.B., N.M., Y.W., M.S., R.C. and O.K.; resources, M.R.G., R.J. and N.S.P.; data curation, M.R.G.; writing—original draft preparation, K.A., J.B. and M.R.G.; writing—review and editing, M.R.G., R.J. and J.D.; supervision, M.R.G., J.D. and R.J.; project administration, M.R.G. All authors have read and agreed to the published version of the manuscript.
Funding
This research was funded by National Science Foundation (1504226), National Science Foundation (2045640) and Louisiana Space Consortium (003847).
Institutional Review Board Statement
Not applicable.
Informed Consent Statement
Not applicable.
Data Availability Statement
Not applicable.
Acknowledgments
XRD and Raman spectroscopy experiments were performed at the Shared Instrumentation Facility (SIF) at Louisiana State University. WSAXs and XAS were performed at the Center for Advanced Microstructures and Devices (CAMD), LSU.
Conflicts of Interest
The authors declare no conflict of interest.
References
- Kojima, A.; Teshima, K.; Shirai, Y.; Miyasaka, T. Organometal halide perovskites as visible-light sensitizers for photovoltaic cells. J. Am. Chem. Soc. 2009, 131, 6050–6051. [Google Scholar] [CrossRef] [PubMed]
- Min, H.; Lee, D.Y.; Kim, J.; Kim, G.; Lee, K.S.; Kim, J.; Paik, M.J.; Kim, Y.K.; Kim, K.S.; Kim, M.G. Perovskite solar cells with atomically coherent interlayers on SnO2 electrodes. Nature 2021, 598, 444–450. [Google Scholar] [CrossRef] [PubMed]
- Liu, Y.; Zhang, Y.; Zhu, X.; Yang, Z.; Ke, W.; Feng, J.; Ren, X.; Zhao, K.; Liu, M.; Kanatzidis, M.G. Inch-sized high-quality perovskite single crystals by suppressing phase segregation for light-powered integrated circuits. Sci. Adv. 2021, 7, eabc8844. [Google Scholar] [CrossRef] [PubMed]
- Chen, Z.; Turedi, B.; Alsalloum, A.Y.; Yang, C.; Zheng, X.; Gereige, I.; AlSaggaf, A.; Mohammed, O.F.; Bakr, O.M. Single-crystal MAPbI3 perovskite solar cells exceeding 21% power conversion efficiency. ACS Energy Lett. 2019, 4, 1258–1259. [Google Scholar] [CrossRef]
- Lian, Z.; Yan, Q.; Gao, T.; Ding, J.; Lv, Q.; Ning, C.; Li, Q.; Sun, J.-l. Perovskite CH3NH3PbI3 (Cl) single crystals: Rapid solution growth, unparalleled crystalline quality, and low trap density toward 108 cm–3. J. Am. Chem. Soc. 2016, 138, 9409–9412. [Google Scholar] [CrossRef] [PubMed]
- Dang, Y.; Liu, Y.; Sun, Y.; Yuan, D.; Liu, X.; Lu, W.; Liu, G.; Xia, H.; Tao, X. Bulk crystal growth of hybrid perovskite material CH3NH3PbI3. Cryst. Eng. Comm. 2015, 17, 665–670. [Google Scholar] [CrossRef]
- Daub, M.; Hillebrecht, H. Synthesis, Single-Crystal Structure and Characterization of (CH3NH3)2 Pb(SCN)2I2. Angew. Chem. 2015, 127, 11168–11169. [Google Scholar] [CrossRef]
- Shi, D.; Adinolfi, V.; Comin, R.; Yuan, M.; Alarousu, E.; Buin, A.; Chen, Y.; Hoogland, S.; Rothenberger, A.; Katsiev, K. Low trap-state density and long carrier diffusion in organolead trihalide perovskite single crystals. Science 2015, 347, 519–522. [Google Scholar] [CrossRef]
- Rakita, Y.; Kedem, N.; Gupta, S.; Sadhanala, A.; Kalchenko, V.; Böhm, M.L.; Kulbak, M.; Friend, R.H.; Cahen, D.; Hodes, G. Low-temperature solution-grown CsPbBr3 single crystals and their characterization. Cryst. Growth Des. 2016, 16, 5717–5725. [Google Scholar] [CrossRef]
- Saidaminov, M.I.; Abdelhady, A.L.; Murali, B.; Alarousu, E.; Burlakov, V.M.; Peng, W.; Dursun, I.; Wang, L.; He, Y.; Maculan, G. High-quality bulk hybrid perovskite single crystals within minutes by inverse temperature crystallization. Nat. Commun. 2015, 6, 7586. [Google Scholar] [CrossRef]
- Zhumekenov, A.A.; Saidaminov, M.I.; Haque, M.A.; Alarousu, E.; Sarmah, S.P.; Murali, B.; Dursun, I.; Miao, X.-H.; Abdelhady, A.L.; Wu, T. Formamidinium lead halide perovskite crystals with unprecedented long carrier dynamics and diffusion length. ACS Energy Lett. 2016, 1, 32–37. [Google Scholar] [CrossRef]
- Liu, Y.; Yang, Z.; Cui, D.; Ren, X.; Sun, J.; Liu, X.; Zhang, J.; Wei, Q.; Fan, H.; Yu, F. Two-inch-sized perovskite CH3NH3PbX3 (X = Cl, Br, I) crystals: Growth and characterization. Adv. Mater. 2015, 27, 5176–5183. [Google Scholar] [CrossRef] [PubMed]
- Stoumpos, C.C.; Malliakas, C.D.; Peters, J.A.; Liu, Z.; Sebastian, M.; Im, J.; Chasapis, T.C.; Wibowo, A.C.; Chung, D.Y.; Freeman, A.J. Crystal growth of the perovskite semiconductor CsPbBr3: A new material for high-energy radiation detection. Cryst. Growth Des. 2013, 13, 2722–2727. [Google Scholar] [CrossRef]
- Kobayashi, M.; Omata, K.; Sugimoto, S.; Tamagawa, Y.; Kuroiwa, T.; Asada, H.; Takeuchi, H.; Kondo, S. Scintillation characteristics of CsPbCl3 single crystals. Nucl. Instrum. Methods Phys. Res. Sect. A Accel. Spectrometers Detect. Assoc. Equip. 2008, 592, 369–373. [Google Scholar] [CrossRef]
- Clark, D.; Stoumpos, C.; Saouma, F.; Kanatzidis, M.; Jang, J. Polarization-selective three-photon absorption and subsequent photoluminescence in CsPbBr3 single crystal at room temperature. Phys. Rev. B 2016, 93, 195202. [Google Scholar] [CrossRef]
- Nitsch, K.; Hamplová, V.; Nikl, M.; Polák, K.; Rodová, M. Lead bromide and ternary alkali lead bromide single crystals—Growth and emission properties. Chem. Phys. Lett. 1996, 258, 518–522. [Google Scholar] [CrossRef]
- He, Y.; Petryk, M.; Liu, Z.; Chica, D.G.; Hadar, I.; Leak, C.; Ke, W.; Spanopoulos, I.; Lin, W.; Chung, D.Y. CsPbBr3 perovskite detectors with 1.4% energy resolution for high-energy γ-rays. Nat. Photonics 2021, 15, 36–42. [Google Scholar] [CrossRef]
- Zhang, H.; Liu, X.; Dong, J.; Yu, H.; Zhou, C.; Zhang, B.; Xu, Y.; Jie, W. Centimeter-sized inorganic lead halide perovskite CsPbBr3 crystals grown by an improved solution method. Cryst. Growth Des. 2017, 17, 6426–6431. [Google Scholar] [CrossRef]
- Kulbak, M.; Gupta, S.; Kedem, N.; Levine, I.; Bendikov, T.; Hodes, G.; Cahen, D. Cesium enhances long-term stability of lead bromide perovskite-based solar cells. J. Phys. Chem. Lett. 2016, 7, 167–172. [Google Scholar] [CrossRef]
- Kulbak, M.; Cahen, D.; Hodes, G. How important is the organic part of lead halide perovskite photovoltaic cells? Efficient CsPbBr3 cells. J. Phys. Chem. Lett. 2015, 6, 2452–2456. [Google Scholar] [CrossRef]
- Brandt, R.E.; Stevanović, V.; Ginley, D.S.; Buonassisi, T. Identifying defect-tolerant semiconductors with high minority-carrier lifetimes: Beyond hybrid lead halide perovskites. MRS Commun. 2015, 5, 265–275. [Google Scholar] [CrossRef]
- Manser, J.S.; Christians, J.A.; Kamat, P.V. Intriguing optoelectronic properties of metal halide perovskites. Chem. Rev. 2016, 116, 12956–13008. [Google Scholar] [CrossRef] [PubMed]
- Kim, D.I.; Lee, J.W.; Jeong, R.H.; Boo, J.-H. A high-efficiency and stable perovskite solar cell fabricated in ambient air using a polyaniline passivation layer. Sci. Rep. 2022, 12, 697. [Google Scholar] [CrossRef] [PubMed]
- Kim, J.Y.; Lee, J.-W.; Jung, H.S.; Shin, H.; Park, N.-G. High-efficiency perovskite solar cells. Chem. Rev. 2020, 120, 7867–7918. [Google Scholar] [CrossRef]
- Tan, Z.-K.; Moghaddam, R.S.; Lai, M.L.; Docampo, P.; Higler, R.; Deschler, F.; Price, M.; Sadhanala, A.; Pazos, L.M.; Credgington, D. Bright light-emitting diodes based on organometal halide perovskite. Nat. Nanotechnol. 2014, 9, 687–692. [Google Scholar] [CrossRef]
- Luo, D.; Chen, Q.; Qiu, Y.; Zhang, M.; Liu, B. Device engineering for all-inorganic perovskite light-emitting diodes. Nanomaterials 2019, 9, 1007. [Google Scholar] [CrossRef]
- Xing, G.; Mathews, N.; Lim, S.S.; Yantara, N.; Liu, X.; Sabba, D.; Grätzel, M.; Mhaisalkar, S.; Sum, T.C. Low-temperature solution-processed wavelength-tunable perovskites for lasing. Nat. Mater. 2014, 13, 476–480. [Google Scholar] [CrossRef]
- Dou, L.; Yang, Y.M.; You, J.; Hong, Z.; Chang, W.-H.; Li, G.; Yang, Y. Solution-processed hybrid perovskite photodetectors with high detectivity. Nat. Commun. 2014, 5, 5404. [Google Scholar] [CrossRef]
- Lin, Q.; Armin, A.; Burn, P.L.; Meredith, P. Filterless narrowband visible photodetectors. Nat. Photonics 2015, 9, 687–694. [Google Scholar] [CrossRef]
- Fang, Y.; Dong, Q.; Shao, Y.; Yuan, Y.; Huang, J. Highly narrowband perovskite single-crystal photodetectors enabled by surface-charge recombination. Nat. Photonics 2015, 9, 679–686. [Google Scholar] [CrossRef]
- Mei, J.; Liu, M.; Vivo, P.; Pecunia, V. Two-Dimensional Antimony-Based Perovskite-Inspired Materials for High-Performance Self-Powered Photodetectors. Adv. Funct. Mater. 2021, 31, 2106295. [Google Scholar] [CrossRef]
- Xie, L.; Hong, Z.; Zan, J.; Wu, Q.; Yang, Z.; Chen, X.; Ou, X.; Song, X.; He, Y.; Li, J. Broadband Detection of X-ray, Ultraviolet, and Near-Infrared Photons using Solution-Processed Perovskite–Lanthanide Nanotransducers. Adv. Mater. 2021, 33, 2101852. [Google Scholar] [CrossRef] [PubMed]
- Yakunin, S.; Sytnyk, M.; Kriegner, D.; Shrestha, S.; Richter, M.; Matt, G.J.; Azimi, H.; Brabec, C.J.; Stangl, J.; Kovalenko, M.V. Detection of X-ray photons by solution-processed lead halide perovskites. Nat. Photonics 2015, 9, 444–449. [Google Scholar] [CrossRef]
- Wei, H.; Fang, Y.; Mulligan, P.; Chuirazzi, W.; Fang, H.-H.; Wang, C.; Ecker, B.R.; Gao, Y.; Loi, M.A.; Cao, L. Sensitive X-ray detectors made of methylammonium lead tribromide perovskite single crystals. Nat. Photonics 2016, 10, 333–339. [Google Scholar] [CrossRef]
- Yakunin, S.; Dirin, D.N.; Shynkarenko, Y.; Morad, V.; Cherniukh, I.; Nazarenko, O.; Kreil, D.; Nauser, T.; Kovalenko, M.V. Detection of gamma photons using solution-grown single crystals of hybrid lead halide perovskites. Nat. Photonics 2016, 10, 585. [Google Scholar] [CrossRef]
- Dong, Q.; Fang, Y.; Shao, Y.; Mulligan, P.; Qiu, J.; Cao, L.; Huang, J. Electron-hole diffusion lengths > 175 μm in solution-grown CH3NH3PbI3 single crystals. Science 2015, 347, 967–970. [Google Scholar] [CrossRef]
- He, Y.; Matei, L.; Jung, H.J.; McCall, K.M.; Chen, M.; Stoumpos, C.C.; Liu, Z.; Peters, J.A.; Chung, D.Y.; Wessels, B.W. High spectral resolution of gamma-rays at room temperature by perovskite CsPbBr3 single crystals. Nat. Commun. 2018, 9, 1609. [Google Scholar] [CrossRef]
- Haynes, J.; Hornbeck, J. Trapping of minority carriers in silicon. II. n-type silicon. Phys. Rev. 1955, 100, 606. [Google Scholar] [CrossRef]
- Hornbeck, J.; Haynes, J. Trapping of minority carriers in silicon. I. P-type silicon. Phys. Rev. 1955, 97, 311. [Google Scholar] [CrossRef]
- Ayres, J. Characterization of trapping states in polycrystalline-silicon thin film transistors by deep level transient spectroscopy. J. Appl. Phys. 1993, 74, 1787–1792. [Google Scholar] [CrossRef]
- Capan, I.; Borjanović, V.; Pivac, B. Dislocation-related deep levels in carbon rich p-type polycrystalline silicon. Sol. Energy Mater. Sol. Cells 2007, 91, 931–937. [Google Scholar] [CrossRef]
- Balcioglu, A.; Ahrenkiel, R.; Hasoon, F. Deep-level impurities in CdTe/CdS thin-film solar cells. J. Appl. Phys. 2000, 88, 7175–7178. [Google Scholar] [CrossRef]
- Dirin, D.N.; Cherniukh, I.; Yakunin, S.; Shynkarenko, Y.; Kovalenko, M.V. Solution-grown CsPbBr3 perovskite single crystals for photon detection. Chem. Mater. 2016, 28, 8470–8474. [Google Scholar] [CrossRef] [PubMed]
- Qaid, S.M.; Ghaithan, H.M.; Al-Asbahi, B.A.; Aldwayyan, A.S. Ultra-Stable Polycrystalline CsPbBr3 Perovskite–Polymer Composite Thin Disk for Light-Emitting Applications. Nanomaterials 2020, 10, 2382. [Google Scholar] [CrossRef]
- He, Y.; Hadar, I.; De Siena, M.C.; Klepov, V.V.; Pan, L.; Chung, D.Y.; Kanatzidis, M.G. Sensitivity and Detection Limit of Spectroscopic-Grade Perovskite CsPbBr3 Crystal for Hard X-ray Detection. Adv. Funct. Mater. 2022, 2112925. [Google Scholar] [CrossRef]
- Rietveld, H.M. A profile refinement method for nuclear and magnetic structures. J. Appl. Crystallogr. 1969, 2, 65–71. [Google Scholar] [CrossRef]
- Hirotsu, S.; Harada, J.; Iizumi, M.; Gesi, K. Structural phase transitions in CsPbBr3. J. Phys. Soc. Jpn. 1974, 37, 1393–1398. [Google Scholar] [CrossRef]
- Rodová, M.; Brožek, J.; Knížek, K.; Nitsch, K. Phase transitions in ternary caesium lead bromide. J. Therm. Anal. Calorim. 2003, 71, 667–673. [Google Scholar] [CrossRef]
- Svirskas, Š.; Balčiūnas, S.; Šimėnas, M.; Usevičius, G.; Kinka, M.; Velička, M.; Kubicki, D.; Castillo, M.E.; Karabanov, A.; Shvartsman, V.V. Phase transitions, screening and dielectric response of CsPbBr3. J. Mater. Chem. A 2020, 8, 14015–14022. [Google Scholar] [CrossRef]
- Whitcher, T.; Gomes, L.; Zhao, D.; Bosman, M.; Chi, X.; Wang, Y.; Carvalho, A.; Hui, H.; Chang, Q.; Breese, M. Dual phases of crystalline and electronic structures in the nanocrystalline perovskite CsPbBr3. NPG Asia Mater. 2019, 11, 70. [Google Scholar] [CrossRef]
- Mayer, A.; Pourdavoud, N.; Doukkali, Z.; Brinkmann, K.; Rond, J.; Staabs, J.; Swertz, A.-C.; van gen Hassend, F.; Görrn, P.; Riedl, T. Upgrading of methylammonium lead halide perovskite layers by thermal imprint. Appl. Phys. A 2021, 127, 237. [Google Scholar] [CrossRef]
- Cardona, M.; Kremer, R.; Lauck, R.; Siegle, G.; Munoz, A.; Romero, A.; Schindler, A. Electronic, vibrational, and thermodynamic properties of ZnS with zinc-blende and rocksalt structure. Phys. Rev. B 2010, 81, 075207. [Google Scholar] [CrossRef]
- Kremer, R.; Cardona, M.; Schmitt, E.; Blumm, J.; Estreicher, S.; Sanati, M.; Bockowski, M.; Grzegory, I.; Suski, T.; Jezowski, A. Heat capacity of α−Ga N: Isotope effects. Phys. Rev. B 2005, 72, 075209. [Google Scholar] [CrossRef]
- Kovalsky, A.; Wang, L.; Marek, G.T.; Burda, C.; Dyck, J.S. Thermal conductivity of CH3NH3PbI3 and CsPbI3: Measuring the effect of the methylammonium ion on phonon scattering. J. Phys. Chem. C 2017, 121, 3228–3233. [Google Scholar] [CrossRef]
- Fong, C.; Dong, A.W.; Hill, A.J.; Boyd, B.J.; Drummond, C.J. Positron annihilation lifetime spectroscopy (PALS): A probe for molecular organisation in self-assembled biomimetic systems. Phys. Chem. Chem. Phys. 2015, 17, 17527–17540. [Google Scholar] [CrossRef]
- Saidaminov, M.I.; Haque, M.A.; Almutlaq, J.; Sarmah, S.; Miao, X.H.; Begum, R.; Zhumekenov, A.A.; Dursun, I.; Cho, N.; Murali, B. Inorganic lead halide perovskite single crystals: Phase-selective low-temperature growth, carrier transport properties, and self-powered photodetection. Adv. Opt. Mater. 2017, 5, 1600704. [Google Scholar] [CrossRef]
- Kumar, M.; Pawar, V.; Jha, P.A.; Gupta, S.; Sinha, A.; Jha, P.K.; Singh, P. Thermo-optical correlation for room temperature synthesis: Cold-sintered lead halides. J. Mater. Sci. Mater. Electron. 2019, 30, 6071–6081. [Google Scholar] [CrossRef]
- Zhao, Z.; Zhong, M.; Zhou, W.; Peng, Y.; Yin, Y.; Tang, D.; Zou, B. Simultaneous Triplet Exciton–Phonon and Exciton–Photon Photoluminescence in the Individual Weak Confinement CsPbBr3 Micro/Nanowires. J. Phys. Chem. C 2019, 123, 25349–25358. [Google Scholar] [CrossRef]
- Yaffe, O.; Guo, Y.; Tan, L.Z.; Egger, D.A.; Hull, T.; Stoumpos, C.C.; Zheng, F.; Heinz, T.F.; Kronik, L.; Kanatzidis, M.G. Local polar fluctuations in lead halide perovskite crystals. Phys. Rev. Lett. 2017, 118, 136001. [Google Scholar] [CrossRef]
- Lao, X.; Yang, Z.; Su, Z.; Bao, Y.; Zhang, J.; Wang, X.; Cui, X.; Wang, M.; Yao, X.; Xu, S. Anomalous Temperature-Dependent Exciton–Phonon Coupling in Cesium Lead Bromide Perovskite Nanosheets. J. Phys. Chem. C 2019, 123, 5128–5135. [Google Scholar] [CrossRef]
- Stadler, W.; Hofmann, D.; Alt, H.; Muschik, T.; Meyer, B.; Weigel, E.; Müller-Vogt, G.; Salk, M.; Rupp, E.; Benz, K. Optical investigations of defects in Cd1−xZnxTe. Phys. Rev. B 1995, 51, 10619. [Google Scholar] [CrossRef] [PubMed]
- Lao, X.; Yang, Z.; Su, Z.; Wang, Z.; Ye, H.; Wang, M.; Yao, X.; Xu, S. Luminescence and thermal behaviors of free and trapped excitons in cesium lead halide perovskite nanosheets. Nanoscale 2018, 10, 9949–9956. [Google Scholar] [CrossRef] [PubMed]
- Li, X.; Wu, Y.; Zhang, S.; Cai, B.; Gu, Y.; Song, J.; Zeng, H. CsPbX3 quantum dots for lighting and displays: Room-temperature synthesis, photoluminescence superiorities, underlying origins and white light-emitting diodes. Adv. Funct. Mater. 2016, 26, 2435–2445. [Google Scholar] [CrossRef]
Publisher’s Note: MDPI stays neutral with regard to jurisdictional claims in published maps and institutional affiliations. |
© 2022 by the authors. Licensee MDPI, Basel, Switzerland. This article is an open access article distributed under the terms and conditions of the Creative Commons Attribution (CC BY) license (https://creativecommons.org/licenses/by/4.0/).