
New Dinitrophenyl Hydrazones as Colorimetric Probes for Anions


Centre of Chemistry, University of Minho, Campus de Gualtar, 4710-057 Braga, Portugal
*
Authors to whom correspondence should be addressed.
†
These authors contributed equally to this work.
Chemosensors 2022, 10(10), 384; https://doi.org/10.3390/chemosensors10100384
Submission received: 22 August 2022
/
Revised: 8 September 2022
/
Accepted: 20 September 2022
/
Published: 23 September 2022
(This article belongs to the Collection Sensing Materials: Advances in Synthesis, Functionalities, and Applications)
Abstract
:Anion sensing is a dynamic research field due to the biological and environmental importance of some organic or inorganic anions. Hydrazones show promising properties in the design of anion chemosensors due to the presence of proton donor and acceptor sites in their structure. In this work, two novel dinitrophenyl hydrazones, functionalized with a quinoline moiety, were synthesized and characterized by spectroscopic and spectrometric techniques. The interaction between the new compounds 3a–b with different organic and inorganic anions was assessed. The two compounds showed a change in color from light yellow to magenta in the presence of H2PO4−, CH3COO−, BzO−, CN−, and F−. The interactions were analyzed by spectrophotometric titrations and the stoichiometry of the interaction was assessed by the method of continuous variation. Compound 3b showed a remarkable sensitivity to CN−, with a limit of detection of 0.35 µM. The interaction of compound 3b with CN− and F− was also analyzed by 1H NMR titrations, showing that an increasing concentration of anions induce a deprotonation of the NH and OH groups.
1. Introduction
Colorimetric optical sensing is a desirable feature in the chemosensing field. Colorimetric optical sensors are used worldwide in simple and well-known devices such as pregnancy or glucose tests [1,2]. This class of sensors show some upper advantages compared to other sensor types, such as low-cost and selectivity [3]. Even though the sensibility is not as high as in fluorimetric sensors, they show a major benefit: the possibility of “naked eye” detection [3,4].
With the large number of available chromophores together with the simple methodology required, this type of sensing is attractive to develop straightforward methods for fast and simple detection of several analytes [5,6]. While most of the detection methods require sampling and laboratory analysis, which can be expensive and time consuming, a colorimetric chemosensor allows easy, on-site detection [7,8]. The design of organic chemosensors containing binding sites capable of sensing anions and cations is an interesting and promising field within the chemosensing area.
Anion sensing is particularly important due to the role that some anions (such as fluoride or cyanide) can have on biological and environmental systems [8,9,10,11,12,13,14]. For instance, cyanide is acutely toxic to mammals by all routes of administration, affecting cardiovascular, respiratory, and central nervous systems [14]. This anion’s toxicity from smoke inhalation and the potential use of cyanide as a weapon of terrorism turn this analyte into one of the most relevant targets [14]. The European Union has a limit of 50 µg L−1 for cyanide in drinking waters, and the maximum concentration allowed in mineral waters is 70 µg L−1 [14].
Anions are generally challenging targets due to the wide range of sizes and shapes they can have [15,16]. The design of a chemosensor for anion sensing usually involves a binding site capable of establish several non-covalent interactions, such as hydrogen bonding, electrostatic interactions, metal coordination, halogen bonding, and anion–π interactions [17,18].
Schiff bases are particularly known for their interesting chemosensing properties [5,8,19]. Aryl-substituted Schiff bases are more stable and easier to synthesize due to their effective conjugation compared to alkyl-substituted Schiff bases [8,20]. Within this group, hydrazones are considered as both proton-donor and proton-acceptor moieties, which are promising structural characteristics in the design of chemosensors [21,22,23,24,25,26,27]. Besides, the C=N–N triatomic structure has nucleophilic imine and amino-type (more reactive) nitrogens, an imine carbon that has both an electrophilic and nucleophilic character, configurational isomerism stemming from the intrinsic nature of the C=N double bond, and, in most cases, an acidic NH [28]. The latter property is crucial in basic anion sensing.
The combination of the sensing characteristics of hydrazones with conjugated heterocyclic groups can be important in the development of an anion colorimetric sensor. The distance between HOMO and LUMO establishes the maximum absorption wavelength of the molecule, and the more conjugated the molecule, the lower the gap is between these two orbitals and the longer is the wavelength [4]. Quinoline is a type of heterocycle that can serve to functionalize hydrazones, in order to add electron density to the molecule and an extra heteroatom (nitrogen), which can be involved in the interaction with the analytes.
This work reports the synthesis of two new dinitrophenyl hydrazones, based on a quinoline moiety. The synthesized compounds were characterized by the usual spectroscopic and spectrometric techniques. The interaction in an acetonitrile (ACN) solution between the two novel compounds and several anions was tested. Spectrophotometric titrations were performed to assess the extension of the interaction. NMR titrations were also conducted to assess the binding site of the molecules involved in the interaction. One of the compounds synthesized showed a remarkable sensitivity to CN-, with a limit of detection (LOD) of 0.35 µM. This value is below the European Union limit, both for drinking and mineral waters, namely, 1.92 and 2.69 µM, respectively. The two compounds synthesized are also sensitive to other anions, with LODs in the range of µM, based on its basicity. The sensitivity obtained is higher for CN-, the most basic anion of the group of tested anions.
2. Experimental Section
2.1. Materials
Melting points were measured on a Stuart SMP3 melting-point apparatus. TLC analysis was carried out on 0.20 mm-thick precoated silica plates (Macherey-Nagel), and spots were observed under UV light on a CN-15 camera (Vilber Lourmat). Infrared spectra were obtained on a PerkinElmer Spectrum Two instrument with ATR accessory, in the 450–4000 cm−1 range with 32 scans. The solid compound was applied directly on the ATR crystal, with pressure applied with the incorporated press. UV-Vis absorption spectra (200–700 nm) were obtained using a Shimadzu UV/3101PC spectrophotometer and fluorescence spectra with a Fluoromax-4 spectrofluorometer. NMR spectra were obtained on a Bruker Avance III 400 at an operating frequency of 400 MHz for 1H and 100.6 MHz for 13C, using the solvent peak as internal reference, at 25 °C. All chemical shifts are given in ppm, using δH Me4Si = 0 ppm as the reference, and J values are given in Hz. Assignments were supported by spin decoupling–double resonance and bidimensional heteronuclear correlation techniques. All commercial reagents and solvents were used as received.
2.2. General Procedure for the Synthesis of Heterocyclic Quinoline-Based Hydrazones
Equal amounts (0.318 mmol) of the hydrazine and the appropriate aldehyde were dissolved in 10 mL of MeOH at room temperature. The reaction mixture was stirred for 8–10 h. The precipitated solid was filtered and dried in the oven at 40 °C overnight. No additional purification was required.
2.2.1. 2-((2-(2,4-Dinitrophenyl)hydrazineylidene)methyl)quinoline 3a
Yellow solid (88%). Mp: 251 °C. 1H NMR (DMSO-d6, 400 MHz): δ = 7.63 (dt, J = 7.6 and 1.2 Hz, 1H, H6′), 7.79 (dt, J = 7.6 and 1.2 Hz, 1H, H7′), 7.99 (dd, J = 8.0 and 1.2 Hz, 1H, H5′), 8.04 (dd, J = 8.4 and 0.4 Hz, 1H, H8′), 8.18–8.22 (m, 2H, H6 + H3′), 8.38–8.42 (m, 2H, H5 + H4′), 8.78 (s, 1H, N=CH), 8.86 (d, J = 2.4 Hz, 1H, H3), 11.76 (s, 1H, NH) ppm. 13C NMR (DMSO-d6, 100.6 MHz): δ = 116.9 (C6), 117.5 (C3′), 122.3 (C3), 127.0 (C6′), 127.6 (C5′), 127.6 (C4a’), 128.7 (C8′), 129.2 (C5), 129.7 (C7′), 130.4 (C2), 136.3 (C4′), 137.8 (C4), 143.9 (C1), 147.2 (C8a’), 148.6 (N=CH), 153.0 (C2′) ppm. IR (solid): ν 3278, 3169, 3107, 3007, 2147, 1969, 1944, 1836, 1619, 1613, 1584, 1546, 1522, 1503, 1460, 1431, 1375, 1337, 1322, 1309, 1280, 1270, 1244, 1223, 1144, 1096, 1058, 996, 962, 945, 916, 878, 859, 844, 834, 827, 791, 770, 759, 742, 714, 682, 637, 620, 599, 527, 513, 482 cm−1. HRMS: (ESI, positive mode) m/z for C16H11N5O4, calcd 336.0738; found 336.0746.
2.2.2. 2-((2-(2,4-Dinitrophenyl)hydrazineylidene)methyl)quinolin-8-ol 3b
Yellow solid (95%). Mp: 298 °C. 1H NMR (DMSO-d6, 400 MHz): δ = 7.14 (dd, J = 7.2 and 1.2 Hz, 1H, H7′), 7.45 (m, 2H, H5′ + H6′), 8.23 (d, J = 8.8 Hz, 1H, H3′), 8.24 (d, J = 10 Hz, 1H, H6), 8.36 (d, J = 8.4 Hz, 1H, H4′), 8.41 (dd, J = 9.6 and 2.8 Hz, 1H, H5), 8.82 (s, 1H, N=CH), 8.87 (d, J = 2.8 Hz, 1H, H3), 9.89 (s, 1H, OH), 11.95 (s, 1H, NH) ppm. 13C NMR (DMSO-d6, 100.6 MHz): δ = 112.3 (C7′), 117.3 (C6), 117.9 (C5′), 118.1 (C3′), 122.9 (C3), 128.6 (C6′), 128.9 (C4a′), 129.8 (C5), 130.5 (C2), 136.7 (C4′), 137.8 (C4), 138.3 (C8a′), 144.4 (C1), 148.4 (N=CH), 151.3 (C2′), 153.5 (C8′) ppm. IR (solid): ν 3417, 3285, 3107, 2249, 2162, 1982, 1619, 1605, 1583, 1562, 1547, 1520, 1505, 1462, 1429, 1393, 1378, 1336, 1323, 1278, 1237, 1200, 1169, 1143, 1136, 1100, 1057, 1044, 975, 940, 925, 916, 883, 851, 834, 763, 741, 721, 714, 693, 684, 637, 590, 570, 535, 524, 507, 484, 461 cm−1. HRMS: (ESI, positive mode) m/z for C16H11N5O5, calcd 352.0687; found 352.0692.
2.3. Chemosensing Studies
In the preliminary studies, 50 equivalents (equiv.) of each ion (50 µL, 1 × 10⁻¹ M in ACN) were added to an ACN solution of each compound (1 mL, 1 × 10⁻⁴ M). The assessment of the color/fluorescence changes was evaluated by “naked eye” and in a UV-vis chamber under ultraviolet light at 365 nm. All anions were in the form of hydrated tetrabutylammonium salts and solutions were prepared in UV-grade ACN. Spectrophotometric titrations were performed when a relevant optical response was observed. To an ACN solution of each compound (3 mL, 1 × 10⁻⁵ M), a sequential addition of each ion (10−2–10−3 M) was performed, and the absorbance spectra was collected, until the absorption plateau was reached. NMR titrations were performed by a similar sequential addition of each ion to a DMSO-d6 solution of the compound. Job plots were obtained by the addition of different molar ratios of 10−4 M solutions of the compounds and the corresponding ion. Limit of detection (LOD) and limit of quantification (LOQ) were calculated with the slope of the calibration curve, using 10 different analyses [29].
3. Results and Discussion
3.1. Synthesis of Heterocyclic Quinoline-Based Hydrazones
The new quinoline-based hydrazones 3a–b were synthesized by reaction of (2,4-dinitrophenyl)hydrazine 1 with quinoline-2-carbaldehyde 2a and 8-hydroxyquinoline-2-carbaldehyde 2b, respectively, in methanol at room temperature for 8–10 h (vide Scheme 1). The resulting solids were then filtered, and the pure compounds were isolated with yields of 88% and 95%, respectively, and characterized by the usual spectroscopic techniques.
The 1H NMR spectra of compound 3b shows the signal for hydrazone NH at 11.76 ppm, OH signal at 9.89 ppm, and the imine N=CH at 8.82 ppm. Besides, the protons from the quinoline moiety appear at 7.14 (H7′), 7.45 (H5′ + H6′), 8.23 (H3′), and 8.36 (H4′) ppm. Dinitrophenyl protons appear at higher chemical shifts, due to the deshielding effect caused by the NO2 groups: 8.24 (H6), 8.41 (H5), and 8.87 (H3) ppm. In the spectra of 3a, the main difference is the presence of H8’ at 8.04 ppm. The remaining quinoline protons appear at 7.63 (H6′), 7.79 (H7′), and 7.99 (H5′) ppm. H3′ and H4′ appear in the multiplet signals together with H6 and H5 from the dinitrophenyl groups, at 8.18–8.22 and 8.38–8.42 ppm. The imine N=CH appears at 8.78 ppm, as well as hydrazone NH at 11.76, similarly to 3b. 13C RMN spectra of 3b reveal a downfield shift of C8′ (153.5 ppm), when compared with the spectra of 3a (128.7 ppm), due to the presence of the -OH group. FTIR spectra of compound 3b also shows the OH bending vibration at 1393 cm−1.
The two compounds were dissolved in ACN (1 × 10⁻⁵ M) for the photophysical characterization, resulting in a light-yellow solution in both cases. UV/Vis spectra of the two compounds are similar, with a maximum absorption wavelength (λabs) of 379 nm for hydrazone 3a and 385 for hydrazone 3b. The logarithm of the molar attenuation coefficient (log ε) values were found to be 4.51 and 4.46, respectively.
3.2. Preliminary Chemosensory Tests
Evaluation of the new 2,4-dinitrophenylhydrazones 3a–b, as potential anion colorimetric/fluorimetric chemosensors, was carried out by performing preliminary sensory tests in ACN in the presence of analytically relevant organic and inorganic anions (H2PO4−, CH3COO−, NO3−, ClO4−, HSO4−, BzO−, Br−, CN−, I−, and F−). Preliminary tests were carried out by addition of 50 equiv. of each ion to the solutions of compounds 3a–b. For the two compounds, a change in color from light-yellow to magenta was visible upon interaction with several anions, namely, H2PO4−, CH3COO−, BzO−, CN−, and F− (vide Figure 1). The two compounds were also tested with different cations, with no significant optical response.
3.3. Spectrophotometric Titrations
The interaction between the two compounds 3a–b with the five anions (H2PO4−, CH3COO−, BzO−, CN−, and F−), which resulted in a color change, was analyzed by spectrophotometric titrations. To 3 mL of a 10−5 M ACN solution of each compound, successive amounts of each anion were added until a plateau was reached. Figure 2, Figure 3, Figure 4, Figure 5 and Figure 6 show the spectrophotometric titrations for compound 3b (3a showed similar results), as well as the Job’s plot for the determination of stoichiometry by the method of continuous variation.
The behavior of compound 3b in the presence of the five anions is similar. The main band in the visible zone (385 nm) reduces intensity upon sequential addition of each ion, while a new band at 520 nm is formed. Job’s plots show the stoichiometry of each interaction, which changes from one anion to another, but is similar for compounds 3a–b. The sensitivity of the hydrazones towards the five anions is high, being necessary between 1 to 10 equiv. of the anion to achieve the maximal optical change. It can be observed that compound 3b showed higher sensitivity to CN− and the interaction with H2PO4− and BzO− required a higher number of equiv. to reach the absorption plateau. The LOD and the LOQ for the interaction between the two hydrazones and the five anions were calculated through the slope of the linear zone of each absorbance vs. the number of equiv. graphs. The results are shown in Table 1.
The tested hydrazones show a remarkable sensitivity to CN-, with a LOD of 0.35 µM (0.035 equiv.) for compound 3b and 0.58 µM (0.058 equiv.) for compound 3a. These values are very promising, since we placed the two probes at the highest sensitivity for colorimetric probes for this anion, according to the literature [11,12,13,14,15,30,31,32,33]. The two compounds also show an LOD around 1 µM for F- and CH3COO-. H2PO4- and BzO- show higher detection limits, between 2.27 and 3.22 µM, for the two compounds. BzO- is the only anion to which compound 3a is more sensitive than 3b, although the LOD is still higher when compared to the other anions.
These results indicate that the anion sensing ability of hydrazones 3a–b may be related to the basicity of each anion, which would cause deprotonation of the NH group [32]. CN- is by far the anion in this group with the highest Kb, and the sensitivity to this anion is significantly higher. Cyanide has the ability to form a very weak acid with H+ (HCN, pKa = 9.1 in water) [32], and is believed to cause deprotonation of this type of compound. This is also correlated with the fact that the anions that do not show an optical change (NO3−, ClO4−, HSO4−, Br−, and I−) are the ones with a pKa lower than 1. On the other hand, F− (pKa = 3.14), CH3COO− (pKa = 4.75), H2PO4− (pKa = 7.21), and BzO− (pKa = 4.19) show significantly higher pKa values and show colorimetric changes in the presence of hydrazone 3a–b, which correlates to the hypothesis of optical changes based on deprotonation of the NH group.
3.4. NMR Titrations
The sensitivity of 3b for CN- and F-, as observed with the spectrophotometric titrations, was complemented by performing 1H NMR titrations, to study the binding mode between the hydrazone and the anions and investigate whether deprotonation of the molecule occur. Due to the limited solubility of 3b in deuterated ACN, the study was carried out in DMSO-d6.
Figure 7 shows the spectra for the NMR titration of compound 3b with CN−. The compound’s original spectrum shows NH at 11.76 ppm and OH at 9.89 ppm. It can be observed that 0.025 equiv. of CN- can induce a partial deprotonation of the two groups, due to the basicity of the ion. The imine N=CH and the protons from the dinitrophenyl group (H3, H5, and H6) move to lower chemical shift, due to the shielding effect caused by the deprotonation. The increased electron density, delocalized through the conjugated system, causing the shielding effect, is potentiated by the electron acceptor character of the nitro groups. With the addition of higher amounts of CN−, this change becomes clearer: with 0.1 equiv. of CN−, NH and OH totally disappear, and the upfield shift of the other signals is significant. Quinoline protons H3′, H4′, H5′, H6′, and H7′ signals remain similar to the original spectrum.
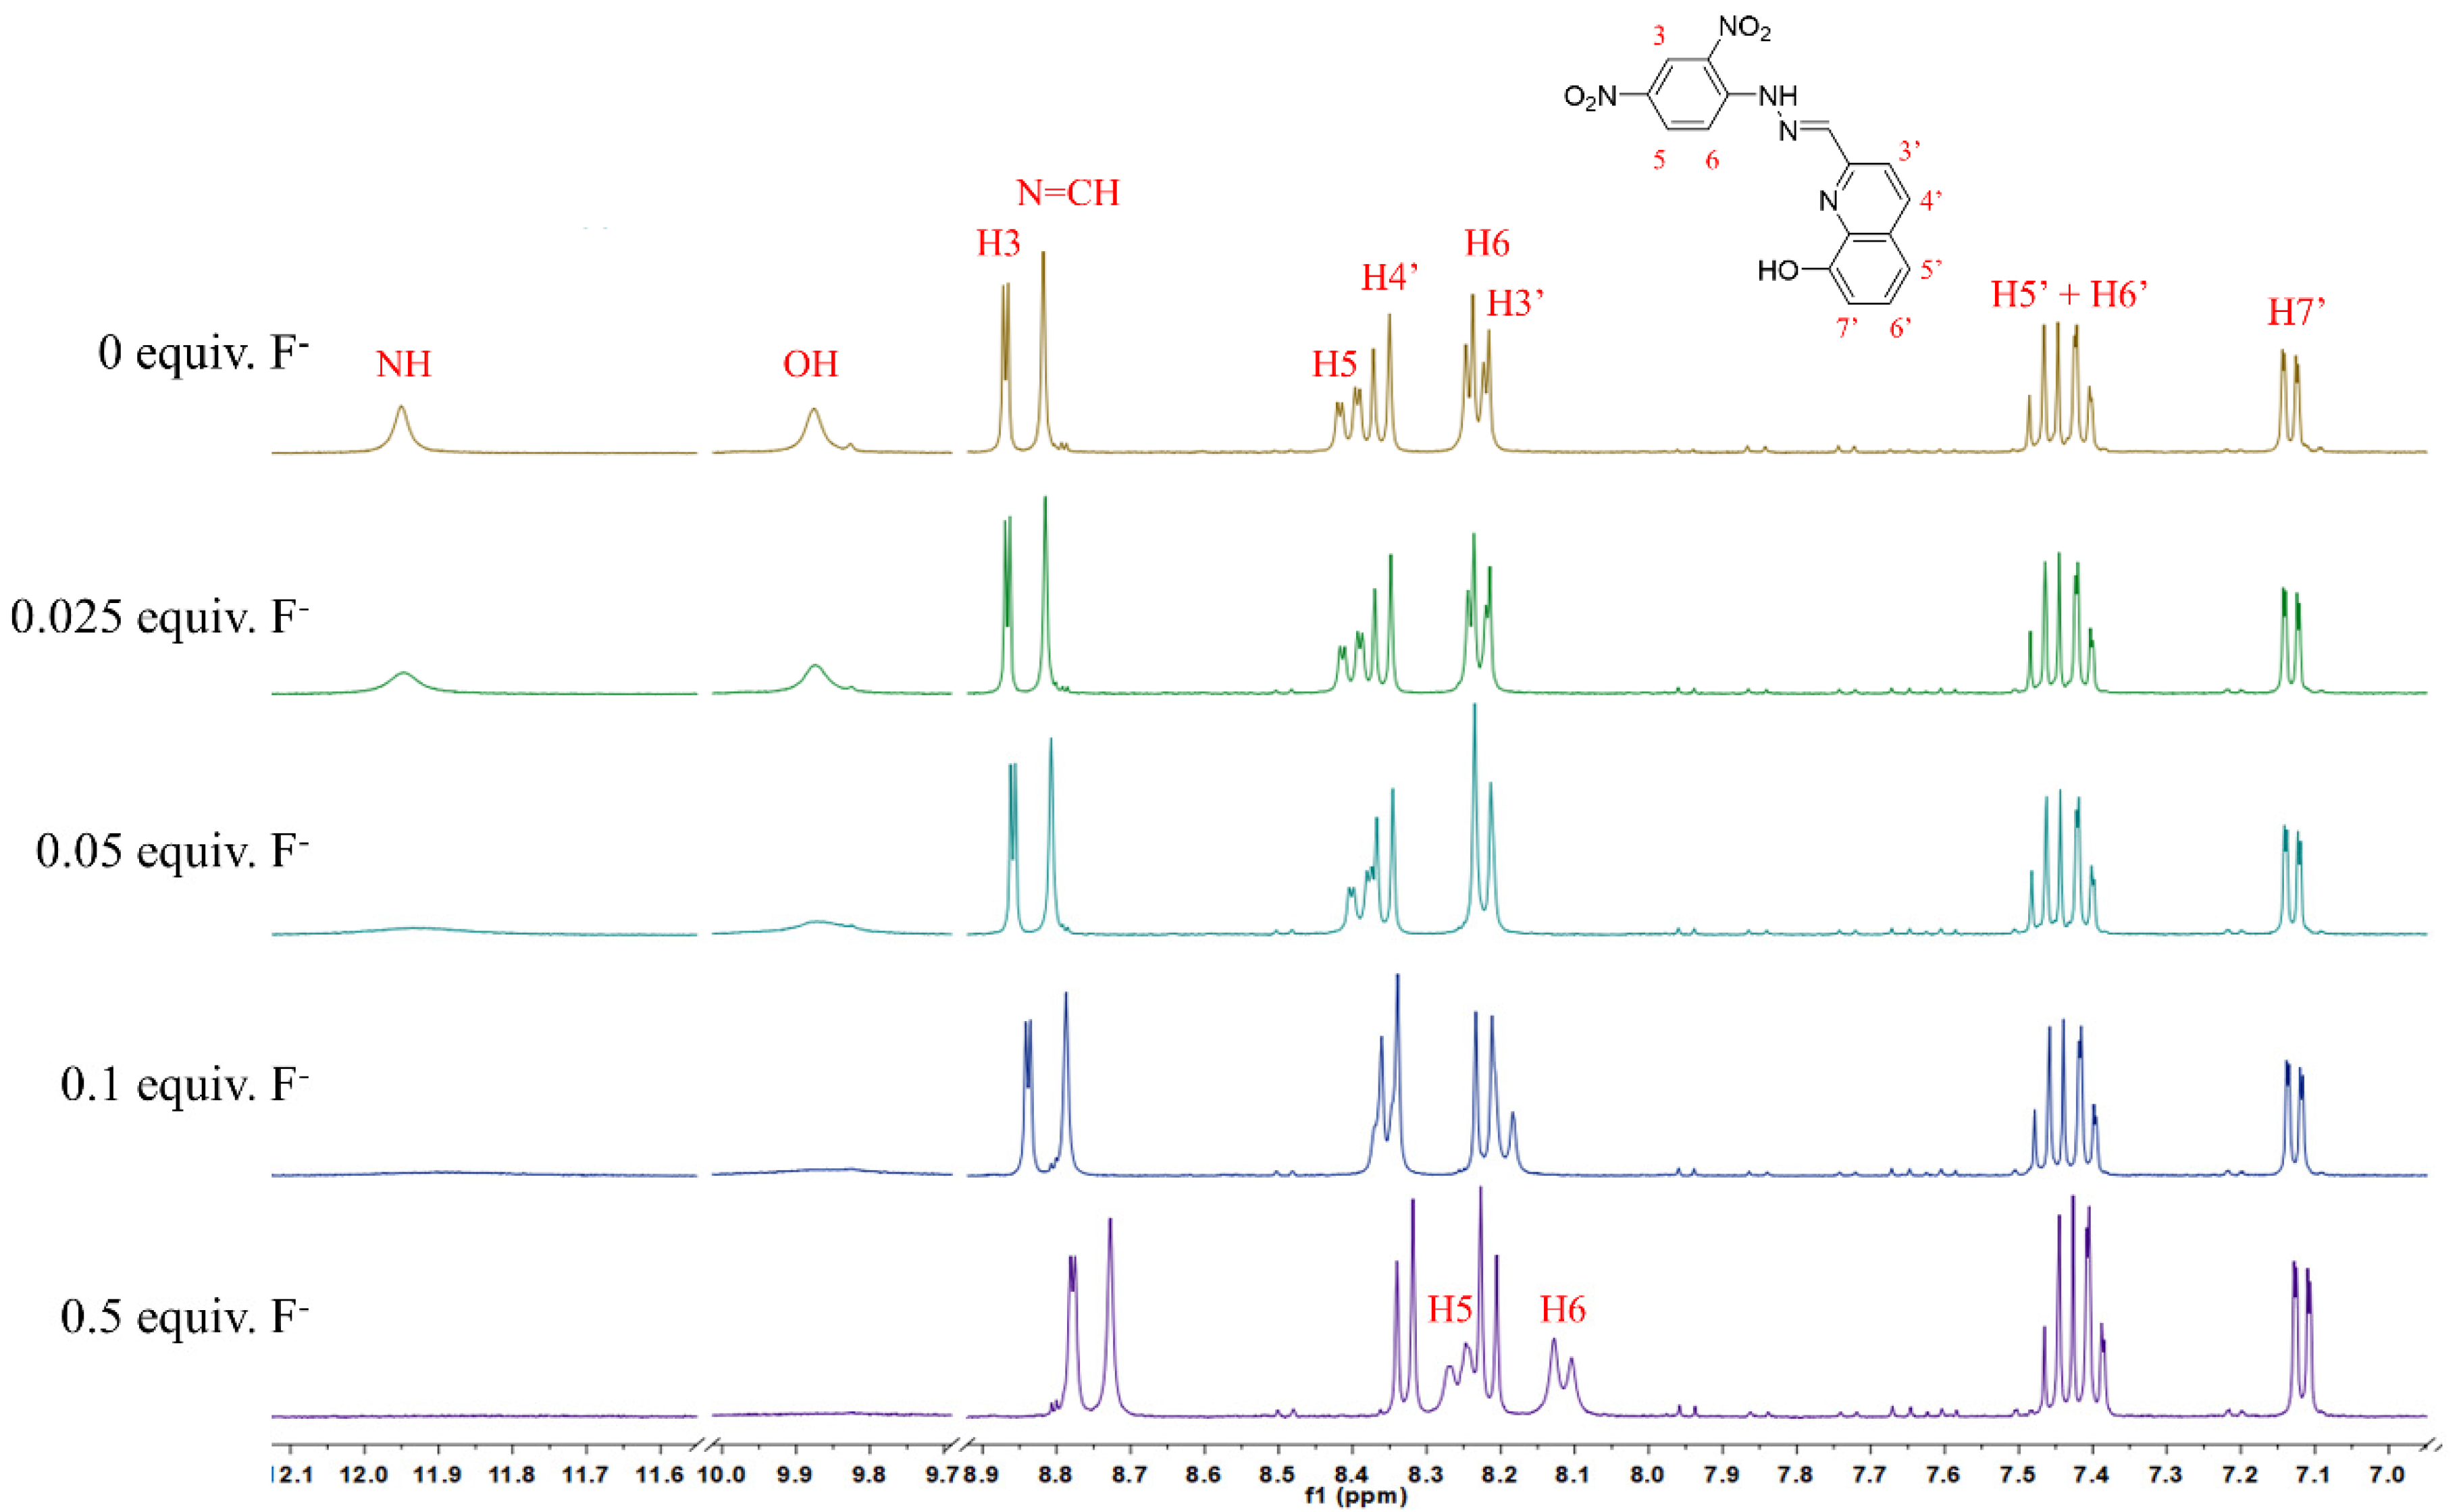
Figure 8 shows the spectra for the NMR titration of compound 3b with F−. The interaction is very similar to the interaction with CN−, although the sensitivity is lower. This is in accordance with the lower basicity of fluoride. A total of 0.5 equiv. of F- are needed to achieve a similar effect to the one caused by 0.1 equiv. of CN−. Similar upfield shifts occurred for the imine N=CH and H3, H5, and H6, and quinoline protons H3′, H4′, H5′, H6′, and H7′ also remained similar to the original spectrum.
4. Conclusions
This work reports the synthesis and characterization of two novel quinoline-based dinitrophenyl hydrazones, 3a–b. The two compounds were showed to be sensitive to different anions, namely, H2PO4−, CH3COO−, BzO−, CN−, and F−, and the interaction in ACN solutions was tested by spectrophotometric titrations. The stoichiometry of the interactions was assessed by the method of continuous variation. Compound 3b showed a remarkable sensitivity to CN−, with a LOD of 0.35 µM. This value is below the EU limit, both for drinking and mineral water (50 and 70 µg L−1, respectively, equaling to 1.92 and 2.69 µM). The two compounds are also sensitive for the other anions (LODs in the range of µM), based on its basicity. 1H NMR titrations were performed to assess the binding site of the molecules, for the interaction between 3b and CN− and F−, which showed that increasing concentrations of the anion induce deprotonation of both NH and OH. Sensitivity is higher for CN−, the most basic anion of the group of tested anions.
Author Contributions
Conceptualization: M.M.M.R. and S.P.G.C.; formal analysis: R.P.C.L.S., S.P.G.C. and M.M.M.R.; funding acquisition: S.P.G.C., R.B.F. and M.M.M.R.; methodology: S.P.G.C. and M.M.M.R.; investigation: R.P.C.L.S.; writing—original draft preparation: R.P.C.L.S., S.P.G.C. and M.M.M.R.; writing—review and editing: R.P.C.L.S., S.P.G.C., R.B.F. and M.M.M.R.; project administration: S.P.G.C., R.B.F. and M.M.M.R.; resources: S.P.G.C., R.B.F. and M.M.M.R.; supervision: S.P.G.C., R.B.F. and M.M.M.R. All authors have read and agreed to the published version of the manuscript.
Funding
Thanks are due to Fundação para a Ciência e Tecnologia (FCT) and FEDER (European Fund for Regional Development)-COMPETE-QRENEU for financial support through the Chemistry Research Centre of the University of Minho (Ref. CQ/UM (UID/QUI/00686/2020)), and a PhD grant to R.P.C.L.S. (SFRH/BD/145639/2019). The NMR spectrometer Bruker Avance III 400 is part of the National NMR Network (PTNMR) and was financially partially supported by Infrastructure Project No. 022161 (co-financed by FEDER through COMPETE 2020, POCI and PORL, and FCT through PIDDAC).
Institutional Review Board Statement
Not applicable.
Informed Consent Statement
Not applicable.
Data Availability Statement
Not applicable.
Conflicts of Interest
The authors declare no conflict of interest.
References
- Blake, A.; Mclean, V. A Calorimetric Consumption Assay for the Measurement by Cultured Ceils of D-Glucose. Anal. Biochem. 1989, 177, 156–160. [Google Scholar] [CrossRef]
- Chang, C.C.; Chen, C.Y.; Chen, C.P.; Lin, C.W. Facile colorimetric detection of human chorionic gonadotropin based on the peptide-induced aggregation of gold nanoparticles. Anal. Methods 2015, 7, 29–33. [Google Scholar] [CrossRef]
- Kaur, B.; Kaur, N.; Kumar, S. Colorimetric metal ion sensors—A comprehensive review of the years 2011–2016. Coord. Chem. Rev. 2018, 358, 13–69. [Google Scholar] [CrossRef]
- Wang, B.; Anslyn, E. Colorimetric sensor design. In Chemosensors: Principles, Strategies, and Applications; Wiley: Hobokan, NJ, USA, 2011; pp. 275–295. [Google Scholar]
- Berhanu, A.L.; Gaurav; Mohiuddin, I.; Malik, A.K.; Aulakh, J.S.; Kumar, V.; Kim, K.H. A review of the applications of Schiff bases as optical chemical sensors. TrAC—Trends Anal. Chem. 2019, 116, 74–91. [Google Scholar] [CrossRef]
- McDonagh, C.; Burke, C.S.; MacCraith, B.D. Optical chemical sensors. Chem. Rev. 2008, 108, 400–422. [Google Scholar] [CrossRef]
- Sousa, R.P.C.L.; Figueira, R.B.; Costa, S.P.G.; Raposo, M.M. Optical fiber sensors for biocide monitoring: Examples, transduction materials, and prospects. ACS Sens. 2020, 5, 3678–3709. [Google Scholar] [CrossRef]
- Junaid, H.M.; Batool, M.; Harun, F.W.; Akhter, M.S.; Shabbir, N. Naked Eye Chemosensing of Anions by Schiff Bases. Crit. Rev. Anal. Chem. 2020, 52, 463–480. [Google Scholar] [CrossRef]
- Gale, P.A.; Caltagirone, C. Fluorescent and colorimetric sensors for anionic species. Coord. Chem. Rev. 2018, 354, 2–27. [Google Scholar] [CrossRef]
- Jali, B.R.; Barick, A.K.; Mohapatra, P.; Sahoo, S.K. A comprehensive review on quinones based fluoride selective colorimetric and fluorescence chemosensors. J. Fluor. Chem. 2021, 244, 109744. [Google Scholar] [CrossRef]
- Udhayakumari, D. Chromogenic and fluorogenic chemosensors for lethal cyanide ion. A comprehensive review of the year 2016. Sens. Actuators B Chem. 2018, 259, 1022–1057. [Google Scholar] [CrossRef]
- Wang, F.; Wang, L.; Chen, X.; Yoon, J. Recent progress in the development of fluorometric and colorimetric chemosensors for detection of cyanide ions. Chem. Soc. Rev. 2014, 43, 4312–4324. [Google Scholar] [CrossRef] [PubMed]
- Xu, Z.; Chen, X.; Kim, H.N.; Yoon, J. Sensors for the optical detection of cyanide ion. Chem. Soc. Rev. 2009, 39, 127–137. [Google Scholar] [CrossRef] [PubMed]
- Ma, J.; Dasgupta, P.K. Recent developments in cyanide detection: A review. Anal. Chim. Acta 2010, 673, 117–125. [Google Scholar] [CrossRef] [PubMed]
- Aldrey, A.; Núñez, C.; García, V.; Bastida, R.; Lodeiro, C.; MacÍas, A. Anion sensing properties of new colorimetric chemosensors based on macrocyclic ligands bearing three nitrophenylurea groups. Tetrahedron 2010, 66, 9223–9230. [Google Scholar] [CrossRef]
- Pal, A.; Karmakar, M.; Bhatta, S.R.; Thakur, A. A detailed insight into anion sensing based on intramolecular charge transfer (ICT) mechanism: A comprehensive review of the years 2016 to 2021. Coord. Chem. Rev. 2021, 448, 214167. [Google Scholar] [CrossRef]
- Tay, H.M.; Beer, P. Optical sensing of anions by macrocyclic and interlocked hosts. Org. Biomol. Chem. 2021, 19, 4652–4677. [Google Scholar] [CrossRef]
- McNaughton, D.A.; Fares, M.; Picci, G.; Gale, P.A.; Caltagirone, C. Advances in fluorescent and colorimetric sensors for anionic species. Coord. Chem. Rev. 2021, 427, 213573. [Google Scholar] [CrossRef]
- Jali, B.R.; Baruah, J.B. Recent progress in Schiff bases in detections of fluoride ions. Dyes Pigm. 2021, 194, 109575. [Google Scholar] [CrossRef]
- El-Sherif, A.A.; Aljahdali, M.S. Review: Protonation, complex-formation equilibria, and metal–ligand interaction of salicylaldehyde Schiff bases. J. Coord. Chem. 2013, 66, 3423–3468. [Google Scholar] [CrossRef]
- Jabeen, M. A comprehensive review on analytical applications of hydrazone derivatives. J. Turk. Chem. Soc. Sect. A Chem. 2022, 9, 663–698. [Google Scholar] [CrossRef]
- Yang, Y.; Gao, C.Y.; Liu, J.; Dong, D. Recent developments in rhodamine salicylidene hydrazone chemosensors. Anal. Methods 2016, 8, 2863–2871. [Google Scholar] [CrossRef]
- Khattab, T.A.; Gaffer, H.E. Synthesis and application of novel tricyanofuran hydrazone dyes as sensors for detection of microbes. Color. Technol. 2016, 132, 460–465. [Google Scholar] [CrossRef]
- Farshbaf, S.; Anzenbacher, P. Fluorimetric sensing of ATP in water by an imidazolium hydrazone based sensor. Chem. Commun. 2019, 55, 1770–1773. [Google Scholar] [CrossRef]
- Wu, W.N.; Wu, H.; Wang, Y.; Mao, X.J.; Liu, B.Z.; Zhao, X.L.; Xu, Z.Q.; Fan, Y.C.; Xu, Z.H. A simple hydrazone as a multianalyte (Cu2+, Al3+, Zn2+) sensor at different pH values and the resultant Al3+ complex as a sensor for F−. RSC Adv. 2018, 8, 5640–5646. [Google Scholar] [CrossRef] [PubMed]
- Chen, W.; Liang, H.; Wen, X.; Li, Z.; Xiong, H.; Tian, Q.; Yan, M.; Tan, Y.; Royal, G. Synchronous colorimetric determination of CN−, F−, and H2PO4− based on structural manipulation of hydrazone sensors. Inorg. Chim. Acta 2022, 532, 120760. [Google Scholar] [CrossRef]
- Xu, H.; Wang, X.; Zhang, C.; Wu, Y.; Liu, Z. Coumarin-hydrazone based high selective fluorescence sensor for copper(II) detection in aqueous solution. Inorg. Chem. Commun. 2013, 34, 8–11. [Google Scholar] [CrossRef]
- Su, X.; Aprahamian, I. Hydrazone-based switches, metallo-assemblies and sensors. Chem. Soc. Rev. 2014, 43, 1963–1981. [Google Scholar] [CrossRef]
- Thomsen, V.; Schatzlein, D.; Mercuro, D. Limits of detection in spectroscopy. Spectroscopy 2003, 18, 103. [Google Scholar]
- Batista, R.M.F.; Costa, S.P.G.; Raposo, M.M.M. Naphthyl-imidazo-anthraquinones as novel colorimetric and fluorimetric chemosensors for ion sensing. J. Photochem. Photobiol. A Chem. 2013, 259, 33–40. [Google Scholar] [CrossRef]
- Batista, R.M.F.; Costa, S.P.G.; Raposo, M.M.M. Selective colorimetric and fluorimetric detection of cyanide in aqueous solution using novel heterocyclic imidazo-anthraquinones. Sens. Actuators B Chem. 2014, 191, 791–799. [Google Scholar] [CrossRef]
- Cao, J.; Wang, X.M. An investigation of the deprotonation of hydrazone-based receptors on interaction with anion: Develop a colorimetric system distinguishing cyanide from anions. Tetrahedron 2013, 69, 10267–10271. [Google Scholar] [CrossRef]
- Batista, R.M.F.; Oliveira, E.; Costa, S.P.G.; Lodeiro, C.; Raposo, M.M.M. Cyanide and fluoride colorimetric sensing by novel imidazo-anthraquinones functionalised with indole and carbazole. Supramol. Chem. 2014, 26, 71–80. [Google Scholar] [CrossRef]
Scheme 1.
Synthesis of the quinoline-based hydrazones 3a–b.
Figure 1.
Preliminary chemosensory tests of compounds 3a–b upon interaction with different anions.

Figure 2.
Photophysical interaction between compound 3b and CN− (1 equiv. of CN− required for maximum absorbance). Left—spectrophotometric titration of compound 3b with CN−; Top right—absorbance at 520 nm as a function of added ion equiv.; Bottom right—Job’s plot for the interaction (stoichiometry 3b 1:3 CN−).
Figure 3.
Photophysical interaction between compound 3b and F− (5 equiv. of F− required for maximum absorbance). Left—spectrophotometric titration of compound 3b with F−; Top right—absorbance at 520 nm as a function of added ion equiv.; Bottom right—Job’s plot for the interaction (stoichiometry 3b 2:1 F−).
Figure 4.
Photophysical interaction between compound 3b and BzO− (8 equiv. of BzO− required for maximum absorbance). Left—spectrophotometric titration of compound 3b with BzO−; Top right—absorbance at 520 nm as a function of added ion equiv.; Bottom right—Job’s plot for the interaction (stoichiometry 3b 1:1 BzO−).
Figure 5.
Photophysical interaction between compound 3b and CH3COO− (4 equiv. of CH3COO− required for maximum absorbance). Left—spectrophotometric titration of compound 3b with CH3COO−; Top right—absorbance at 520 nm as a function of added ion equiv.; Bottom right—Job’s plot for the interaction (stoichiometry 3b 1:1 CH3COO−).
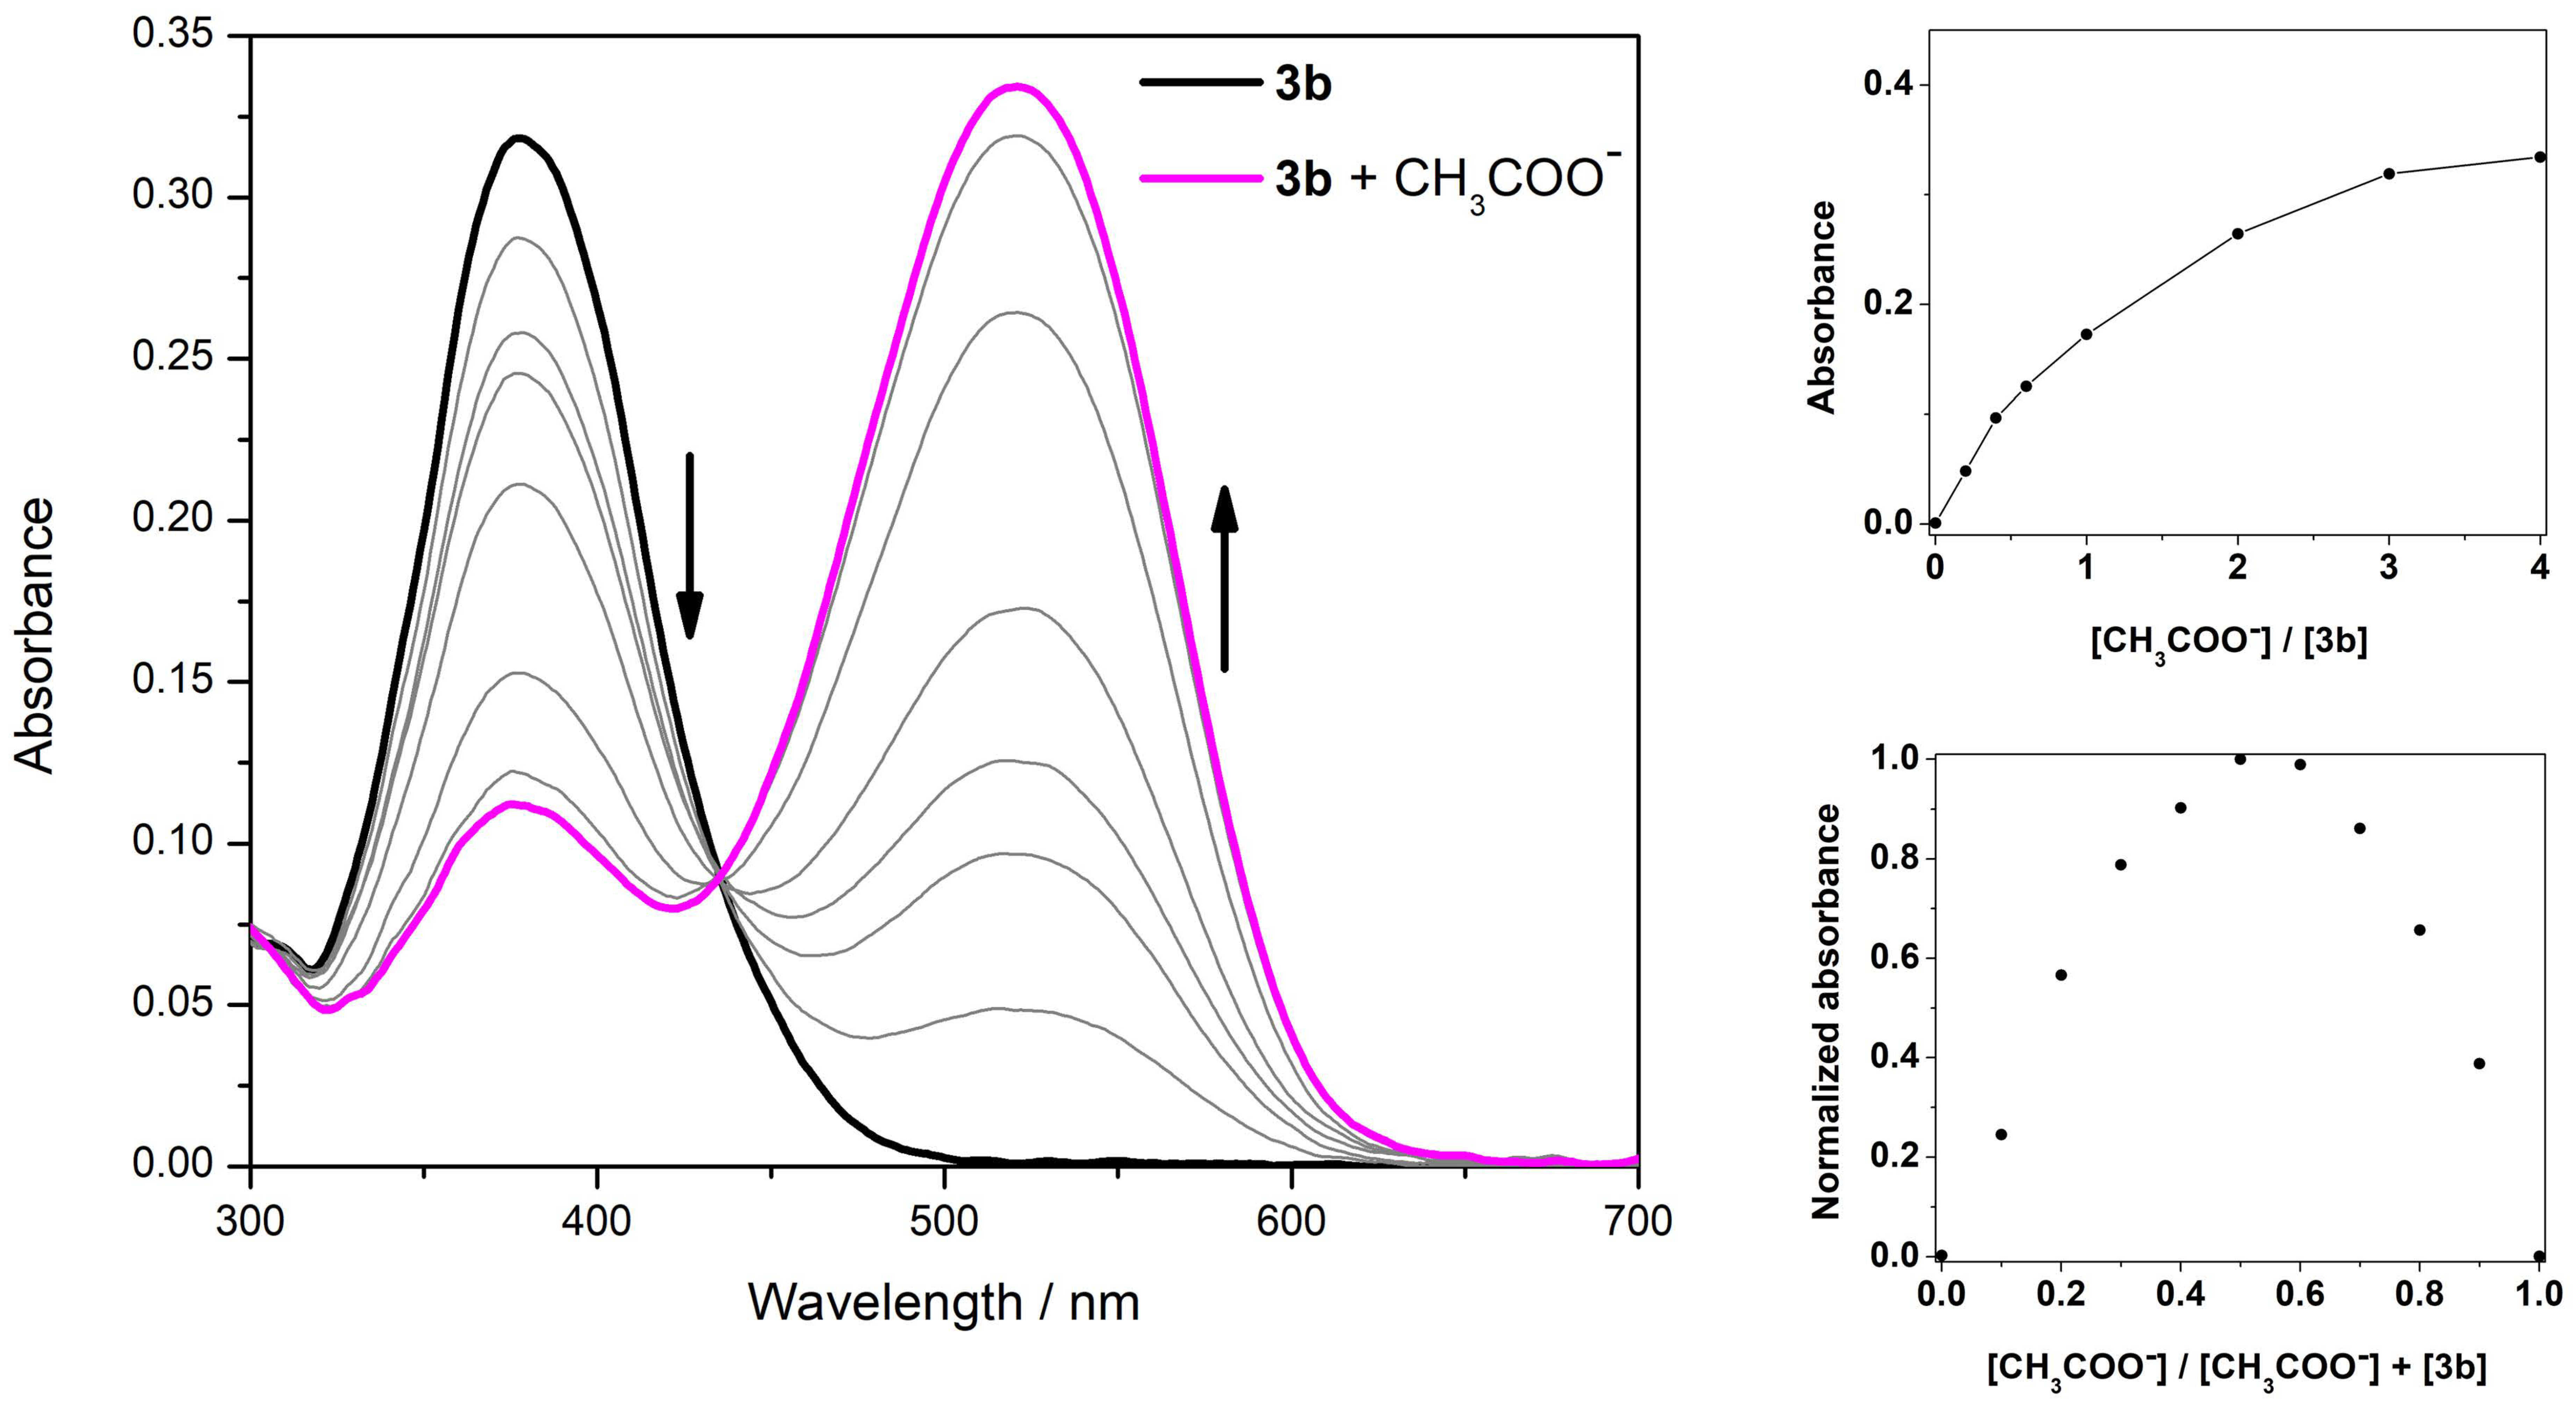
Figure 6.
Photophysical interaction between compound 3b and H2PO4− (9 equiv. of H2PO4− required for maximum absorbance). Left—spectrophotometric titration of compound 3b with H2PO4−; Top right—absorbance at 520 nm as a function of added ion equiv.; Bottom right—Job’s plot for the interaction (stoichiometry 3b 1:2 H2PO4−).

Figure 7.
NMR titration of compound 3b with CN− in DMSO-d6.

Figure 8.
NMR titration of compound 3b with F− in DMSO-d6.

Table 1.
LOD and LOQ of compounds 3a–b for the five anions in ACN.
| Compound | CN− | F− | H2PO4− | BzO− | CH3COO− | |
|---|---|---|---|---|---|---|
| LOD (µM) | 3a | 0.58 | 1.35 | 3.03 | 3.13 | 1.20 |
| 3b | 0.35 | 1.21 | 2.27 | 3.22 | 0.90 | |
| LOQ (µM) | 3a | 1.92 | 4.45 | 9.99 | 10.33 | 3.96 |
| 3b | 1.17 | 3.99 | 7.48 | 10.63 | 2.97 |
Publisher’s Note: MDPI stays neutral with regard to jurisdictional claims in published maps and institutional affiliations. |
© 2022 by the authors. Licensee MDPI, Basel, Switzerland. This article is an open access article distributed under the terms and conditions of the Creative Commons Attribution (CC BY) license (https://creativecommons.org/licenses/by/4.0/).
Share and Cite
MDPI and ACS Style
Sousa, R.P.C.L.; Costa, S.P.G.; Figueira, R.B.; Raposo, M.M.M. New Dinitrophenyl Hydrazones as Colorimetric Probes for Anions. Chemosensors 2022, 10, 384. https://doi.org/10.3390/chemosensors10100384
AMA Style
Sousa RPCL, Costa SPG, Figueira RB, Raposo MMM. New Dinitrophenyl Hydrazones as Colorimetric Probes for Anions. Chemosensors. 2022; 10(10):384. https://doi.org/10.3390/chemosensors10100384
Chicago/Turabian StyleSousa, Rui P. C. L., Susana P. G. Costa, Rita B. Figueira, and M. Manuela M. Raposo. 2022. "New Dinitrophenyl Hydrazones as Colorimetric Probes for Anions" Chemosensors 10, no. 10: 384. https://doi.org/10.3390/chemosensors10100384
Note that from the first issue of 2016, this journal uses article numbers instead of page numbers. See further details here.