
Highly Photostable and pH−Sensitive Nanosensors


Abstract
:1. Introduction
2. Materials and Methods
2.1. Reagents and Instruments
2.2. Preparation of the Ratiometric pH Nanosensors
2.2.1. Preparation of pHI−Silane
2.2.2. Preparation of pHD−Silane
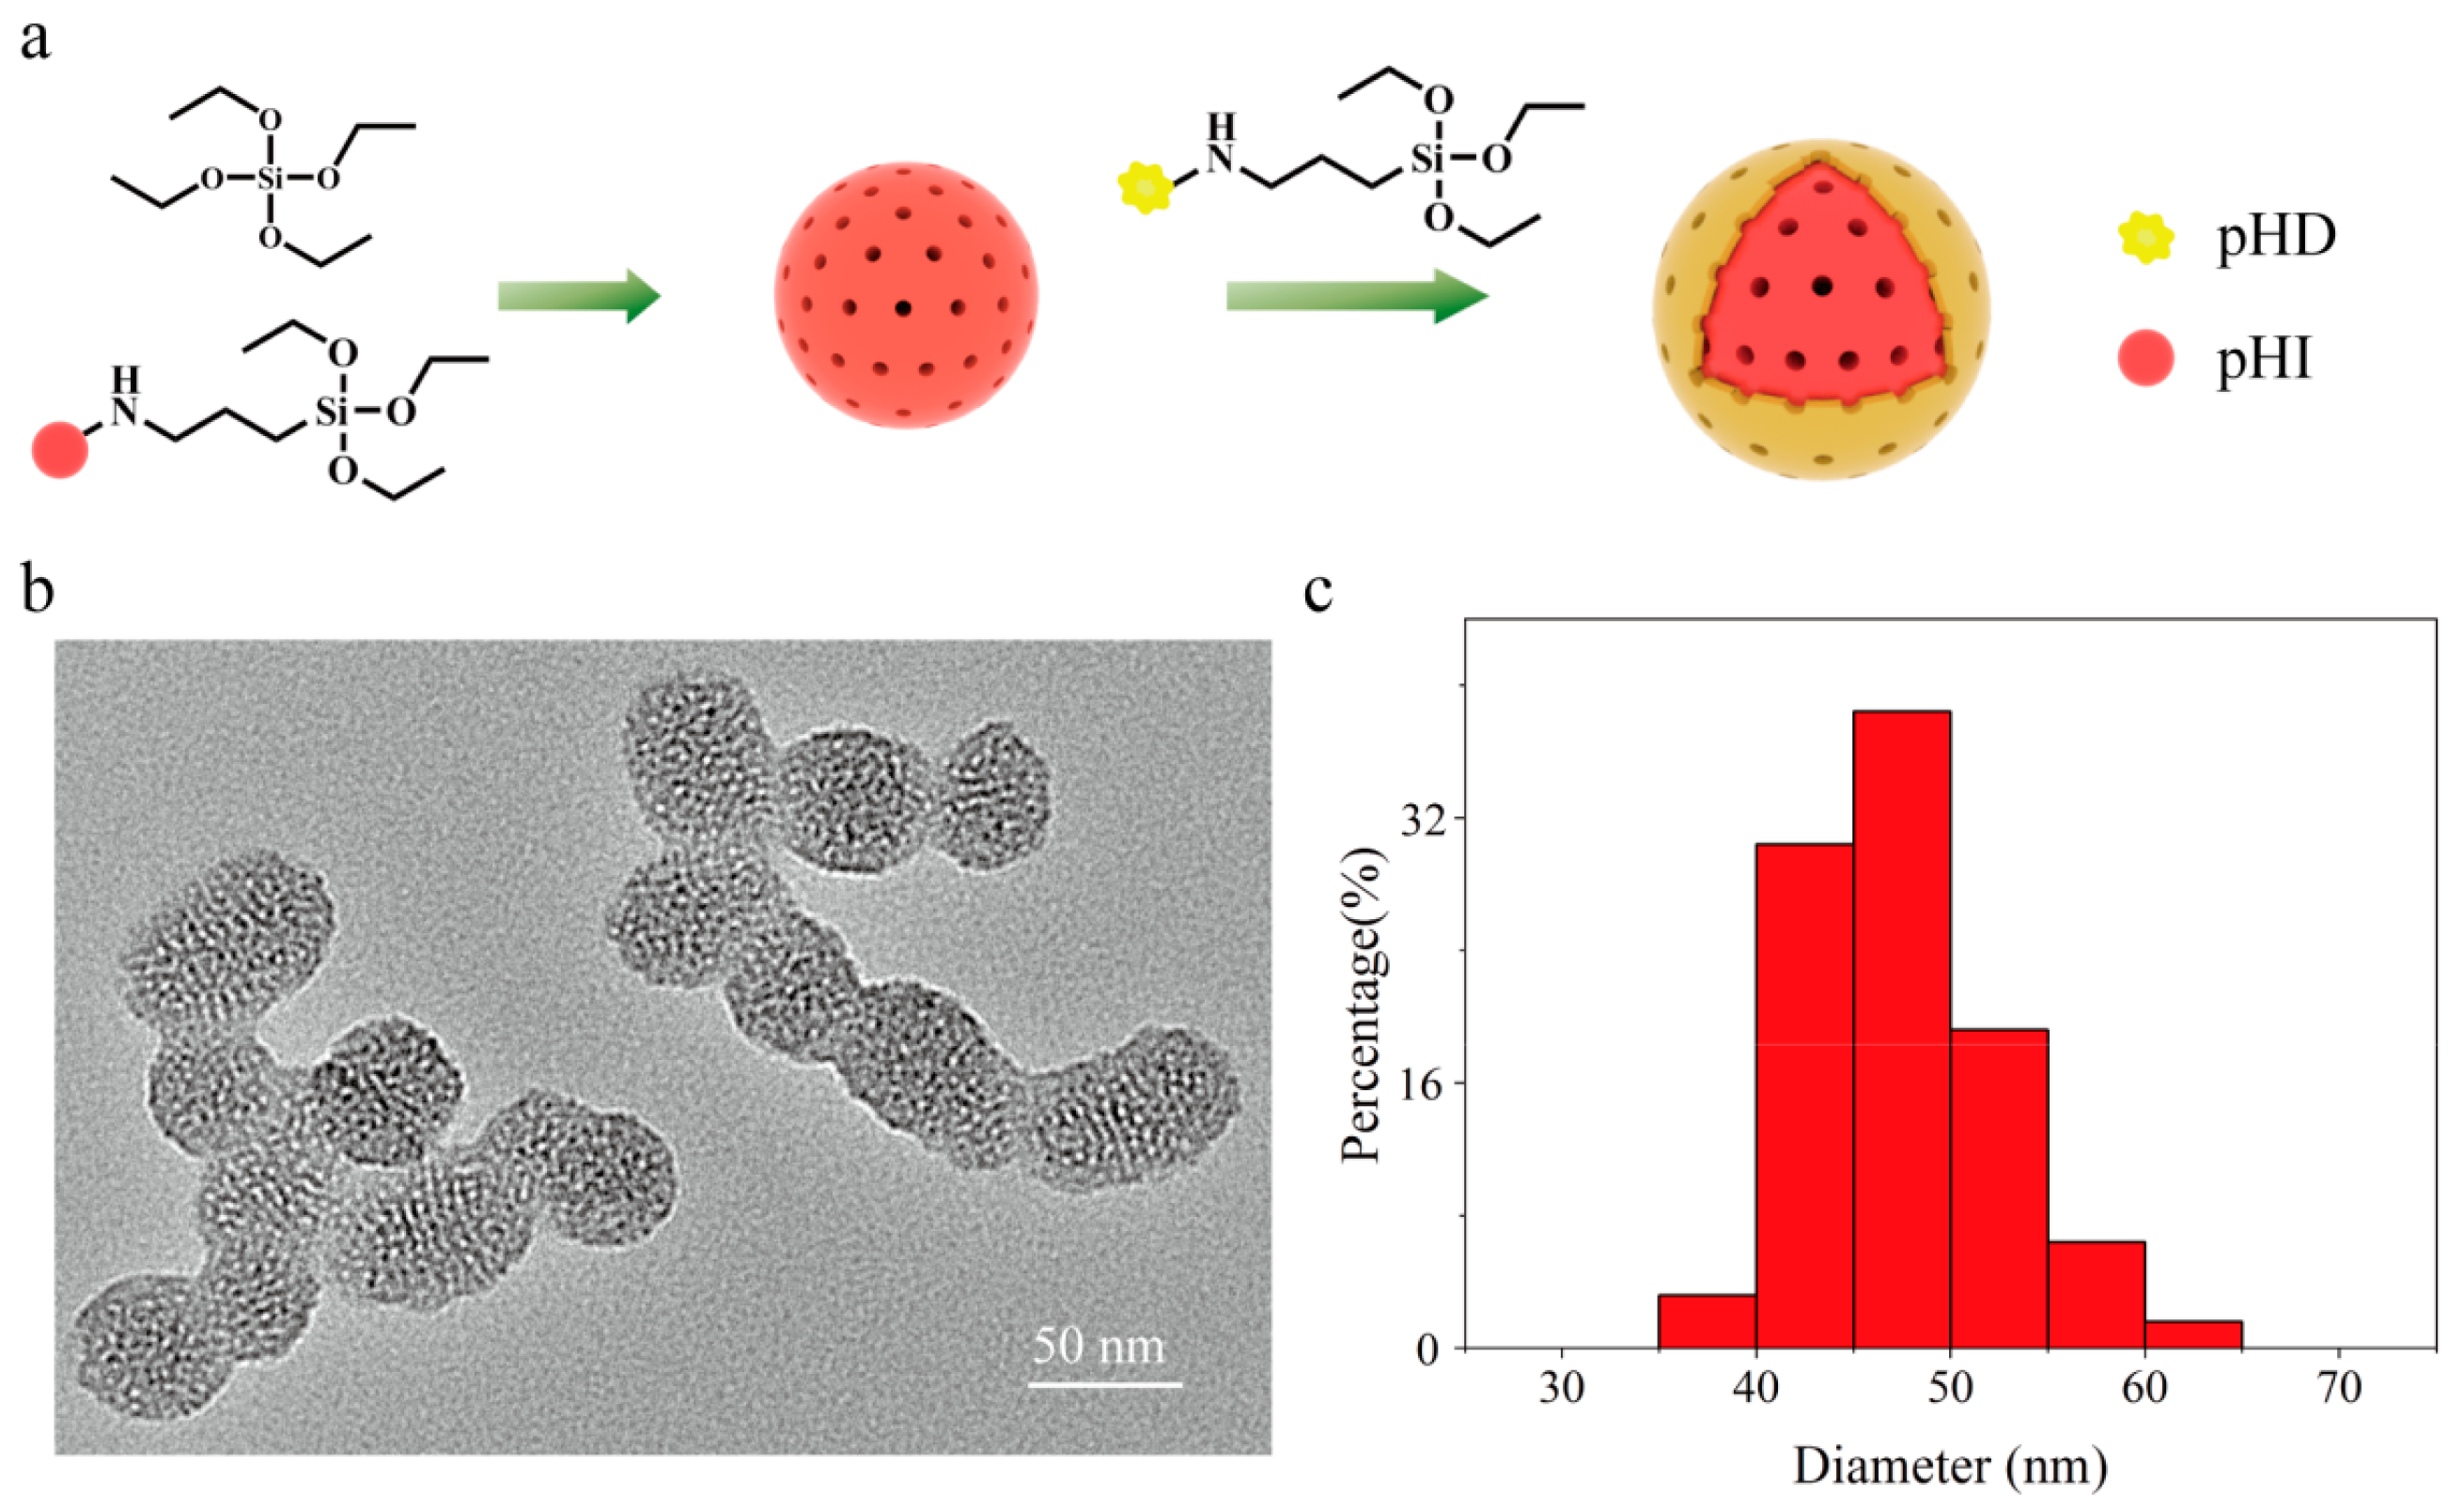
2.2.3. Immobilizing pHI Inside Mesoporous Silica Nanoparticles (mSiNPs)
2.2.4. Immobilizing pHD on the Surface of mSiNPs
2.2.5. In Vitro Fluorescence Measurement
2.2.6. Analysis of the pH Response
3. Results
4. Conclusions
Supplementary Materials
Author Contributions
Funding
Institutional Review Board Statement
Informed Consent Statement
Data Availability Statement
Conflicts of Interest
References
- Khan, M.I.; Mukherjee, K.; Shoukat, R.; Dong, H. A review on pH sensitive materials for sensors and detection methods. Microsyst. Technol. 2017, 23, 4391–4404. [Google Scholar] [CrossRef]
- Steinegger, A.; Wolfbeis, O.S.; Borisov, S.M. Optical sensing and imaging of pH values: Spectroscopies, materials, and applications. Chem. Rev. 2020, 120, 12357–12489. [Google Scholar] [CrossRef] [PubMed]
- Zhang, Y.L.; Ding, L.J.; Zhang, W.; Zhang, X.A.; Lian, Y.; Wang, X.D. A background—subtraction strategy leads to ratiometric sensing of oxygen without recalibration. Analyst 2018, 143, 5120–5126. [Google Scholar] [CrossRef]
- Zhang, Z.J.; Seitz, W.R. A fluorescence sensor for quantifying pH in the range from 6.5 to 8.5. Anal. Chim. Acta. 1984, 160, 47–55. [Google Scholar] [CrossRef]
- Parker, J.W.; Laksin, O.; Yu, C.; Lau, M.L.; Klima, S.; Fisher, R.; Scott, I.; Atwater, B.W. Fiberoptic sensors for pH and carbon−dioxide using a self−referencing dye. Anal. Chem. 1993, 65, 2329–2334. [Google Scholar] [CrossRef]
- Miesenbock, G.; De Angelis, D.A.; Rothman, J.E. Visualizing secretion and synaptic transmission with pH−sensitive green fluorescent proteins. Nature 1998, 394, 192–195. [Google Scholar] [CrossRef] [PubMed]
- Beneto, A.J.; Thiagarajan, V.; Siva, A. A tunable ratiometric pH sensor based on phenanthro[9,10−d]imidazole covalently linked with vinylpyridine. RSC Adv. 2015, 5, 67849–67852. [Google Scholar] [CrossRef]
- Bishnoi, S.; Milton, M.D. Tunable phenothiazine hydrazones as color displaying, ratiometric and reversible pH sensors. Tetrahedron Lett. 2015, 56, 6633–6638. [Google Scholar] [CrossRef]
- Chen, Y.; Zhu, C.; Cen, J.; Bai, Y.; He, W.; Guo, Z. Ratiometric detection of pH fluctuation in mitochondria with a new fluorescein/cyanine hybrid sensor. Chem. Sci. 2015, 6, 3187–3194. [Google Scholar] [CrossRef]
- Lee, M.H.; Han, J.H.; Lee, J.H.; Park, N.; Kumar, R.; Kang, C.; Kim, J.S. Two−color probe to monitor a wide range of pH values in cells. Angew. Chem. Int. Ed. 2013, 52, 6206–6209. [Google Scholar] [CrossRef]
- Vasylevska, A.S.; Karasyov, A.A.; Borisov, S.M.; Krause, C. Novel coumarin−based fluorescent pH indicators, probes and membranes covering a broad pH range. Anal. Bioanal. Chem. 2007, 387, 2131–2141. [Google Scholar] [CrossRef] [PubMed]
- Shi, P.; Liu, Z.; Dong, K.; Ju, E.; Ren, J.; Du, Y.; Li, Z.; Qu, X. A smart “Sense−Act−Treat” system. Combining a ratiometric pH sensor with a near infrared therapeutic gold nanocage. Adv. Mater. 2014, 26, 6635–6641. [Google Scholar] [CrossRef] [PubMed]
- Peng, J.F.; He, X.X.; Wang, K.M.; Tan, W.H.; Wang, Y.; Liu, Y. Noninvasive monitoring of intracellular pH change induced by drug stimulation using silica nanoparticle sensors. Anal. Bioanal. Chem. 2007, 388, 645–654. [Google Scholar] [CrossRef] [PubMed]
- Hu, F.; Huang, Y.X.; Xiao, Y.S.; Li, Y.C.; Luo, X.; Qian, X.H.; Yang, Y.J. A dual−channel Hill−type small−molecule pH probe. Anal. Methods 2021, 13, 3012–3016. [Google Scholar] [CrossRef]
- Chen, W.; Xu, S.; Day, J.J.; Wang, D.F.; Xian, M. A general strategy for development of near−Infrared fluorescent probes for bioimaging. Angew. Chem. Int. Ed. 2017, 56, 16611–16615. [Google Scholar] [CrossRef]
- Fulaz, S.; Hiebner, D.; Barros, C.H.N.; Devlin, H.; Vitale, S.; Quinn, L.; Casey, E. Ratiometric imaging of the in situ pH distribution of biofilms by use of fluorescent mesoporous silica nanosensors. ACS Appl. Mater. Interfaces 2019, 11, 32679–32688. [Google Scholar] [CrossRef]
- Vuppu, S.; Kostov, Y.; Rao, G. Economical wireless optical ratiometric pH sensor. Meas. Sci. Technol. 2009, 20, 045202. [Google Scholar] [CrossRef]
- Bizzarri, R.; Arcangeli, C.; Arosio, D.; Ricci, F.; Faraci, P.; Cardarelli, F.; Beltram, F. Development of a novel GFP−based ratiometric excitation and emission pH indicator for intracellular studies. Biophys. J. 2006, 90, 3300–3314. [Google Scholar] [CrossRef]
- Bizzarri, R.; Serresi, M.; Luin, S.; Beltram, F. Green fluorescent protein based pH indicators for in vivo use: A review. Anal. Bioanal. Chem. 2009, 393, 1107–1122. [Google Scholar] [CrossRef]
- Hiruta, Y.; Yoshizawa, N.; Citterio, D.; Suzuki, K. Highly durable double sol−gel layer ratiometric fluorescent pH optode based on the combination of two types of quantum dots and absorbing pH indicators. Anal. Chem. 2012, 84, 10650–10656. [Google Scholar] [CrossRef]
- Somers, R.C.; Lanning, R.M.; Snee, P.T.; Greytak, A.B.; Jain, R.K.; Bawendi, M.G.; Nocera, D.G. A nanocrystal−based ratiometric pH sensor for natural pH ranges. Chem. Sci. 2012, 3, 2980–2985. [Google Scholar] [CrossRef] [PubMed]
- Marin, M.J.; Galindo, F.; Thomas, P.; Russell, D.A. Localized intracellular pH measurement using a ratiometric photoinduced electron−transfer−based nanosensor. Angew. Chem. Int. Ed. 2012, 51, 9657–9661. [Google Scholar] [CrossRef] [PubMed]
- Paek, K.; Chung, S.; Cho, C.-H.; Kim, B.J. Fluorescent and pH−responsive diblock copolymer−coated core−shell CdSe/ZnS particles for a color−displaying, ratiometric pH sensor. Chem. Commun. 2011, 47, 10272–10274. [Google Scholar] [CrossRef] [PubMed]
- Dennis, A.M.; Bao, G. Quantum dot−fluorescent protein pair as ratiometric pH sensor. Proc. SPIE 2010, 7575, 45–53. [Google Scholar] [CrossRef]
- Peng, H.S.; Stolwijk, J.A.; Sun, L.N.; Wegener, J.; Wolfbeis, O.S. A nanogel for ratiometric fluorescent sensing of intracellular pH values. Angew. Chem. Int. Ed. 2010, 49, 4246–4249. [Google Scholar] [CrossRef] [PubMed]
- Dennis, A.M.; Rhee, W.J.; Sotto, D.; Dublin, S.N.; Bao, G. Quantum dot−fluorescent protein FRET probes for sensing intracellular pH. ACS Nano 2012, 6, 2917–2924. [Google Scholar] [CrossRef]
- Liang, Y.H.; Deng, R.R.; Gao, Y.K.; Qin, Y.; Liu, X.L. Measuring absorption coefficient spectrum (400–900 nm) of copper ions in water. J. Remote Sens. 2016, 20, 27–34. [Google Scholar] [CrossRef]
- Deng, R.R.; Liang, Y.H.; Gao, Y.K.; Qin, Y.K.; Lin, X.L. Measuring absorption coefficient spectrum (400–900 nm) of hydrated and complex ferric ion in water. J. Remote Sens. 2016, 20, 35–44. [Google Scholar] [CrossRef]
- GB 8978−1996; Integrated Wastewater Discharge Standard of China. Ministry of Environmental Protection of the People’s Republic of China: Beijing, China, 1996.


| Entry | λem 1 | λem 2 | λex | Intensity Ratio | pH Range | Ref |
|---|---|---|---|---|---|---|
| 1 | 525 nm (QDs) | 605 nm (QDs) | 400 nm | 1.5 | 0.2−1.23 | [20] |
| 2 | 530 nm (SNARF) | 630 nm (CdSe/ZnS QDs) | 365 nm | 3.1 | 6−8 | [21] |
| 3 | 421 nm (anthracene) | 580 nm (rhodamine) | 364 nm | 4.1 | 3.73−8.11 | [22] |
| 4 | 470 nm (PyMMP) | 630 nm (CdSe/ZnS QDs) | 365 nm | 5.4 | 1−5 | [23] |
| 5 | 520 nm (ITK carboxyl QDs) | 560 nm (mOrange) | 400 nm | 8 | 6.1−8 | [24] |
| 6 | 518 nm (FITC) | 575 nm (RhBAM) | 488 nm | 8.3 | 3−6 | [12] |
| 7 | 500 nm (Coumarin 6) | 620 nm (Nile Red) | 450 nm | 8.75 | 5−9 | [25] |
| 8 | 520 nm (carboxyl−functionalized QDs) | 560 nm (mOrange/mOrange M163K) | 400 nm | 12 | 6−8 | [26] |
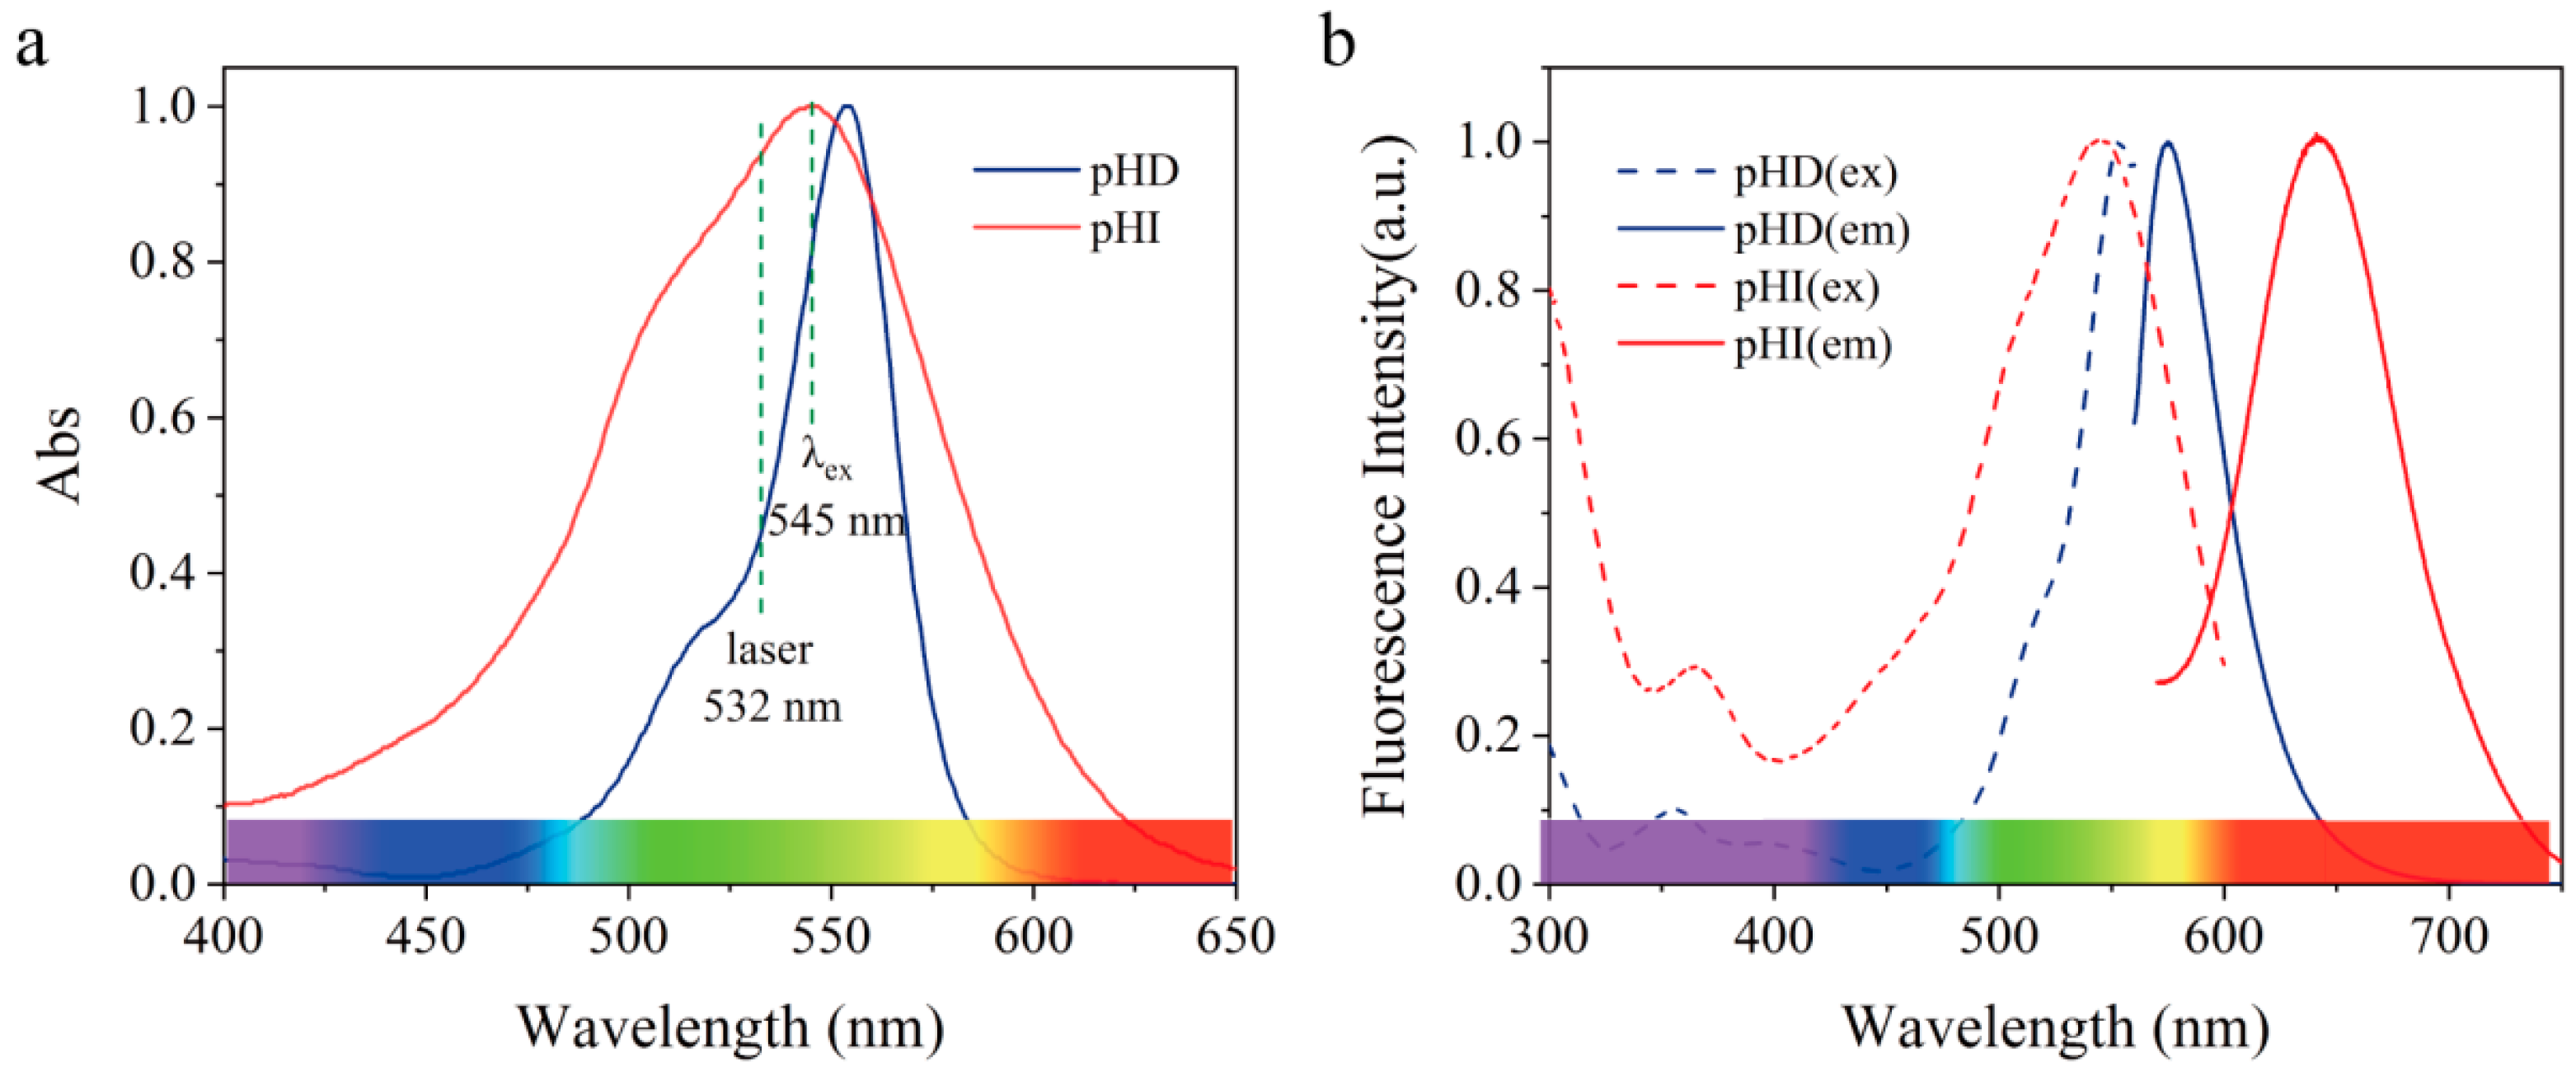
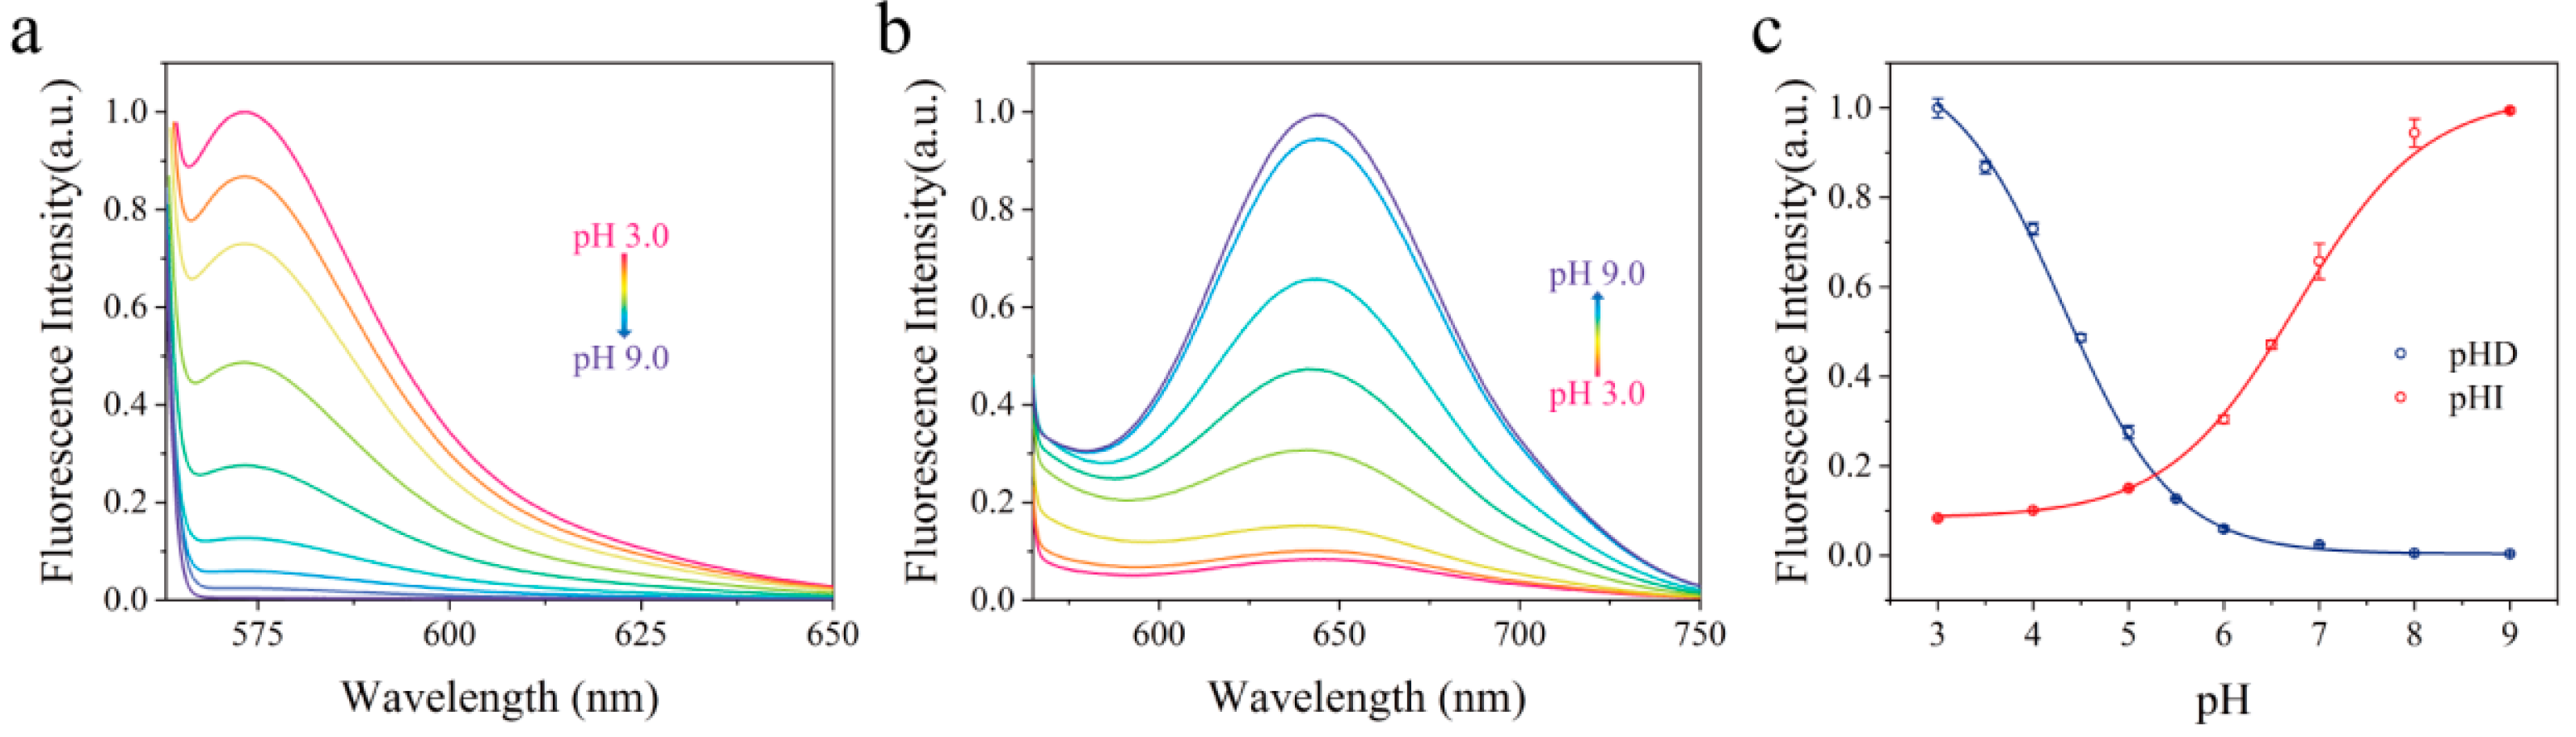
| 9 | 570 nm (pHD) | 630 nm (pHI) | 545 nm | 9 | 3−9 | this work |
Publisher’s Note: MDPI stays neutral with regard to jurisdictional claims in published maps and institutional affiliations. |
© 2022 by the authors. Licensee MDPI, Basel, Switzerland. This article is an open access article distributed under the terms and conditions of the Creative Commons Attribution (CC BY) license (https://creativecommons.org/licenses/by/4.0/).
Share and Cite
Lin, Z.; Hu, F.; He, G.; Yang, Y.; Liao, Y.; Luo, X.; Wang, X.-D. Highly Photostable and pH−Sensitive Nanosensors. Chemosensors 2022, 10, 354. https://doi.org/10.3390/chemosensors10090354
Lin Z, Hu F, He G, Yang Y, Liao Y, Luo X, Wang X-D. Highly Photostable and pH−Sensitive Nanosensors. Chemosensors. 2022; 10(9):354. https://doi.org/10.3390/chemosensors10090354
Chicago/Turabian StyleLin, Zhenzhen, Fang Hu, Gang He, Youjun Yang, Yujun Liao, Xiao Luo, and Xu-Dong Wang. 2022. "Highly Photostable and pH−Sensitive Nanosensors" Chemosensors 10, no. 9: 354. https://doi.org/10.3390/chemosensors10090354
APA StyleLin, Z., Hu, F., He, G., Yang, Y., Liao, Y., Luo, X., & Wang, X.-D. (2022). Highly Photostable and pH−Sensitive Nanosensors. Chemosensors, 10(9), 354. https://doi.org/10.3390/chemosensors10090354