1. Introduction
Cancer is a group of severe diseases involving the uncontrolled growth and infiltration of aberrant cells in various parts of the body and is responsible for millions of deaths worldwide [
1]. The cellular microenvironment plays an important role in affecting the development and progression of cancer cells. The tumor microenvironment modulates the migration, metastasis, and signaling of the cancer cells [
2].
The mechanistic understanding of how the microenvironment influences cancer progression is continuously improving. It is known now that extracellular pH (pH
e) is a key factor regulating cellular physiological and pathological activities [
3]. It is widely accepted that the abnormal anaerobic glycolysis in tumor cells produces abnormally high levels of lactic acid from glucose, leading to the so-called “Warburg effect” [
4], resulting in the acidification of the cellular microenvironment and lower pH
e values than that of normal cells [
5].
The extracellular pH of most healthy tissues is around 7.2 to 7.4 while that of cancer cells can drop to 6.5 or even lower [
6]. Current cancer diagnostic methods typically detect biomarkers such as proteins and nucleic acids, but measurement of tumor cell pH
e can permit tumor diagnosis at earlier stages. Also, measurement of pH
e differences between normal and cancerous cells has applications in anti-cancer drug development, drug delivery, and cancer imaging solutions [
7,
8,
9,
10].
Several methods have been described for the measurement of pH values in the extracellular microenvironment. For example, field-effect transistor-based pH-sensitive nanopipettes [
11], electrochemistry-based sensor films [
12], voltametric pH microsensors [
13], gated ion-sensitive field-effect transistors (ISFETs) [
14], and surface-enhanced Raman scattering (SERS) [
15,
16,
17] have all been applied to monitoring pH in the extracellular microenvironment (ECM). However, these approaches all require physical contact between the surface of the cells and the measurement devices, which makes contamination likely and diminishes spatial resolution.
Fluorescence techniques are favorable for cellular detection and analysis since they enable high sensitivity, real-time imaging, and are non-invasive. Combined with microscopy, fluorescence-based pH-sensitive probes with good biocompatibility were utilized to measure pH
e. For instance, Ke et al. sensed pH
e by means of amphiphilic lipid-DNA ratiometric fluorescent probes anchored onto the cell surface [
18]. More recently, a quantum dot labeled cell-penetrating peptide with rhodamine B as a ratiometric nanosensor was used to track and image the pH values of lysosomes in living cells and extracellular microenvironments [
19].
With their advantages of reduced sample consumption and shorter reaction times, microfluidic devices are increasingly popular platforms for bioanalysis. Droplet microfluidics has emerged as a powerful tool for studies of single molecules and single cells; encapsulation in small volume droplets facilitates high-throughput screening of drugs and other compounds as well as a variety of other biological applications, such as enzymatic assays, polymerase chain reaction and related techniques, proteomics, and synthetic biology, among others.
Given cellular heterogeneity, assessing the evolution of extracellular microenvironments at the single cell level is a promising way to precisely diagnose diseases and further our understanding of interactions between drugs and cells. Ben et al. and Zhang et al. distinguished circulating tumor cells (CTCs) and healthy cells captured in droplets by measuring the pH
e in the droplets using a fluorescent pH reporter, Seminaphthorhodafluor (SNARF)-5F [
20,
21].
Monodisperse aqueous droplets generated in microfluidic devices are stabilized by surfactants. Currently, many droplet-based biological analysis systems rely on fluorinated oils containing nonionic fluorosurfactants composed of perfluoropolyether-poly(ethylene glycol)-perfluoropolyether triblock copolymer (PFPE-PEG-PFPE triblock copolymer, EA surfactant) [
22]. However, droplet leakage and cross-contamination between aqueous droplets have been observed, which may affect the accuracy of the assays [
23]. Pickering emulsions are stabilized by solid particles between two immiscible phases and have been used in various applications [
24]. Fluorinated silica nanoparticles with good amphiphilicity and biocompatibility have shown good retention at the water–oil interface [
25]. Pickering emulsions stabilized by fluorinated silica nanoparticles effectively prevented droplets from fusion and leakage, yielding consistent results in applications such as droplet-based digital PCR and enzymatic assays [
26,
27]. Furthermore, the surface of silica nanoparticles can be readily functionalized by chemical modifications.
Silica nanoparticles are a biocompatible material with high stability and low toxicity and are inexpensive. They have been coupled to the surface of cells as a coating for biomedical applications, including cell therapy or cells-on-a-chip [
28,
29]. Droplets generated using amphiphilic silica nanoparticles have been used to culture bacterial cells, but to the best of our knowledge have not been used for culturing mammalian cells [
30,
31]. It has been suggested that a solid-like substrate stabilized by hydrophobic particles at the water–oil interface could support cell attachment [
32]. Pan et al. proved that a fluorinated nanoparticle-stabilized interface in 96-well plates allowed the adhesion, spreading, and growth of anchorage-dependent cell lines [
25]. This colloidosome-based single-cell encapsulation enables the confinement of cells in closely packed shells in a three-dimensional morphology and allows for their growth. The monolayer shells provide the substrate for cell adhesion, and therefore modifying them with reporter molecules offers an attractive path for a non-invasive, label-free way to detect metabolite secretions. In this work, we developed a droplet microfluidics method for monitoring pH changes in live cell nanoliter-sized microenvironments in real time. Amphiphilic silica nanoparticles were doped on the inside with Ru(phen)
3Cl
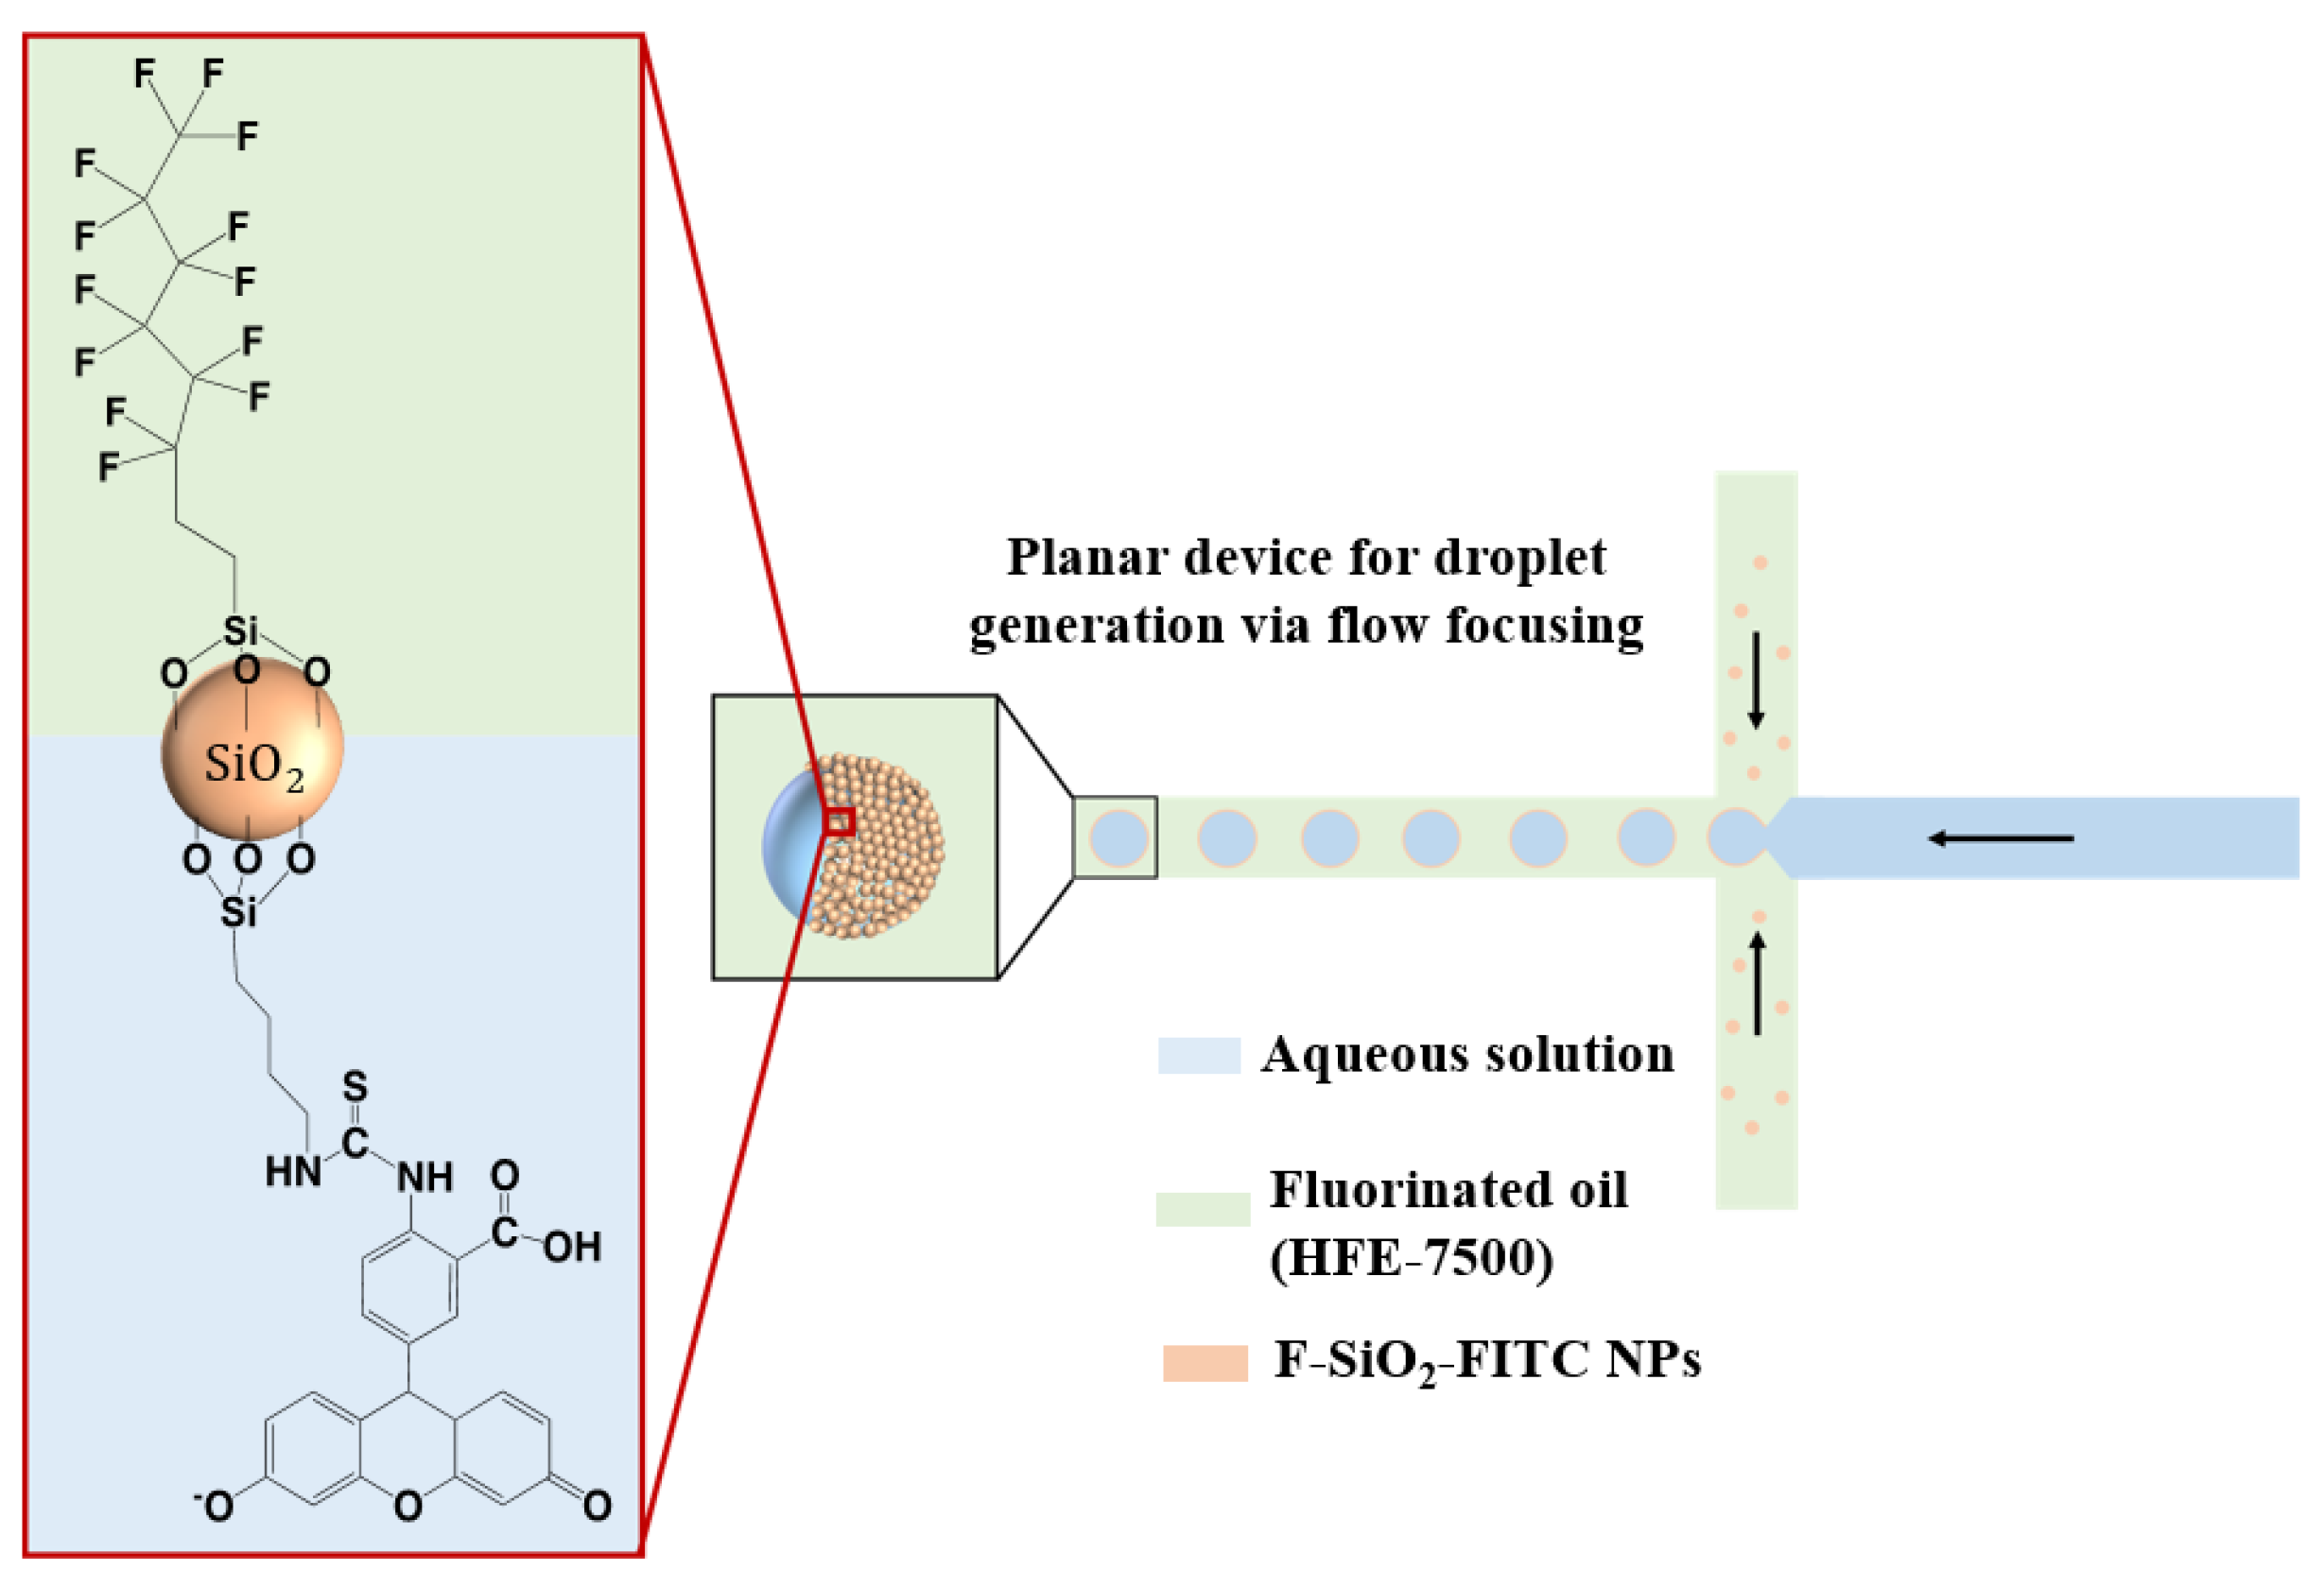
2 and conjugated with fluorescein isothiocyanate (FITC) on the surface. Fluorinated and FITC-conjugated nanoparticles (F-SiO
2-FITC) were synthesized as aqueous droplet stabilizers in fluorinated oil, and also served as pH indicators for the droplets. Cells were encapsulated in droplets generated by a PDMS microfluidic chip along with a cell medium and were able to proliferate. The pH change in the cells’ microenvironment could be monitored with the F-SiO
2-FITC nanoparticles.
2. Experimental Methods
2.1. Synthesis of Ru(phen)3Cl2 Doped F-SiO2-FITC Nanoparticles
An amount of 3 mL of tetraethyl orthosilicate (TEOS) and 1 mL Ru(phen)3Cl2 (0.3 mg mL−1) was added to a solution containing 60 mL of ethanol (EtOH), 1 mL of deionized water, and 2.4 mL of NH4OH (28 wt%). The reaction mixture was then stirred vigorously at 40 °C for 6 h, and 0.8 mL TEOS was added for an additional 6-h stirring to yield the parent SiO2 NPs.
Afterward, a mixture of 1 mL of perfluorooctyltriethoxysilane (FAS, Sigma-Aldrich, St. Louis, MO, USA) and 10 μL of (3-Aminopropyl)triethoxysilane (APTES, Sigma-Aldrich, St. Louis, MO, USA) was added directly to every 5 mL of the parent SiO
2 NPs dispersion, followed by vigorous stirring at room temperature for 30 min. Nanoparticles were collected by centrifugation (Hermle Labortechnik, Baden-Württemberg, Germany) at 10,000 RPM for 10 min, the supernatant was decanted, and the nanoparticles were resuspended in 5 mL of EtOH. This washing procedure was repeated two more times. After final centrifugation at 10,000 rpm for 10 min and the removal of the supernatant, the nanoparticles were resuspended in 10 mL diethyl ether and ethanol (4:6
v/
v). An amount of 1 mL of FITC at 1 mg mL
−1 was added followed by stirring for 1 h at room temperature. The nanoparticles were subsequently centrifugated and washed as before until FITC was no longer detectable in the supernatant (
Figure 1).
2.2. Characterization of Nanoparticles
The size and morphology of the nanoparticles were investigated by scanning electron microscopy (JSM-6700F, Tokyo, Japan). The Ru(phen)3Cl2-doped pristine nanoparticles were dispersed in EtOH. The F-SiO2-FITC nanoparticles dispersed in HFE-7500 were precipitated by centrifugation at 10,000 rpm and then washed with 5 mL ethanol, three times total. Precipitated F-SiO2-FITC nanoparticles were finally redispersed in 5 mL ethanol by sonification. A total of 10 µL of EtOH with parent nanoparticles and F-SiO2-FITC nanoparticles were transferred to a small piece of silicon wafer.
The chemical structure of nanoparticles was examined by Fourier Transform Infrared Spectroscopy (FTIR, Vertex 70 Hyperion 1000 B, Baden-Württemberg, Germany). The synthesized Ru(phen)3 Cl2-doped SiO2, fluorinated SiO2, fluorinated and aminated SiO2 and F-SiO2-FITC nanoparticles were desiccated overnight, and the powders of nanoparticles were ground and transferred to the sample stage of FTIR. The transmission spectrum was obtained by scanning the sample from 400 to 4000 cm−1 at room temperature.
2.3. Microchip Fabrication
The microfluidic chips, containing a flow-focusing structure and incubation chamber, were designed using AutoCAD software and then transferred to a photomask. The silicon wafer substrate was patterned by a SU-8 3050 (MicroChem Corp., Westborough, MA, USA) based lithography process to obtain a master mold with 60 µm high features.
The master mold was replicated onto Polydimethylsiloxane (PDMS, SYLGARD, Dow, Hayward, CA, USA) by pouring elastomer and curing agent mixed at a ratio of 10:1 (w/w) and cured at 100 °C for 15 min. Then, the patterned PDMS was peeled off and punched to form two inlets and one outlet. The PDMS and a glass slide were activated by oxygen plasma treatment at 30 W in a plasma cleanser (PDC-002, Harrick Plasma, Ithaca, NY, USA), before bonding the patterned PDMS onto a glass slide and sealing the chambers and channels. After the chip was assembled, 2% perfluorodecyltriethoxysilane in HFE-7500 (3M, St. Paul, MN, USA) (v/v) solution was injected into the channels and dried on an 80 °C hot plate for 1 h to obtain fluorinated surfaces.
2.4. Generation of Droplets
The continuous phase (HFE-7500 containing 5% (w/w) Ru(phen)3 Cl2 -doped F-SiO2-FITC nanoparticles) and the dispersed phase (i.e., cell medium) were injected from two separated inlets. The monodisperse microdroplets were generated at a flow-focusing junction according to a fixed flow ratio of the two liquid phases. Droplet sizes were controlled by adjusting the flow ratios.
2.5. Optical Setup and pH Calibration
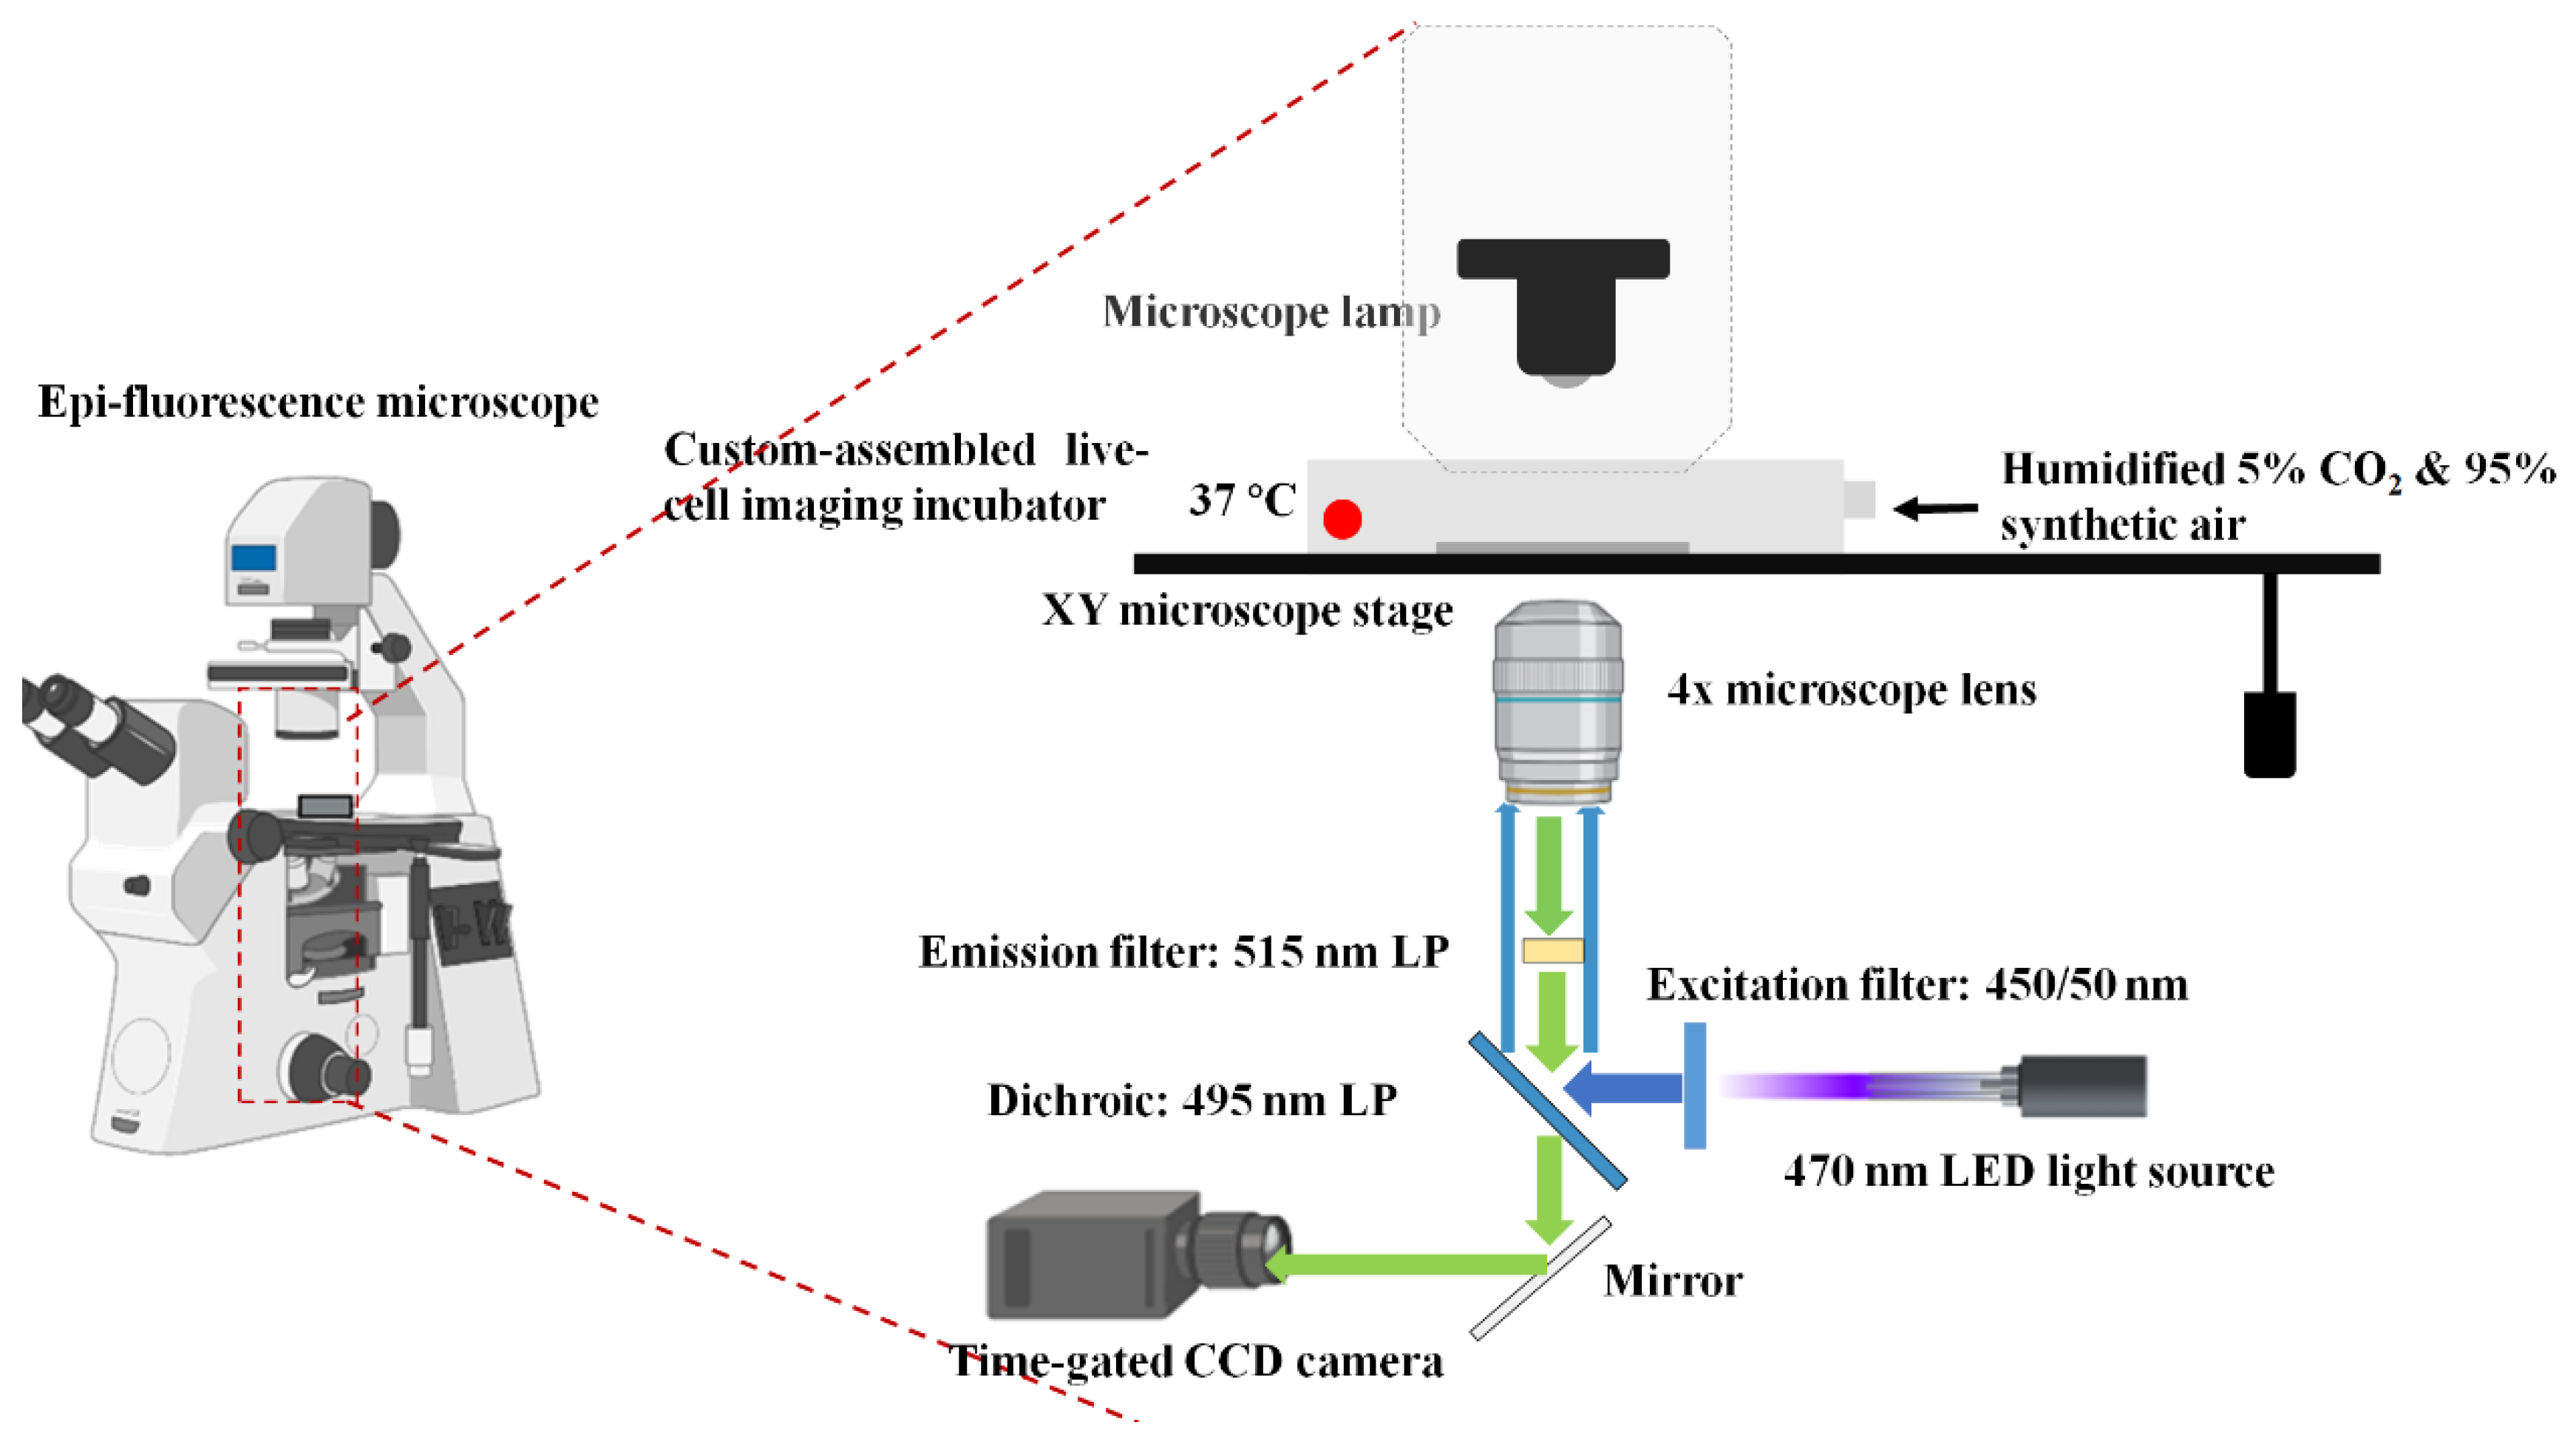
The optical setup is shown in
Figure 2. The microchip was placed in a custom incubator assembly which was mounted on an epi-fluorescence microscope (Nikon, Tokyo, Japan) equipped with a 470 nm LED driven by a DC2100 voltage controller (both from Thorlabs, Newton, NJ, USA), an Imagex-TGi camera (Photonic Research Systems, Newhaven, UK) with 4× objective lens (Nikon, Tokyo, Japan), and various filter sets: a band pass (BP) 450/50 nm excitation filter (Chroma, Bellows Falls, VT, USA), a 495 nm dichroic (Chroma, Bellows Falls, VT, USA), and a 515 long pass (LP) emission filter (Chroma, VT, Bellows Falls, USA). The incubator temperature was maintained at 37 °C, and 95% humidified filtered air containing 5% CO
2 was supplied when the cell culture was incubated.
The pH calibration was conducted using time-domain dual lifetime referencing (t-DLR) [
33,
34] which is based on acquiring data from two images: one taken in the excitation period (A
ex) when the light source is on, and the other in the decay period (A
em) when the light source is off (see also
Section 3.2). Two luminophores that are simultaneously excitable at 470 nm but with different lifetimes were chosen: FITC, which works as the pH indicator, and Ru(phen)
3Cl
2, which serves as the reference. The luminescence was recorded at various pH levels between 5 and 8, using Britton–Robinson Buffer (BRB) solutions in monodispersed droplets using time-gated CCD imaging.
2.6. Cell Culture and Cell Suspension Preparation
Lung cancer cells (A549) and breast cancer cells (MCF-7) were cultured in Dulbecco’s Modified Eagle Medium (DMEM, Gigbo, Paisley, UK) supplemented with GlutaMAX 10% (v/v) Fetal Bovine Serum, 1% (v/v) penicillin-streptomycin (100 IU mL−1–0.1 mg mL−1) at 37 °C in a humidified atmosphere containing 5% CO2. Human umbilical vein endothelial cells (HUVECs) were cultured in Endothelial Cell Growth Medium-2 BulletKit (EGM-2, Lonza, Alps, Swiss). The cells were seeded at an initial concentration of 5 × 10⁴ cells mL−1 on 10 cm diameter culture dishes.
The cells were passaged using 0.25% (w/v) trypsin-EDTA when they reached 80–90% confluency. For single-cell encapsulation in droplets, the cells in the logarithmic growth phase were used. The culture medium was removed, and the cells were gently rinsed with phosphate buffer saline solution (pH = 7.4). The adherent cells were detached with trypsin-EDTA solution, and the supernatant of the collected cells was discarded after centrifugation. After that, the cell pellets were resuspended in the medium at various concentrations for cell encapsulation. The concentration of cells was measured using a hemocytometer.
2.7. Measurement of Extracellular pH in Droplets
Droplets were generated in a PDMS microfluidic chip under 27.6 psi of the dispersed phase (culture medium with a cell density of 106 cells mL−1) and 29 psi of the continuous phase (5% v/v F-SiO2-FITC nanoparticles in HFE-7500). Single cells were encapsulated in droplets while the remaining nanoparticles in HFE-7500 were flushed using FC-40 (Aldrich, St. Louis, MO, USA). The cells suspended in the medium were held at 4 °C to slow their metabolism before starting measurements. The microchip with generated droplets in the PDMS chamber was placed in a custom-made incubator. The luminescent intensities of the droplets were measured every 20 min in the first hour, and every two hours after the first two hours.
3. Results and Discussion
3.1. Synthesis and Characterization of Silica Nanoparticles
Ru(phen)
3Cl
2-doped silica nanoparticles were synthesized by means of a modified Stöber method [
35].
Figure 1 illustrates the procedure for preparing these nanoparticles and subsequent modifications. As monodispersed nanoparticles were generated, the dye was incorporated into the nanoparticles by electrostatic adsorption. The resulting SiO
2 nanoparticles were hydrophilic and dispersible in the aqueous phase. By reacting with FAS and APTES, the hydrophobicity of nanoparticles was increased since the silanol groups on the surface of particles were partially derivatized to perfluoroalkyl and alkylamine groups. Through the formation of a covalent bond between an amino group and an isothiocyanate group, the reactive fluorescein derivative FITC was conjugated onto the surface of the silica nanoparticles.
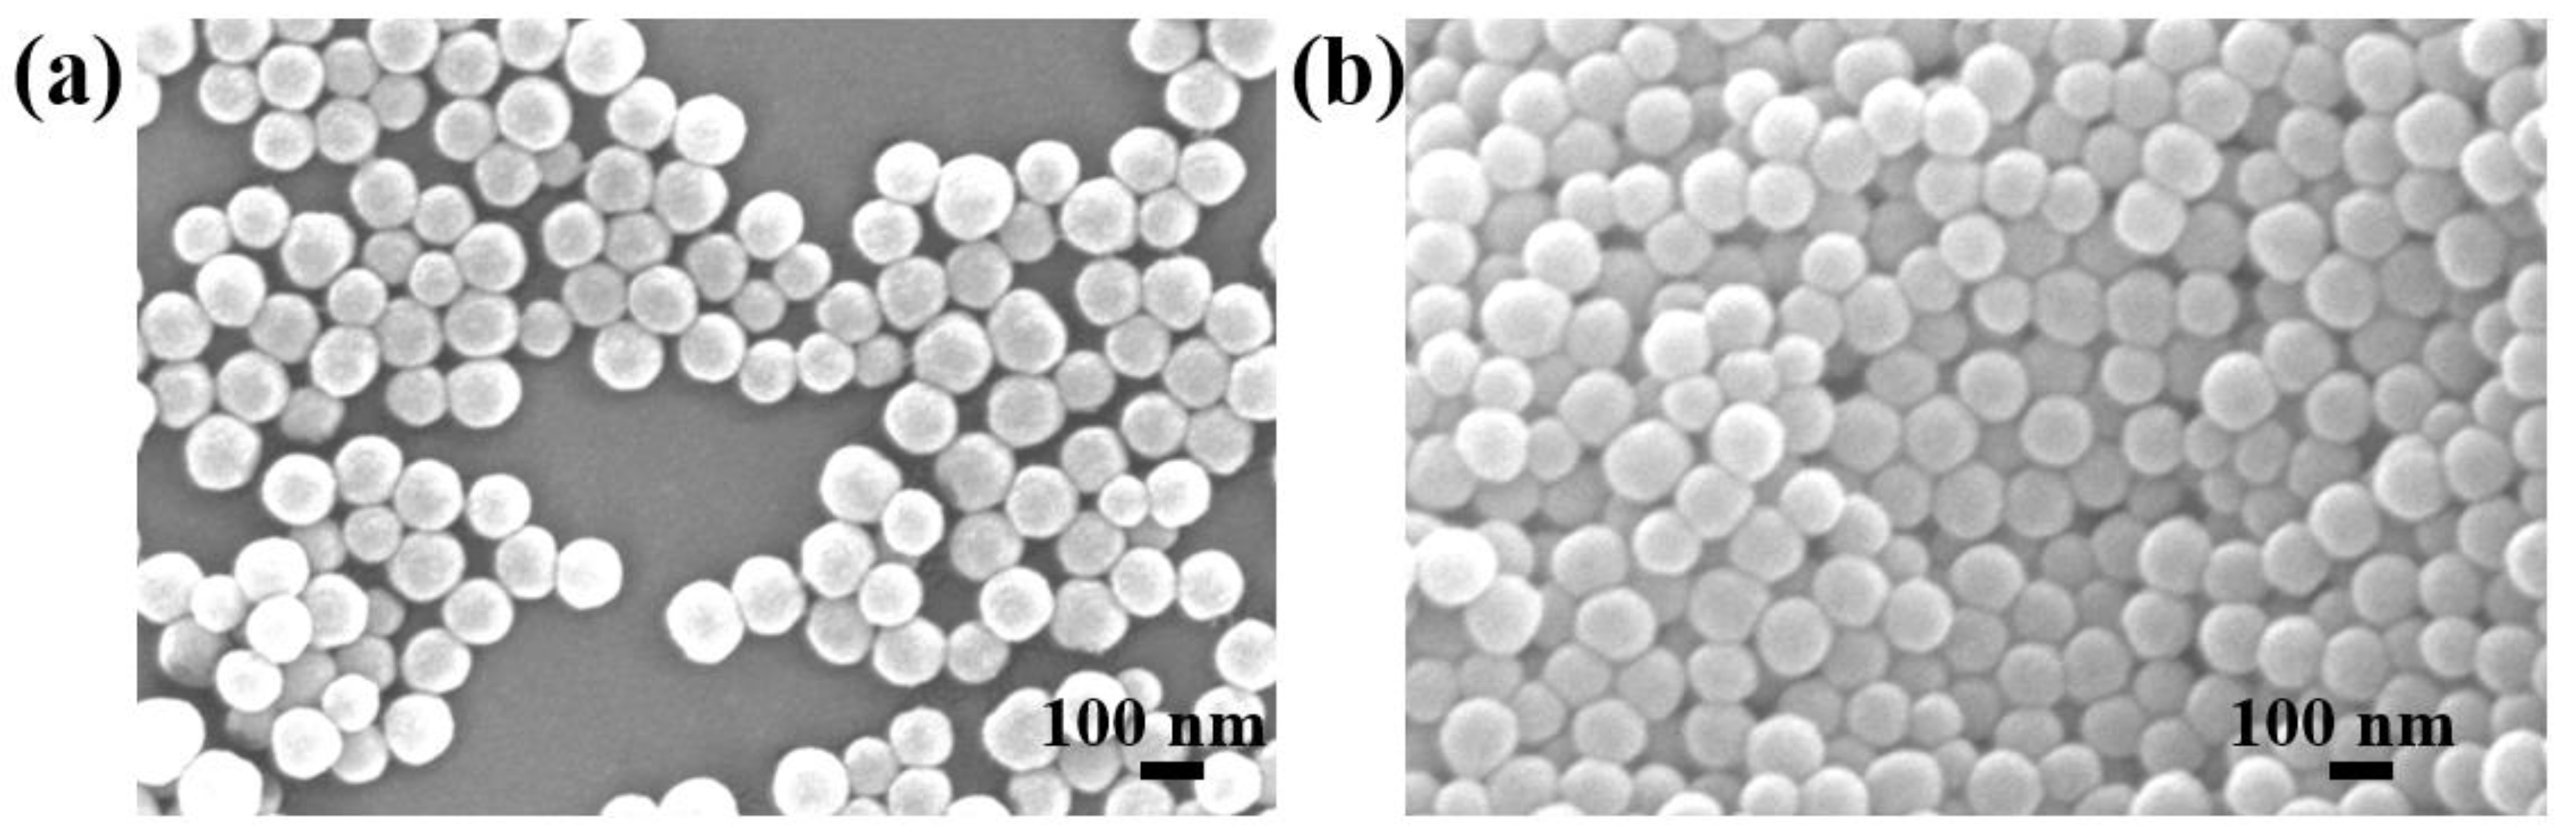
The morphology and structure of nanoparticles were characterized with a scanning electron microscope (SEM) and FTIR spectroscopy. As shown by the SEM images, both Ru(phen)
3-doped silica nanoparticles and F-SiO
2-FITC nanoparticles were approximately 100 nm in diameter (
Figure 3). The final sizes of the F-SiO
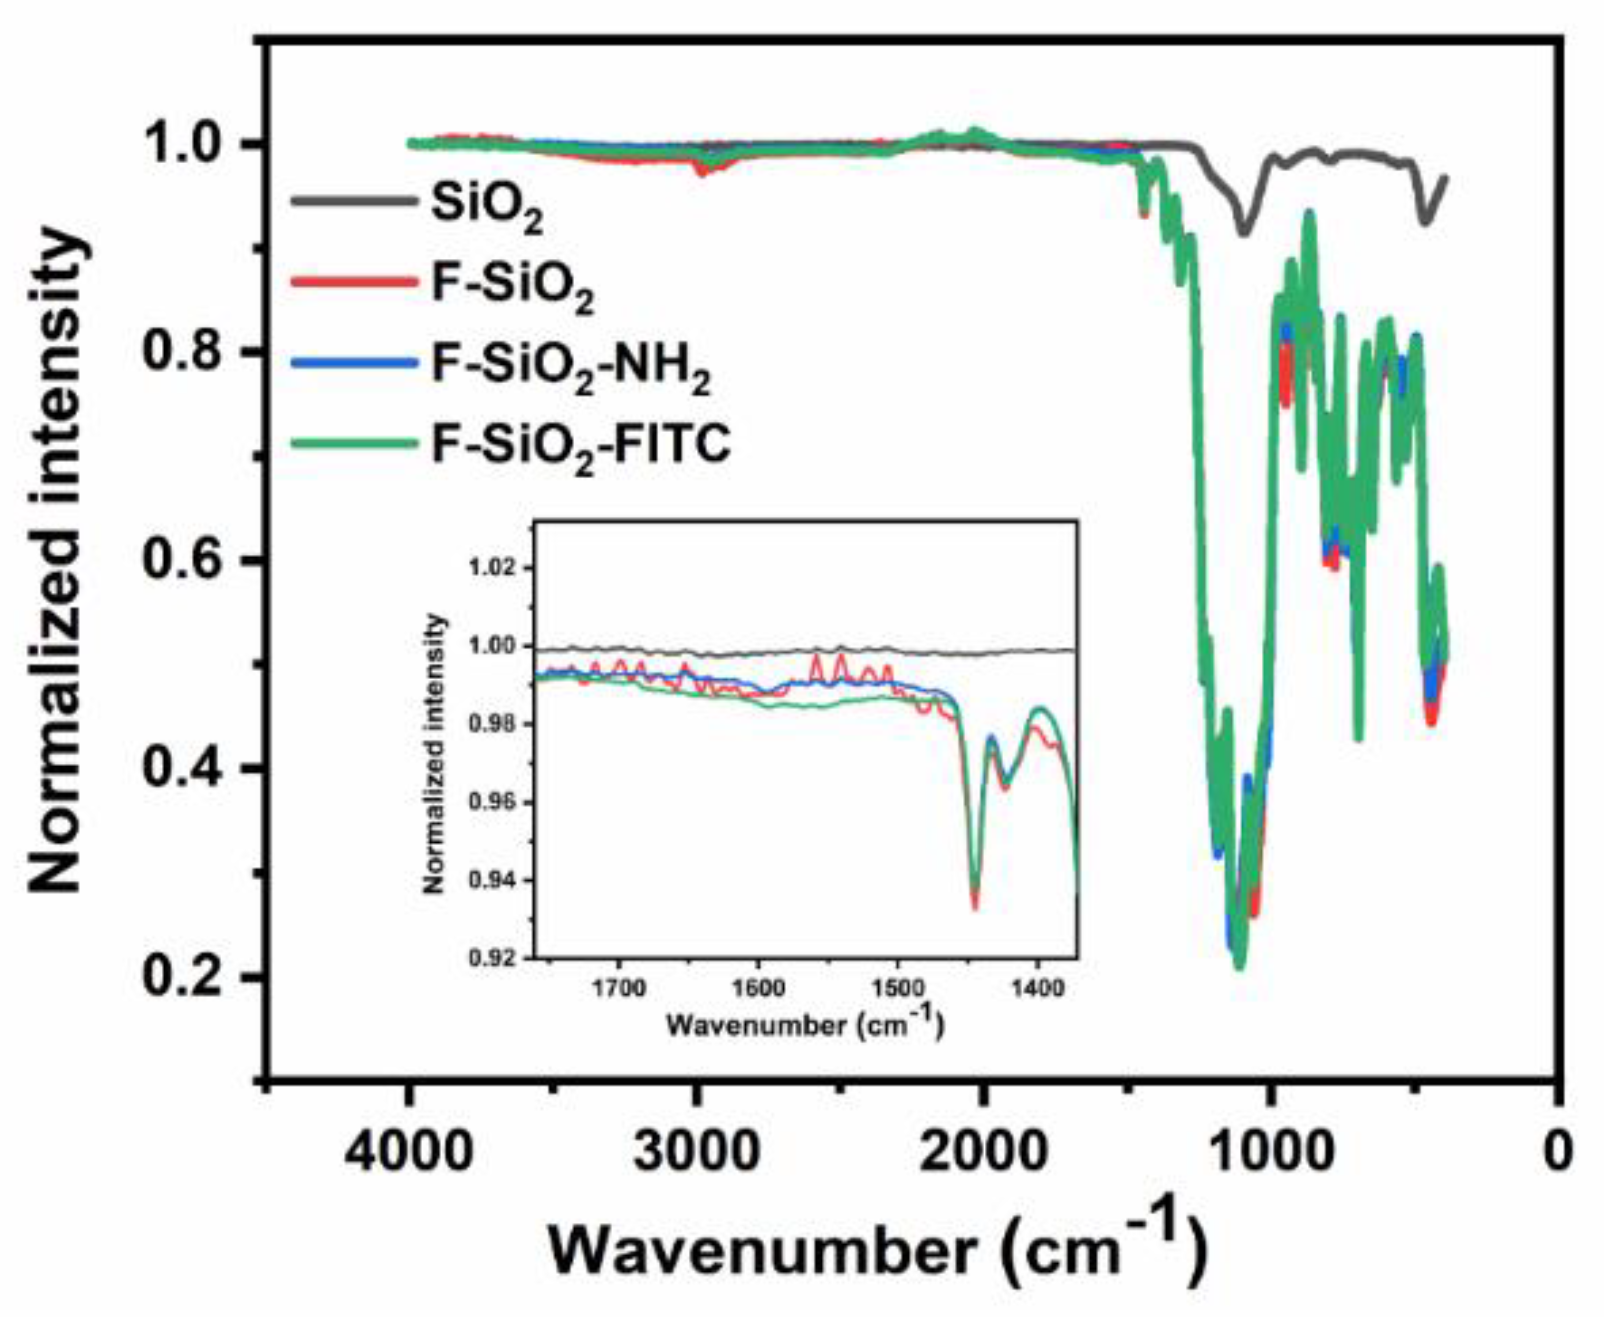
2-FITC nanoparticles were comparable to the initial nanoparticles, indicating that the modification process did not change the size of the particles considerably. FTIR spectroscopy was able to confirm that silica nanoparticles were successfully functionalized with amino groups and fluoroalkyl groups. In the IR spectrum (
Figure 4), a band in the 1100 cm
−1 region was observed in SiO
2, fluorinated SiO
2, fluorinated and aminated SiO
2, and F-SiO
2-FITC nanoparticles, corresponding to the Si–O–Si band in the SiO
2. The introduction of fluorosilane was confirmed by the peak at 1186 cm
−1 corresponding to the symmetric stretching of C–F, while the peak at 1234 cm
−1 was the antisymmetric stretching vibration peak of –CF
3, indicating that the silica nanoparticles were successfully modified with fluorosilane [
36]. Amino group modification was indicated by a peak at 1593 cm
−1 corresponding to the asymmetric bending of the N–H bond in the primary amine [
37].
3.2. pH Measurement and Characterization
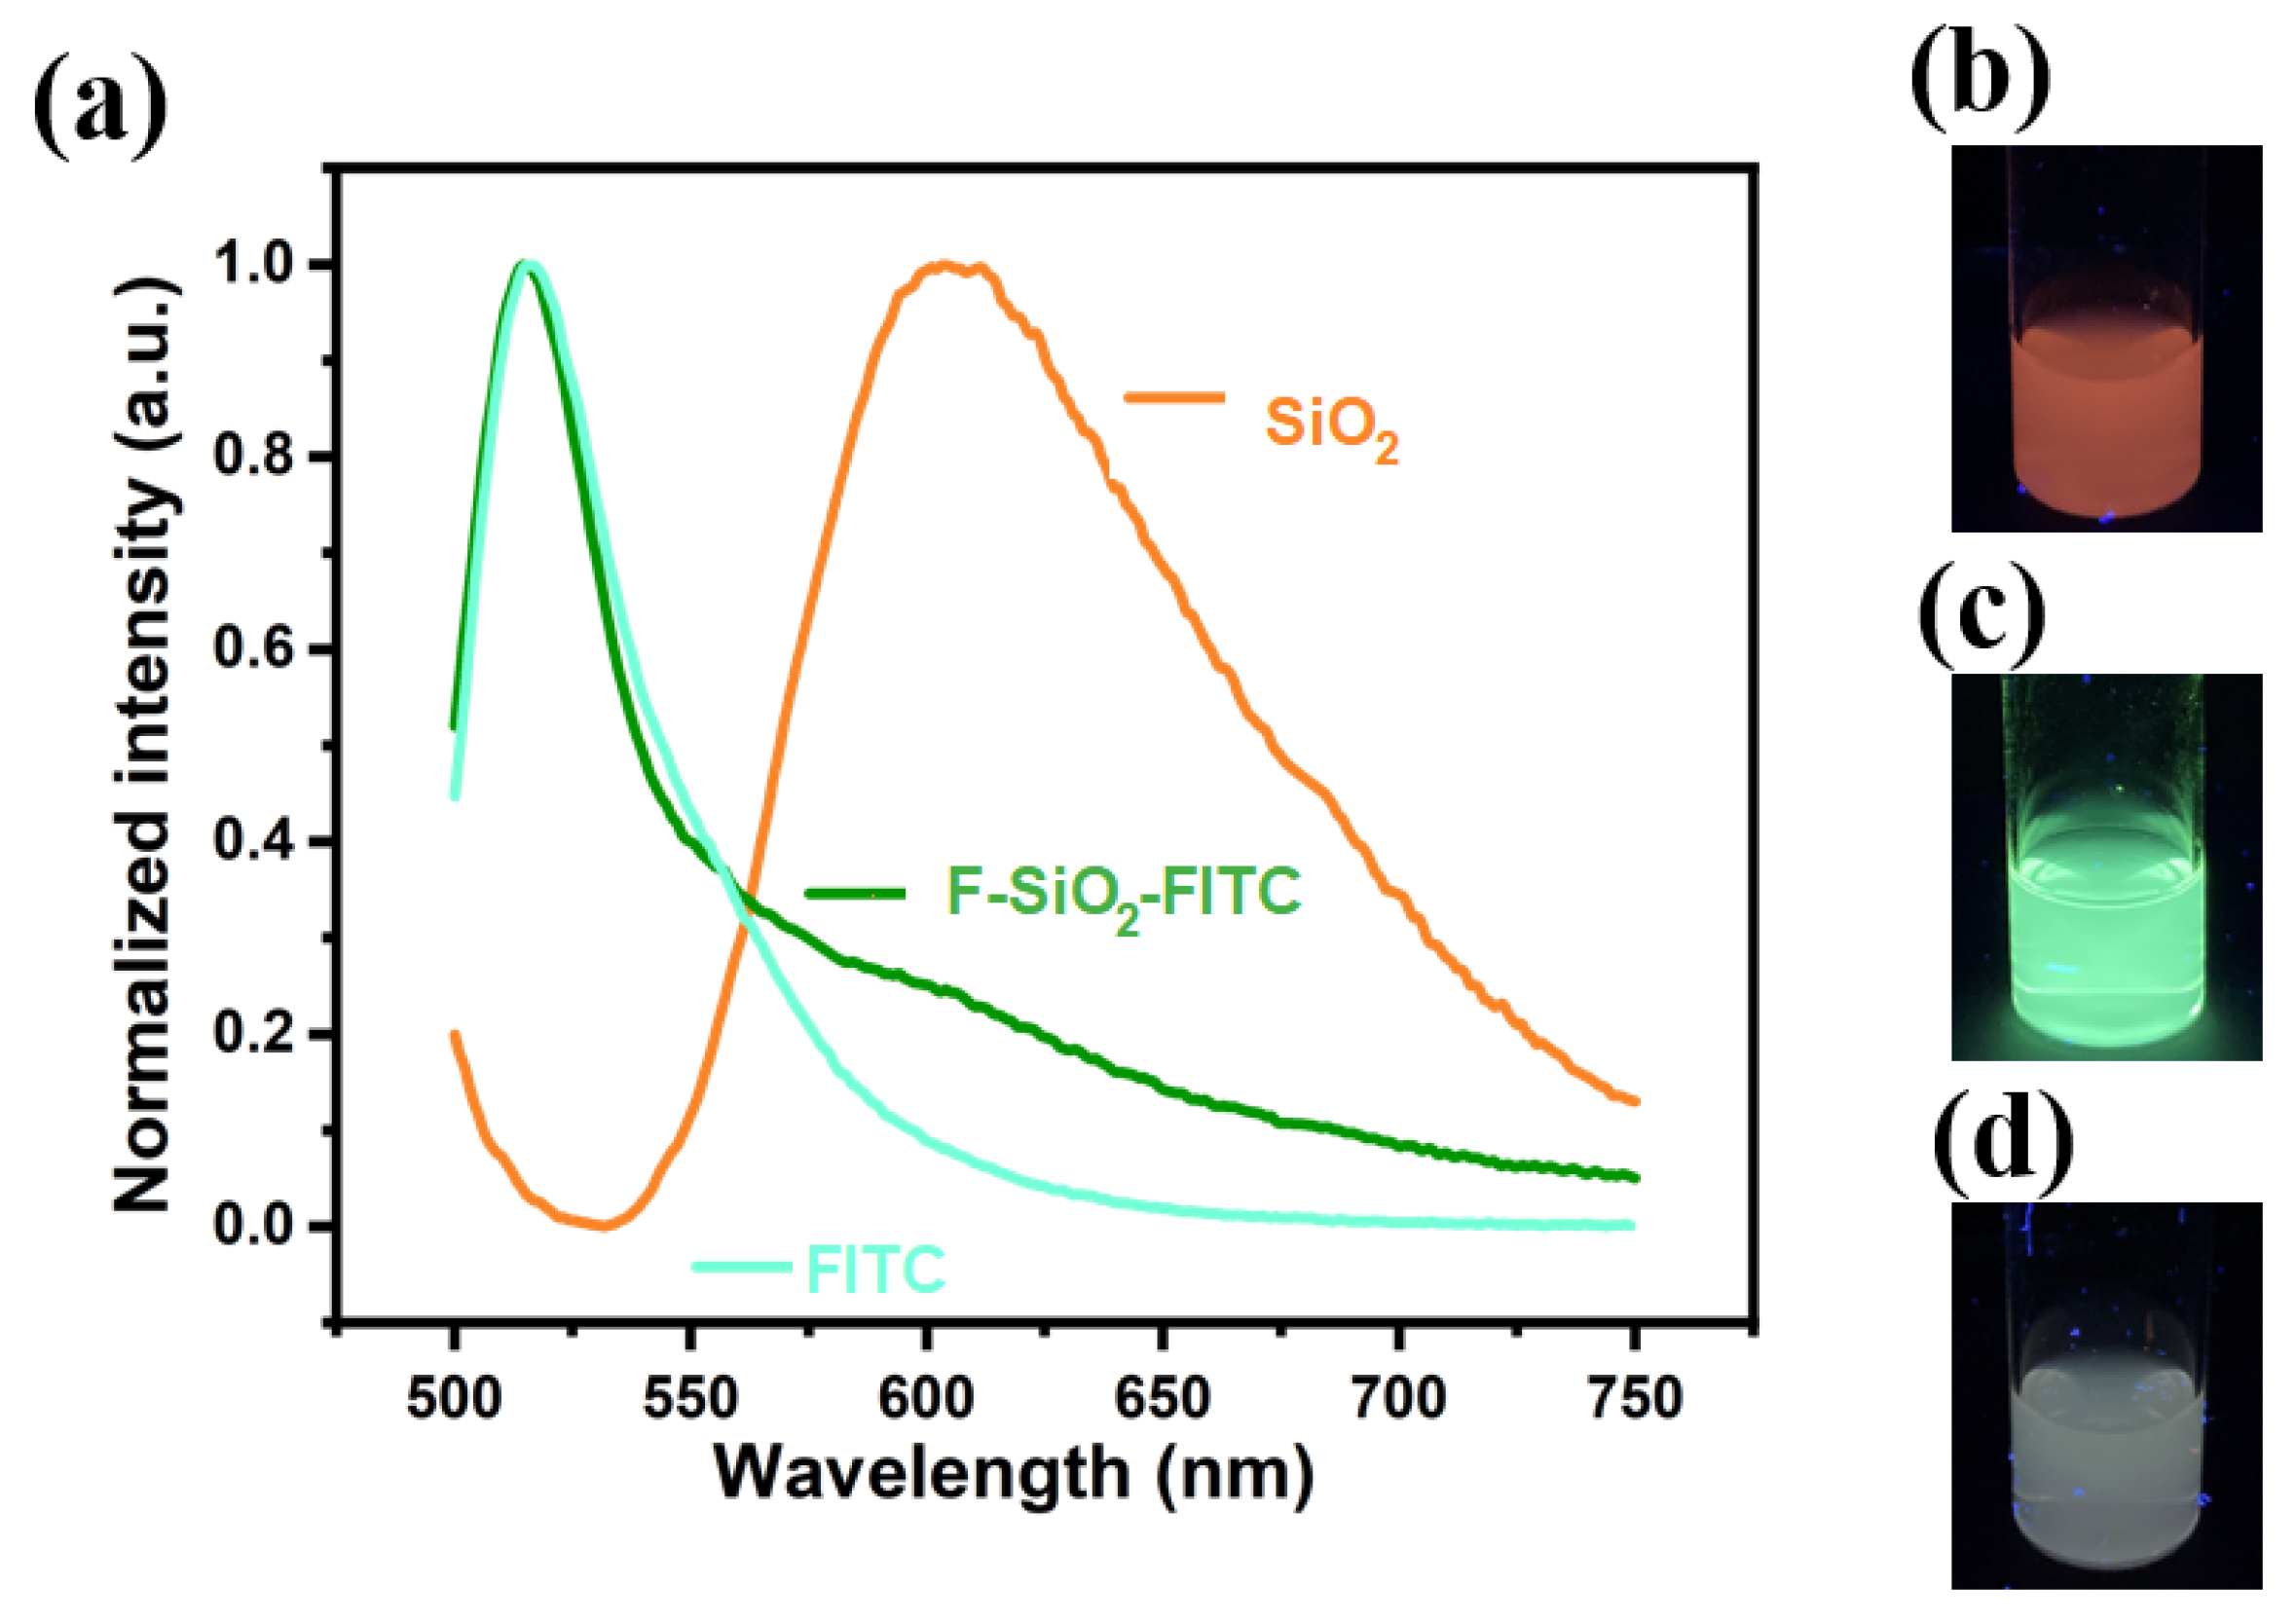
FITC is a reactive form of the commercial pH probe fluorescein with high biocompatibility and good reactivity for conjugation. Silica nanoparticles were chosen as the matrix since they are easily modified with silanol groups, which in turn are easily modified with amino groups. These amino groups are used for coupling to isothiocyanate groups, as found in FITC. The emission spectra of Ru(phen)
3Cl
2-doped nanoparticles, FITC, and Ru(phen)
3Cl
2-doped F-SiO
2-FITC nanoparticles excited at 470 nm are shown in
Figure 5. The parent nanoparticles were dispersed in ethanol while the F-SiO
2-FITC nanoparticles were dispersed in HFE-7500. FITC was dissolved in ethanol to a concentration of 0.1 mg mL
−1. The Ru(phen)
3Cl
2-doped nanoparticles had a maximum emission from 550 nm to 750 nm while FITC had a maximum emission intensity at around 515 nm. The Ru(phen)
3 Cl
2-doped F-SiO
2-FITC nanoparticles exhibited a strong emission peak at 515 nm and another shoulder centered at around 615 nm, with similarities to the emission spectra of Ru(II)(phen)
3 Cl
2-doped nanoparticles and FITC. This indicated that the two dyes on the silica nanoparticles could be excited at 470 nm simultaneously.
The F-SiO
2-FITC nanoparticles retained at the interface of the emulsified droplets exposed their hydrophobic fluoroalkyl chains to the continuous phase while the hydrophilic sides with amino groups and conjugated FITC molecules faced the aqueous interior. This decreased the surface tension of the aqueous phase and stabilized the droplets (
Figure 6).
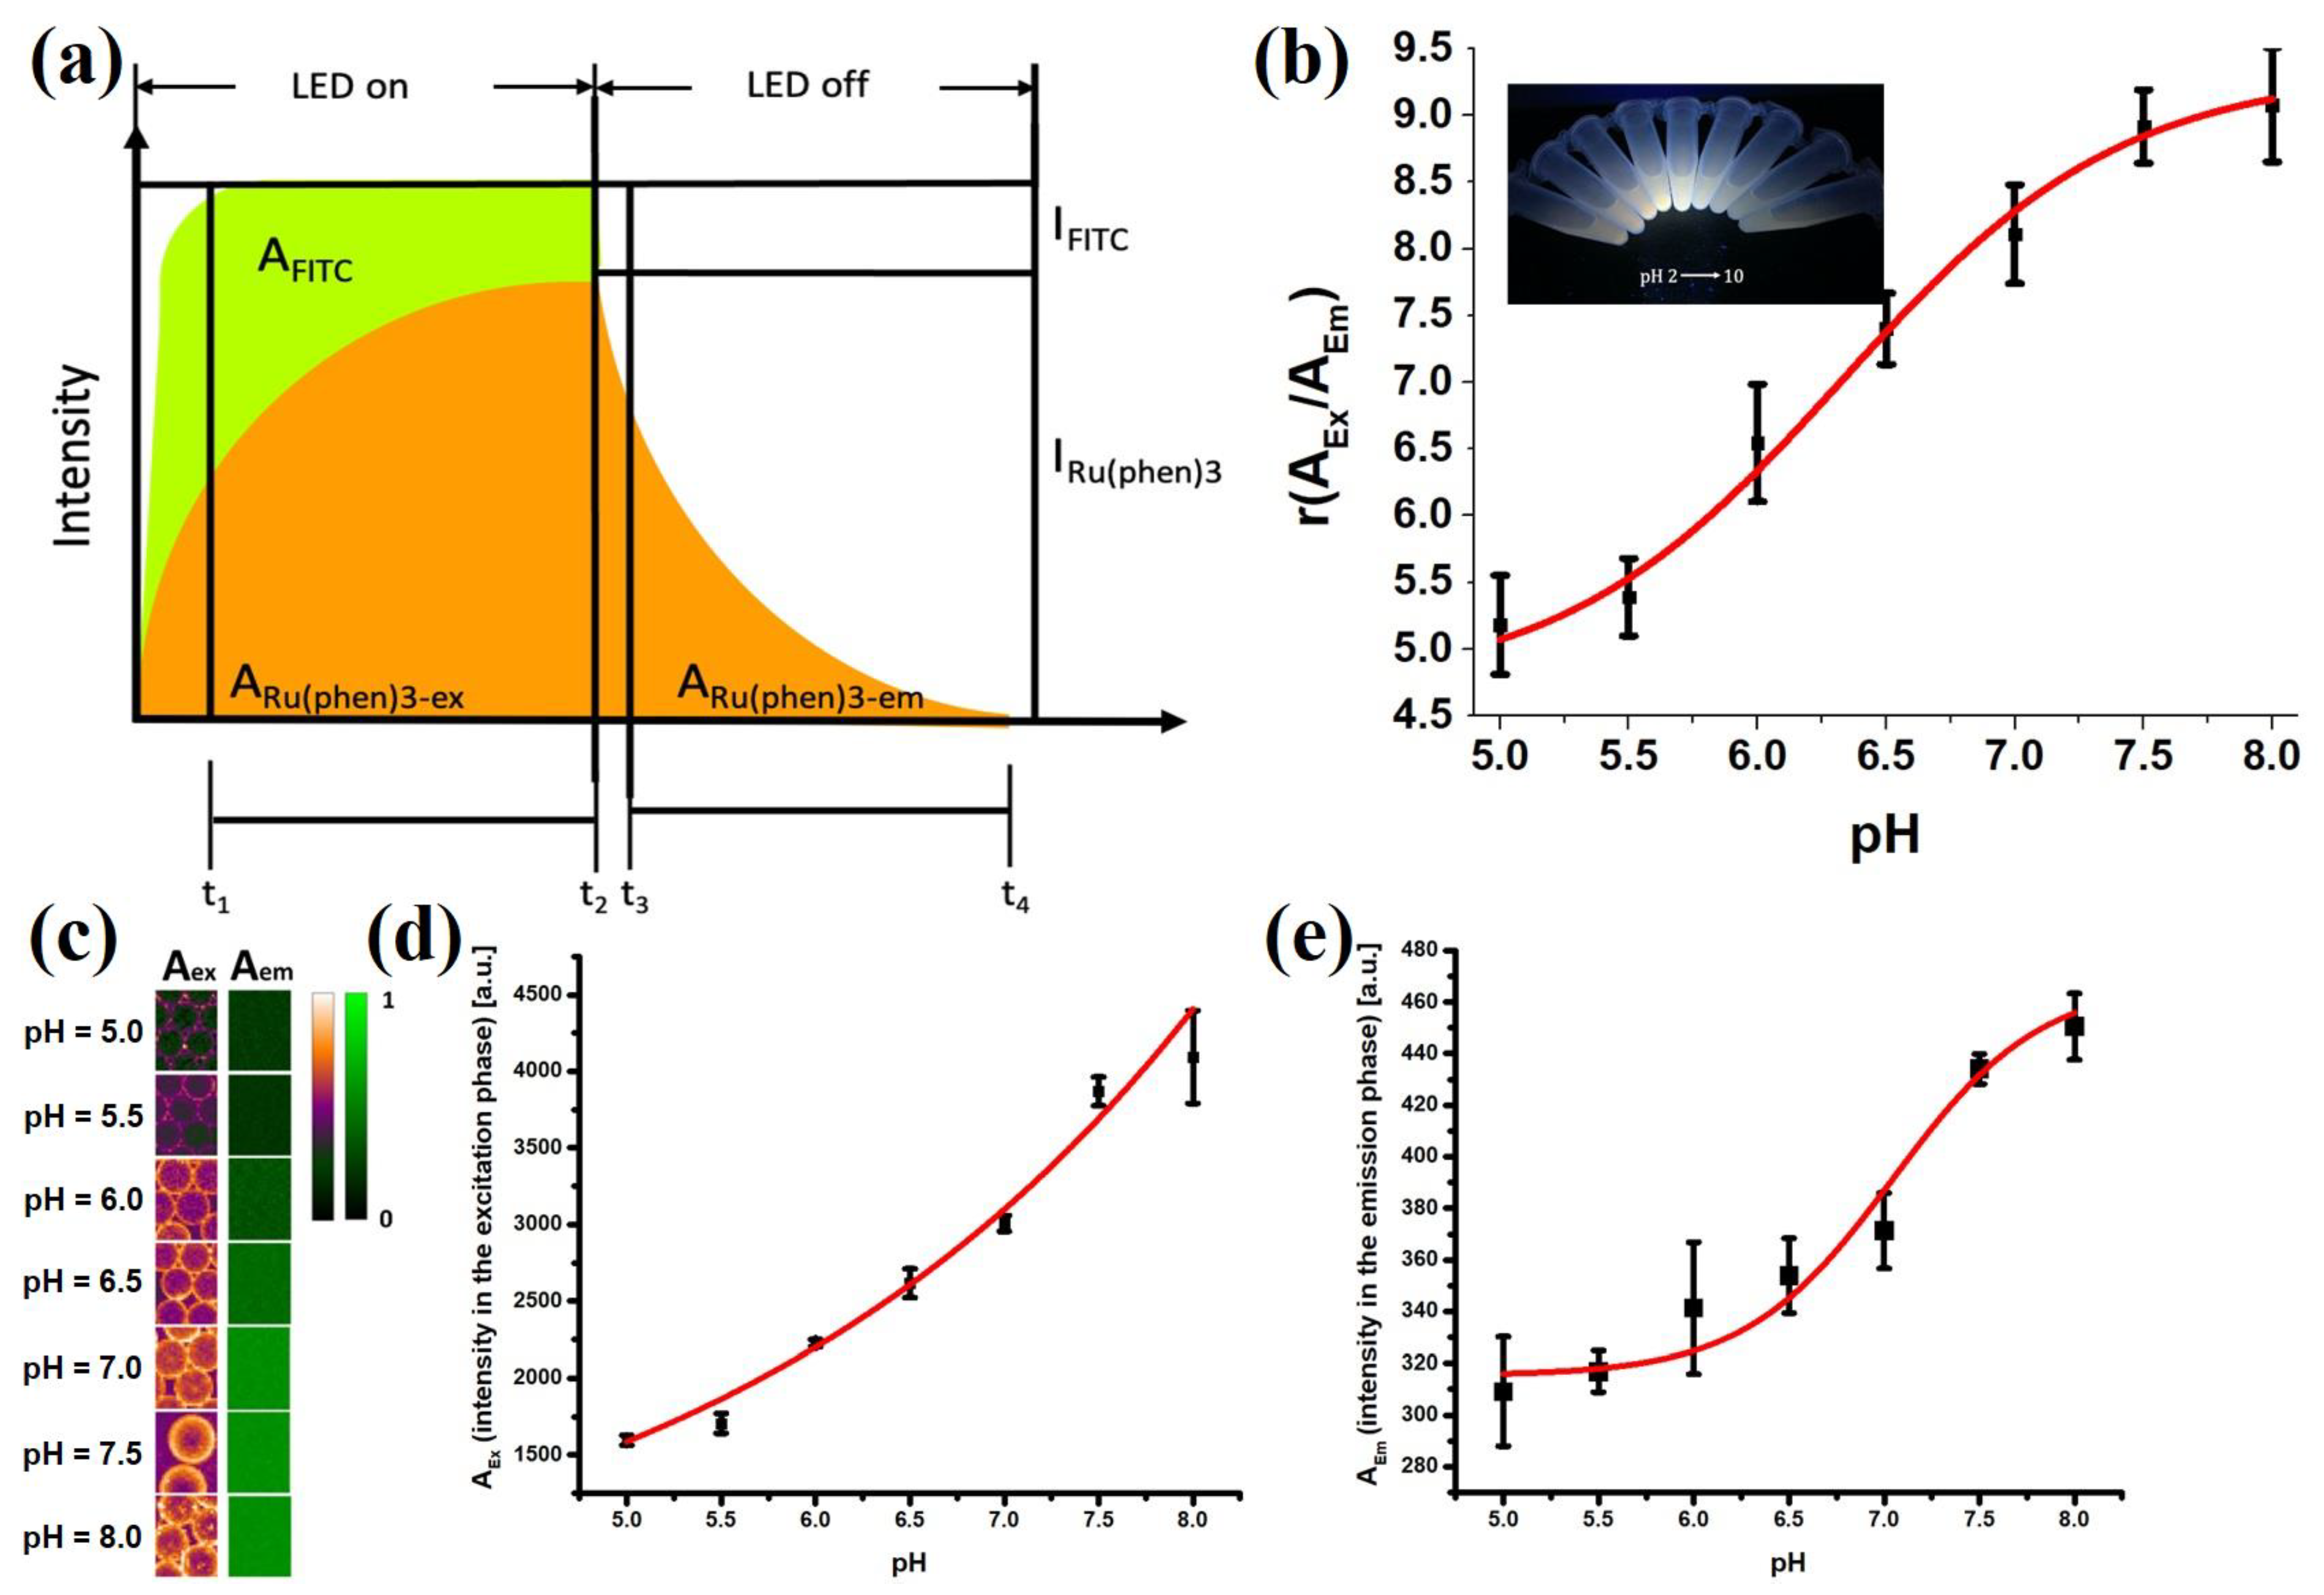
In the t-DLR method, the short-fluorescence lifetime pH indicator (fluorescein) and long-luminescence lifetime phosphor (Ru(phen)
3) were excited simultaneously at 470 nm with light-emitting diodes (LEDs). The luminescence during and after illumination was integrated into two time-gates: one was in the excitation period (LED on, A
ex) while the other was in the emission period (LED off, A
em). The combined luminescence of FITC and Ru(phen)
3 (A
ex) was detected during the excitation period, and only the luminescence of Ru(phen)
3 (A
em)was detected during the emission period. The signal of pH-dependent fluorescein was referenced to that of pH-independent Ru(phen)
3. After turning the LED off, the fluorescence of FITC would quickly decay so that only the phosphorescence signal would be detected. Therefore, A
em would correspond to the emission intensity signal of Ru(phen)
3 and the ratio A
ex/A
em denoted a referenced intensity of integrated signals (Equation (1)). This allows for the normalization of irregularities in particle distribution and illumination of the droplets.
To calculate the pH based on the r value, the aqueous droplets stabilized by F-SiO
2-FITC were calibrated with various pH buffers, and a sigmoidal fit was applied accordingly (Equation (2)). From the calibration curve, pH is calculated by substituting the value for r (
Figure 7b). The negative logarithm of dissociation constant (pK
a) at which value it may change its optical properties presented at the pH value with largest derivative in the calibration curve.
The emission intensity of the nanoparticles would therefore be suitable for measuring the pH values of the droplets, using FITC as a pH indicator and the Ru(phen)
3 as a reference dye. To obtain pH values from 2D fluorescence images of the droplets, the time domain dual lifetime referencing (t-DLR) method was implemented (
Figure 7a), which obviated the need to separate the signals with an image splitter [
33,
34]. Monodispersed droplets with pH values between 2 and 10 were collected in 1.5 mL centrifuge tubes and illuminated with a 365 nm UV lamp (inset in
Figure 7b). Emission color visibly transitioned from orange to green as the pH increased. The emission intensity of FITC varied with the pH of the solution, while Ru(phen)
3 showed consistent emission intensity independent of changes in pH [
38].
The calibration curve showed sigmoidal behavior and reliable pH measurements within the region of interest which we defined as from pH 5.0 to 8.0, allowing cell pH
e monitoring (
Figure 7b). Within a pH range of 5 to 8, equation 2 was found to describe the calibration curve very well using the following parameters: A
1 = 4.70 ± 0.48, A
2 = 9.33 ± 0.34, pK
a = 6.33 ± 0.12, ΔpH = 0.55 ± 0.16, indicating a strong response of the sensor to pH change. Calibration plots in droplet calibration yielded lifetime ratio values with small standard deviations of pH values, which were 0.05 pH units on average. The dynamic range was defined as larger than 1% signal change within 0.1 pH units and determined to be from pH 4.91 to 7.47.
3.3. Cell Encapsulation and Cell Culture in Droplets
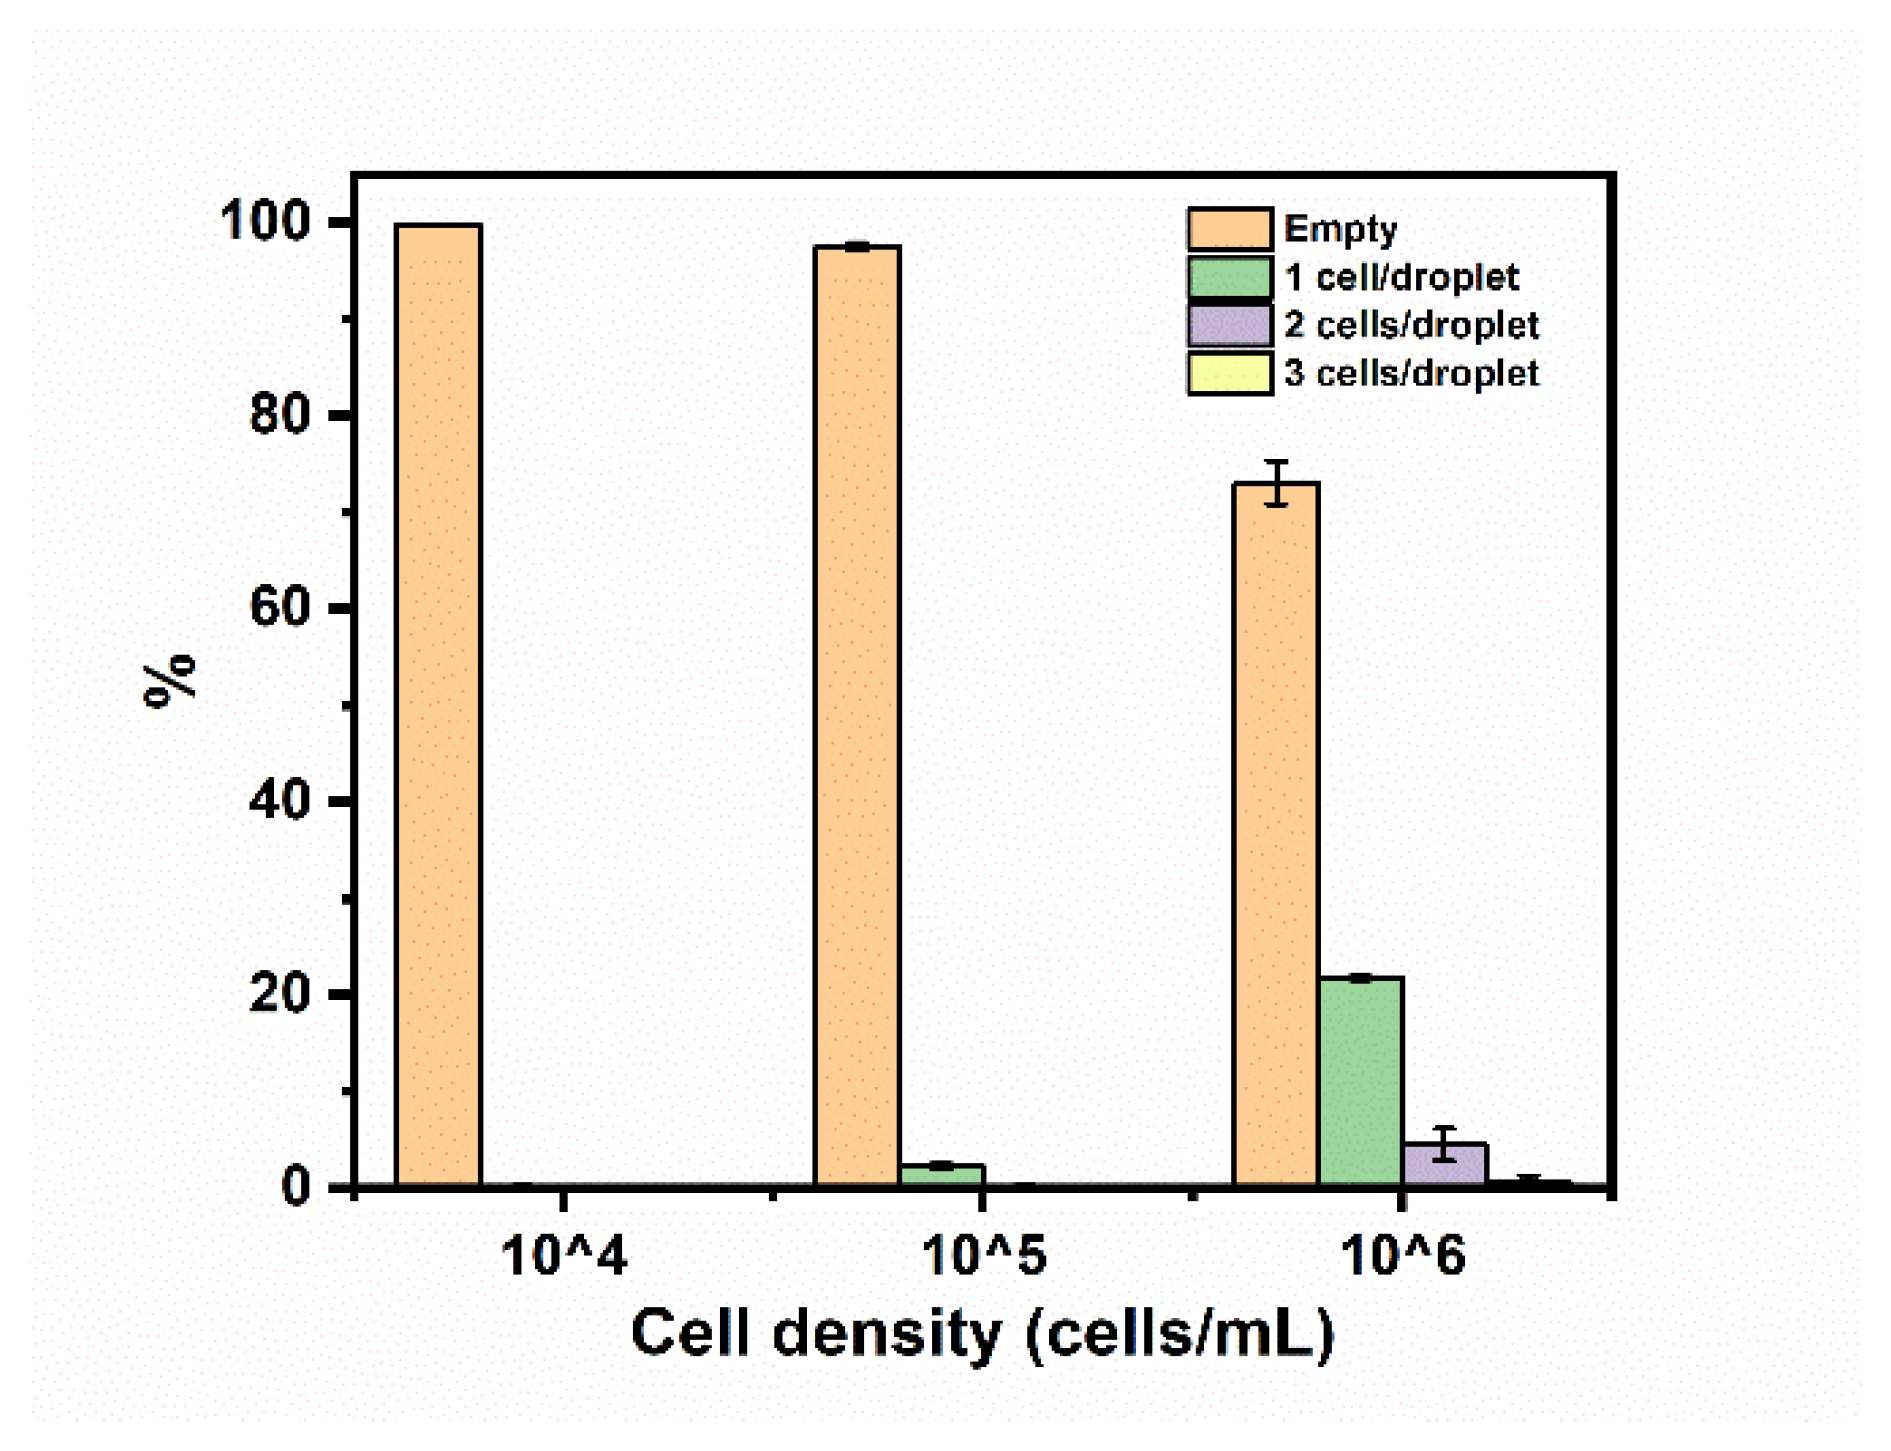
The droplets used to encapsulate cells were produced with a flow-focusing junction and conveyed to a downstream PDMS chamber. To validate this approach, a suspension of lung cancer cells (A549) was encapsulated in droplets in the presence of a culture medium. The cells were originally suspended in a culture medium at concentrations of 10
4, 10
5, and 10
6 cells per mL, respectively, and dispersed in the continuous phase in droplets that were 50 µm in diameter. The cell capture distribution was tabulated, as shown in
Figure 8. The percentages of droplets containing cells increased when the cell density increased. The portion of droplets containing single cells reached 21.7 ± 0.2% when a cell concentration of 10
6 cells mL
−1 was used. This was determined to be the optimal live cell concentration for occupancy and observation through the CCD camera during measurements in the PDMS chamber. There were a few droplets containing more than one cell which had minimal influence on the detection and observation of single cells.
The droplets were generated by Pickering emulsions stabilized by Ru(phen)
3 Cl
2-doped F-SiO
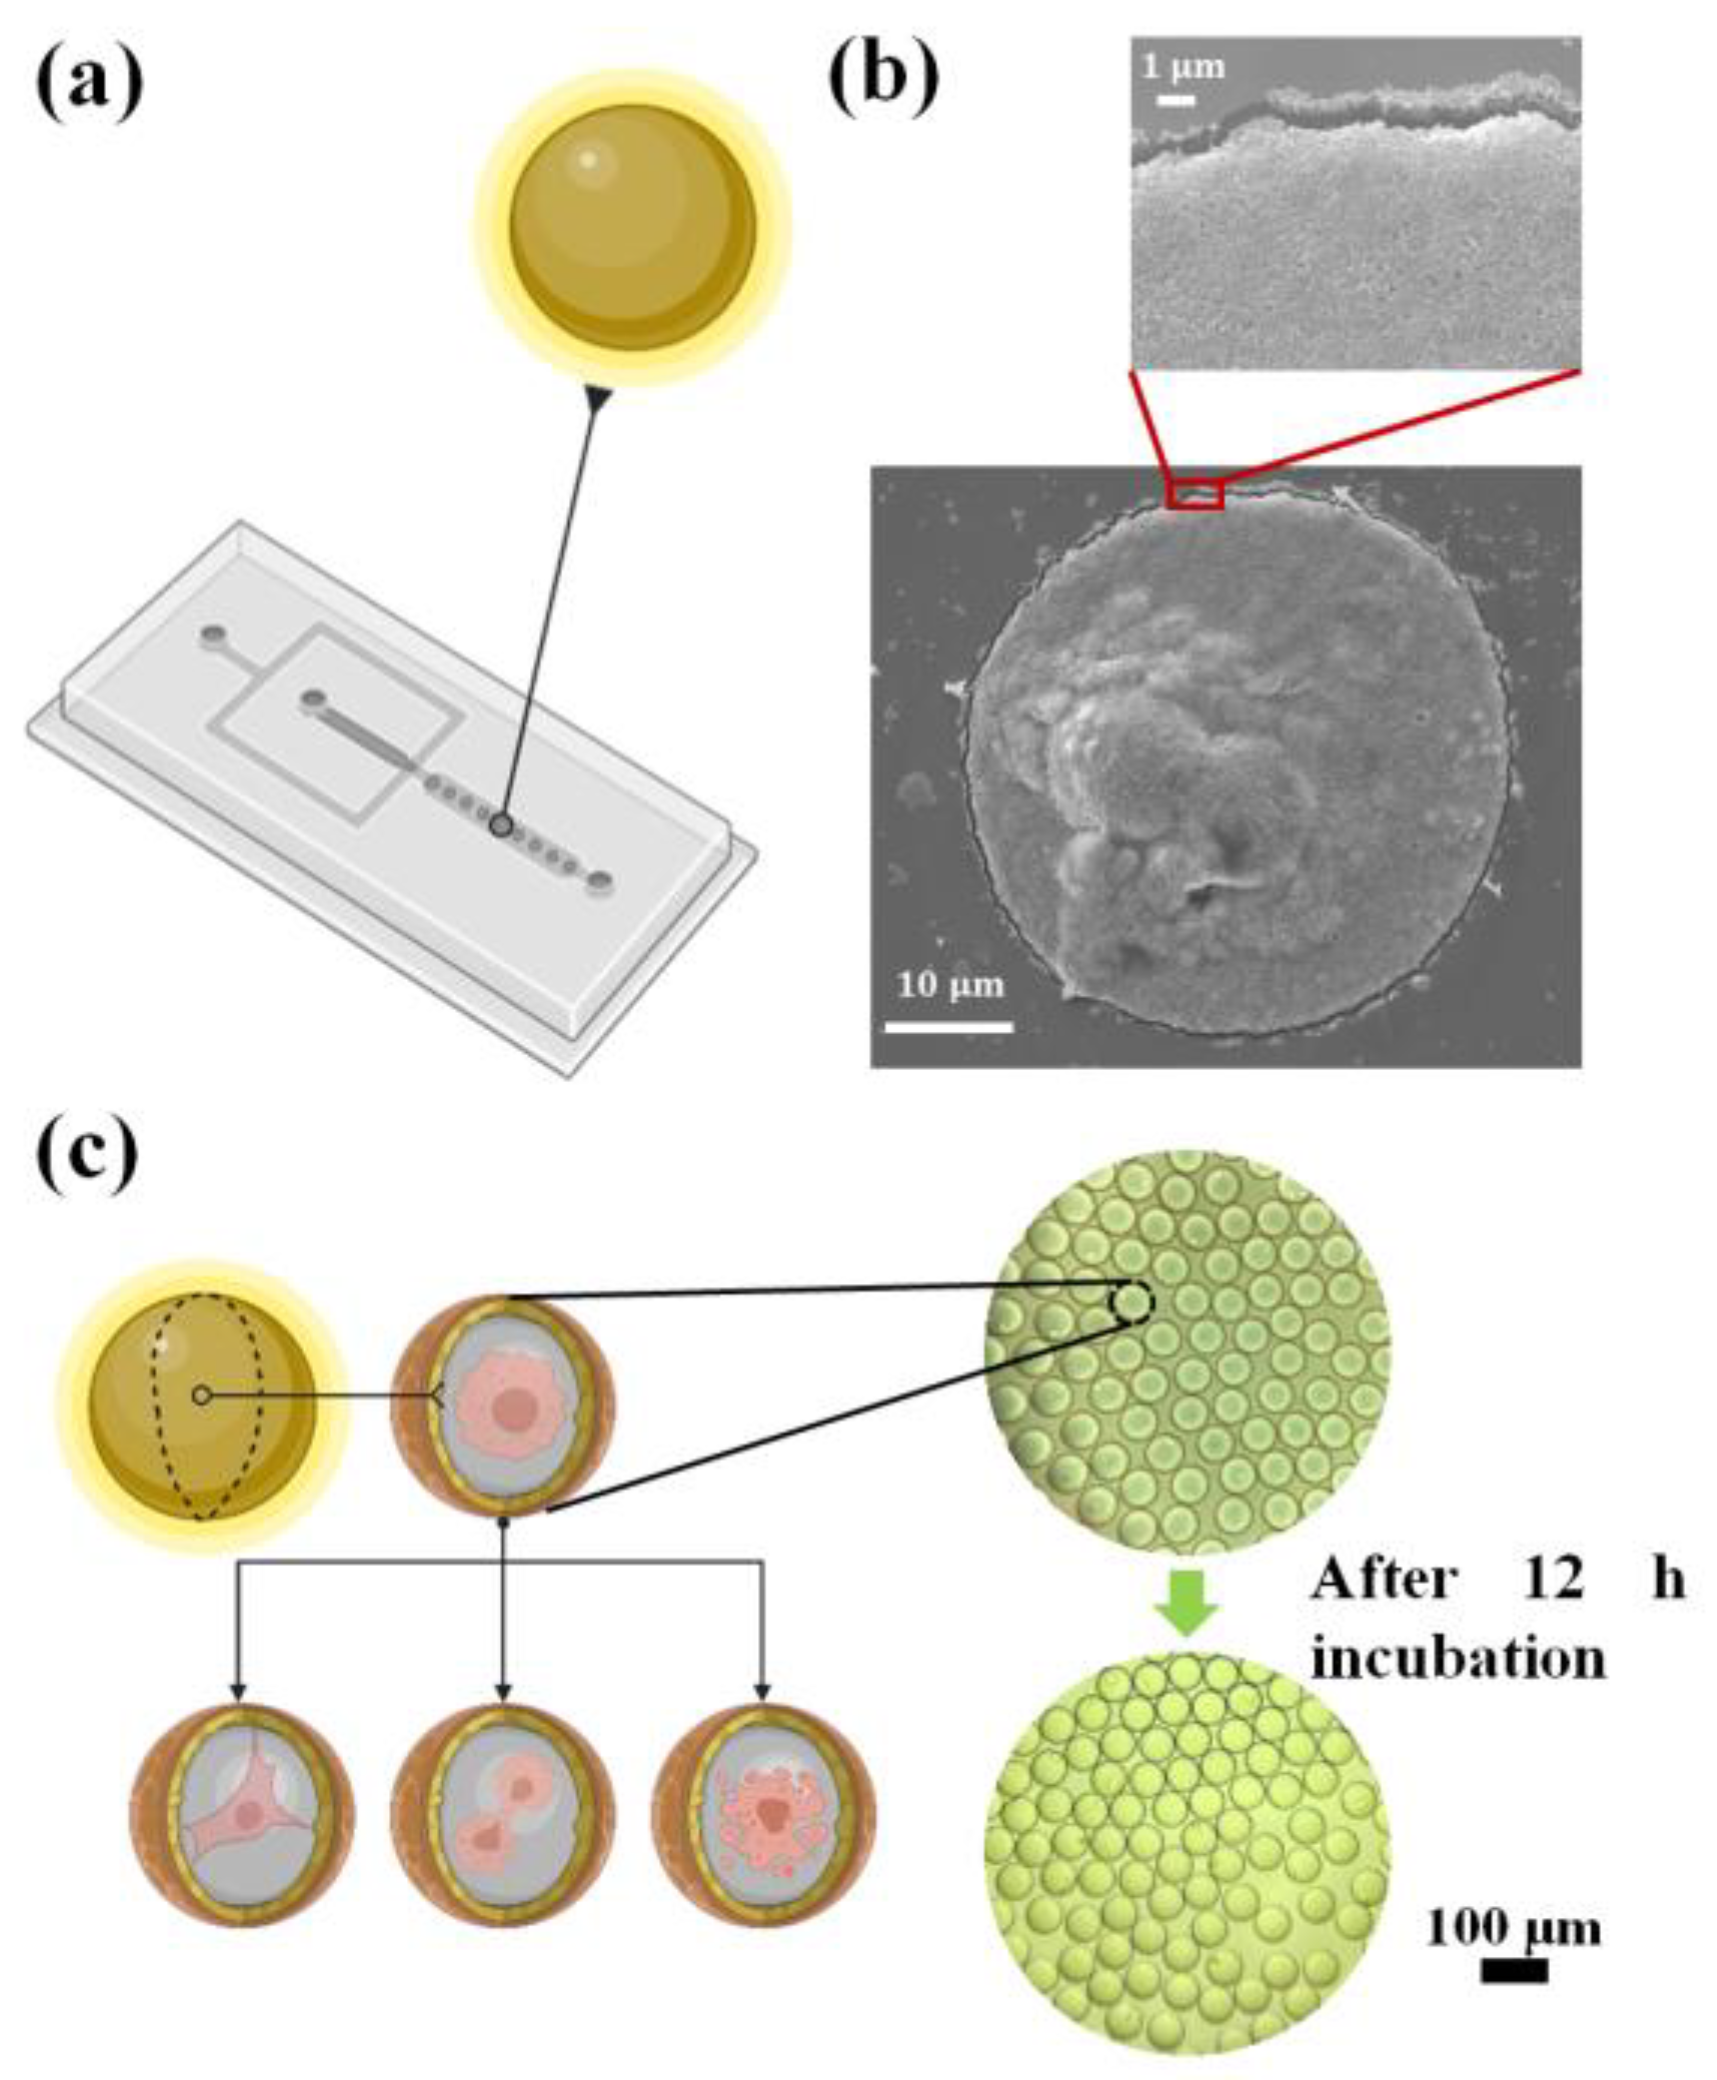
2-FITC nanoparticles. The cells and medium were encapsulated in the droplets and maintained in the PDMS chamber for incubation (
Figure 9a). In
Figure 9b, an SEM image showed an evaporated droplet with two cells that the nanoparticles covered completely. The uniformity of the nanoparticles in the evaporated droplet confirmed that the F-SiO
2-FITC NPs had completely encapsulated the cell medium and the cells, even during the transfer from the microfluidic chip to the silica substrate for imaging.
After capturing the drops into a PDMS chamber, the HFE-7500 continuous phase containing the F-SiO2-FITC NPs was replaced with FC-40, which is a fully fluorinated hydrocarbon liquid with a high boiling point, by carefully injecting from the same inlet of the HFE-7500 continuous phase. This helped remove the excess nanoparticles, prevented droplets from coalescing, and mitigated evaporation of the continuous phase during cell incubation.
The cells in the droplets were incubated in a custom-made incubator in a humidified atmosphere with 5% CO
2, maintained at 37 °C. Culture conditions were similar to those used in conventional tissue culture, and therefore the cells in the droplets were able to adhere and proliferate (
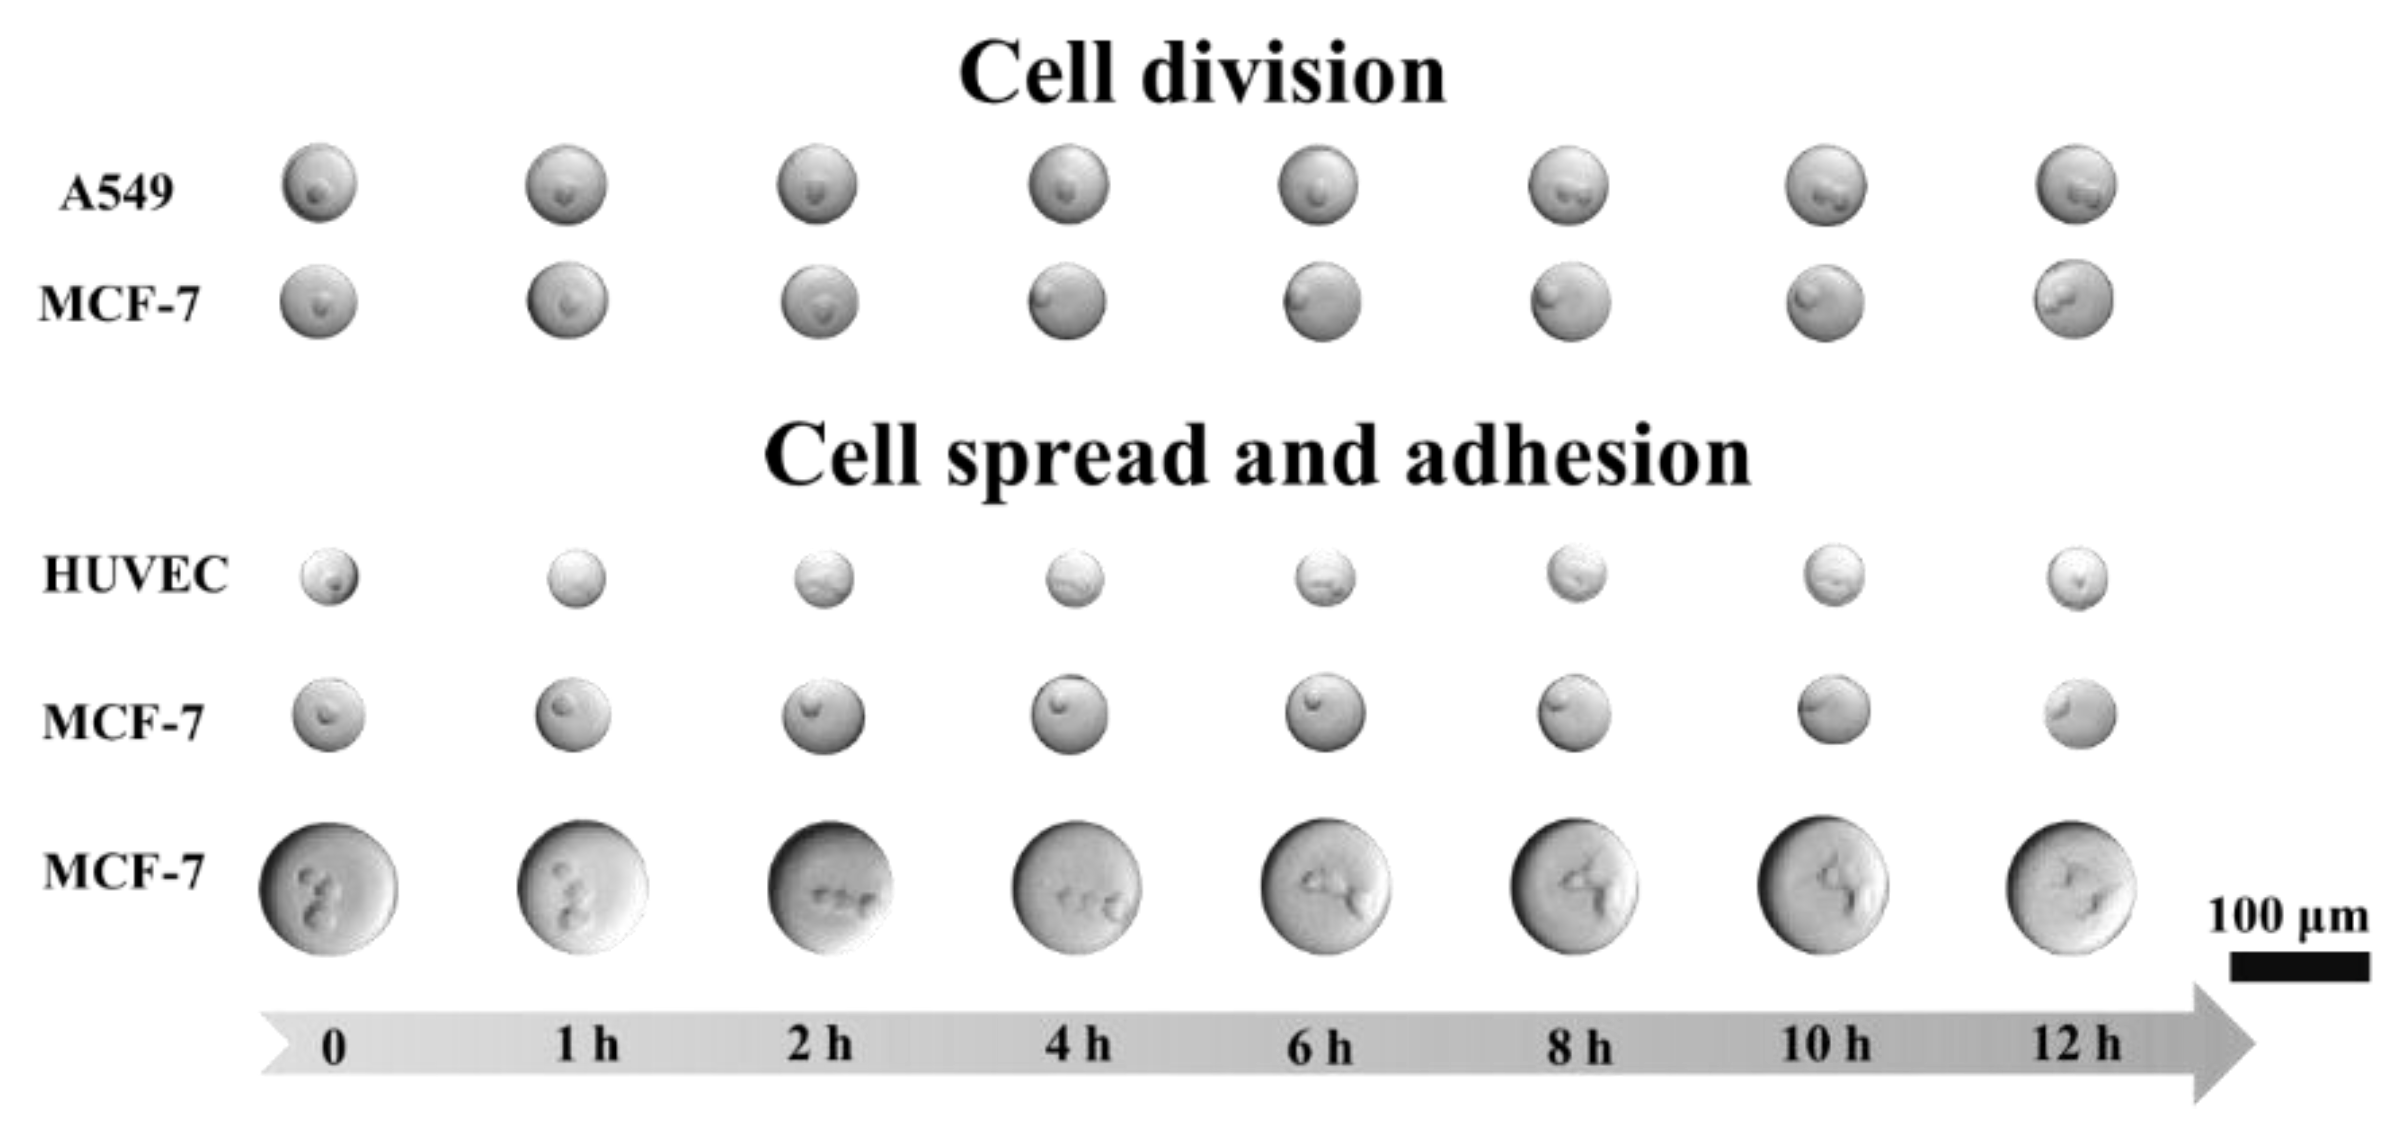
Figure 9c). After a 12-h incubation, it could be observed under the microscope that around 60% of the cells had adhered to the interface of the droplets while some of the cells became mammospheres. To monitor the growth of single cells in their droplets, the adherent cell lines (MCF-7, A549, and HUVEC) were encapsulated in the droplets and observed using an imaging platform comprised of a microscope and custom-made incubator (
Figure 10).
MCF-7 cells were encapsulated into 50 µm droplets. They tended to spread after 8 h, divide by 10 h, and fully adhere after 12 h. The A549 cells divided after an 8-h incubation. HUVEC cells were incubated in 30 µm droplets, spread within one hour, and shrunk after 12 h, which may indicate apoptosis. To investigate the effect of the droplets on cell adhesion, 100 µm droplets with MCF-7 cells were incubated. It was observed that the cells started spreading at the 6th hour and adhered after incubating for 12 h.
Cells exert contractile forces on their substrates as they spread and adhere, and the substrates must be able to withstand these contractions. The F-SiO2-FITC nanoparticles retained at the interface of an aqueous phase and fluorous phase stabilized the dispersed aqueous droplets and formed a solid-like substrate for cell adhesion, which could withstand the forces generated by cells. Coalescence or leakage of droplets caused by cell growth was not observed during incubation and measurements. Moreover, these nanoparticles and PDMS were gas permeable, allowing air and CO2 in the incubator to diffuse to cells in the droplets. Supplied with a culture medium and anchored on the solid-like nanoparticle interface, cells were able to grow in the droplets.
In the majority of previous studies, droplet cell culture has utilized suspension cells or cell lines capable of aggregating into spheroids, due to the low rigidity of the surfactant-stabilized interface [
39]. Conventionally, a matrix such as collagen or matrix gel was used to derive a scaffold system for 3D cell cultures to promote and maintain normal cell morphology [
40]. The droplets stabilized by the rigid colloidal surfactant in this work can provide new opportunities for culturing adherent cells and exploring the interaction between the ECM and single cells.
3.4. Real-Time Monitoring of Extracellular pH in Droplets
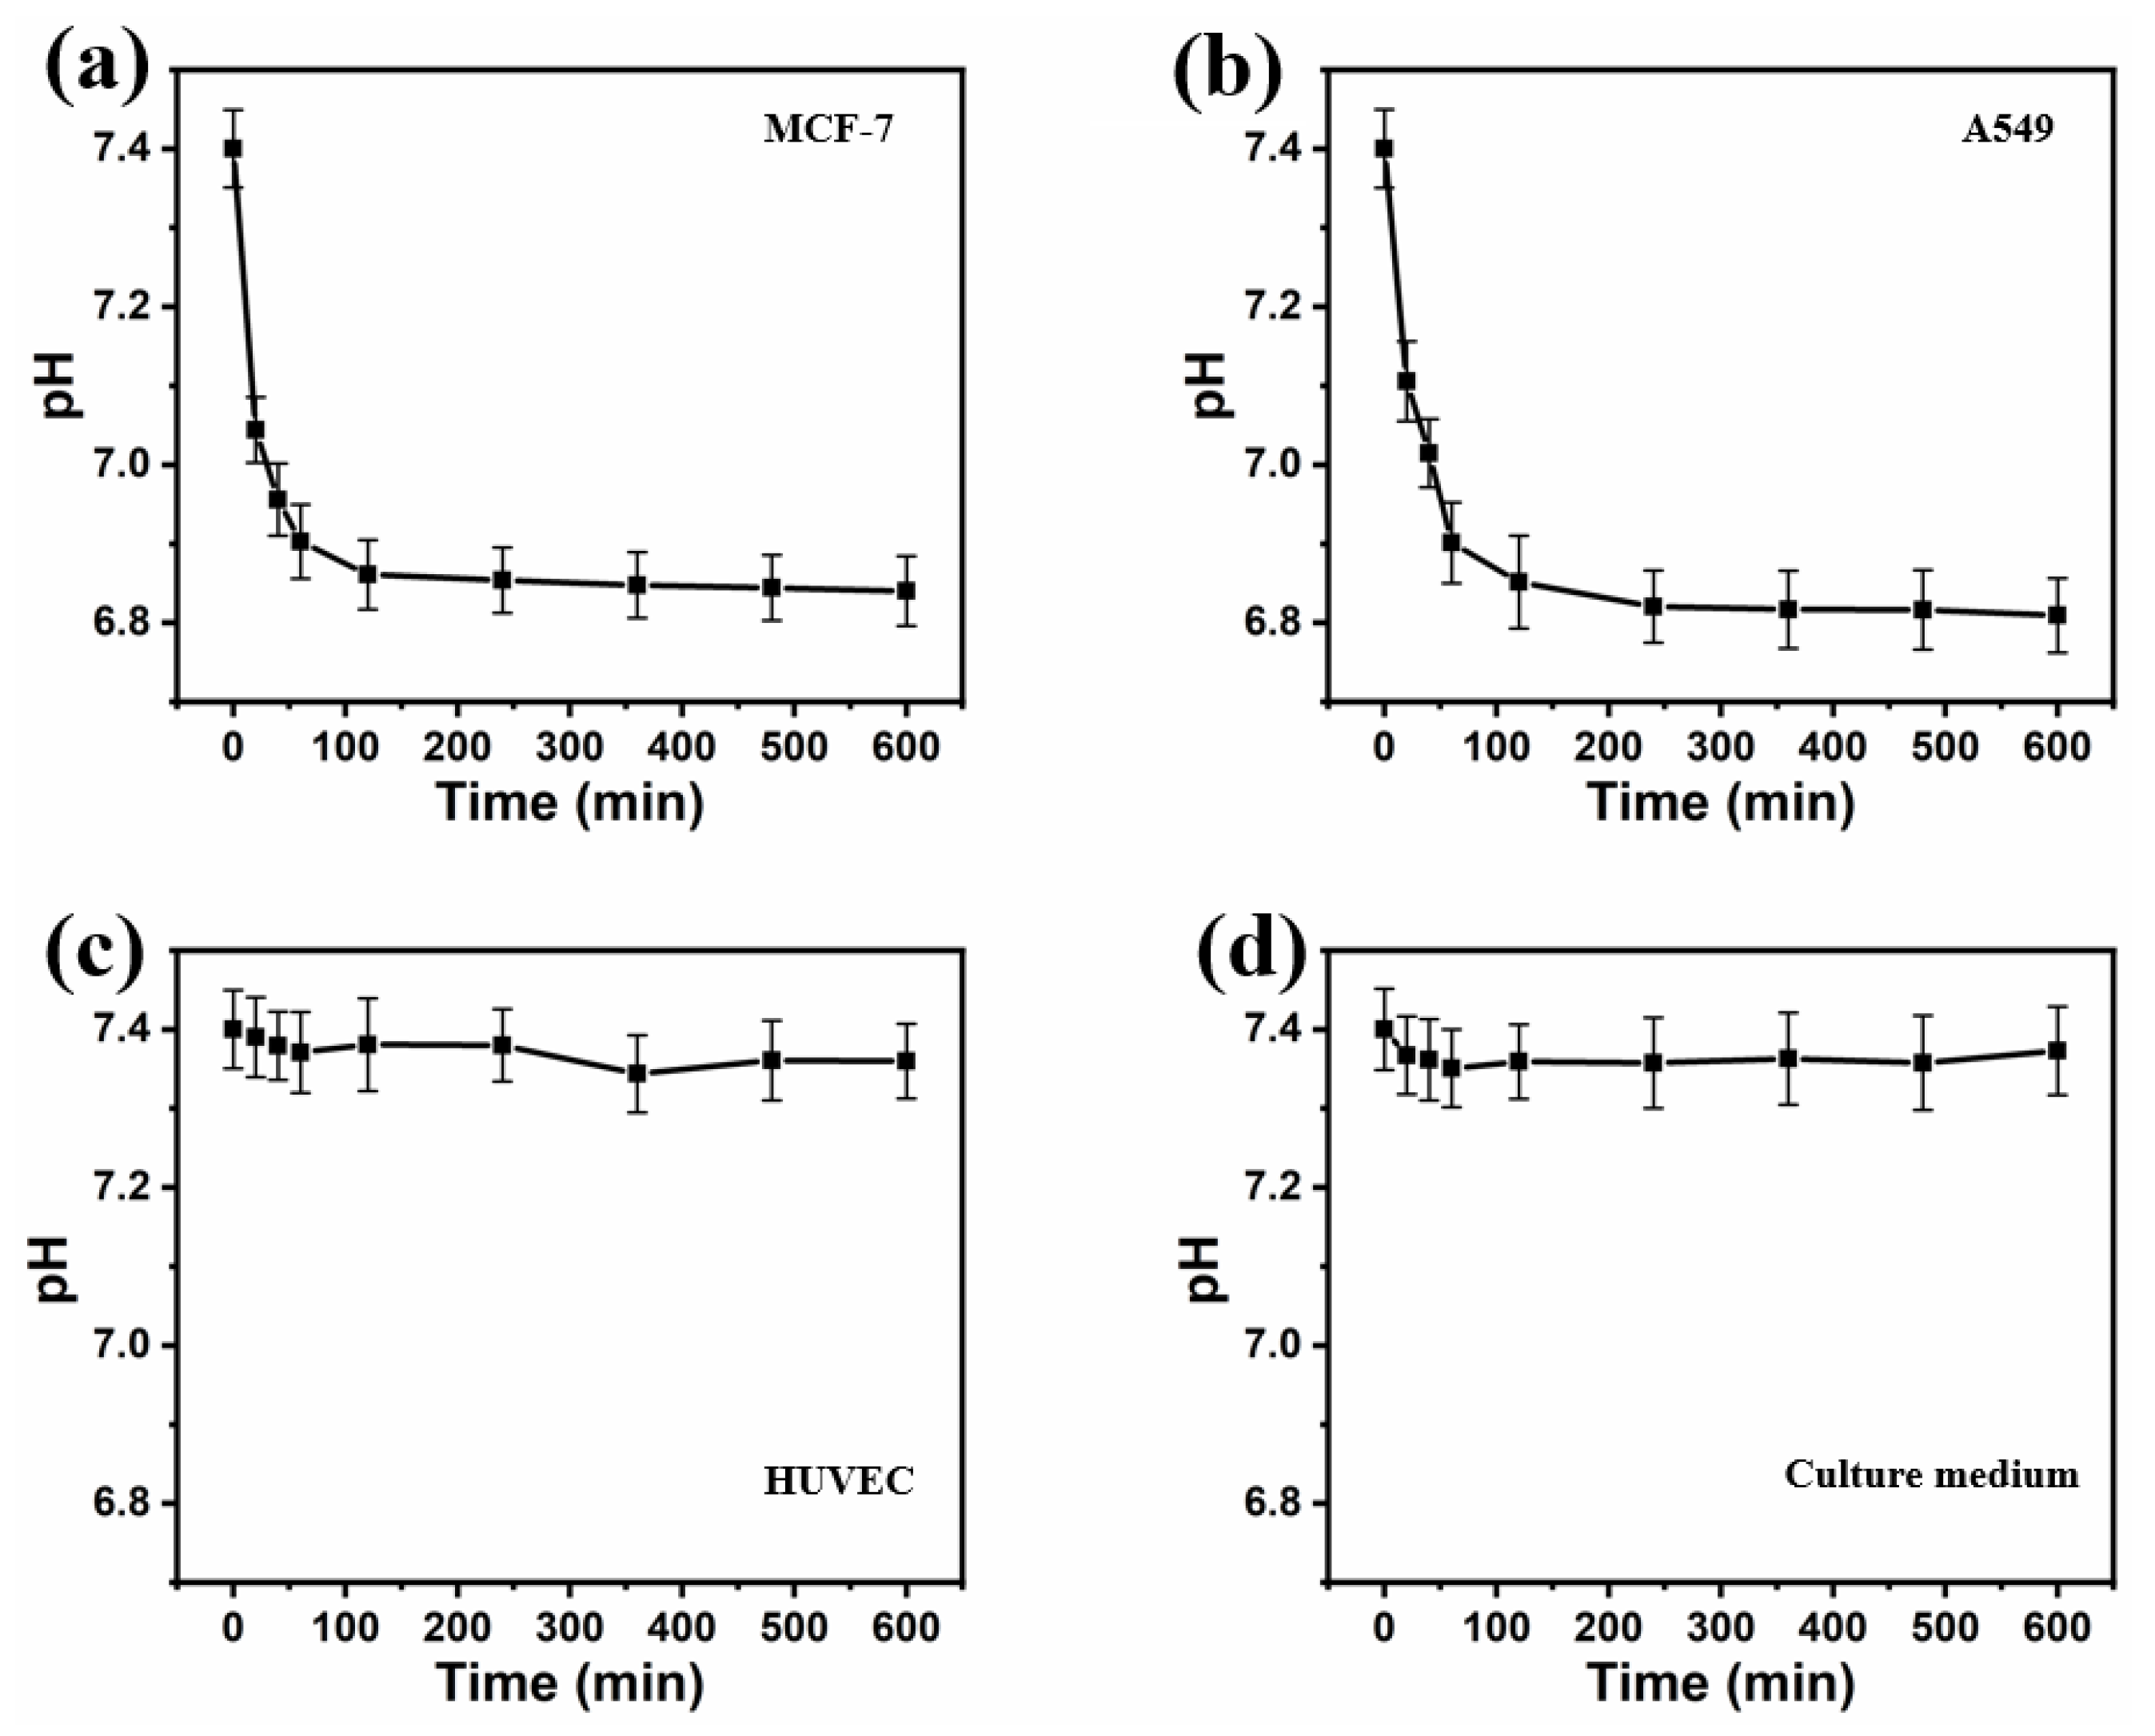
For respiration monitoring, human breast carcinoma MCF-7 cells and human lung carcinoma A549 cells were utilized as cancer cell models, and human umbilical vein endothelial cells (HUVECs) were used as a healthy cell model. As the cells consumed nutrients while in the droplets, FITC coupled onto the nanoparticles was able to detect pH changes associated with metabolic products, such as carbon dioxide and lactic acid generated by cellular respiration and dissolved in the ECM.
The pH
e value for the different cell lines was observed to decrease to different extents: the pH
e of cancer cells decreased to a much larger degree than that of healthy cells (
Figure 11). For MCF-7 and A549 cells, the extracellular pH in the microenvironment within the droplets dropped rapidly in the first hour from 7.40 ± 0.05 to 6.90 ± 0.04 (MCF-7) and from 7.40 ± 0.05 to 6.90 ± 0.04 (A549), then decreased gradually to 6.84 ± 0.04 and 6.81 ± 0.04 in the remaining 9 h of incubation, respectively. This result was slightly higher than the reported extracellular pH of cancer cells, which should be below 6.8 [
41,
42]. This may be explained by the lower cell density in the droplets, compared to densities in cancer tissue or conventional cancer cell tissue cultures [
16]. The increased extracellular acidification of the cancer cell lines was most likely due to their increased reliance on anaerobic glycolysis (Warburg effect) to yield adenosine triphosphate (ATP). This means they release more lactic acid, resulting in a more pronounced decrease in pH around the cancer cells.
Incubating for 10 h, the pHe of HUVECs declined slightly from 7.40 ± 0.03 to 7.36 ± 0.03. The pH value in the medium alone decreased from 7.40 ± 0.05 to 7.35 ± 0.05 during the first 60 min, and maintained a pH of around 7.36 ± 0.06 for the remainder of the incubation. The initial pH decrease is likely due to carbon dioxide dissolving into the medium from the incubator.
The acidosis of the extracellular medium is a feature of cancer cells that distinguishes them from normal cells. The decrease in pH due to the metabolic processes of cancer cells was clearly detectable, whereas healthy cells did not show any pH decrease larger than the margin of error. This differential acidification could enable distinguishing cancer cells from healthy cells at a single-cell level.
4. Conclusions
In summary, we developed, characterized, and applied fluorescein-conjugated and Ru(phen)3 Cl2-doped fluorinated silica nanoparticles as droplet-forming colloidal surfactants which can monitor pH changes of single cells. The pH could be calculated based on a time-domain lifetime referencing measurement method. The Ru(phen)3 Cl2-doped F-SiO2-FITC nanoparticles can not only facilitate the generation of microdroplets with good stabilities but can also function as a solid-like substrate for adherent cell culture in droplets without needing additional scaffolds.
The main advantages of these nanoparticles are their stability and non-invasive measurements of droplet and cell culture medium pH in real-time, which creates an opportunity for integrated optical sensing in droplet-based diagnostic screening. The described method could be developed and refined further by optimizing the choice of fluorochrome with respect to the desired pH range, photostability, spectral range, and other properties as well as the optical and electronic setup similar to commercial equipment for larger formats such as microplates.
Coupled with an automated setup, such as laser-equipped microscopes with field programmable gate arrays, the droplets generated with these nanoparticles may be used to develop high-throughput applications, such as screening for circulating tumor cells or anti-cancer drugs.


