Article

High-Temperature-Sensing Smart Bolt Based on Indium Tin Oxide/In2O3 Thin-Film Thermocouples with Nickel-Based Single-Crystal Superalloy via Screen Printing

1
State Key Laboratory for Manufacturing Systems Engineering, Institute of Precision Engineering, School of Mechanical Engineering, Xi’an Jiaotong University, Xi’an 710049, China
2
Beijing Aerospace Technology Research Institute, Beijing 100074, China
*
Author to whom correspondence should be addressed.
Chemosensors 2022, 10(9), 347; https://doi.org/10.3390/chemosensors10090347
Submission received: 1 August 2022 / Revised: 17 August 2022 / Accepted: 20 August 2022 / Published: 23 August 2022
(This article belongs to the Special Issue Novel Materials for Sensing, Imaging and Energy Conversion/Storage)

Abstract

:
In this study, thin-film thermocouples (TFTCs) were combined with a smart bolt to design a smart bolt that can directly test high temperature in service monitoring and parameter calculation for gas turbine structure design. The first-principles calculation was used to analyze the design of the surface properties of nickel-based alloys and insulating layers, and finite element analysis was used to optimize dimension parameters by controlling the thermal stress matching of insulating layers and sensitive layers. The effect of the glass powder with different particle sizes on the microstructure of the ITO and In2O3 films was studied via SEM. The preferred particle size of the additive glass powder is 400 nm. The XRD pattern shows the (222) peak has the highest intensity. The intensities of the (222) and (622) peaks increase after the heat treatment. The calibration results show that the average Seebeck coefficient of the TFTCs can reach 64.9 μV/°C at 1100 °C with a maximum voltage of 71.4 mV. The repeatability error of the cycles of the sensor after heat treatment is ±1.05%. The repeatability of the sensor is up to 98.95%. The smart bolts were tested for application in small aero engines. It can be seen that under the impact of 1000 °C, the thermal response of the prepared smart bolt is better than that of the K-type armored thermocouple, and the thermal balance is achieved faster. The intelligent bolt sensor proposed in this work has better engineering application prospects owing to its convenience of installation in harsh environments.

1. Introduction

Temperature data have been used to represent conditions in service monitoring in high-temperature and high-pressure harsh environments and to calculate the parameters of gas turbine structures. With the advancement in the research on aero engines with high thrust-to-weight ratio, the service temperature and service duration of the combustion chamber of gas turbines operating in harsh environments have been steadily increasing [1,2]. In addition, the temperature of the inner wall of an aircraft is a key parameter for characterizing supersonic combustion. To perform high-temperature measurements [3,4], various thermal sensors (e.g., thermocouples, optical pyrometers, acoustic pyrometers, and thermal resistance sensors) have been developed. However, these thermal sensors are affected by several issues. For example, optical fibers obstruct the flow field, and real-time thermal paint measurements are not possible.
Thin-film thermocouples (TFTCs) are a novel type of microsensor based on the microelectromechanical system (MEMS) technology. TFTCs can be utilized to measure the surface temperature in situ and in real time [5,6,7,8]; furthermore, they exhibit high spatial resolution, low cost, high efficiency, fast response time [9,10], and negligible influence on the airflow [11,12,13].
The materials employed in the fabrication of TFTCs for aero-engine applications should have a high thermal stability, a high melting point, and a relatively large Seebeck coefficient. Ceramic substrates have good insulating properties in high-temperature stability, and there is no need to deposit an insulating layer between the substrate and the sensitive layer such as the positive film or negative film. In 2016, Qiang [14] prepared TFTCs on an Al2O3 substrate using Ti and Cr as transition layers. With the addition of the transition layer, the thermocouple service performance improved. Rivera [15] prepared a SiC/Pt TFTC with a large Seebeck coefficient, which however could only work below 1000 °C. Yakaboylu [16] deposited MoSi2 and WSi2-based ceramic composite thick films on Al2O3 substrates via the screen-printing technique. These films exhibited stable thermoelectric performance at 1350 °C with a peak thermoelectric voltage of 19.3 mV. In order to overcome the issues of the traditional temperature sensors in measuring the temperature of SiC-based ceramic matrix composite (CMC) engine components, Rivera [17] prepared an indium tin oxide (ITO):SiC CMC thermocouple. The thermoelectric output of this thermocouple was found to be an order of magnitude larger than that of K-type thermocouples. Zhang [18] prepared highly thermally stable W–Re (95% W/5% Re vs. 74% W/26% Re) TFTCs. The conductivity of these TFTCs was 17.1 S/m, which is approximately 15.2 times that of the W–Re sample the authors used for comparison, and the temperature time drift rate was 0.92 °C/h (at 1040 °C, over 5 h). Measurement errors can occur due to the different heat transfer rates between the ceramic substrate and the tested part, which will affect the test accuracy. On the other hand, TFTCs directly prepared on the surface of the tested part will short-circuit because the substrate material is mainly composed of Ni-based alloys. Usually, an insulating film is used to solve this problem. However, the resistivity of the insulating film is insufficient at high temperature. The thermal stress does not match due to the discrepancy in the thermal expansion coefficient between the insulating film and the sensitive layer film. Thus, the sensitive film detaches at high temperature, which is one of the major existing issues.
First-principles calculations are usually conducted to obtain information regarding the electronic structure of the interface in two films by solving the Schrodinger equation and to analyze the bonding condition and material properties of the interface. These calculations can be used to optimize the design of the surface properties of Ni-based alloys and insulating layers, thereby overcoming the issue of the thermal stress mismatch between the insulating layer and the sensitive layer. Jiang [19] elaborated a first-principles-based strategy to predict the macroscopic toughness of γ-Ni (Al)/α-Al2O3 interfaces. Ozfidan [20] studied the adhesion behavior of NiAl(110)/Al2O3(0001) interfacial thermal barrier coatings, focusing on the effects of the alloying of additives and impurity elements. Bao [21] found that Y doping significantly enhanced the tensile strength of the Ni(111)/α-Al2O3(0001) interface. However, in the research of TFTCs, the first principles are less applied to the design of material systems. In particular, when TFTCs are prepared on the surface of metal materials, an insulating layer needs to be added. The interfacial bonding will change, which increases the potential for material mismatch and performance instability at high temperatures. In this paper, a first-principles molecular model is established between the nickel-based single crystal surface and the alumina insulating layer for the first time. A qualitative study of the electronic properties was carried out to evaluate the bond strength between the alumina and the substrate.
In order to reduce the influence of sensor devices on measurements, the smart bolt concept has recently emerged as a strategy to monitor the pre-tightening force of bolts [22] and the status of bolt joints [23]. Smart bolts can directly replace the structural parts of a piece of equipment and at the same time realize the function of state testing without punching to install sensors. Traditional TFTCs need to be installed separately, which affects the operation of the equipment. We present a new smart bolt with ITO/In2O3 TFTCs and nickel-based single-crystal superalloy prepared via screen printing. Compared with WRe26/In2O3 probe-type TFTCs we published in RSI [24] (reached 93.7 mV at 700 °C and failed at higher temperature), the performance has been greatly improved. Compared with the traditional ITO/In2O3 probe based on a ceramic substrate (maximum 871 °C) [25], the maximum operating temperature has increased (1100 °C).
In this work, a TFTC is combined with a smart bolt to design a novel smart bolt that can directly test high temperatures. The density of states, population, and electron density of the interface between a Ni-based alloy substrate and an Al2O3 film were analyzed to estimate the bonding between alumina and the substrate via first-principles calculations. The thermal stress of the TFTC, Al2O3 insulating film, and Ni-based single-crystal superalloy was calculated by finite element analysis to optimize the dimensions. The effect of the glass powder with different particle sizes on the microstructure of the ITO and In2O3 films was studied via SEM. The smart bolts were tested for application in small aero engines. It can be seen that under the impact of 1000 °C, the thermal response of the prepared smart bolt is better than that of the K-type armored thermocouple, and the thermal balance is achieved faster.

2. Materials and Methods

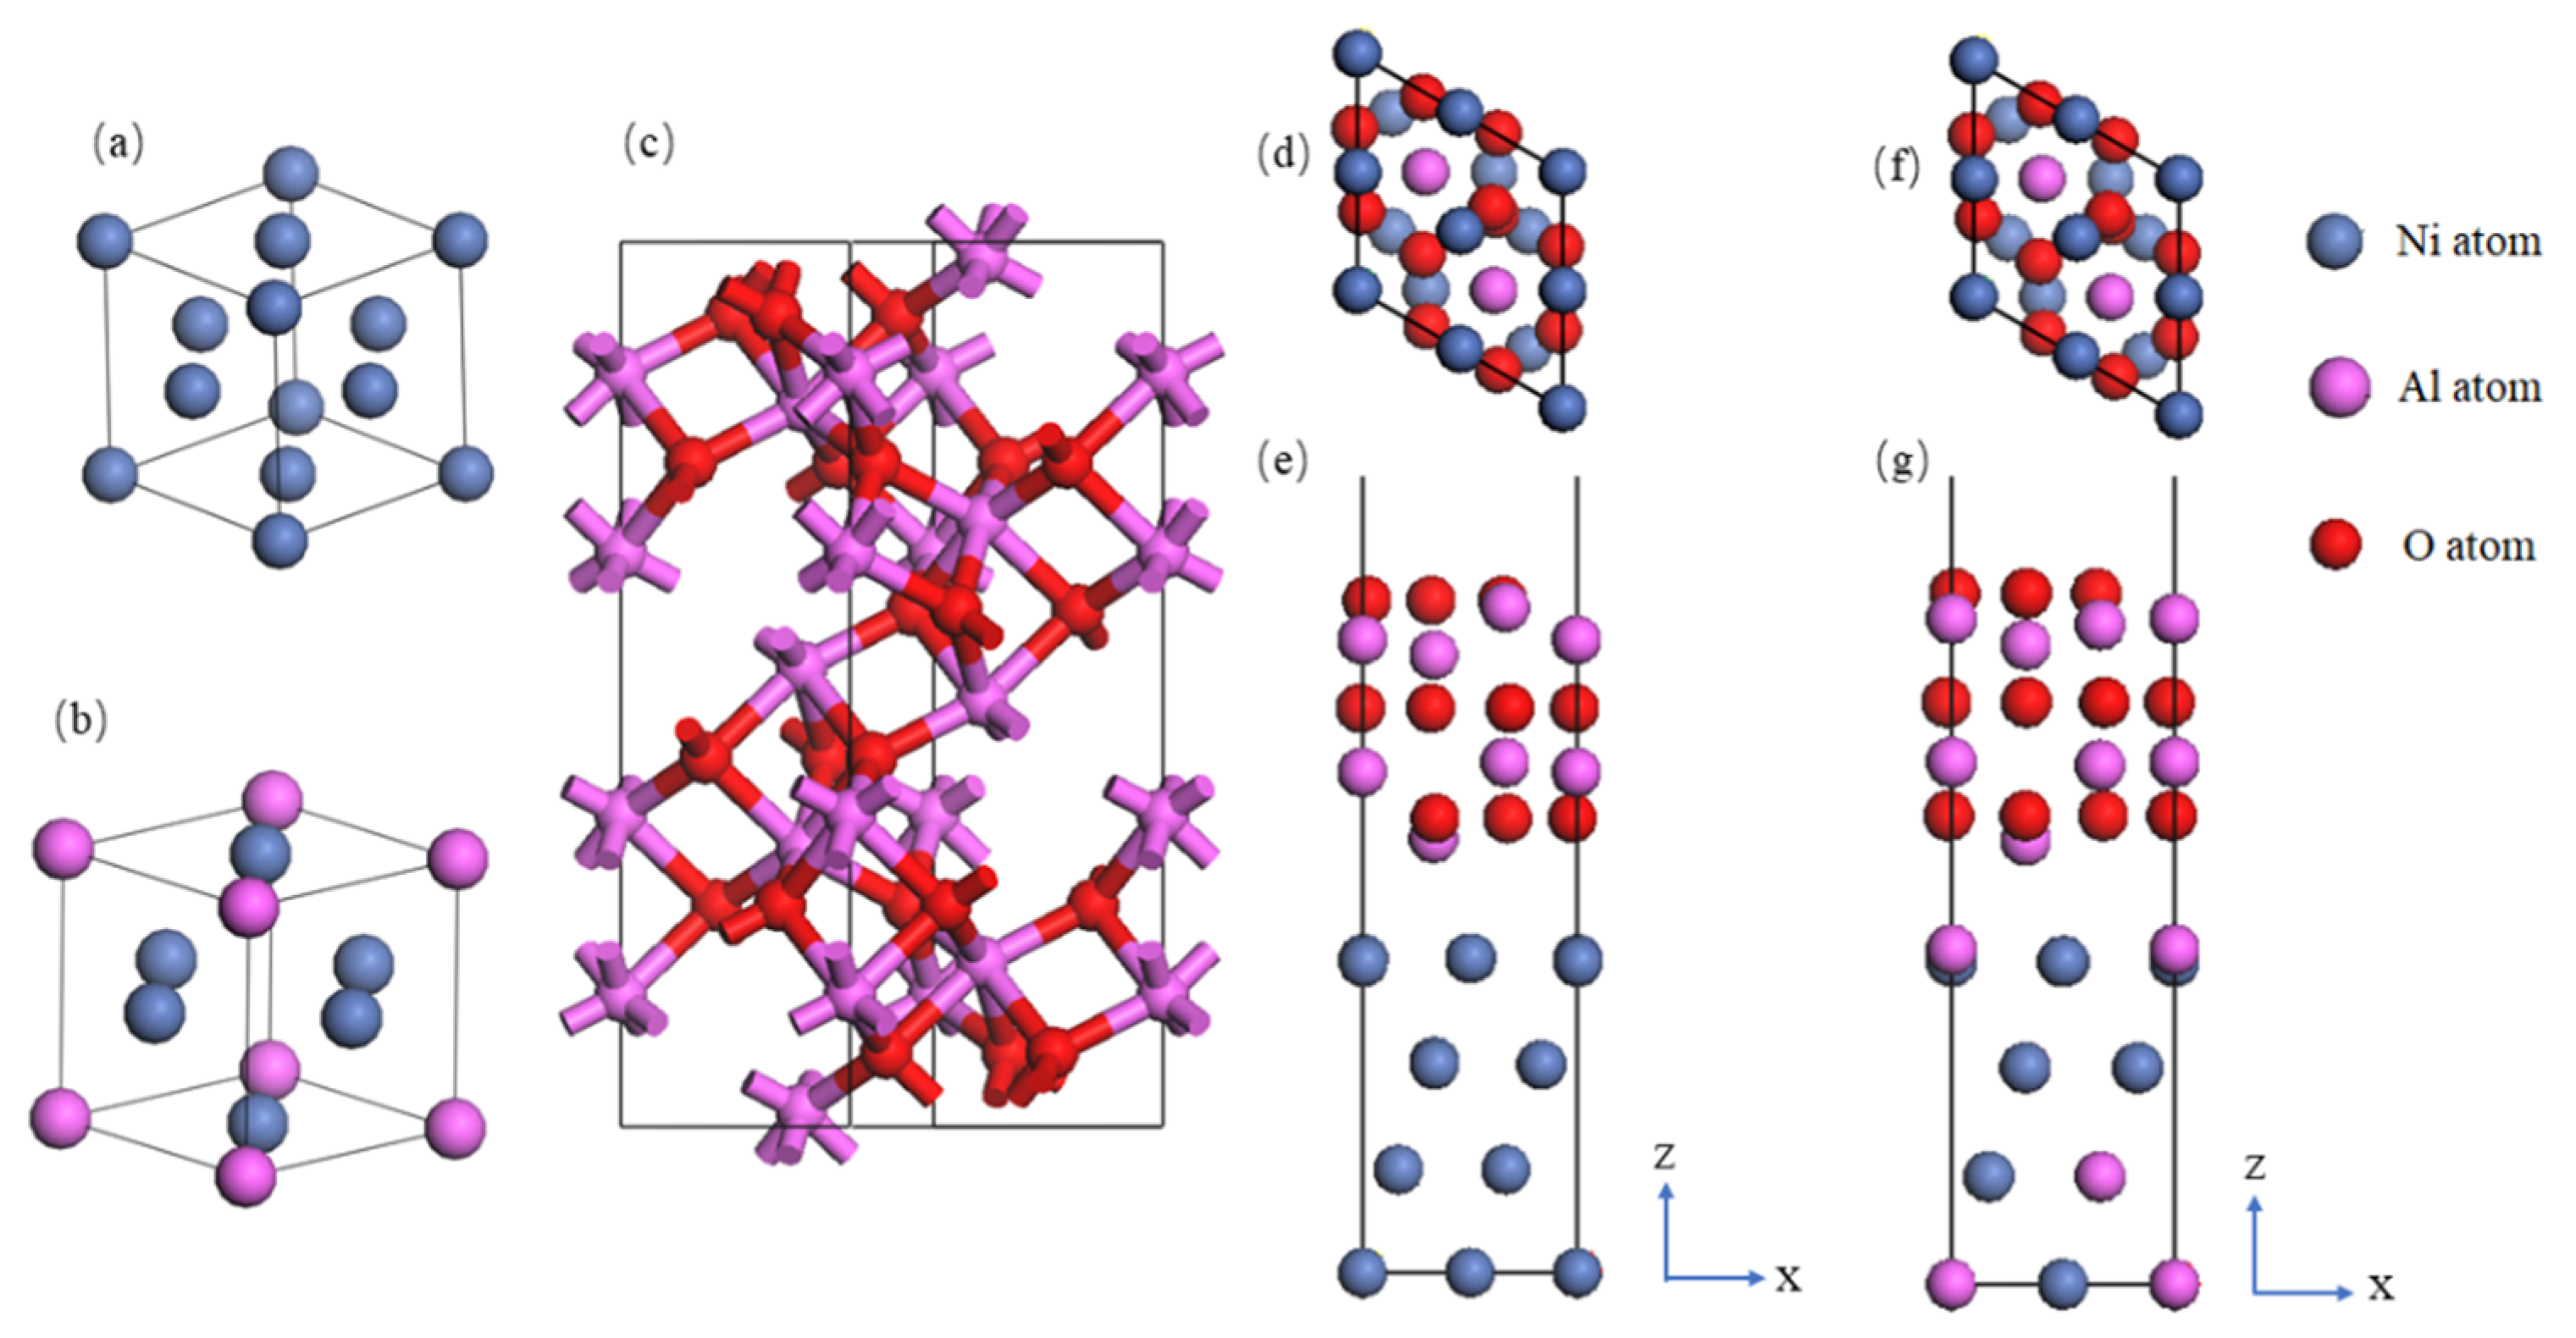
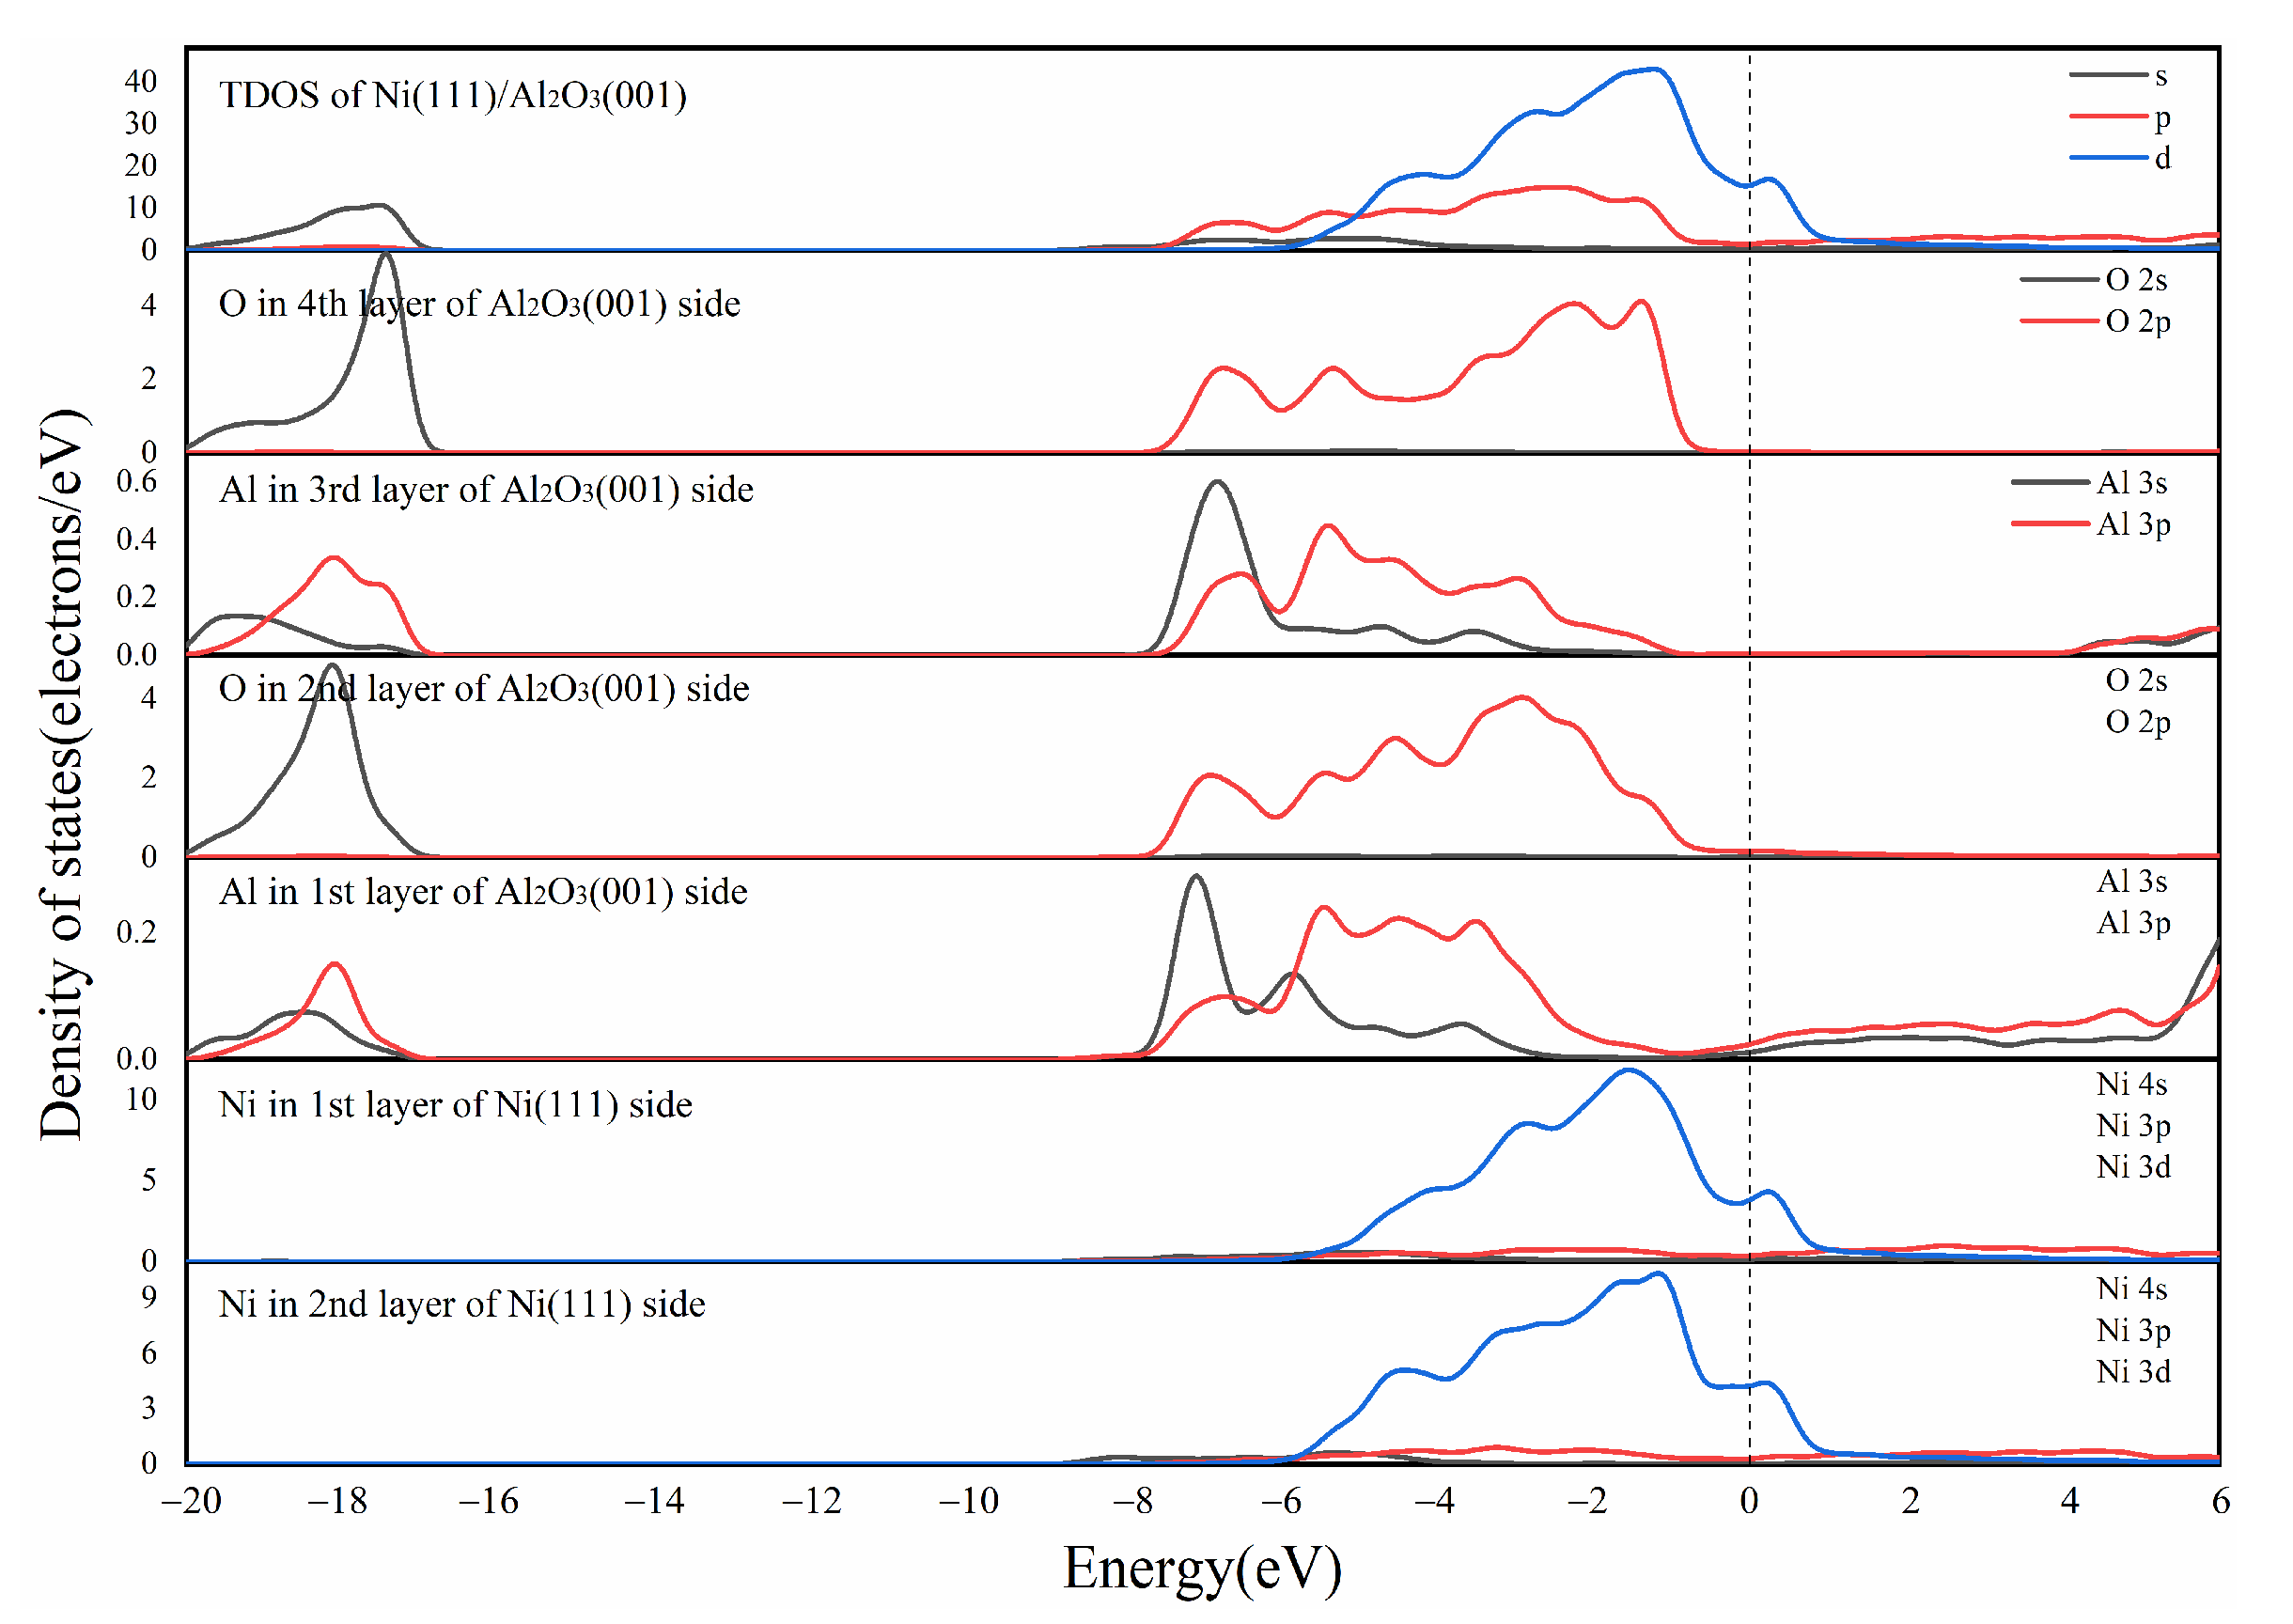
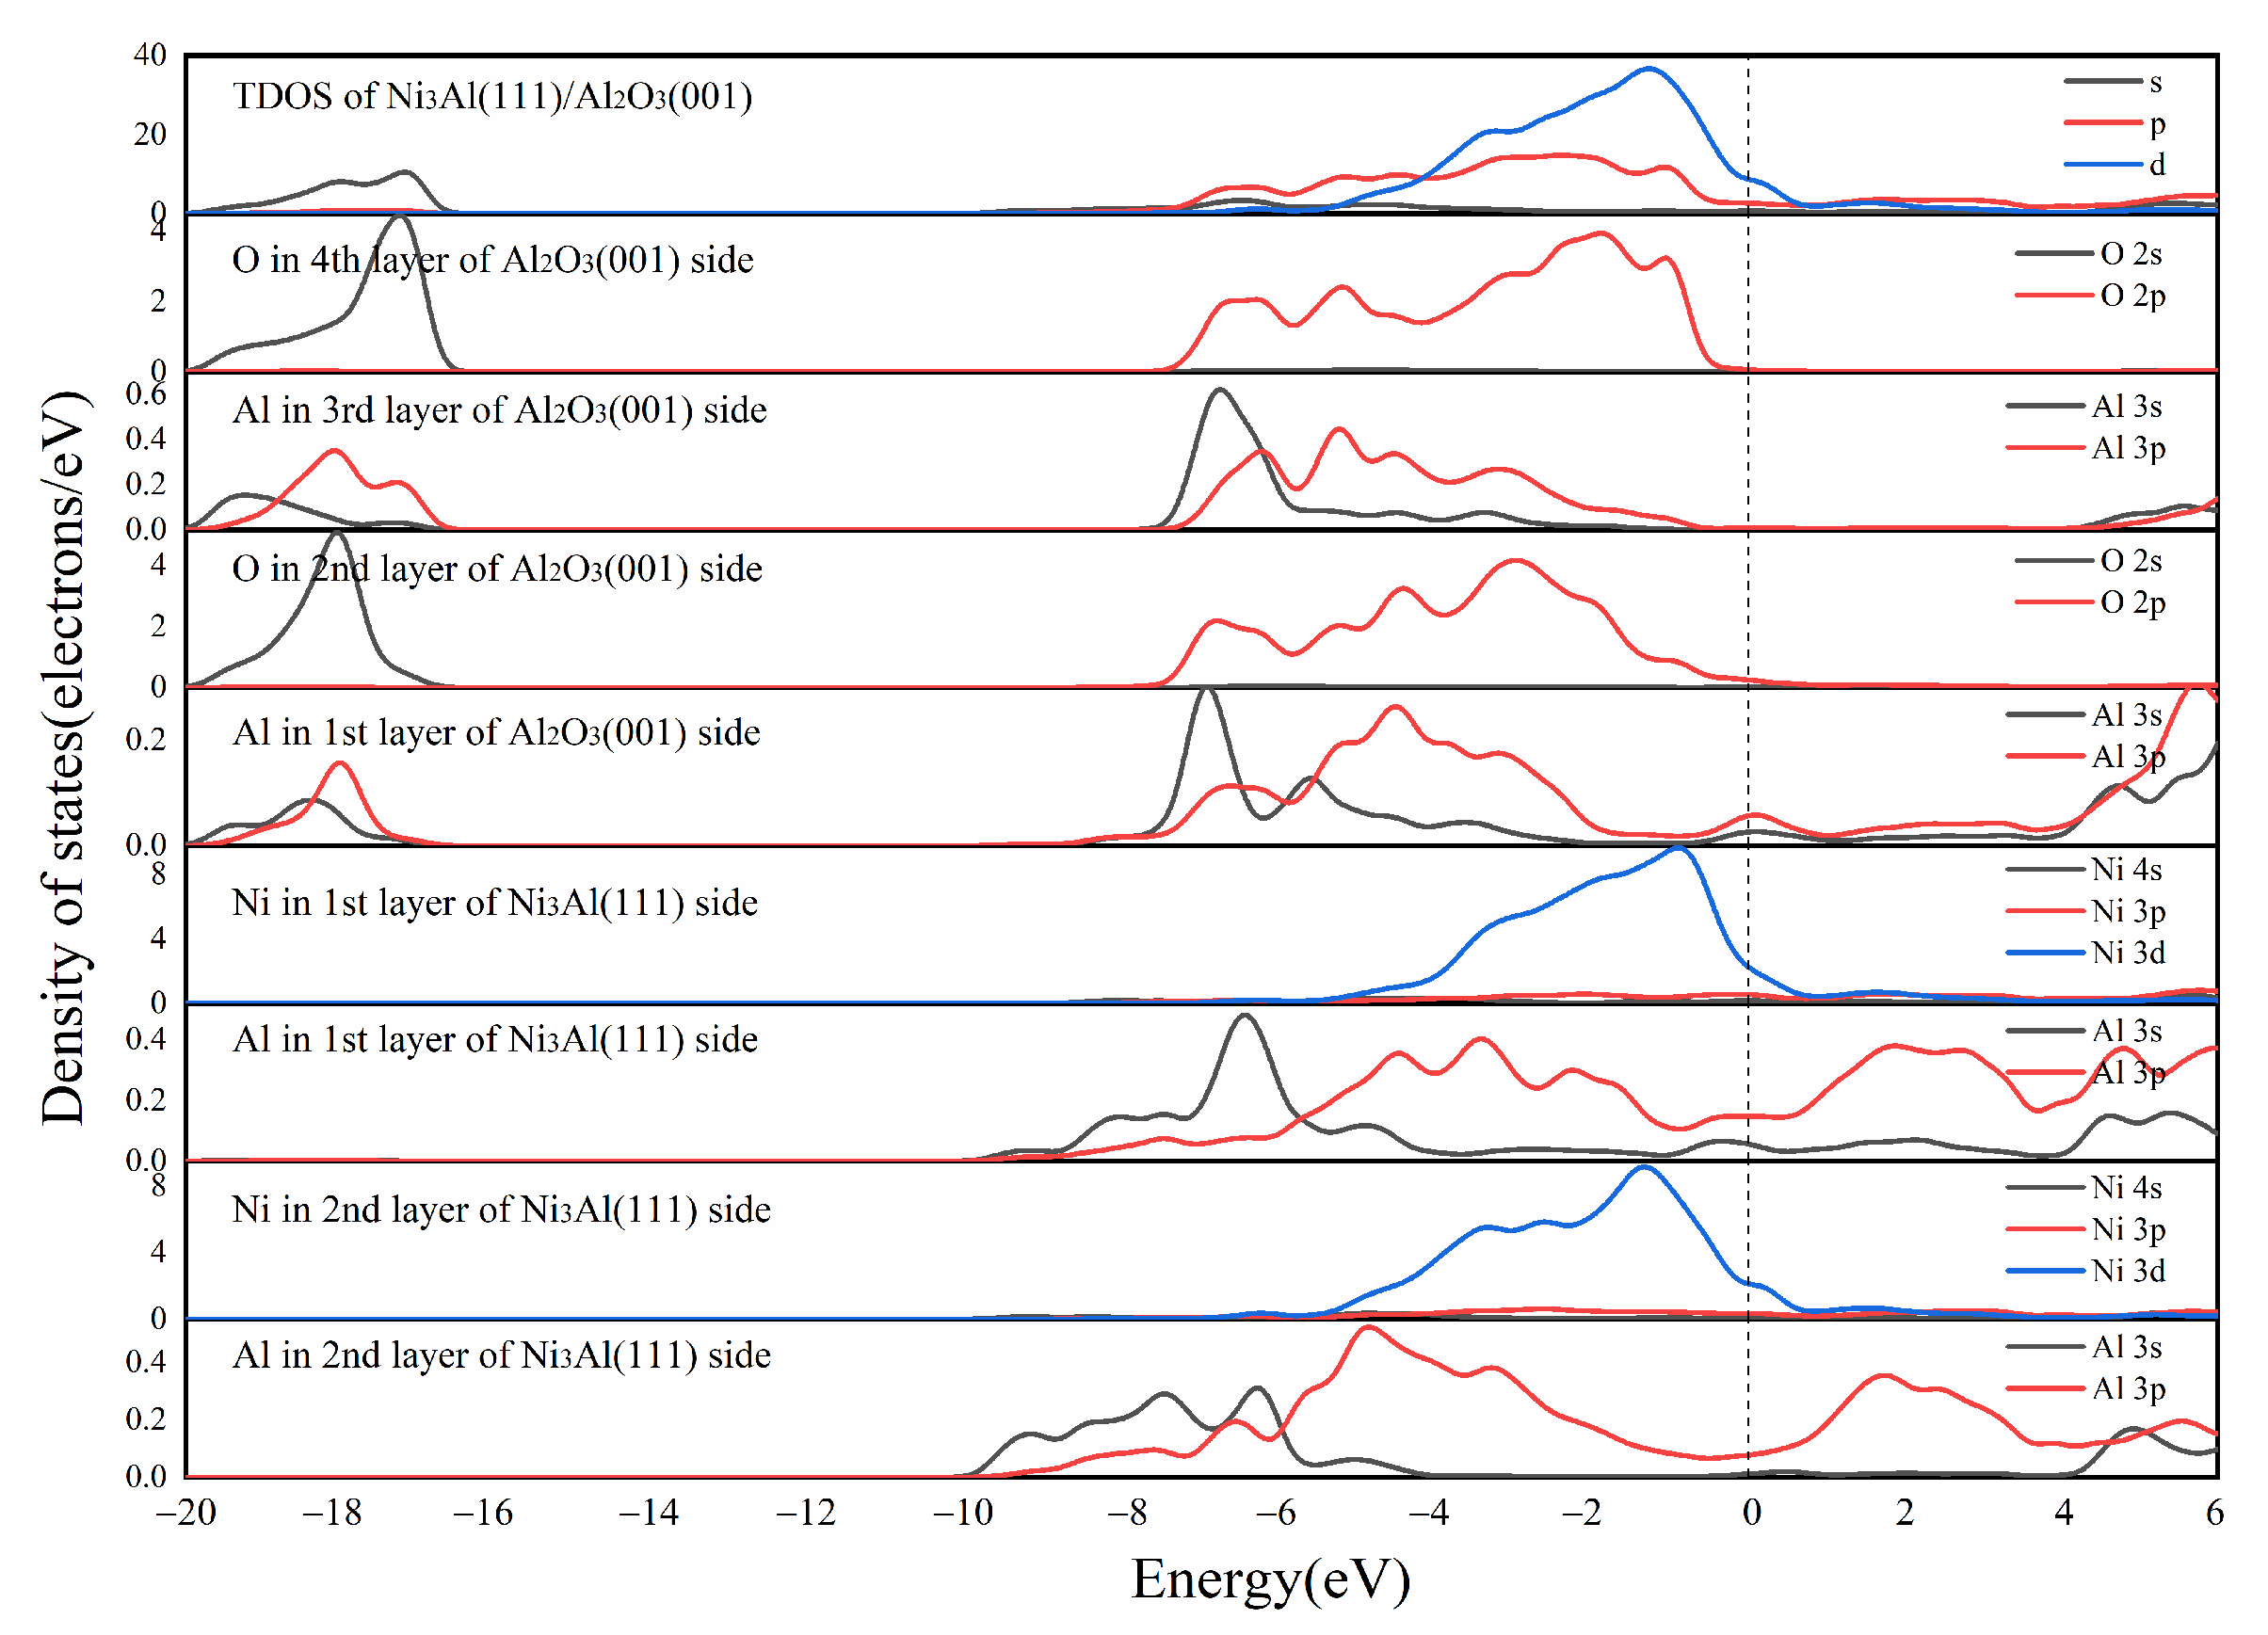
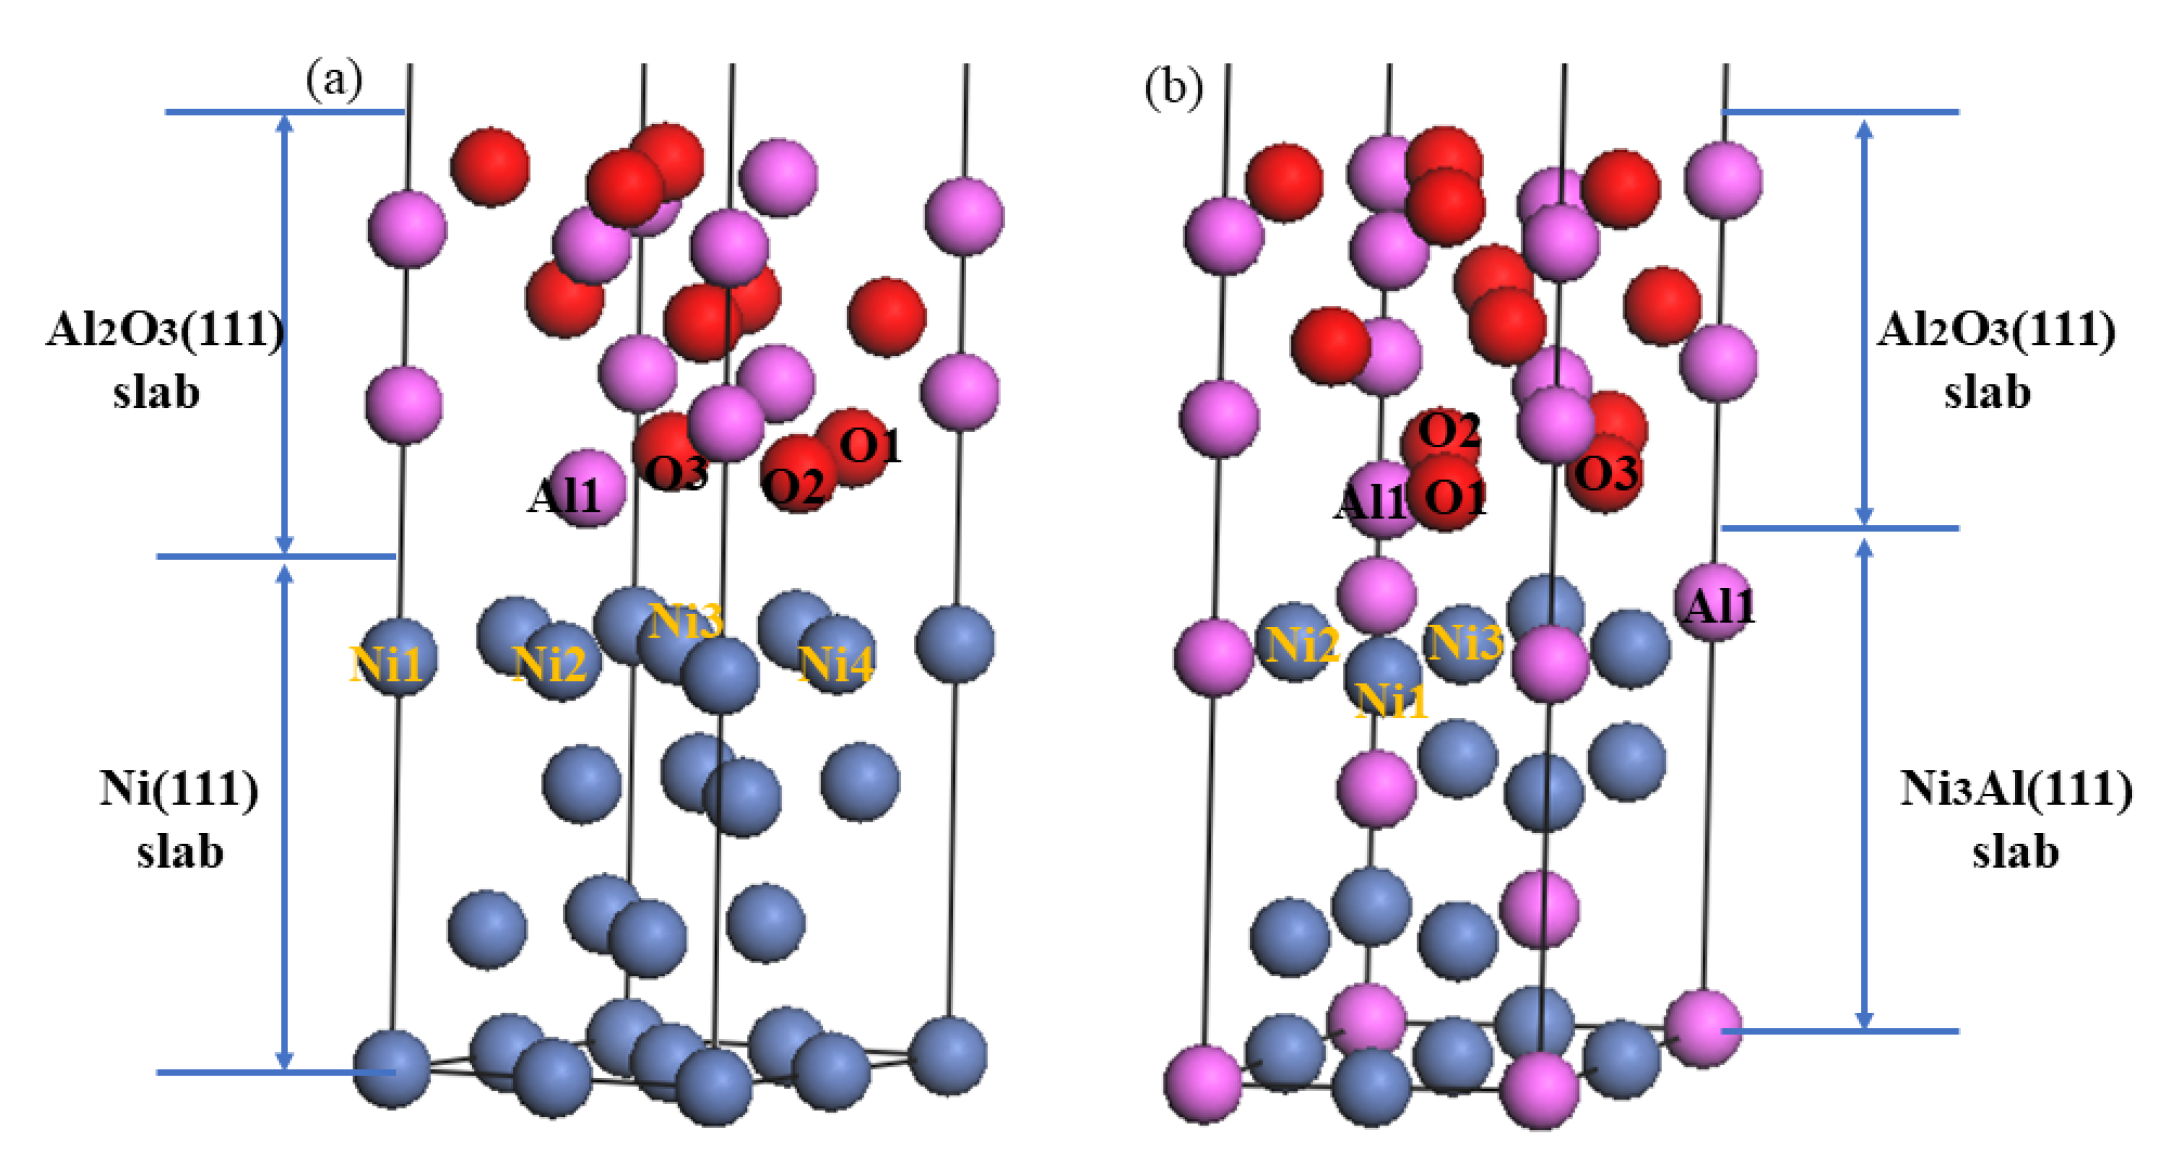
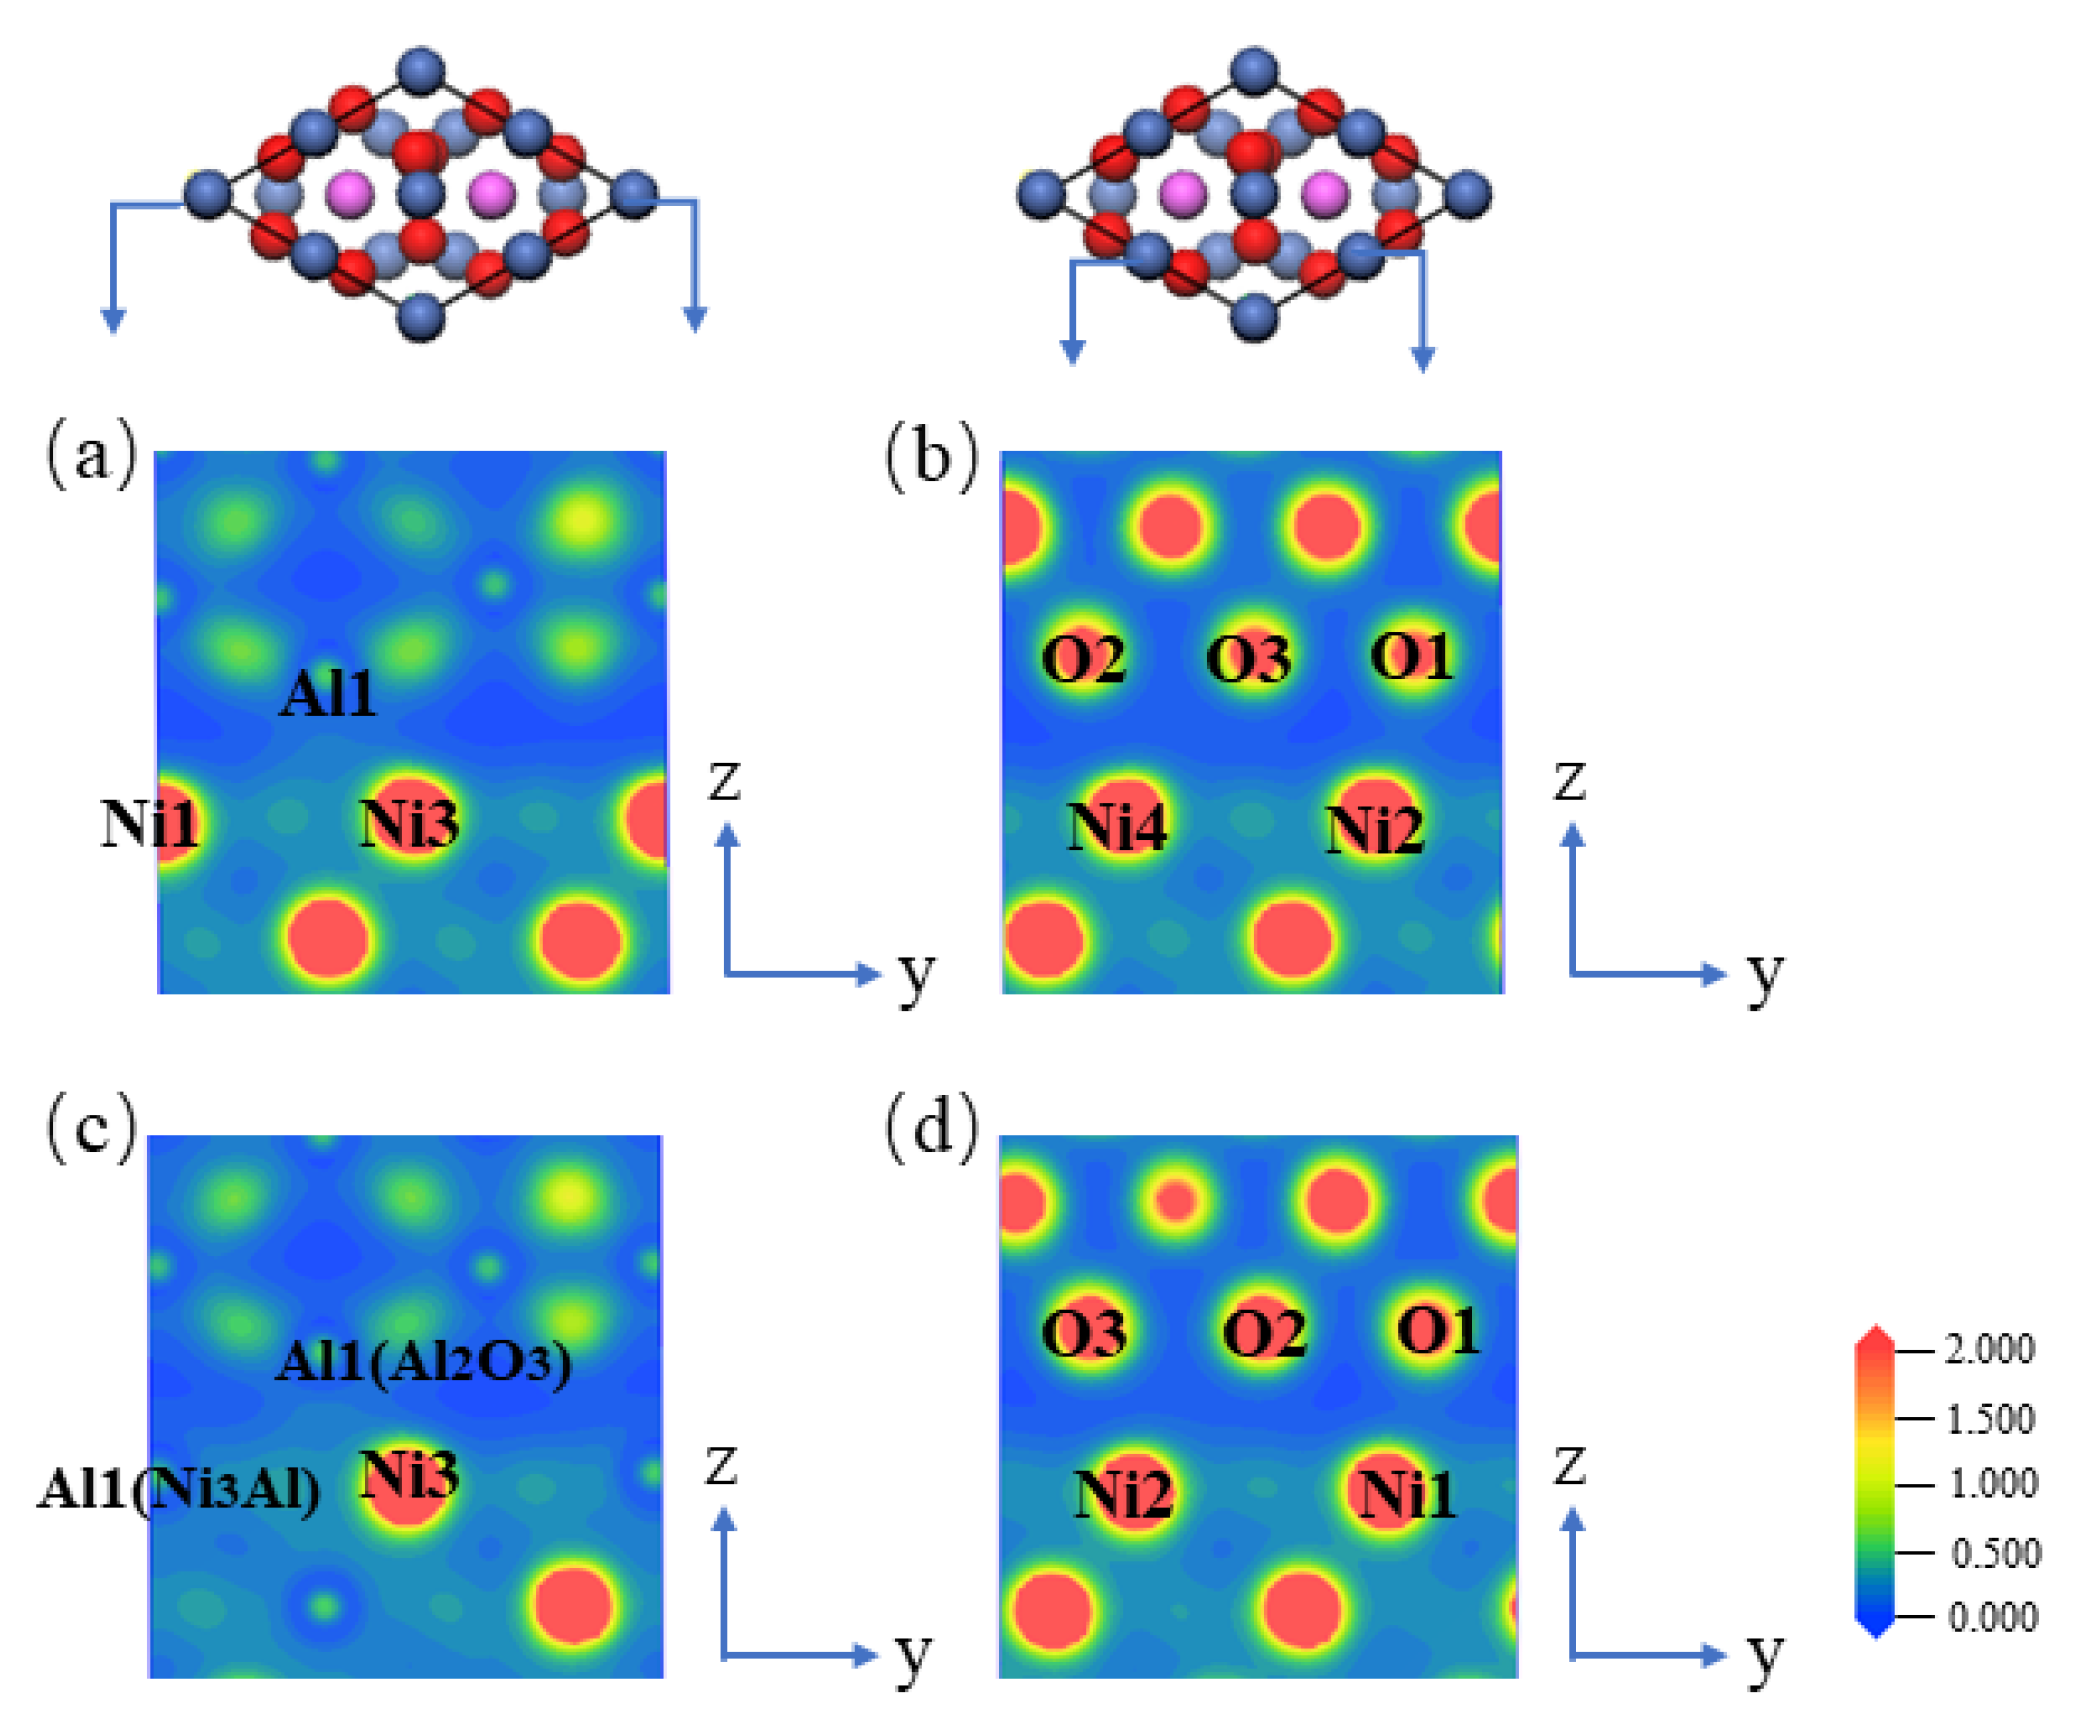
2.1. First-Principles Calculation of Ni-Based Alloys and Insulating Layers

The high conductivity of Ni-based single-crystal superalloys will cause the TFTCs to short-circuit and fail. An insulating layer needs to be introduced between the TFTC and the Ni-based single-crystal superalloy substrate; it is essential that this insulating layer can bond strongly with the substrate to ensure that it does not detach under high-speed scouring. Considering the high degree of electrical insulation of Al2O3, this material is considered to be an excellent insulating layer.
In this work, the density of states (DOS), population, and electron density of the interface between a Ni-based alloy substrate and an Al2O3 film were analyzed. The electronic properties were studied qualitatively, including the change in the charge between atoms at the interface and atoms far away from the interface as well as the change in the number of chemical bonds between atoms at the interface, so as to estimate whether the bonding between alumina and the substrate is good. The electronic properties of the interface of this material system were investigated through first-principles calculations using the BIOVIA Materials Studio software package (Version 19.1.0.2353, 10, Rue Marcel Dassault, 78140 Vélizy-Villacoublay, France).
All calculations employed the Cambridge Sequential Total Energy Package (CASTEP) [26], which is based on the density functional theory [27]. Figure 1 illustrates the models of the crystal structure and interface of the Ni-based single-crystal superalloy substrate and Al2O3. The model was geometrically optimized using the Perdew–Burke–Enzerh (PBE) [28] functional under the generalized gradient approximation (GGA). In order to reduce the number of plane-wave basis vectors, the ultra-soft pseudo-potential (USPP) scheme [29] was used to describe the interaction potential between the real ion and the valence electrons. As shown in Figure 1a,b, the Ni-based single crystal consists of two phases, namely single-crystal Ni as the matrix phase (γ-phase) and Ni3Al (γ’-phase) as the strengthening phase, both of which exhibit the face-centered-cubic structure [30]. For the γ-phase, the kinetic energy cutoff value is 440 eV, and the number of k-point sampling grids is 12 × 12 × 12; for the γ’-phase, the kinetic energy cutoff value is 400 eV, and the number of k-point sampling grids is 8 × 8 × 8. For the alumina crystal model shown in Figure 1c, the kinetic energy cutoff value is 630 eV, and the number of k-point sampling grids is 6 × 6 × 2. O-2s2 2p4, Al-3s2 3p1, and Ni-3d8 4s2 were selected as the valence electrons of the atoms, and the Broyden–Fletcher–Goldfarb–Shannon (BFGS) method [31] was used for optimization. The precision of the self-consistent field was set to 5.0 × 10⁻⁶ eV/atom, the maximum force of each atom was less than 0.01 eV/Å, the maximum stress was 0.02 GPa, and the maximum displacement was 5.0 × 10⁻⁴ Å. The unit cell parameters and space groups before and after optimization are listed in Table 1.
For the interface model between the Ni-based single-crystal superalloy and Al2O3, as there are two phases in the Ni-based alloy, the surfaces of the Ni and Ni3Al crystals were cut. The Ni(111) and Ni3Al(111) surfaces are close-packed, the surface energies of N(111) and Ni3Al(111) are low, and the Al2O3(001) surface is close-packed. The unit cells of bulk Ni, Ni3Al, and Al2O3 are shown in Figure 1(a-c). There are two possible orientations of the interface model, namely Ni(111)/Al2O3(001) (Figure 1d,e) and Ni3Al(111)/Al2O3(001) (Figure 1f,g), and the lattice mismatch is less than 5%. There are four layers on the surfaces of Ni and Al2O3. The bottom layer of the model is the Ni surface. The two layers of atoms on the Ni surface are fixed, and the top two layers allow relaxation to occur. The actual surface situation was simulated firstly, then a 15 Å thick vacuum layer was added to the model to optimize the surface. For both the Ni(111)/Al2O3(001) and Ni3Al(111)/Al2O3(001) interface models, the kinetic energy cutoff value is 400 eV, and the number of k-point sampling grids is 8 × 8 × 8. Using the ultra-soft pseudo-potential (USPP) scheme [32], the two-point steepest descent (TPSD) method was adopted for the optimization [33]. The convergence threshold of the energy change was set to 10−5 eV/atom, the maximum force was reduced to 0.03 eV/Å, and the maximum displacement was 0.001 Å during the optimization. The contribution of the atomic interactions to the bonding strength of the interface was studied by analyzing the electronic properties of the interface. Calculated lattice parameters (a and c) of bulk Al2O3, Ni, and Ni3Al are shown in Table 1.

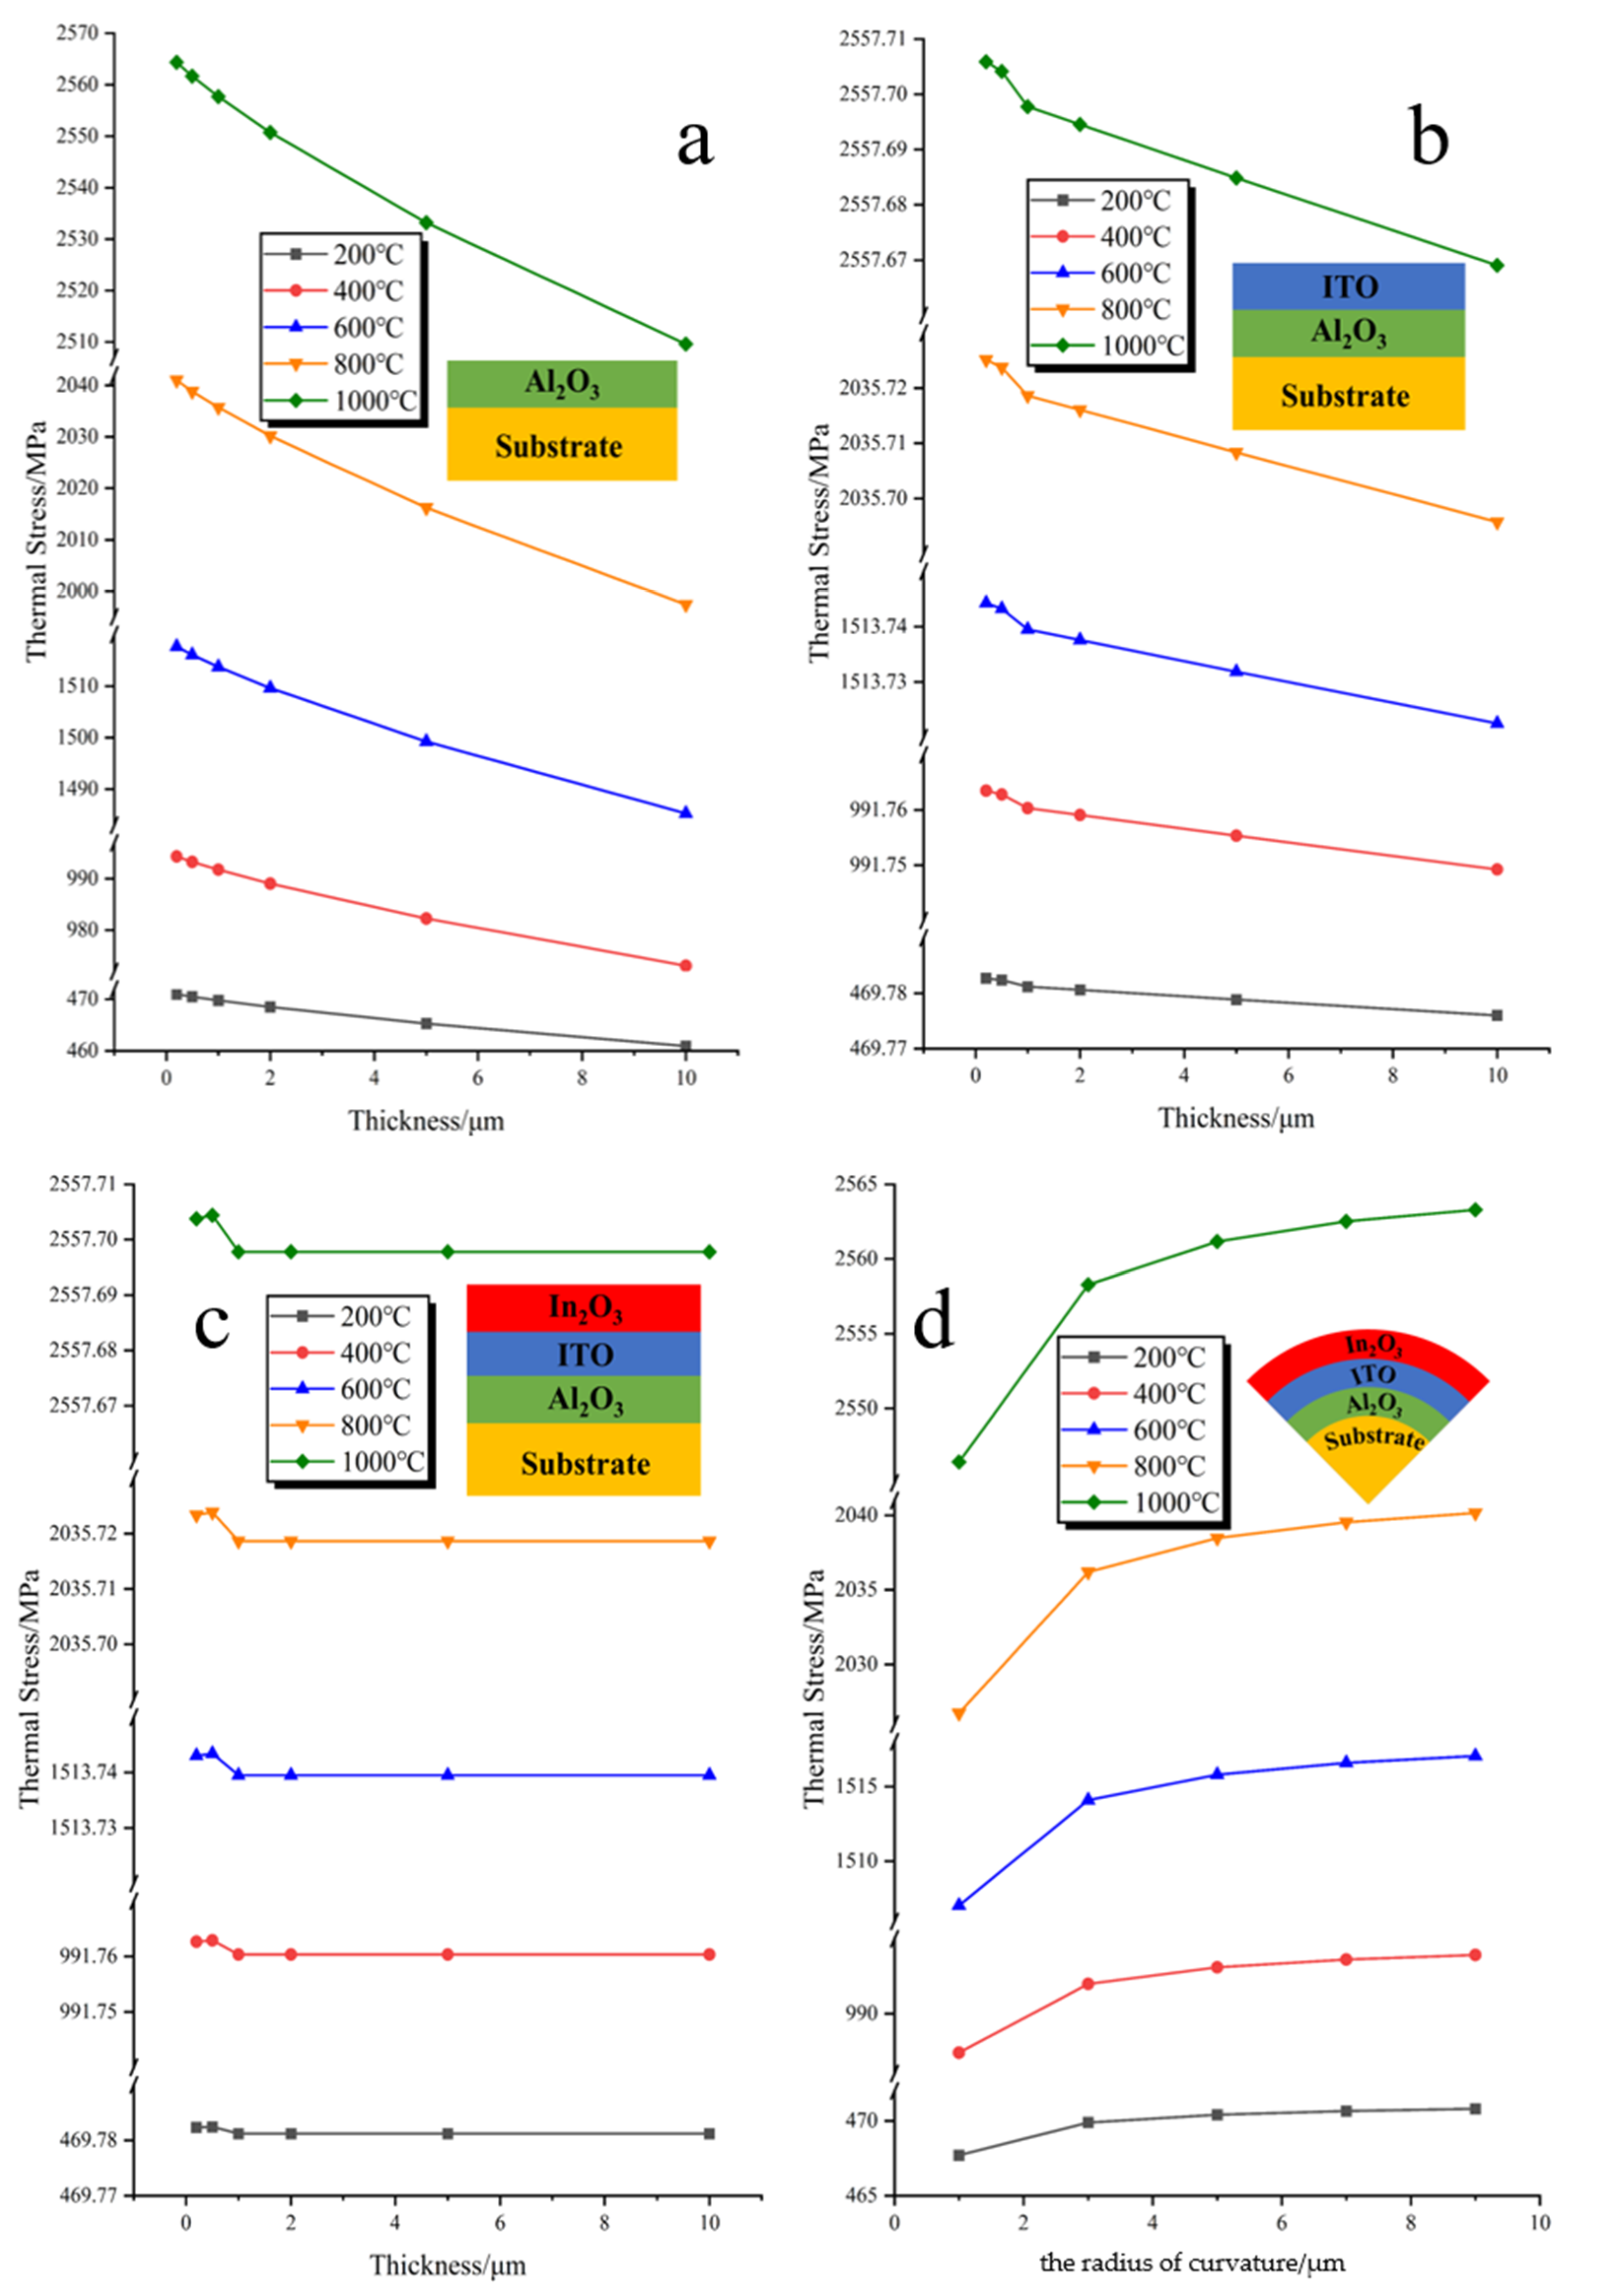
2.2. Finite Element Analysis (FEA) of the Thermal Stress

Considering that the film is subjected to thermal stress at high temperature and that excessive thermal stress causes the warpage and fracture of the film itself, it is necessary to control the film thickness to reduce the thermal stress. The thermal stress finite element analysis (FEA) model of the TFTC, Al2O3 insulating film, and Ni-based single-crystal superalloy was implemented using the ANSYS software package (Version 15.0, ANSYS Inc., South Pittsburgh, Pennsylvania, USA) to calculate the thermal stress for different system dimensions and temperatures. The isotropic, thermoplastic, and orthotropic behaviors of the material were considered in the FEA. The material parameters used in the model are listed in Table 2. Due to the axial symmetry of the problems described here, the original three-dimensional (3D) model was simplified to a two-dimensional (2D) model. D1, D2, and D3 are the thickness parameters of the ITO, In2O3 TFTC, and Al2O3 films, which are varied between 0.2 and 10 µm. R is the radius of curvature of the smart bolt, which is set in the range between 1 and 9 mm. The thickness of the substrate is set to 3 mm when the substrate is planar. The temperature in the calculation varies between 200 °C and 1000 °C. The material parameters are presented in Table 2. The dimensions of the system are optimized, and the thermal stress of the film is controlled through this analysis.

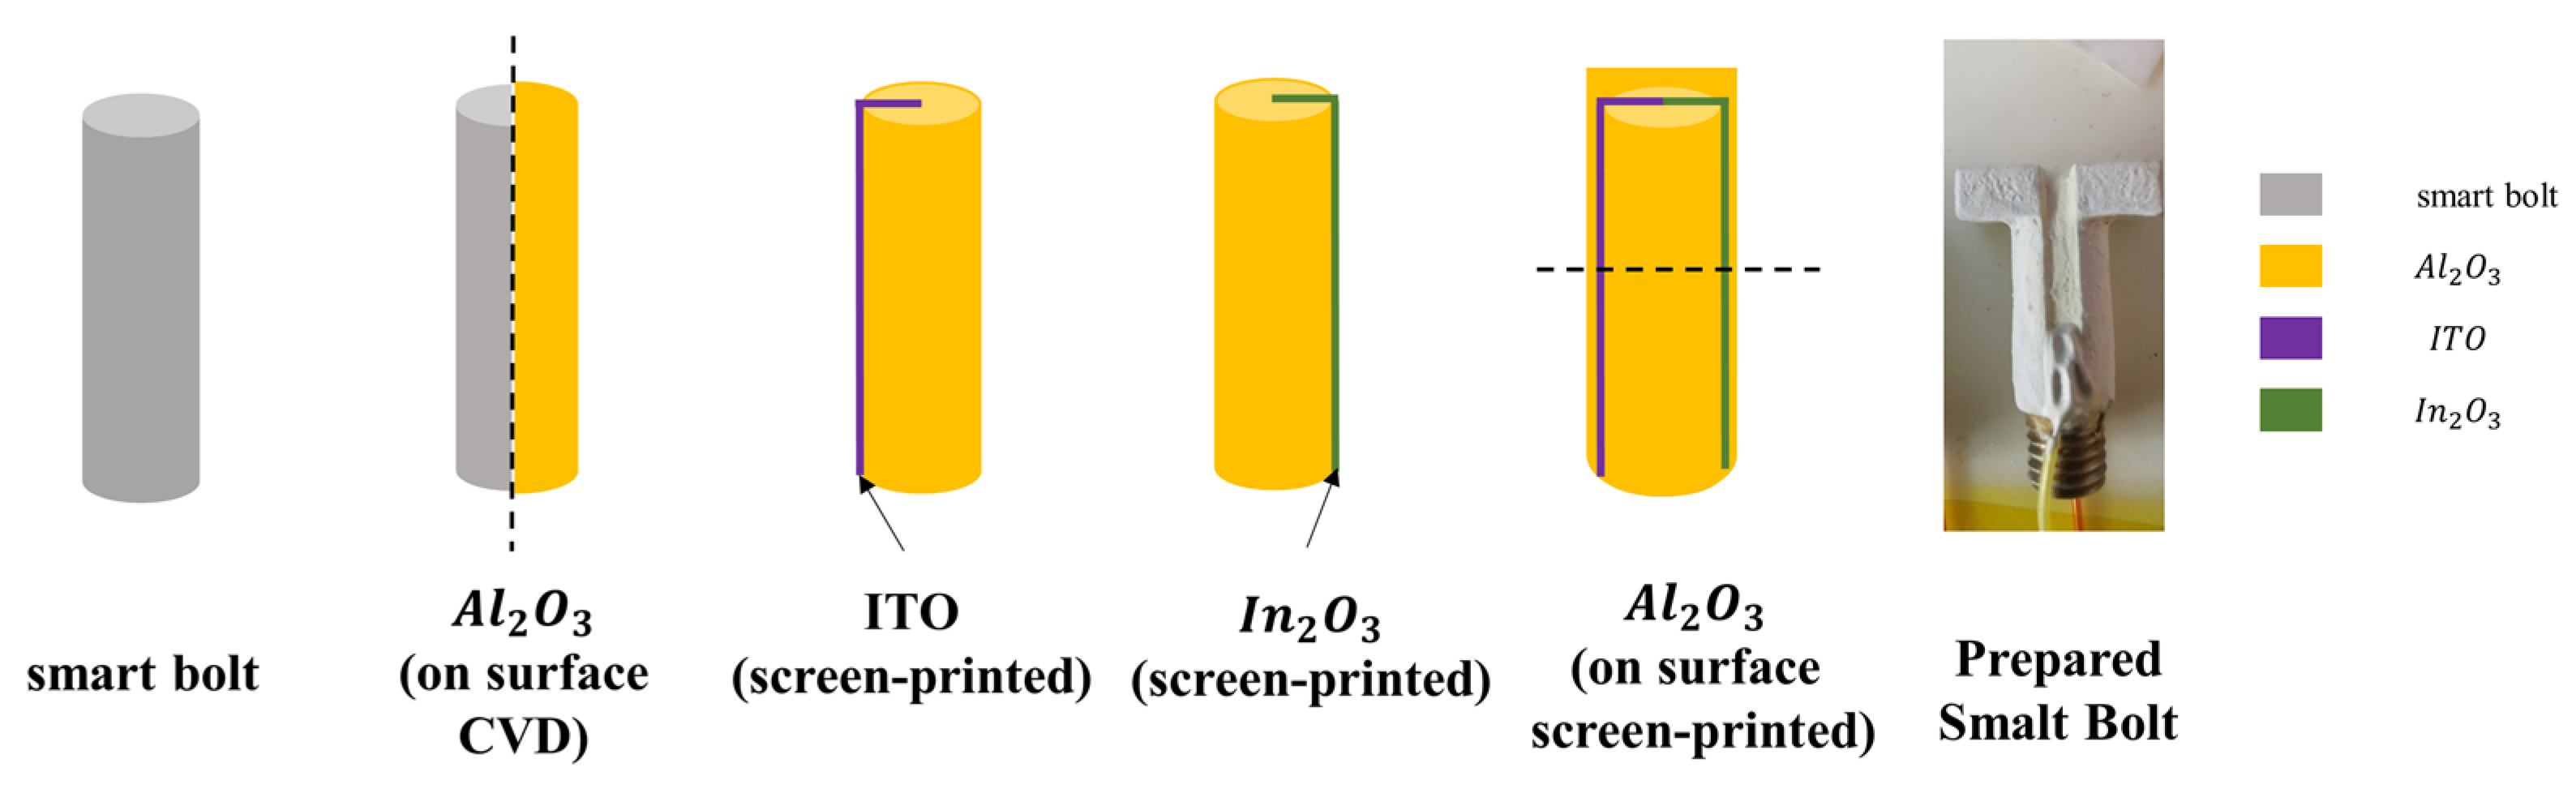
2.3. Sample Preparation and Measurements

The smart bolt was machined from a surface-polished Ni-based single-crystal superalloy. The Al2O3 layer was prepared through high-temperature chemical vapor deposition (CVD; ORION III, Trion, Dresden, Germany). The source solution concentration was 0.03 mol L−1, the distance from the nozzle to the substrate was 55 mm, and the voltage was 20 kV. The deposited films were kept at 800 °C for 2 h and cooled in a furnace. The ITO/In2O3 TFTCs were fabricated via the screen-printing method (LWS-3050, LIWO CO., Dongguan, China). The In2O3 and ITO powders used as thermal electrodes were bonded together using epoxy resin and polyetheramine as the binder and curing agent, respectively. α-Terpineol was used as the solvent and curing catalyst. The pastes for the screen-printing process were prepared according to the material mass ratios. The configured slurry was squeezed with a scraper through the mesh in the middle of the customized screen. The content of the glass powder additive in the preparation process was 5% of the powder mass. The electrodes were brushed several times to ensure the continuity of the thermode. After each brush coating, a heat treatment, which consisted in placing the samples on a heating plate at 160 °C for nearly 20 min, was required to ensure that the electrodes were fully cured. Finally, the Al2O3 protective layer was prepared via the screen-printing process; this layer prevents volatilization and scouring at high temperature. Subsequently, 4.08 g of aluminum isopropoxide was added to 50 mL of ethylene glycol ethyl ether; 10 mL of glacial acetic acid, polyvinyl alcohol, and a certain amount of formamide were then added to the above solution, and the reaction was continued at 70–80 °C until a clear and transparent solution was formed. The lifting speed was 500 µm/s. The solution was first left to dry at 200 °C for 1 h and then at 450 °C for 2 h; these procedures were repeated five times. Finally, the solution was heated to 900 °C. Subsequently, the leads were glued with a high-temperature conductive adhesive. The intelligent bolt structure and process flow are shown in Figure 2. The samples were characterized via scanning electron microscopy (SEM; SU-8010, Hitachi ltd., Tokyo, Japan) and X-ray diffraction (XRD; d/max-2400, Rigaku Corporation, Beijing, China). The performance of the TFTC was tested using a muffle furnace (P310, Nabertherm, Germany) with a maximum temperature of 1750 °C. Standard S-type thermocouples with a temperature range from ambient temperature to 1600 °C and standard K-type thermocouples (SAT-24 and XC-14K, OMEGA Co., Norwalk, CT, USA) were used to calibrate the temperature of the hot and the cold junctions. The output signal (i.e., the temperature of the hot and cold junctions) was recorded using a data collector (HIOKI, LR8431-30, Nagano-ke, Japan). A square-wave laser signal modulation was performed using a function generator (2200, Tektronix, Shanghai, China).

3. Results

3.1. Simulation Analysis and Design

The DOS characterizes the distribution of the electronic states in the energy space and can provide information regarding the interactions between the orbital hybridization, electronic state motion, and energy level splitting [34]. For the Ni(111)/Al2O3(001) interface, there is only one aluminum atom in the first layer on the Al2O3(001) side, two aluminum atoms in the third layer, and four O atoms in the second and fourth layers. There are four nickel atoms in the first and second layers on the Ni(111) side. The partial density of states (PDOS) is shown in Figure 3, and the vertical dashed line in the figure represents the Fermi level. The DOS of the d orbitals of the Ni(111)/Al2O3(001) interface, which is contributed to by the interface Ni atoms, is localized between −6 and 1 eV. The p orbitals are strongly delocalized mainly in the valence band region (from −8 to −1 eV) and the conduction band region above the Fermi level. The DOS of the s orbitals is mainly distributed between −20 and −17 eV. Compared with the Al atoms in the first layer (one Al atom) on the Al2O3(001) side, the PDOS of the 3p orbitals between −6 and −3 eV increases significantly compared with the Al atoms in the third layer (two Al atoms). The PDOS peaks of the O 2p orbitals on the Al2O3(001) side shift toward a lower energy, which may be caused by orbital hybridization during bonding. The PDOS peaks of the 3d orbitals of the first-layer Ni atoms on the Ni(111) side are more intense and are located at a lower energy (with a new peak appearing at −2 eV) compared with those of the second-layer Ni atoms on the Ni(111) side. The increase in the intensity of the PDOS peaks of the first layer of Ni atoms on the Ni(111) side and the first layer of Al atoms on the Al2O3(001) side and the offset of these peaks result in an increase in the PDOS overlap between −6 and −2 eV, which promotes a stronger interface bonding, and the 3d orbitals of the Ni atom are hybridized with the 3p orbitals of the Al atom. The 3d orbitals of the Ni atom partially overlap with the 3s orbitals of the Al atom in the first layer on the Al2O3(001) side, and the 3d orbitals of the Ni atom slightly overlap with the 2p orbitals of the O atom in the second layer on the Al2O3(001) side. The interfacial Ni–Al bond is the predominant contributor to the strong interfacial bonding force, while the Ni–O bond has a small effect on the enhancement of the interfacial bonding force. Total DOS (TDOS) and PDOS of the interfacial atoms in the Ni(111)/Al2O3(001) system are shown in Figure 3.
For the Ni3Al(111)/Al2O3(001) interface, one Al atom and three Ni atoms are present in the first and second layers on the Ni3Al(111) side. The PDOS is shown in Figure 4. The PDOS change on the Al2O3(001) side is similar to that of the Ni(111)/Al2O3(001) interface. The 3p orbitals of the first layer of the Al atom on the Al2O3(001) side are located between −6 and −3 eV. The PDOS peak of the 3d orbitals of the first-layer Ni atoms on the Ni3Al(111) in first layer is slightly more intense than Ni atoms on the Ni3Al(111) in second layer, and its energy shifts toward a higher value. Different from the Ni(111)/Al2O3(001) interface, the orbital shift of the Ni atoms in the first layer on the Ni3Al(111) side leads to a decrease in the overlap of the PDOS of the Ni and Al atoms, so the Ni3Al(111)/Al2O3(001) interface weakens the Ni–Al bond. The overlapping of the PDOS of the first-layer Ni atoms on the Ni3Al(111) side and the O atoms on the Al2O3(001) side mainly occurs on the right-hand side of the Fermi level, which has an inhibitory effect on the bonding of Ni and O. Total DOS and PDOS of the interfacial atoms in the Ni3Al(111)/Al2O3(001) system are shown in Figure 4.
Population analysis was used to determine the distribution of electrons in each atomic orbital. This analysis can reveal the covalent bond strength formed between the constituent atoms [35]. A larger positive value of the Mulliken overlap population indicates that the electron clouds overlap and that the covalent bond between the atoms is strong. On the other hand, a negative value indicates that the electron clouds do not overlap extensively and that the atoms are in an antibonding state [36]. The interface atom numbers are shown in Figure 5, and the Mulliken overlap populations of the chemical bonds are listed in Table 3. The Al–Ni and O–Ni bonds play a major role in determining the bonding strength of the Ni(111)/Al2O3(001) interface, and the strength of the Al–Ni bond is greater than that of the O–Ni bond. The Al–Ni bond mainly contributes to the bonding at the Ni3Al(111)/Al2O3(001) interface, and the O–Ni bond population is negative, indicating the existence of repulsive electron clouds and the lack of bonding.
The charge densities of the interfaces are shown in Figure 6 (the unit is e/Å3). The charge density of the Al atoms at the Ni(111)/Al2O3(001) and Ni3Al(111)/Al2O3(001) interfaces is much lower than that of the Ni atoms. Furthermore, the interface charges accumulate, and both interfaces are dominated by the Ni–Al bonds. The charge density of the Al atoms at the Ni(111)/Al2O3(001) and Ni3Al(111)/Al2O3(001) interfaces is much lower than that of the Ni atoms, and charge accumulation can be clearly observed at the two interfaces, which indicates that the interface is mostly composed of Al–Ni bonds. Both Ni and O atoms have high charge densities, but their electron clouds are localized around the atoms; thus, the Ni and O atoms at the interface do not form bonds.
To summarize, for the Ni(111)/Al2O3(001) interface, the 3d orbitals of the Ni atoms and the 3p orbitals of the Al atoms are hybridized, and the Mulliken overlap population of the Ni and Al atoms is relatively high. The charge density analysis reveals that charge is accumulated at the two interfaces. This indicates the formation of the Ni–Al bond, which is beneficial for interface bonding. The 3d orbitals of the Ni atom partially overlap with the 2p orbitals of the O atom, forming weaker Ni–O bonds. The Ni3Al(111)/Al2O3(001) interface is also dominated by the Ni–Al bond, but no bond is formed between the Ni and O atoms at the interface. This also shows that the Ni(111)/Al2O3(001) interface has a higher bonding strength than the Ni3Al(111)/Al2O3(001) interface. The analysis of the interface electronic structure indicates that there is a high bonding strength between the Ni-based alloy and alumina. The bonding between alumina and the substrate is good. It is feasible to use alumina as the thin-film layer in direct contact with nickel-based single-crystal superalloy for insulation.
As smart bolts are to be prepared, sensitive TFTCs need to be prepared on the surface of the aluminum oxide layer. However, the bolts have a certain curvature, and excessively high temperatures will generate thermal stress, which will cause the film to crack. It is necessary to conduct finite element calculations to determine the optimal range of sensitive film thickness parameters to reduce thermal stress. The bolt structure exhibits both planar and curved surfaces. The thermal stress of the film on the plane is analyzed first. Figure 7 shows the average thermal stress at different Al2O3 film thicknesses and temperatures. It can be seen that the thermal stress increases with the increase in temperature and D2, but it remains within the fracture strength. Thus, to guarantee high-temperature insulation, D2 should not be too small. D2 is then set to 1 µm, and the TFTC is added to calculate the average thermal stress in the TFTC at different Al2O3 film thicknesses and temperatures. It can be seen that the variation in the thermal stress in the ITO and In2O3 films is similar. When the thickness ranges from 0.2 to 10 µm, the thermal stress in the TFTC changes within a small range, which will not lead to film fracture. At the same time, as the temperature increases from 200 °C to 1000 °C, the average thermal stress increases from 470 MPa to 2 GPa, respectively. The thickness of the TFTC is preliminarily set to 1 µm for the convenience of data processing. Analogously, the thicknesses of the TFTC, Al2O3 film, and Ni-based single-crystal superalloy are all set to 1 µm. The average thermal stress is also calculated at different temperatures for a curved surface while keeping the thickness parameters constant. When R increases from 1 to 9 mm, the thermal stress of the TFTC increases from 468 to 471 MPa at 200 °C, and it reaches 455 MPa at 1000 °C. This shows that the radius of curvature has little effect on the thermal stress of the film within a certain range. Considering that the bolt diameter used in practical applications is usually 4–8 mm and that many bolts with a diameter of 6 mm are used for the hot parts of engines in actual engineering applications, we selected the smart bolt diameter of 6 mm.

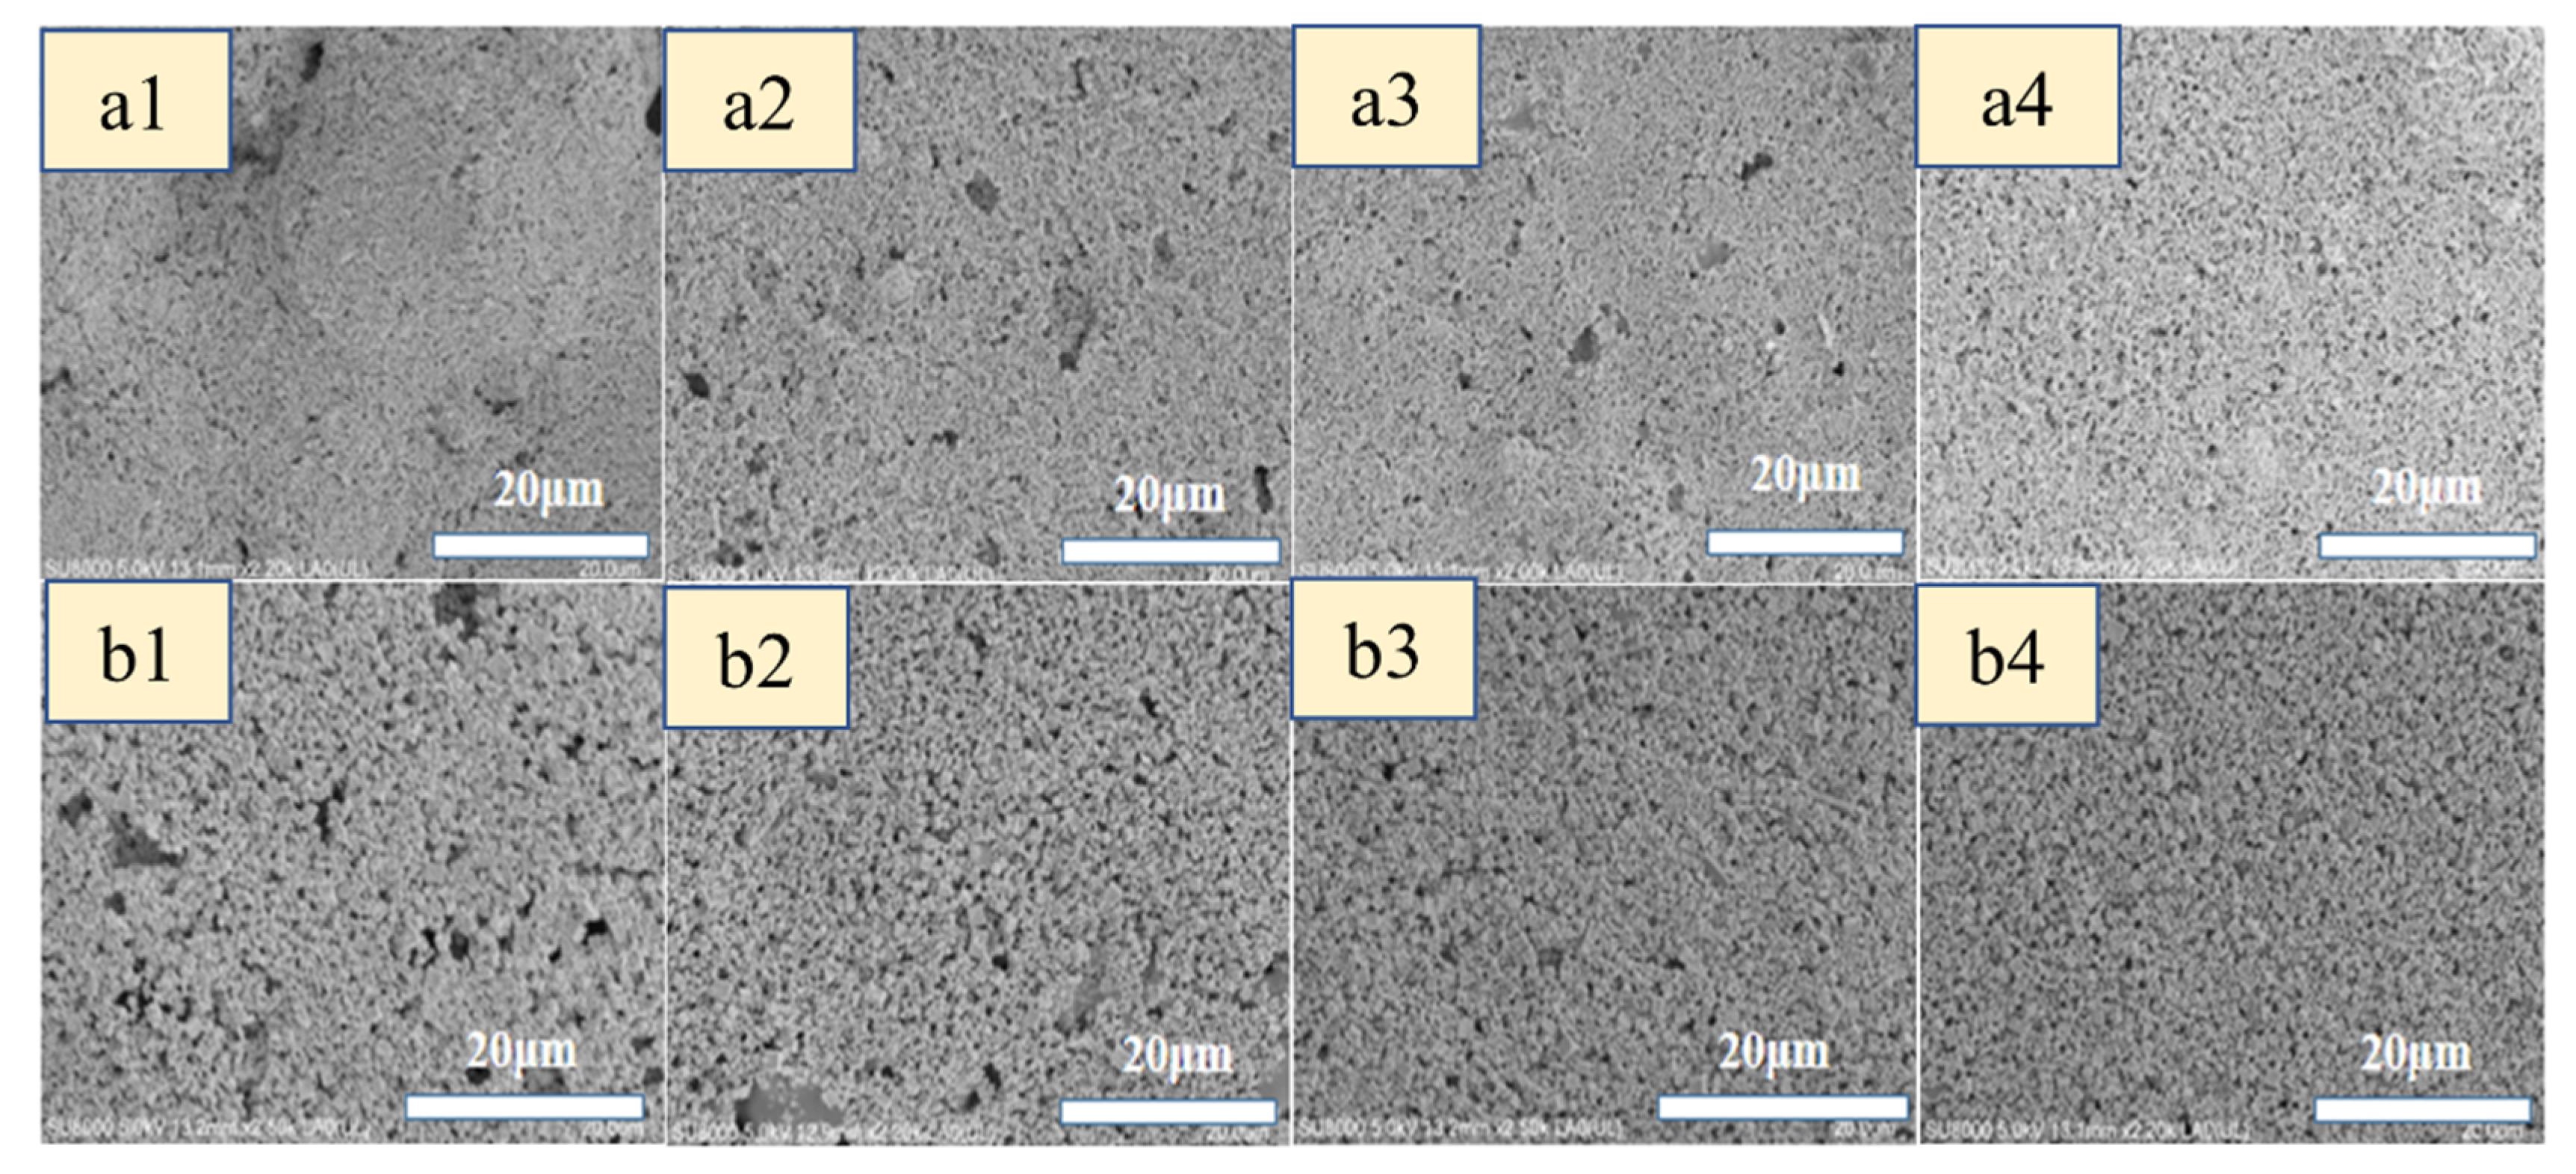
3.2. Microscopic and Thermoelectric Characteristics

The particle sizes of the additive glass powder used were 37 µm, 15 µm, 4 µm, and 400 nm. The effect of the glass powder with different particle sizes on the microstructure of the ITO and In2O3 films was studied. The surface morphology of the ITO and In2O3 films for the different particle sizes was observed via SEM, as shown in Figure 8. It can be seen that the microstructure of the ITO and In2O3 films changes depending on the particle size of the glass powder used for the screen-printing process. With decreasing particle size, the holes in the ITO and In2O3 films are reduced, and the density of the films increases. In the preparation process for screen printing, the glass powder is fully mixed with ITO and In2O3 nanoparticles to form a thin film. During the high-temperature heat treatment, the glass powder melts into a liquid and wraps around the grains. If the particle size of the glass powder is larger than the ITO and In2O3 nanoparticle sizes, the original holes after the heat treatment are too large, and the liquid-phase mass transfer does not easily occur, which deteriorates the adhesion of the film. The preferred particle size of the additive glass powder is 400 nm. Better results may be obtained by continuously reducing particle size, but when the particle size reaches a small range, it will cause too low viscosity of screen-printing paste and affect the preparation of the film. The film will be hard to form.
The XRD patterns of the ITO/In2O3 thin films are shown in Figure 9. The XRD pattern of the ITO film exhibits five broad peaks located at 21.48°, 24.85°, 30.56°, 50.98°, and 57.52°, which correspond to the (211), (220), (222), (400), and (026) planes, respectively (ICDD PDF#75-1526, 71-2194). The intensities of the (211), (220), (222), and (440) peaks do not change after the heat treatment, while that of the (026) peak is enhanced after the heat treatment, indicating that (026) is the preferred growth surface of the ITO film. The XRD pattern of the In2O3 film exhibits four broad peaks located at 21.49°, 30.58°, 51.02°, and 60.66°, which correspond to the (211), (222), (440), and (622) planes, respectively (ICDD PDF#89-4595). The (222) peak has the highest intensity. The intensities of the (222) and (622) peaks increase after the heat treatment. In an air environment, the heat treatment promotes the entrance of oxygen in the film, enhances the peak intensity of the preferred growth direction, and promotes the recrystallization of the film. These results are consistent with expectations. Considering that the film in an intelligent bolt is difficult to test due to a large radius of curvature, these results were obtained by depositing the film on a flat substrate.
To obtain a more accurate fitting curve for the sensor, quintic polynomials were used to fit the output curve, shown in Figure 10a,b. Equation (1) was used to describe the thermoelectric force (EMF) behavior of the sensor. Here, V (in mV) represents the EMF; ΔT (°C) refers to the temperature difference between the hot and cold ends. Equation (1) fits the characteristic curve of the sensor from room temperature to 1100 °C well. The average Seebeck coefficient of the TFTCs can reach 64.9 μV/°C at 1100 °C with a maximum voltage of 71.4 mV.
V Δ T = 3.75 × 10 5 × Δ T 2 + 0 . 0246 × Δ T 1.011
Under the same working conditions, the input was changed in the full range of the test in the same direction for a set period of time, and multiple output values corresponding to the same input were obtained through repeated tests. The deviations of the output value corresponding to the same input for multiple measurements provide information on the repeatability of the sensor. Furthermore, the repeatability is linked to the random error of the sensor. According to the actual probability distribution of the random error, the repeatability is represented by the corresponding standard deviation. The repeatability error is calculated as follows:
δ R = ± 3 σ ¯ Y F S × 100 %
In Equation (2), δ R represents the value of the repeatability error, σ ¯ represents the average standard deviation, and Y F S represents the value of the full range output of the sensor. The standard deviation of the sensor can be calculated using the range method, that is:
σ = R C
In Equation (3), C = 1.69 is the range coefficient (chosen by the number of measurement times), and R is the range, which is obtained by subtracting the minimum value obtained in the test results from the maximum value. According to the calculation results, the maximum standard deviation is 1.27 mV. The repeatability error of the sensor cycles after the heat treatment is ±1.05%. The repeatability of the sensor reaches 98.95%.
The average Seebeck coefficient reached 64.9 μV/°C at 1100 °C temperature difference, 255% larger than standard C-type (tungsten–rhenium, 18.24 µV/°C at 1100 °C) and 58.3% larger than standard K-type (NiCr-NiSi, 41.01 µV/°C at 1100 °C). Compared with WRe26/In2O3 probe-type TFTCs (reached 93.7 mV at 700 °C and failed at higher temperature) and the ITO/In2O3 probe based on a ceramic substrate (maximum 871 °C), the maximum operating temperature has increased to 1100 °C.
The response ability of the smart bolt under the impact of a methane flame was tested. An armored K-type thermocouple was installed and tested for comparison. The thermal junction was set at almost the same area (within 1 cm) to reduce the influence of uneven heating of methane flame, as shown in Figure 10c,d. Considering the size of the smart bolt and armored K-type thermocouple, the thermal junction cannot be completely in the same position. This makes the temperature values of the two tests different. The thermal nodes were subjected to two consecutive methane flame impacts. Each time, the temperature rose for about 20 s, and then heating stopped and the slow cooling stage was entered. It can be seen that under the impact of 1000 °C, the thermal response of the prepared smart bolt is better than that of the K-type armored thermocouple, and the thermal balance is achieved faster. The smart bolt was installed in a small aero engine, as shown in Figure 10e,f. The ignition was heated for about 350 s, and the total flow rate at the outlet was about 0.8 Mach. The maximum temperature during ignition was 832 °C. The smart bolt shows good adaptability in the real temperature test of the engine; the sensor does not need holes punched in components of installation when used, and it resists high-speed scouring.

4. Discussion

It was shown that the static calibration temperature measurement of the prepared smart bolt based on screen-printed ITO/In2O3 TFTCs with a Ni-based single-crystal superalloy reached 1100 °C. Compared with the previously reported ITO/In2O3 or In2O3/WRe probes, the stable maximum operating temperature is increased. In addition, since the ceramic substrate is no longer used, but the same metal material as the component under test is used as the substrate, the heat transfer error of the wall surface due to the different thermal conductivity of the substrate material can be avoided in actual use. However, failure occurred at higher temperatures, and no stable electrical signal could be detected. This failure may be due to the thermal stress mismatch between the film and the substrate as well as metal oxidation in high-temperature environments. Choosing a material with a thermal expansion coefficient more similar to that of the metal as the sensitive layer material may lead to a better performance at high temperature, but the existing high-temperature thermoelectric materials do not meet this requirement. It could be possible to further optimize the parameters of the preparation process of the protective layer, such as the parameters of the sol–gel method, to achieve a more effective high-temperature protection.

5. Conclusions

In this work, a new type of smart bolt based on ITO/In2O3TFTCs and a Ni-based single-crystal superalloy was presented. The calibration results show that the average Seebeck coefficient of the TFTC reaches 64.9 μV/°C at 1100 °C with a maximum voltage of 71.4 mV. The repeatability error of the sensor cycles after the heat treatment is ±1.05%. The repeatability of the sensor reaches 98.95%. The application test of smart bolts in small aero engines shows they can bear the heat of gas flow under 0.8 Mach and 850 °C. Compared with traditional thin-film temperature sensors, the intelligent bolt sensor proposed in this work has better engineering application prospects owing to its convenience of installation.

Author Contributions

Conceptualization, Z.Z.; methodology, R.C. and J.L. (Jiangjiang Liu); data curation, Z.L., B.T. and J.L. (Jiaming Lei); validation, N.Z., N.W. and R.S.; funding acquisition, L.Z. All authors have read and agreed to the published version of the manuscript.

Funding

This work was supported by the National Key Research and Development Program of China (2020YFB2009100), Natural Science Basic Research Program of Shaanxi (Program No. 2022JQ-508), National Science and Technology Major Project (Grant No. J2019-V-0006-0100), and Open Research Fund of SKLMS (Grant No. sklms2021009).

Institutional Review Board Statement

Not applicable.

Informed Consent Statement

Not applicable.

Data Availability Statement

The data are available on reasonable request from the corresponding author.

Conflicts of Interest

The authors declare no conflict of interest.

References

  1. Cai, J.; Yang, Y.; Zhao, J.; Li, H. The measure method of surface temperature in aero-engine. Meas. Technol. 2008, 28, 46–48. [Google Scholar]
  2. Liu, Q.M.; Huang, S.Z.; Liu, J.; Zhang, C.Q.; Fang, R.L.; Pei, H.P. Progress and Application of High Temperature Structural Materials on Aero-Engine. Gas Turbine Exp. Res. 2014, 27, 27–31. [Google Scholar]
  3. Jin, X.H.; Ma, B.H.; Qiu, T.; Deng, J.J.; Luo, J.; Yuan, W.Z.; Le, J.L.; Han, Y.Y. ITO thin film thermocouple for dynamic inner wall temperature measurement of supersonic combustion. In Proceedings of the 2017 IEEE SENSORS, Glasgow, UK, 29 October–1 November 2017; pp. 1–3. [Google Scholar]
  4. Zhang, J.; Mei, G.; Xie, Z.; Zhao, S.M. A Fast Response Sensor for Continuously Measuring Molten Steel Temperature. ISIJ Int. 2018, 58, 1453–1458. [Google Scholar] [CrossRef] [Green Version]
  5. Marr, M.A.; Wallace, J.S.; Chandra, S.; Pershin, L.; Mostaghimi, J. A fast response thermocouple for internal combustion engine surface temperature measurements. Exp. Thermal. Fluid Sci. 2010, 34, 183–189. [Google Scholar] [CrossRef]
  6. Martin, L.C. Testing of Thin Film Thermocouples in Rocket Engine Environments. In Advanced Earth-to-Orbit Propulsion Technology 1994; NASA CP–3282; NASA: Washington, DC, USA, 1994. [Google Scholar]
  7. Uchida, K.; Takahashi, S.; Harii, K.; Ieda, J.; Koshibae, W.; Ando, K.; Maekawa, S.; Saitoh, E. Observation of the spin Seebeck effect. Nature 2008, 455, 778–781. [Google Scholar] [CrossRef] [PubMed]
  8. Gregory, O.J.; You, T. Ceramic temperature sensors for harsh environments. IEEE Sens. J. 2005, 5, 833–838. [Google Scholar] [CrossRef]
  9. Richards, L.A.; Ogata, G. Thermocouple for Vapor Pressure Measurement in Biological and Soil Systems at High Humidity. Science 1958, 128, 1089–1090. [Google Scholar] [CrossRef]
  10. Majumdar, A.; Lai, J.; Chandrachood, M.; Nakabeppu, O.; Wu, Y.; Shi, Z. Thermal imaging by atomic force microscopy using thermocouple cantilever probes. Rev. Sci. Instrum. 1995, 66, 3584–3592. [Google Scholar] [CrossRef]
  11. Basti, A.; Obikawa, T.; Shinozuka, J. Tools with built-in thin film thermocouple sensors for monitoring cutting temperature. Int. J. Mach. Tools Manuf. 2007, 47, 793–798. [Google Scholar] [CrossRef]
  12. Aniolek, G.E.; Gregory, O.J. Thin Film Thermocouples for Advanced Ceramic gas Turbine Engines. Surf. Coat. Technol. 1994, 68, 70–75. [Google Scholar] [CrossRef]
  13. Afridi, M.; Montgomery, C.; Cooper-Balis, E.; Semancik, S.; Kreider, K.G.; Geist, J. Micro hotplate temperature sensor calibration and bist. J. Res. Natl. Inst. Stand. Technol. 2011, 116, 827–838. [Google Scholar] [CrossRef] [PubMed]
  14. Qiang, W.; Zhang, J.B.; Shao, J.; Chen, P.; Ding, G.; Duan, L. Preparation and performance of high temperature thin film sensors. Sens. Microsyst. 2016, 35, 33–35. [Google Scholar]
  15. Rivera, K.; Muth, T.; Rhoat, J. Novel temperature sensors for SiC–SiC CMC engine components. J. Mater. Res. 2017, 32, 3319–3325. [Google Scholar] [CrossRef]
  16. Yakaboylu, G.A.; Pillai, R.C.; Sabolsky, K. MoSi2-and WSi2-based embedded ceramic composite thermocouples for high-temperature and harsh-environment sensing. Sens. Actuators A: Phys. 2018, 272, 139–152. [Google Scholar] [CrossRef]
  17. Rivera, K.; Gregory, O.J. ITO: SiC Ceramic Matrix Composite Thermocouples for Engine Components. IEEE Sens. Lett. 2020, 4, 1–4. [Google Scholar] [CrossRef]
  18. Zhang, Z.K.; Tian, B.; Cheng, G.; Liu, Z.; Liu, J.; Zhang, B.; Lei, J.; Zhao, N.; Han, F.; Fang, X.; et al. Influences of RF Magnetron Sputtering Power and Gas Flow Rate on a High Conductivity and Low Drift Rate of Tungsten-Rhenium Thin-Film Thermocouples. Nanomaterials 2022, 12, 1120. [Google Scholar] [CrossRef]
  19. Jiang, Y.; Wei, Y.; Smith, J.R.; Hutchinson, J.W.; Evans, A. First principles based predictions of the toughness of a metal/oxide interface. Int. J. Mater. Res. 2010, 101, 8–15. [Google Scholar] [CrossRef] [Green Version]
  20. Ozfidan, I.; Chen, K.; Fu, M. Effects of additives and impurity on the adhesive behavior of the NiAl (110)/Al2O3 (0001) Interface: An ab initio study. Metall. Mater. Trans. A 2011, 42, 4126–4136. [Google Scholar] [CrossRef]
  21. Bao, Z.; Guo, X.; Shang, F. An atomistic investigation into the nature of fracture of Ni/Al2O3 interface with yttrium dopant under tension. Eng. Fract. Mech. 2015, 150, 239–247. [Google Scholar] [CrossRef]
  22. Wang, F.; Chen, Z.; Song, G. Monitoring of multi-bolt connection looseness using entropy-based active sensing and genetic algorithm-based least square support vector machine. Mech. Syst. Signal Process. 2020, 136, 106507. [Google Scholar] [CrossRef]
  23. Yuan, R.; Lv, Y.; Kong, Q.; Song, G. Percussion-based bolt looseness monitoring using intrinsic multiscale entropy analysis and BP neural network. Smart Mater. Struct. 2019, 28, 125001. [Google Scholar] [CrossRef]
  24. Tian, B.; Liu, Y.; Zhang, Z.K.; Zhao, L.B.; Liu, Z.J.; Shi, P.; Lin, Q.; Mao, Q.; Lu, D.; Jiang, Z. WRe26-In2O3 probe-type thin film thermocouples applied to high temperature measurement. Rev. Sci. Instrum. 2020, 7, 91. [Google Scholar] [CrossRef] [PubMed]
  25. Deng, J.J.; Zhang, L.W.; Hui, L.; Jin, X.H.; Ma, B.H. Indium Tin Oxide Thin-Film Thermocouple Probe Based on Sapphire Microrod. Sensors 2020, 20, 1289. [Google Scholar] [CrossRef] [PubMed] [Green Version]
  26. Clark, S.J.; Segall, M.D.; Pickard, C.J.; Hasnip, P.J.; Probert, M.I.; Refson, K.; Payne, M.C. First principles methods using CASTEP. Z. Krist. Cryst. Mater. 2005, 220, 567–570. [Google Scholar] [CrossRef] [Green Version]
  27. Mattsson, A.E.; Schultz, P.A.; Desjarlais, M.P.; Mattsson, T.R.; Leung, K. Designing meaningful density functional theory calculations in materials science—A primer. Model. Simul. Mater. Sci. Eng. 2004, 13, R1. [Google Scholar] [CrossRef]
  28. Perdew, J.P.; Wang, Y. Accurate and simple analytic representation of the electron-gas correlation energy. Phys. Rev. B 1992, 45, 13244. [Google Scholar] [CrossRef]
  29. Laasonen, K.; Pasquarello, A.; Car, R.; Lee, C.; Vanderbilt, D. Car-Parrinello molecular dynamics with Vanderbilt ultrasoft pseudopotentials. Phys. Rev. B 1993, 47, 10142. [Google Scholar] [CrossRef]
  30. Yu, X.F.; Tian, S.G.; Wang, M.G.; Zhang, S.; Lu, X.; Cui, S. Creep behaviors and effect factors of single crystal nickel-base superalloys. Mater. Sci. Eng. A 2009, 499, 352–359. [Google Scholar]
  31. Pfrommer, B.G.; Côté, M.; Louie, S.G.; Cohen, M.L. Relaxation of crystals with the quasi-Newton method. J. Comput. Phys. 1997, 131, 233–240. [Google Scholar] [CrossRef] [Green Version]
  32. Lejaeghere, K.; Van Speybroeck, V.; Van Oost, G.; Cottenier, S. Error estimates for solid-state density-functional theory predictions: An overview by means of the ground-state elemental crystals. Crit. Rev. Solid State Mater. Sci. 2014, 39, 1–24. [Google Scholar] [CrossRef] [Green Version]
  33. Barzilai, J.; Borwein, J.M. Two-point step size gradient methods. IMA J. Numer. Anal. 1988, 8, 141–148. [Google Scholar] [CrossRef]
  34. Ellis, D.E.; Guenzburger, D. The discrete variational method in density functional theory and its applications to large molecules and solid-state systems. In Advances in Quantum Chemistry; Academic Press: Cambridge, MA, USA, 1999; Volume 34, pp. 51–141. [Google Scholar]
  35. Zhou, T.T.; Huang, C.Z.; Yi, M.D. First-principle calculation of Al2O3 (012)/SiC (310) interface model. In Materials Science Forum; Trans Tech Publications Ltd.: Zurich, Switzerland, 2017; Volume 896, pp. 120–127. [Google Scholar]
  36. Segall, M.D.; Shah, R.; Pickard, C.J.; Payne, M.C. Population analysis of plane-wave electronic structure calculations of bulk materials. Phys. Rev. B 1996, 54, 16317. [Google Scholar] [CrossRef] [PubMed] [Green Version]
Figure 1. Unit cells of bulk (a) Ni, (b) Ni3Al, and (c) Al2O3. (d) Top view of Ni(111)/Al2O3(001). (e) Front view of Ni(111)/Al2O3(001). (f) Top view of Ni3Al(111)/Al2O3(001). (g) Front view of Ni3Al(111)/Al2O3(001) interface. The pink, red, and blue ball in figure shows Al, O, Ni atom separately.
Chemosensors 10 00347 g001
Figure 2. Intelligent bolt structure and process flow.
Chemosensors 10 00347 g002
Figure 3. Total DOS (TDOS) and PDOS of the interfacial atoms in the Ni(111)/Al2O3(001) system.
Chemosensors 10 00347 g003
Figure 4. Total DOS and PDOS of the interfacial atoms in the Ni3Al(111)/Al2O3(001) system.
Chemosensors 10 00347 g004
Figure 5. Atom numbers of the (a) Ni(111)/Al2O3(001) and (b) Ni3Al(111)/Al2O3(001) interfaces. The pink, red, and blue ball in figure shows Al, O, Ni atom separately.
Chemosensors 10 00347 g005
Figure 6. (a,b) Charge densities of different sections of the Ni(111)/Al2O3(001) interface; (c,d) charge densities of different sections of the Ni3Al(111)/Al2O3(001) interface. The pink, red, and blue ball in figure shows Al, O, Ni atom separately.
Chemosensors 10 00347 g006
Figure 7. Thermal stress as a function of the Al2O3 film thickness for different systems: (a) Al2O3 film and substrate; (b) ITO film, Al2O3 film, and substrate; (c) TFTC, Al2O3 film, and substrate with R = 1 mm; (d) thermal stress as a function of R for the system composed of the TFTC, Al2O3 film, and substrate.
Chemosensors 10 00347 g007
Figure 8. Surface morphology of the ITO (a1: 37 μm, a2: 15 μm, a3: 4 µm, a4: 400 nm) and In2O3 (b1: 37 μm, b2: 15 μm, b3: 4 µm, b4: 400 nm) films obtained using different glass powder particle sizes.
Chemosensors 10 00347 g008
Figure 9. XRD diffraction patterns of the (a) ITO and (b) In2O3 thin films before and after the heat treatment.
Chemosensors 10 00347 g009
Figure 10. The temperature calibration system (a), EMF output of the sensor in three cycles of heating and cooling with the maximum temperature difference of 1100 °C (b), methane flame test system (c), EMF output of the smart bolt and armored K-type thermocouple under methane flame test up to 1000 °C (d), smart bolt which is installed on a small aero engine for ignition test (e), diagram of temperature test results during ignition (f).
Chemosensors 10 00347 g010
Table 1. Calculated lattice parameters (a and c) of bulk Al2O3, Ni, and Ni3Al.
System Methoda (Å)c (Å)Space Group
Al2O3PresentGGA–PBE4.80813.122R-3C
Expt 4.75912.991R-3C
NiPresentGGA–PBE3.5223.522FM-3M
Expt 3.5443.544FM-3M
Ni3AlPresentGGA–PBE3.5693.569PM-3M
Expt 3.5685.568PM-3M
Table 2. Material parameters.
MaterialPoisson’s RatioYoung’s Modulus (GPa)Coefficient of Thermal Expansion (10−6/K)
Ni-based single-crystal superalloy0.302109.10
Al2O30.293907.70
ITO0.352006.37
In2O30.301506.50
Table 3. Mulliken overlap population of the chemical bonds.
BondPopulationBond Length (Å)
Ni(111)/Al2O3(001)Al1–Ni20.082.74
Al1–Ni40.072.75
Al1–Ni30.072.76
O2–Ni40.032.86
O3–Ni30.022.88
O1–Ni20.012.88
Ni3Al(111)/Al2O3(001)Al1(Al2O3)–Ni20.062.72
Al1(Al2O3)–Ni40.052.72
Al1(Al2O3)–Ni30.052.72
O1–Ni1−0.012.92
O2–Ni3−0.012.91
O3–Ni2−0.012.92
Publisher’s Note: MDPI stays neutral with regard to jurisdictional claims in published maps and institutional affiliations.

