Abstract
Malachite green (MG) is a triphenylmethane cationic dye used in aquaculture practice, although it has been banned in several countries. The illegal use by fish producers, however, persists due to its effectiveness, and ready and cheap supply. To prevent indiscriminate applications, strict control measures with simple analytical approaches are therefore necessary. With this purpose, a novel, cheap and simple method applying electrospun polyimide nanofibers was developed and validated for MG control in water by color image analysis. For detection, a simple apparatus and ImageJ® software to treat images captured by common smartphones were used. A detection limit of 0.013 mg/L with a linear analytical response range within the concentration of 0.05 to 0.3 mg/ L of malachite green (MG) with a correlation coefficient of 0.997 and standard deviation (n = 9) varying from 1.01 to 3.92% was achieved with the proposed method. Accuracy was assessed by recovery assays in water samples and percentages of 96.6 to 102.0% were obtained. The method is robust and suitable for the rapid and reliable monitoring of MG in water.
1. Introduction
Malachite green (MG) is a synthetic basic dye belonging to the triphenylmethane family which has been widely used in fish farming, particularly salmonids, since 1930 as a very effective antimicrobial against fungi and protozoan ectoparasites [1]. In aqueous solutions, the compound might be present as a green-colored free cation (cationic form) or as its metabolite, leucomalachite green (LMG), a colorless neutral form. The dye is an inexpensive chemical and is synthesized every year in tons. In addition, there is an absence of equally effective treatment alternatives, with particular regard to the ciliate Ichthyophthirius multifilis, responsible for the white spot disease, which propitiates its indiscriminate use [2,3].
Due to its carcinogenic, mutagenic and teratogenic potential to mammals, MG has never been registered as a veterinary drug and its use in aquaculture production is illegal. Furthermore, given its persistence in edible fish, the United States and the European Union established maximum legal residue limits of 2 µg/kg for the total MG and LMG in food [1]. Human exposure to these contaminants has been documented as mainly occurring through food and water ingestion [4,5] indicating the need to find effective, reliable and easy to implement analytical methods for controlling these toxic products in food and water.
Common methods to determine MG in water involve a pre-concentration step followed by liquid chromatography [1,6,7,8,9] and spectrophotometric (UV-Vis) analyses [10,11,12]. These methods are time-consuming and their need for chromatographic separations produce toxic organic waste. Proposals to reduce the time spent in sample pre-treatment and the volume of organic solvents were meanwhile suggested. It is the case for spectrophotometric determinations of MG residues in water samples after pre-concentration with magnetic nanosorbents [12] or the solid-phase extraction on Florisil® surface followed by digital image analysis [13].
Electrospun nanofibers have been described as advanced materials for expeditious procedures based on adsorption/pre-concentration [14,15,16] coupled to colorimetric quantitative image analyses [17,18]. The diversity of applications is justified by their main advantages such as fabrication versatility and high surface to volume ratio. The fibers are fabricated by an electrospinning technique which utilizes strong electrostatic fields to form nonwoven thin wires of very small gauges [19,20] and they have great chemical diversity depending on the choice of polymer used to fabricate them. Furthermore, and according to the type of application, they can be adapted to many devices and applied to different types of analyses [21].
Electrospun polyimide nanofibers have been used for various applications, namely fuel cell proton exchange membranes, sensors, high-temperature filtration media, adsorption of organic pollutants and so on [22]. Zhang et al. used polyimide nanofibers as precursors for constructing polyimide-based carbon nanofibers to adsorb chlorophenol, antibiotics and a dye (methylene blue) from water [23]. Its characteristics are related to their structure as is the case of aromatic polyimide nanofibers, which are known to interact with aromatic compounds by π-π interaction, resulting in a good response for removal and pre-concentration [23].
Quantitative image analysis converts images into measurable data that is correlated with the concentration of the analyte of interest [24], being attractive for its simplicity and ease of use. Color image analyses coupled with adsorption processes are a simple way to obtain analytical information with no need for long extraction methods and pre-concentration techniques that usually use toxic organic solvents [25,26,27,28].
The present work combined the versatility of electrospun polyimide nanofibers as an adsorbent material with the advantages of image analysis to develop a simple and cheap detector for MG monitoring in aquaculture media. The novel proposed detector is based on electrospun polyimide nanofibers for adsorption and pre-concentration of the colored compound.
2. Materials and Methods
All experiments were performed with double deionized water. Chemicals of analytical grade quality were used without purification. The dyes methyl orange and crystal violet (>90 wt%) were acquired from Merck (Rahway, NJ, USA) and Riedel-de Haen (Seelze, Germany). Malachite green oxalate (95–100 wt%) was purchased from VWR Chemicals (Radnor, PA, USA), and citric acid and sodium chloride were purchased from Sigma Aldrich (Burlington, MA, USA). The polyimide nanofibers were acquired and used as received as a result of the cooperation between the Department of Analytical Chemistry, Charles University—Czech Republic and Technical University of Liberec. Rectangular shaped, dip film probes were implemented employing a laminating machine, Lervia laminator model KH4412. The optimal adsorption conditions were set using a Ika shaker, model RT15 Power, a Jasco UV-Vis spectrophotometer and QS type quartz cuvettes from Hellma with an optical path length of 10.0 mm. For the pH and pHpzc (point of zero charge) measurements, a pH meter from Hach, model Sension+ PH 31 Lab was used.
2.1. Polyimide Nanofiber
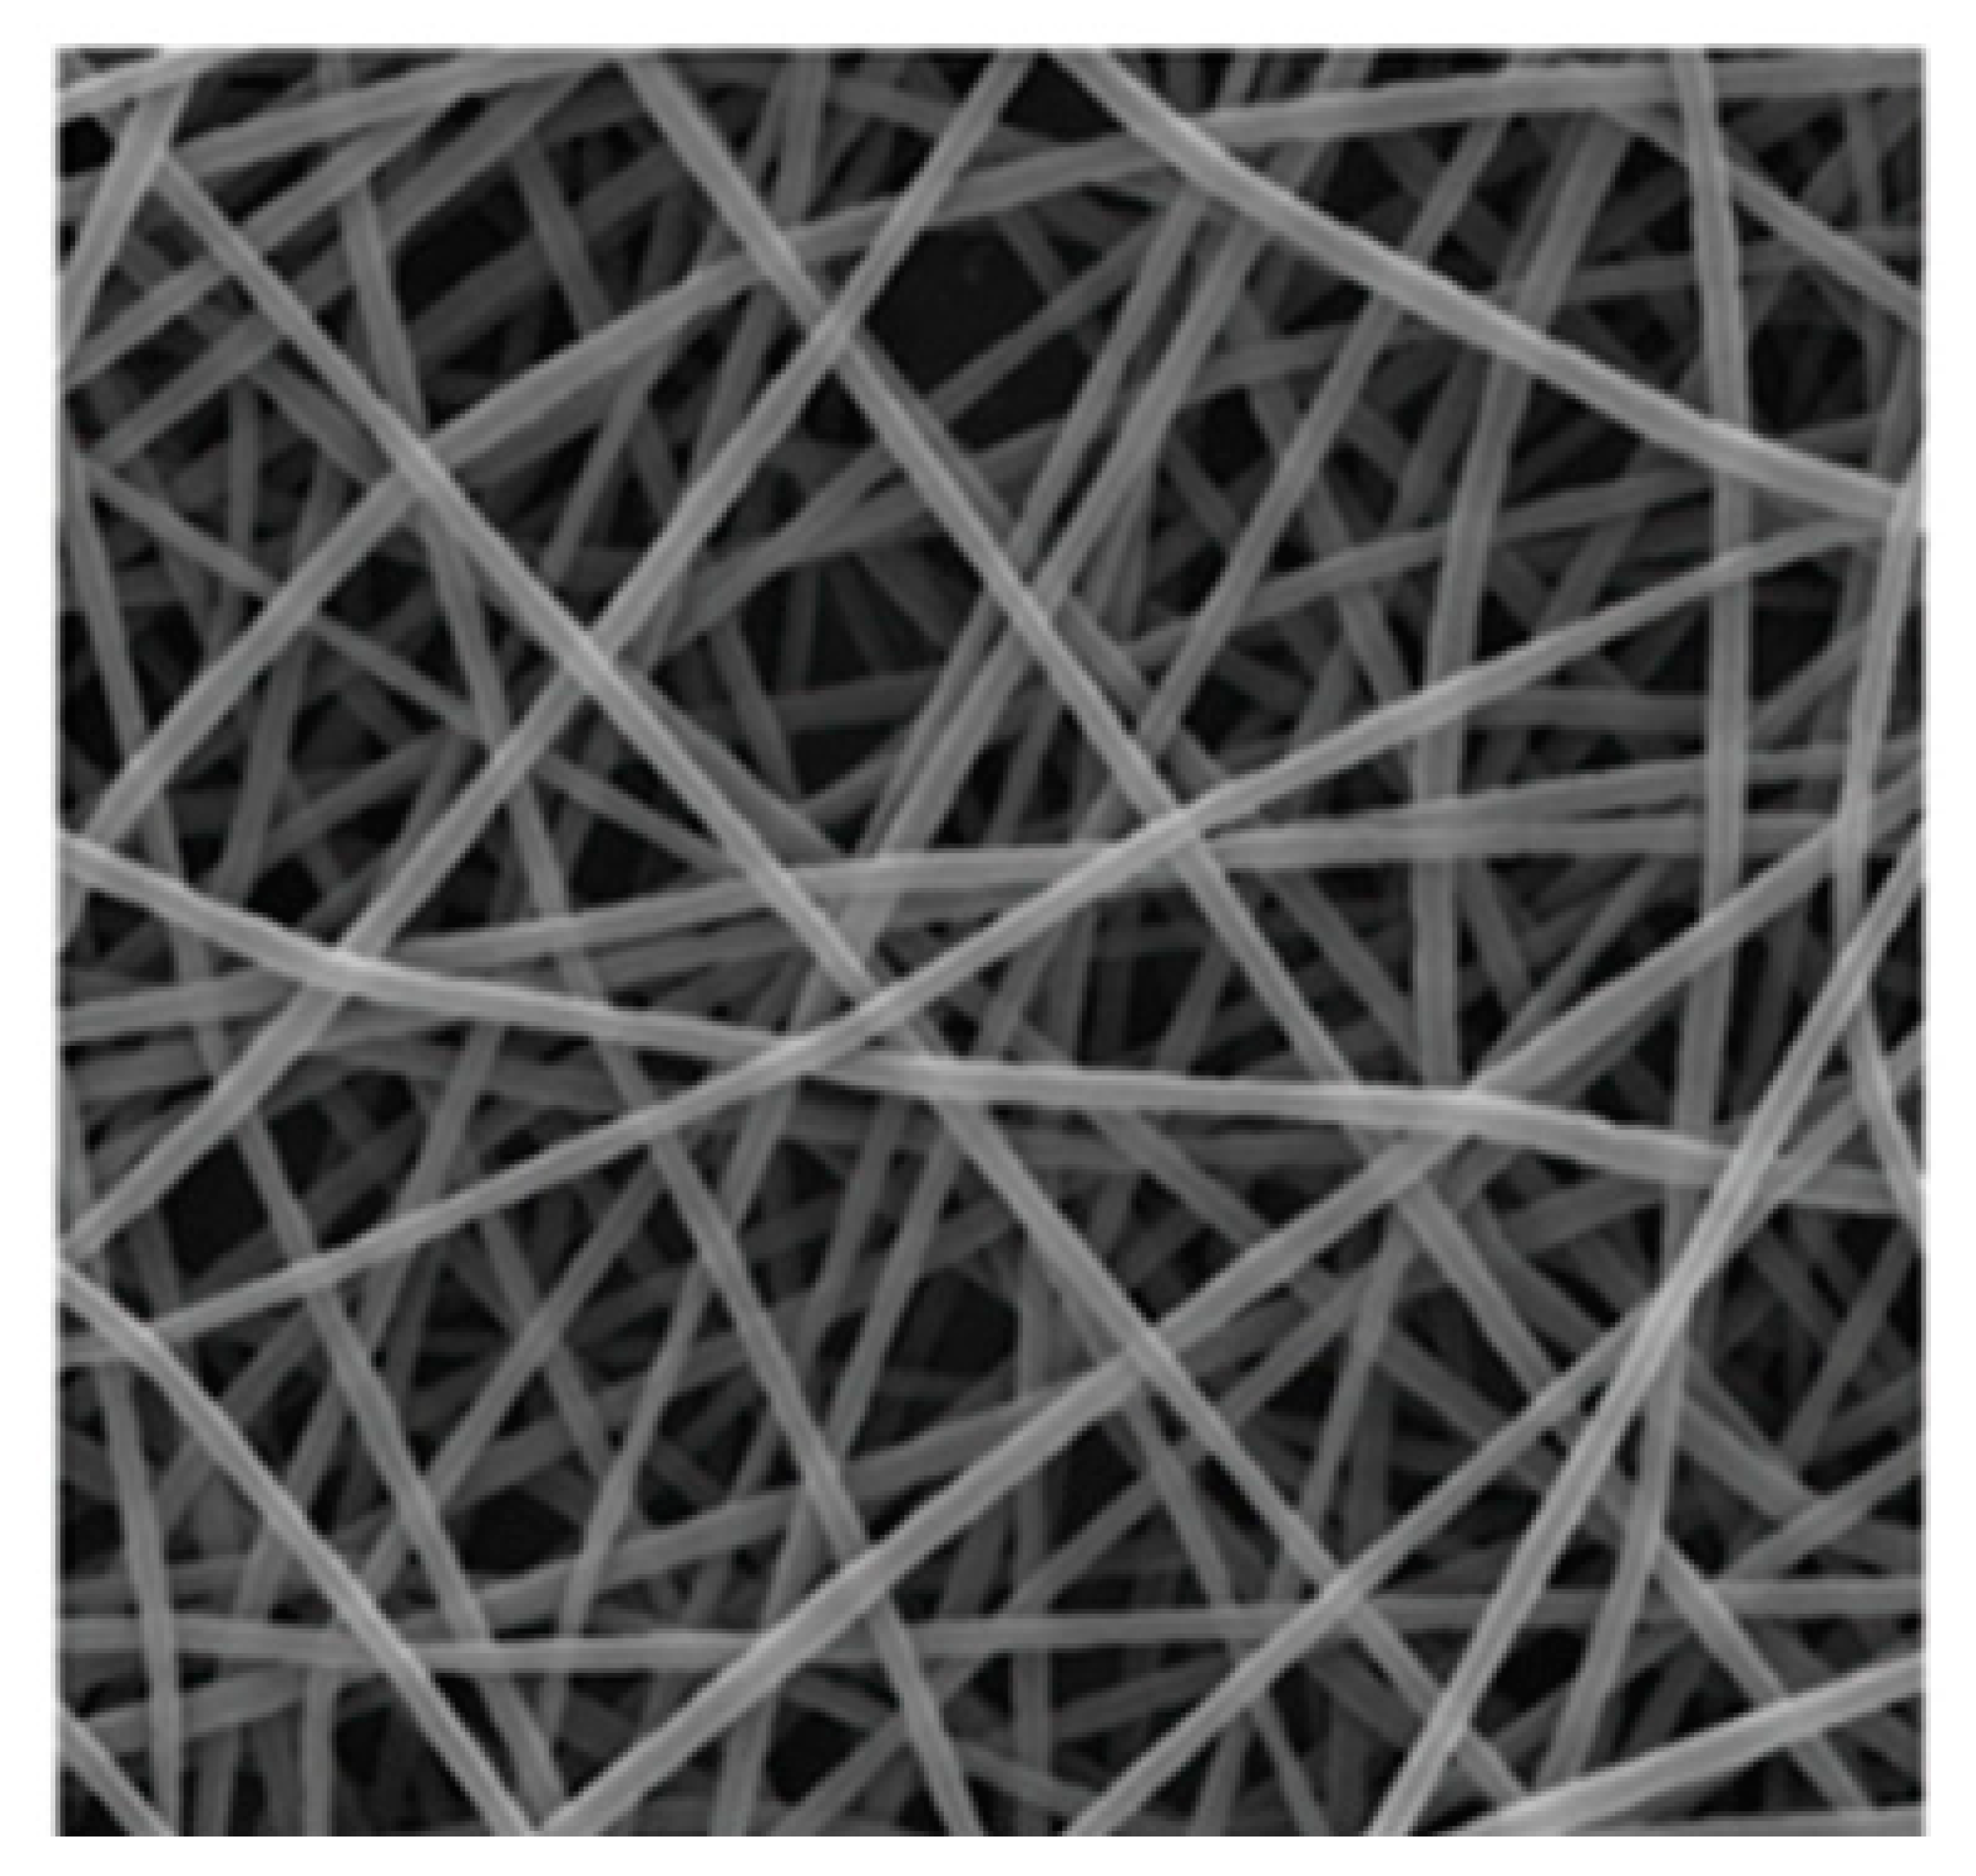
The polyimide pellets P84 TM SG were supplied by HP polymer Inc. (Vienna, Austria). N,N-dimethylacetamide (99.8%) was purchased from PENTAChemicals (Prague, Czech Republic). A 16 wt% solution of polyimide was prepared in N,N-dimethylacetamide as a solvent. The polymeric solution was stirred with a magnetic stirrer (250 RPM) at room temperature (22 °C) for 24 h to get a light yellow transparent color. The Nanospider type NS 1WS500U (Elmarco, Liberec, Czech Republic) free-surface electrospinning instrument was used for the direct current electrospinning of polyimide solution. During the process, the string electrode was at a distance of 200 mm from the collector. The spinning wire electrode was positively charged to +45 kV and the collector was negatively charged to −10 kV. The 15 mL cartridge applied the polymer solution on the electrode at a speed of 350 mm s−1 through 0.7 mm diameter orifice. Nanofibers were deposited on the supporting textile which was moved out at a speed of 35 mm min−1 to form a layer of 4 g m−2 surface density. The climatic conditions of the process were regulated by a precisely controlled air conditioning system NS AC150 1000/2000 (Elmarco). The air temperature during the process was 25 °C and the humidity 10%. Electronic microscopical scanning of the nanofiber is shown in Figure 1.

Figure 1.
SEM image of polyimide nanofibers structure. Fiber diameter: 0.234 ± 0.190 µm. contact angle 59.5 ± 6.30°.
2.2. Detector Construction
The detector was constructed to be used as an adsorbent sensor for detecting dyes in water samples, and it was shaped as a dip probe consisting of a small nanofiber disk pad, 5.0 mm in diameter, sealed between two pouch film sheets. A propylene sheet was pre-drilled with 3.0 mm diameter holes. Then, nanofiber discs were placed in the respective holes and a new acetate sheet was overlaid. The sheets were laminated at a temperature of about 80 °C using a laminator machine. At last, the laminated sheets were cut into strips, 1 cm width and 5 cm length, each containing a small disk exposed at one side (front side) by the small holes and sealed on the other side (backside). Figure 2 illustrates the construction steps of the detector as well as the appearance of the discs before and after contact with malachite green.
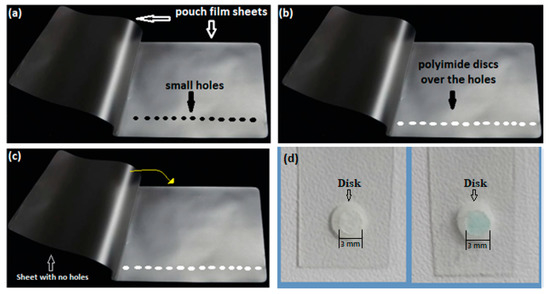
Figure 2.
Propylene film sheet with small holes (3.0 mm diameter) (a). Sheet with polyimide disks put over the small holes (b). The second sheet with no holes is to be laid over the sheet containing the disks (c). Polyimide nanofiber disks are attached to the laminated sheets before MG adsorption ((d) left) and after adsorption ((d) right).
2.3. Optimization of the Adsorption Procedure
To set the conditions for optimal performance, pads of polyimide, polypropylene and polycaprolactone nanofiber were initially tested as sorbents by soaking them in 0.1 mg/L MG and color change was evaluated for each one. Only the polyimide nanofibers provided an intense color change, visible to the naked eye, and therefore suitable for application for image analysis. In addition, the polyimide nanofiber tested was the only one among the nanofibers that showed good resistance to temperature in the laminating machine and were quite flat, which means that the MG was adsorbed onto a thin surface, requiring lower concentrations and the appearance of color was faster. Therefore, the following tests were performed only with the polyimide nanofiber. For image analysis, adsorption tests were performed on MG solutions, with defined concentration, and the disc immersion time was set at 60 min. Solutions at different pH values and with different rotation speeds were used for those studies. Rotation speeds of 150, 250 and 350 rpm were then considered for the analyte solution. For each rotation speed, the absolute value for the color intensity of the nanofiber was determined using ImageJ® histograms and the optimal rotation speed was chosen based on the highest color intensity obtained for channel R in the sRGB system.
Adsorption on a solid surface is influenced by the dissociation state of the analyte as well as the electrical charges of the adsorbent surface. Consequently, studies were carried out for different pH values of the analyte solution, evaluating their influence on the extent of adsorption. For this, the pH of 0.1 mg/L MG solutions was adjusted to 2, 4, 5, 7, 9, 10 and 12 by addition of 5.0 mL of citric acid or some drops of 0.1 mol/L, HCl and NaOH solutions. The stirring was kept at 250 rpm. The best pH value was also selected based on the highest color intensity obtained for channel R from the sRGB system.
The point of zero charge (pHpzc) of the nanofiber was assessed in triplicate by the salt addition method [29]. For this, approximately 45.0 mg of polyimide nanofiber pads were immersed for 48 h in 50.0 mL of 0.01 mol/L NaCl aqueous solution with initial pH (pHi) of 2, 4, 6, 8, and 10. The system was stirred for 48 h, and the final solution was then filtrated and the final pH (pHf) of the filtrate was measured. The pHpzc value was obtained by plotting the pHf values as a function of pHi [29].
2.4. Measurement of Color Intensity and Image Treatment
For the measurement of color intensity, image acquisition was performed in an adapted small plastic box. Two small strips of LED were wired into the box to provide artificial white light. To avoid excessive reflectance during signal acquisition, the box was internally painted with black paint. In addition, to prevent interference from external light during image acquisition, the box was also externally painted with black ink. A small hole (2.0 cm diameter) was made on the top cover of the box to adapt the smartphone camera.
To perform the image analysis, the strips containing the nanofiber discs were placed inside the box. The images were acquired with a smartphone and loaded into ImageJ® free software [30] to be further processed. Image processing consisted of eliminating the background light and selecting the central area of the pad disks.
A typical histogram was obtained after image processing and the mean value for each color of the sRGB system was related with the analyte concentrations to obtain the analytical curve.
2.5. Figures of Merit
To determine the figures of merit for the proposed method, calibration curves were carried out under the experimental conditions above described, with the adsorption step lasting 60 min. The tests were once more carried out in triplicate and consisted of placing the nanofiber disk pads, immersed in 50.0 mL of aqueous solutions of MG at 0.05, 0.10, 0.15, 0.20, 0.25 and 0.30 mg/L at the pH and stirring speed previously established. After adsorption, the images were captured and treated. Calibration curves were plotted relating the color intensity to the concentration of MG standard solutions. The absolute values for each sRGB channel were obtained from the image analysis using ImageJ® and the mean values for each channel were treated using Equation (1):
where I is the mean of absolute intensity value for each channel, I0 is the absolute intensity value for the blank, a solution with no MG, and S represents the new value that can be related to the concentration of MG in solution. The equation takes into account the contribution of the blank, used to improve precision [27].
3. Results and Discussion
3.1. Influence of Stirring Speed
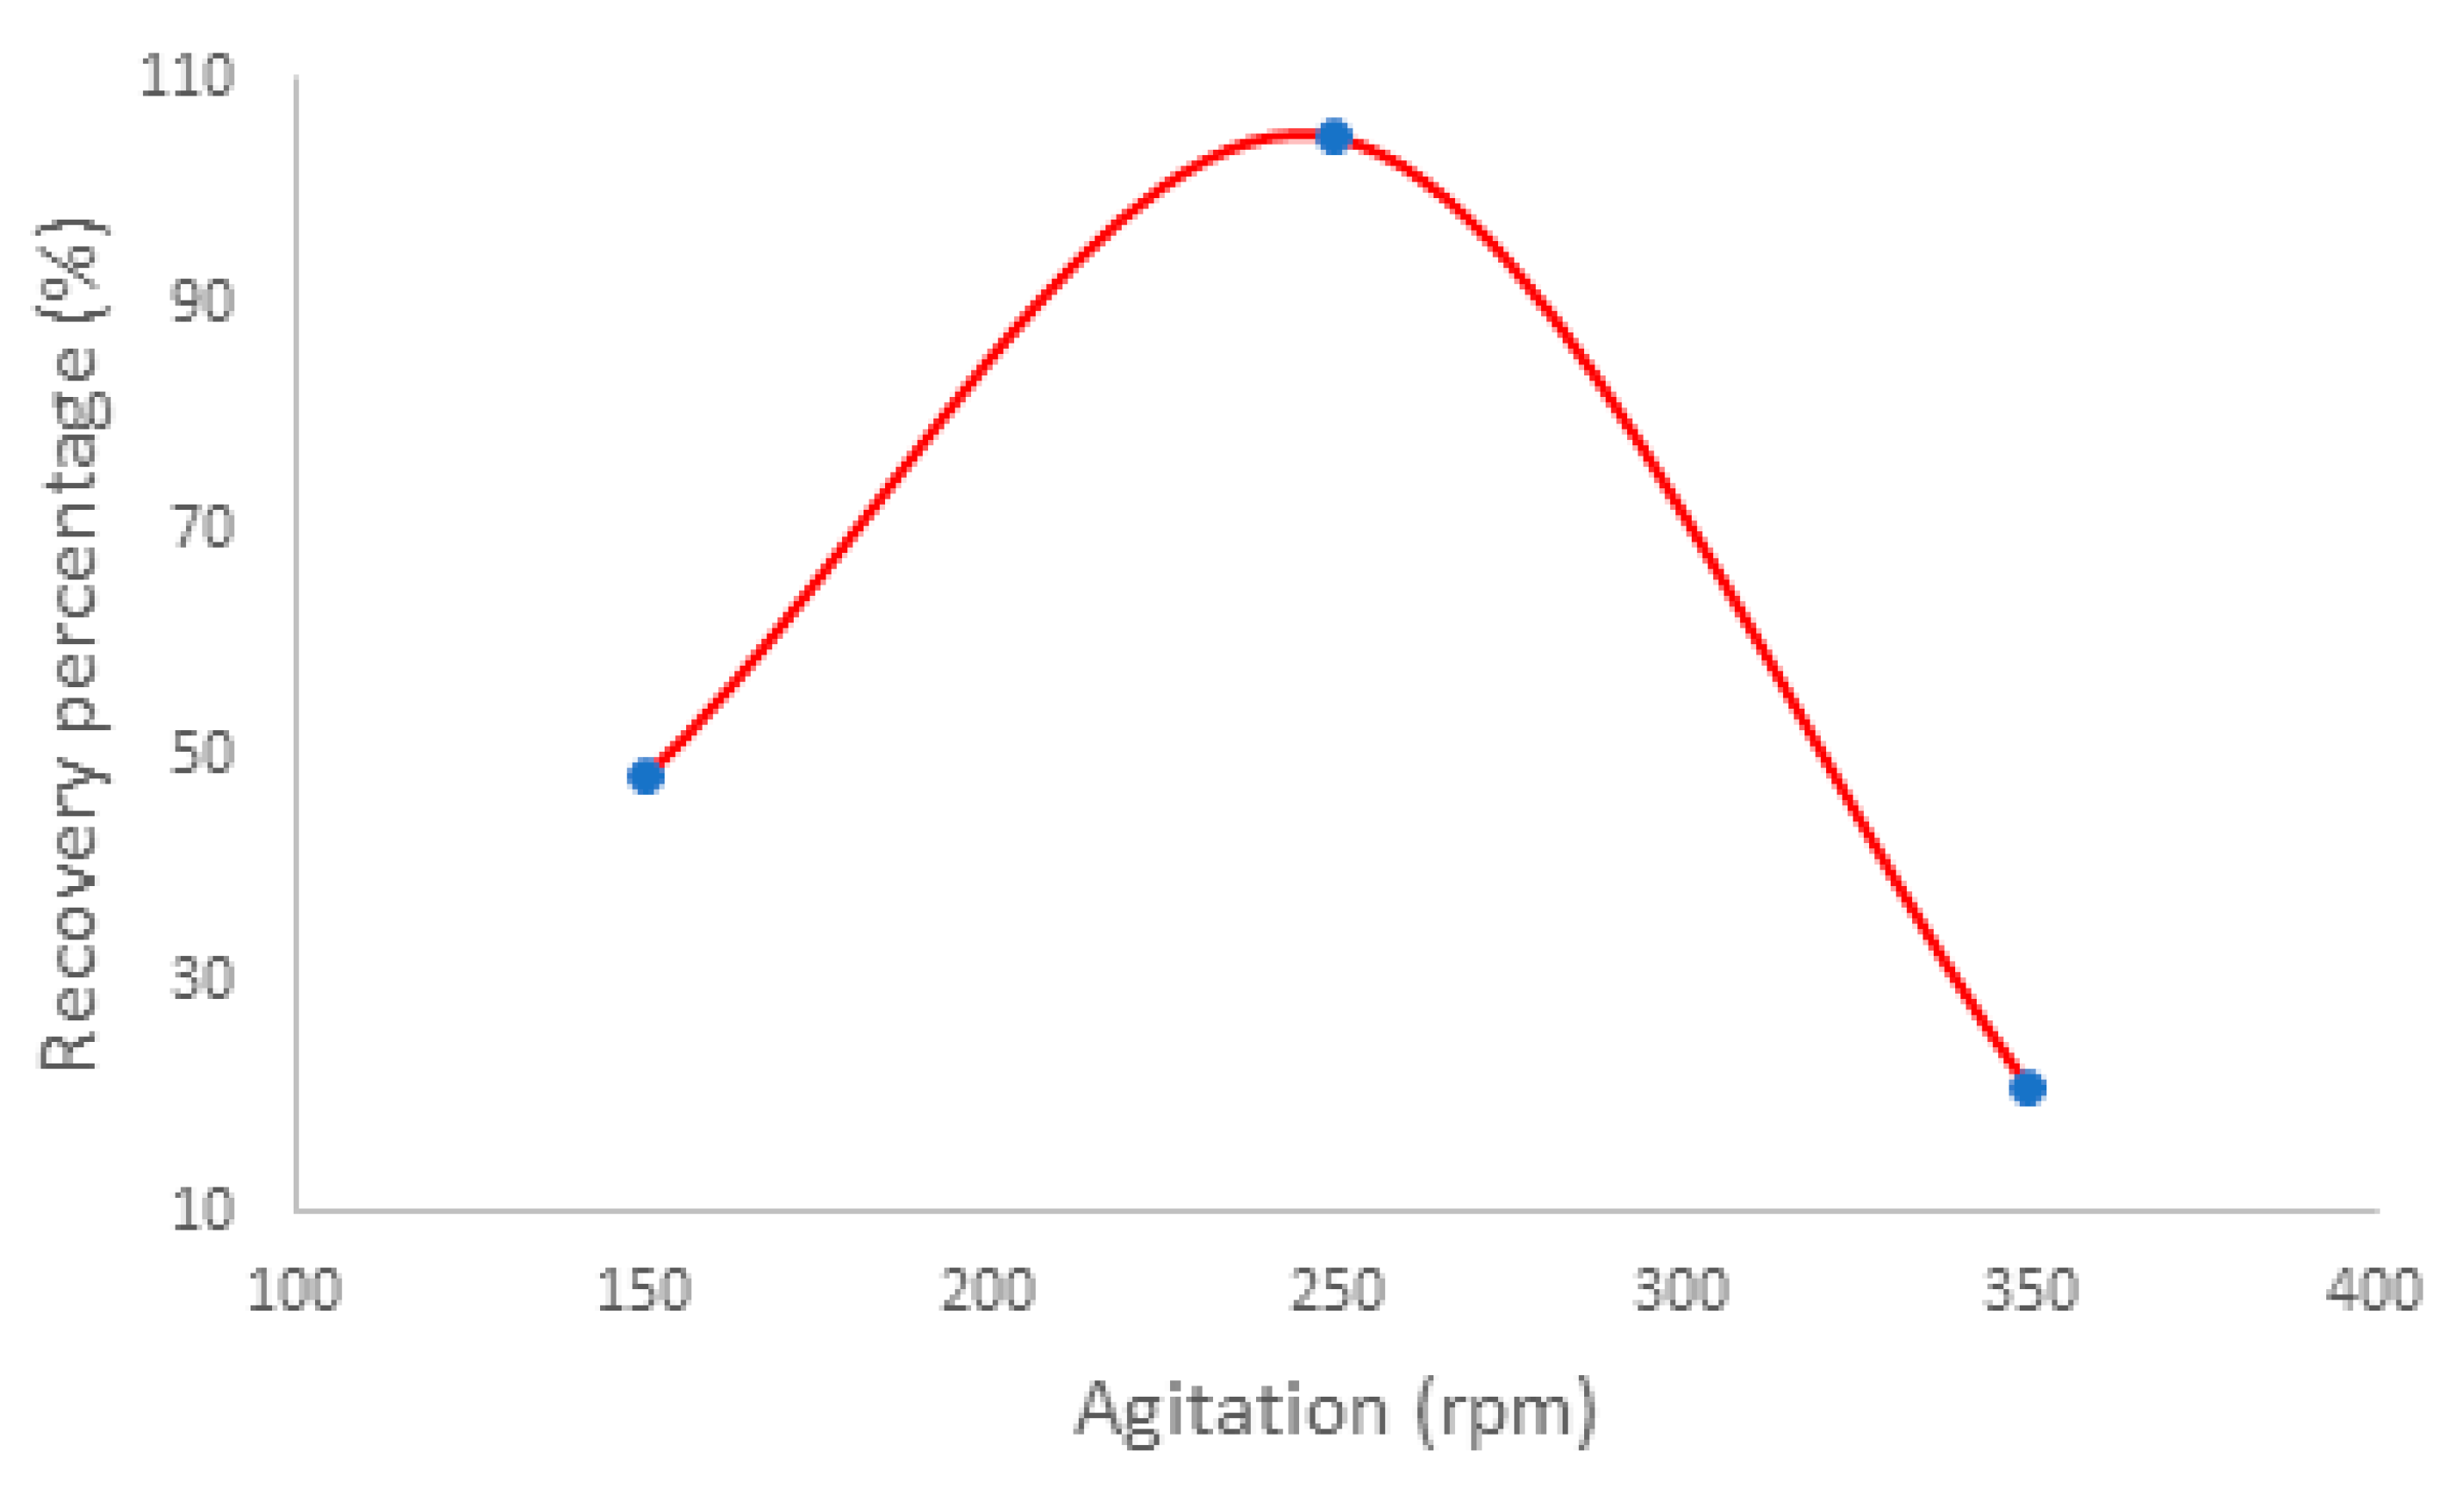
Adsorption is a mass transfer process that depends on the dynamic between adsorbent and analytes in solution. The influence of the agitation speed on the color intensity obtained was studied. The studies were carried out using a fixed solution volume (50 mL) with the pH adjusted to 5 according to the previously optimized value. The results suggest that the stirring speed favors the adsorption of malachite green and consequently increases the color intensity in the polyimide nanofiber. For the range of speed tested, 250 rpm provided the best diffusion of MG from the solution to the nanofiber and yielded higher color intensity, which is related to a higher recovery percentage, as shown in Figure 3.

Figure 3.
Recovery percentage of MG, related to the color intensity of channel R, as a function of agitation speed. Using 2.0 mg of polyimide nanofiber in contact with 50.0 mL of MG solution at 0.1 mg/L.
As can be seen in Figure 3, the agitation speed of 250 rpm provided a higher recovery percentage of malachite green. The recovery percentage is directly related to the color intensity of the nanofiber disc assessed by the channel R, since it was the most sensitive channel.
3.2. Influence of pH
Malachite green is sensitive to pH changes and shows monoprotic Bronsted acid-base behavior. Furthermore, the polyimide nanofiber itself also may be sensitive to pH changes. Therefore, the pH value that yields the best results for adsorption and simultaneously color intensity must be related either to the analyte dissociation or the chemical structure of the adsorbent [31]. The best result for color intensity related to higher adsorption percentage was obtained for pH 5 as shown in Figure 4. The greater color intensity at pH 5 is probably due to the degree of dissociation of the MG. At a pH below 5 and above 8, solutions of MG start to become yellow or colorless, respectively [13].
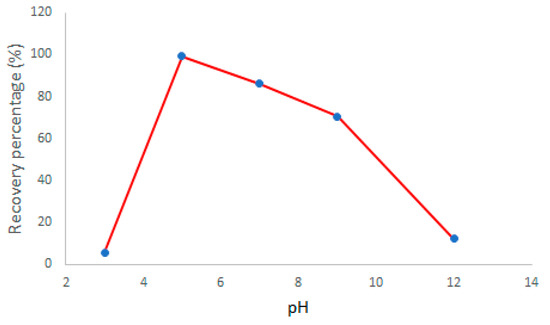
Figure 4.
Recovery percentage of MG, related to the color intensity of channel R, as a function of pH. Using 2.0 mg of polyimide nanofiber in contact with 50.0 mL of MG solution at 0.1 mg/ L.
3.3. Characterization
3.3.1. FT-IR
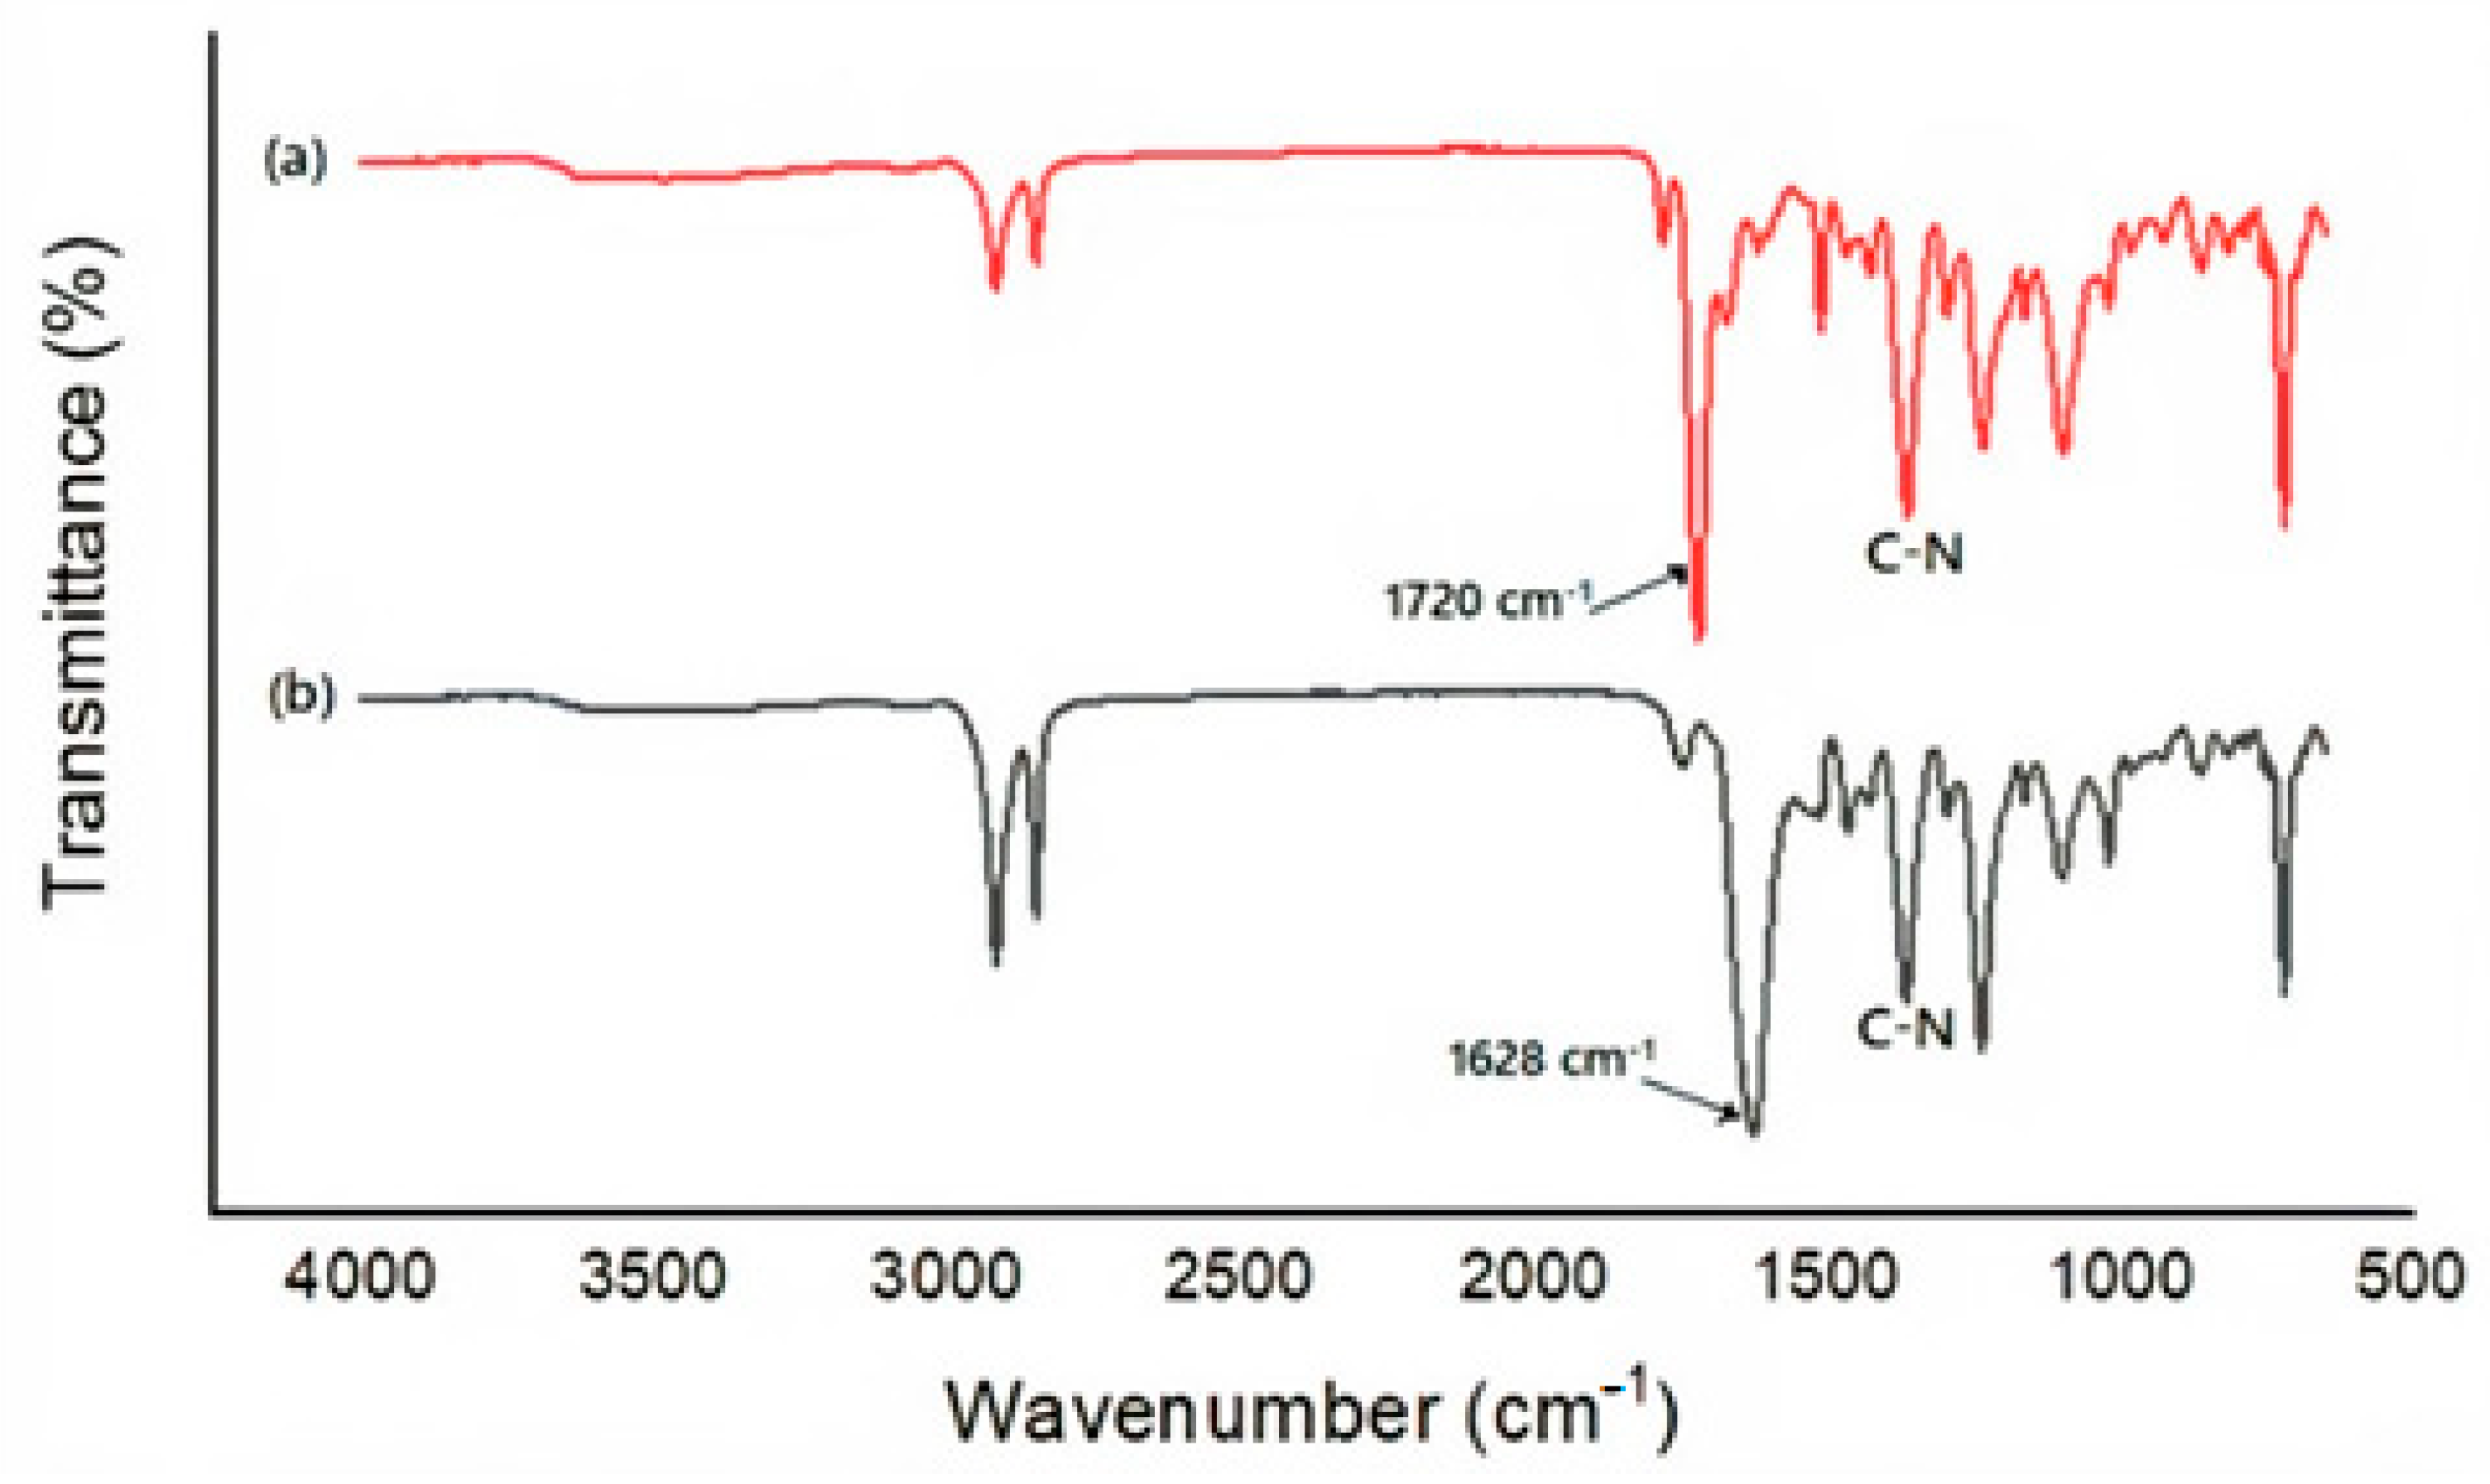
For a better understanding, FT-IR spectra were investigated to identify the main interactions between MG and polyimide nanofiber. Figure 5 shows characteristic spectra before and after the adsorption process.
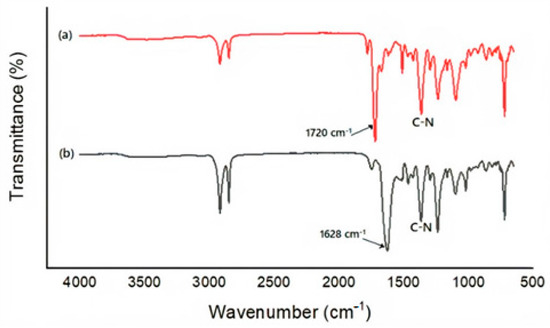
Figure 5.
FT-IR for the nanofiber before the adsorption process (a) and after the adsorption process (b).
As observed in Figure 5a, the peak at 1720 cm−1 confirms the presence of C=O symmetrical stretching and the peak at 1361 cm−1 confirms the presence of C-N stretching from the imide ring [32]. Figure 5b shows the interaction between MG and polyimide nanofiber. The C=O symmetrical stretching from the nanofiber shifted to 1628 cm−1 from 1720 cm−1 after the adsorption process suggesting some interaction of C=O from the nanofiber with the MG benzene ring [12].
3.3.2. Affinity Test (Analyte-Adsorbent)
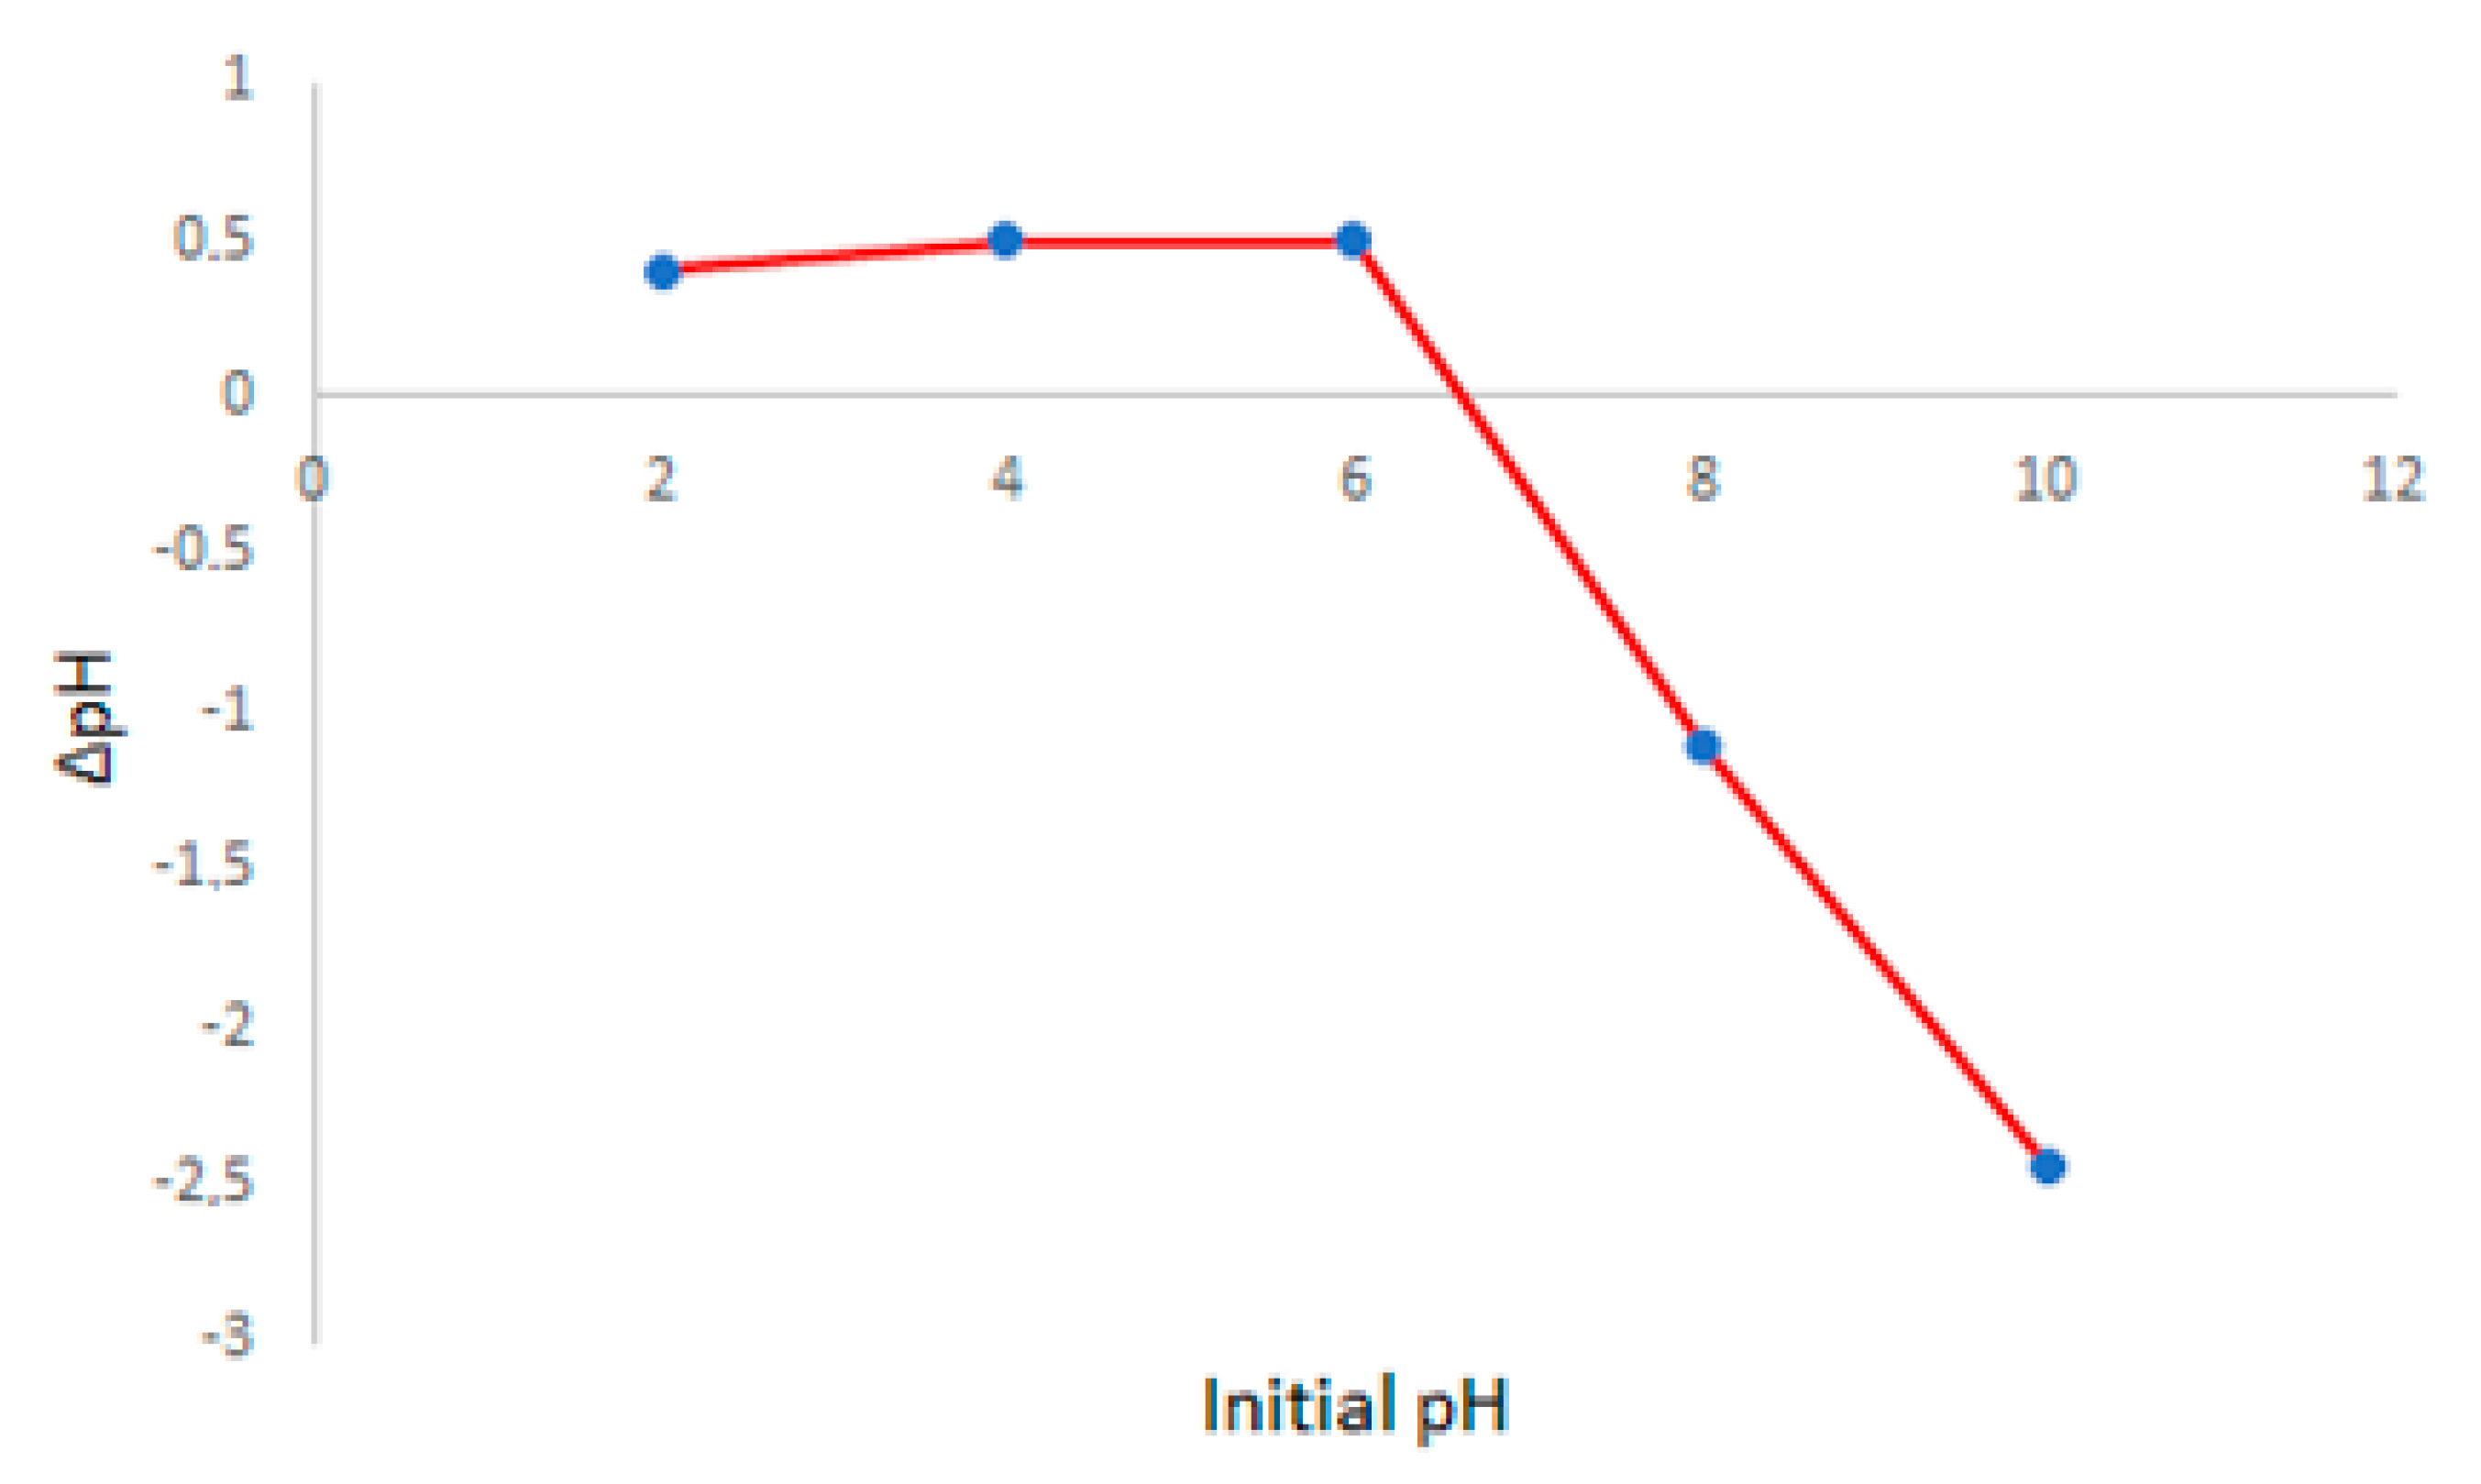
From the pH and pHpzc values, it is possible to predict the predominant form of MG in the solution [33] and the surface charge of the nanofiber [12], respectively. At pH 5, MG remains mostly in the MG+ form since its pKa is 6.9 [12]; below pH 2, it is protonated to MG+H+. [13]. The pHPZC value calculated for the nanofiber was 6.75; see Figure 6. This value indicates that the surface charge of the nanofiber is positive since the adsorption processes occurred at pH 5 [12]. It suggests that the main interaction between adsorbent and adsorbate is not electrostatic once both are positively charged. Interaction by hydrogen bonding is also unlikely because of the absence of acidic hydrogens on both structures of polyimide nanofibers [22] and the structure of MG. Therefore, π- π interaction is more likely to occur.

Figure 6.
pHPZC calculated for polyimide nanofiber under pH variation for 2.0 mg of nanofiber.
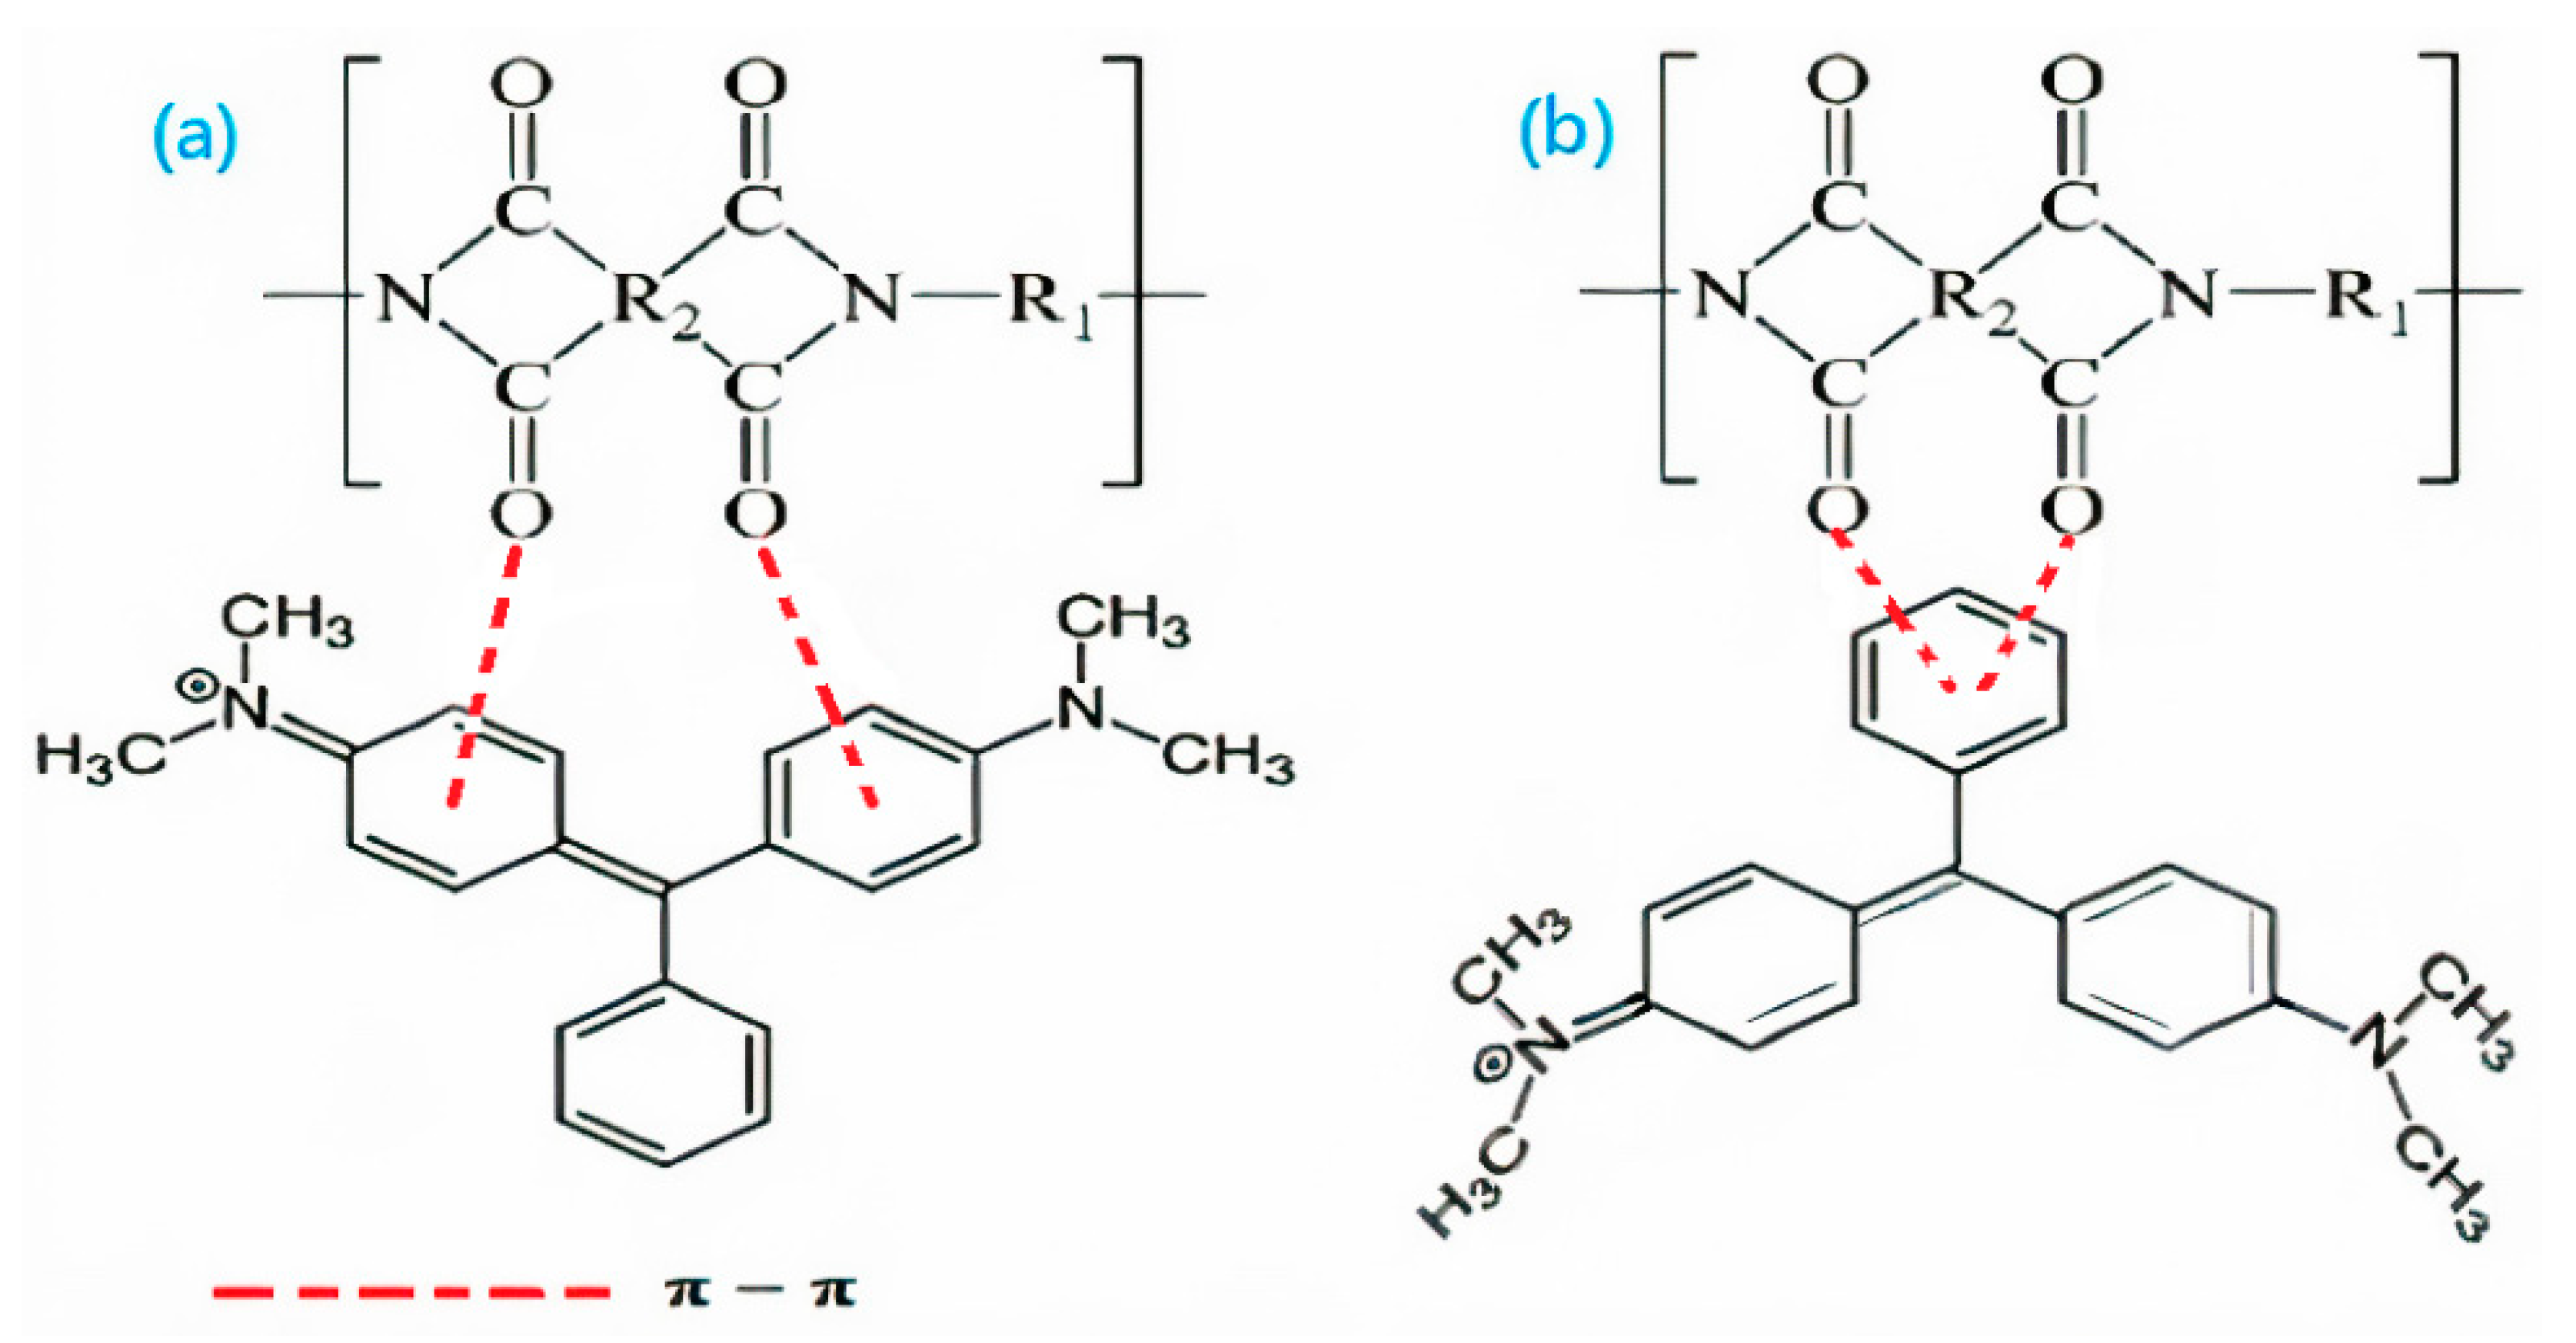
The data in Figure 7 indicates a schematic adsorption interaction between MG and the polyimide, based on the pH of the solution, the calculated pHPZC as well as the data from the infra-red analyses.
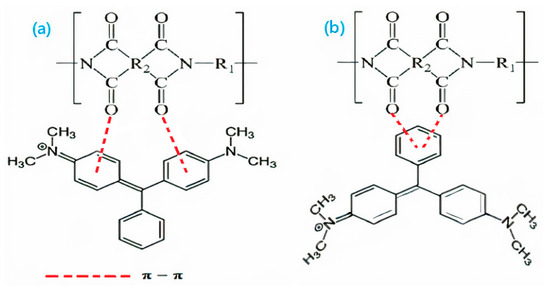
Figure 7.
Molecular structures of polyimide nanofiber and MG. Examples of possible different ways of adsorption through π-π interaction by carbon from aromatic amine (a) and benzene rings (b).
3.3.3. Adsorption Isotherms
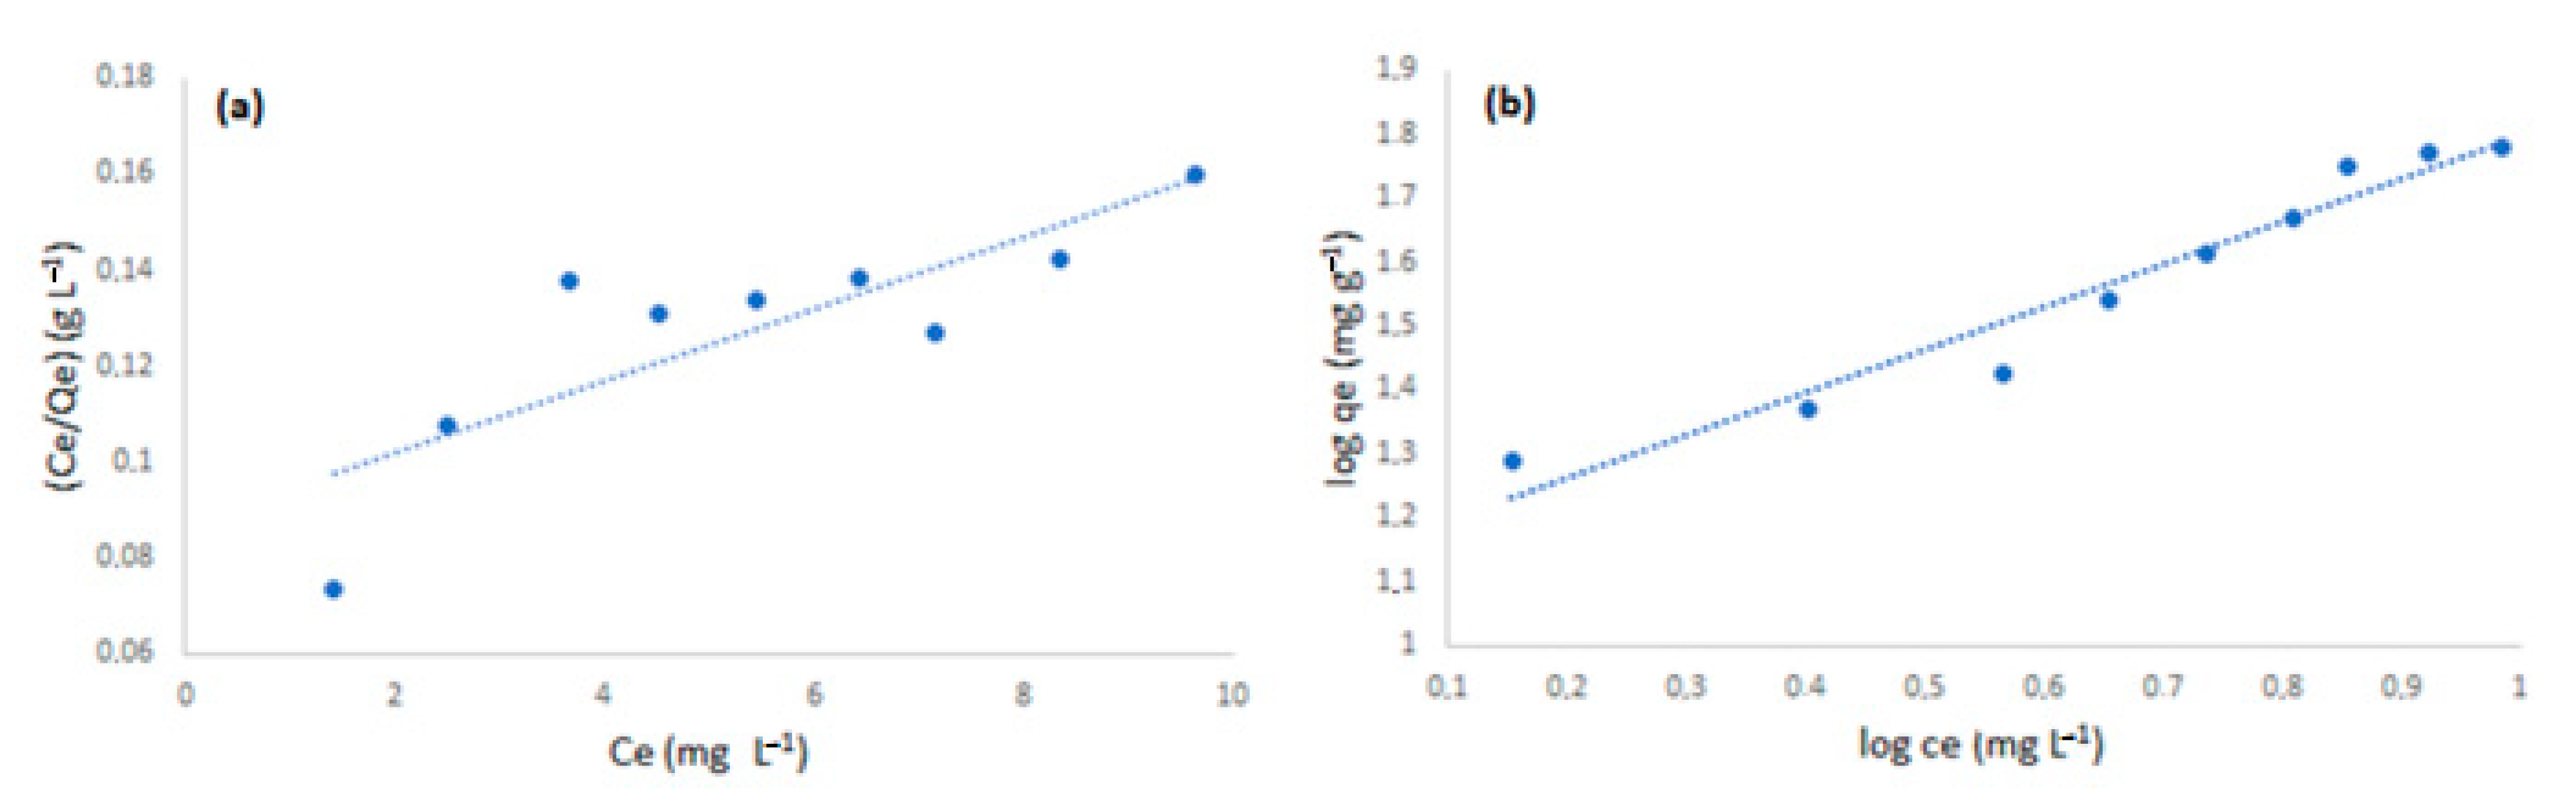
In order to make a better sense of the adsorption process, two adsorption models were studied. The isotherms for each model are presented in Figure 8 and the parameters for each model are shown in Table 1.
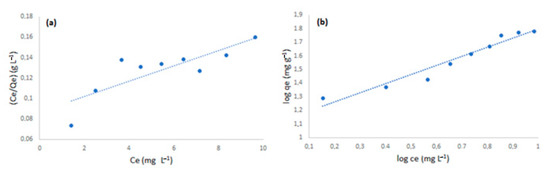
Figure 8.
Isotherms for the process of adsorption of MG to polyimide nanofiber. Langmuir model (a). Freundlich model (b). Using 2.0 mg of adsorbent at 20 °C.

Table 1.
Parameters for adsorption of malachite green to polyimide nanofiber.
According to the parameters shown in Table 1, the Freundlich model better explains the process of adsorption with higher R-squared. The models were linearized to facilitate the interpretation of the adsorption process and the assessment of the relevant parameters. According to this model, the adsorption was favorable since the constant 1/n is lower than 1, and the interaction between analyte and adsorbent was strong due to the value of KF. Additionally, the Freundlich isotherm suggests nonuniform sites of adsorption as well as different energy interaction for the different sites, which is much closer to the real experiments. The experiments suggest a strong interaction between analyte and adsorbent since there was difficulty at developing a method to remove the analyte from the adsorbent. Therefore, the interaction is better represented by the Freundlich model.
The figures of merit constitute the reference to assure the method reliability. To assess these, different parameters needed to be evaluated, as described below.
3.4. Analytical Parameters
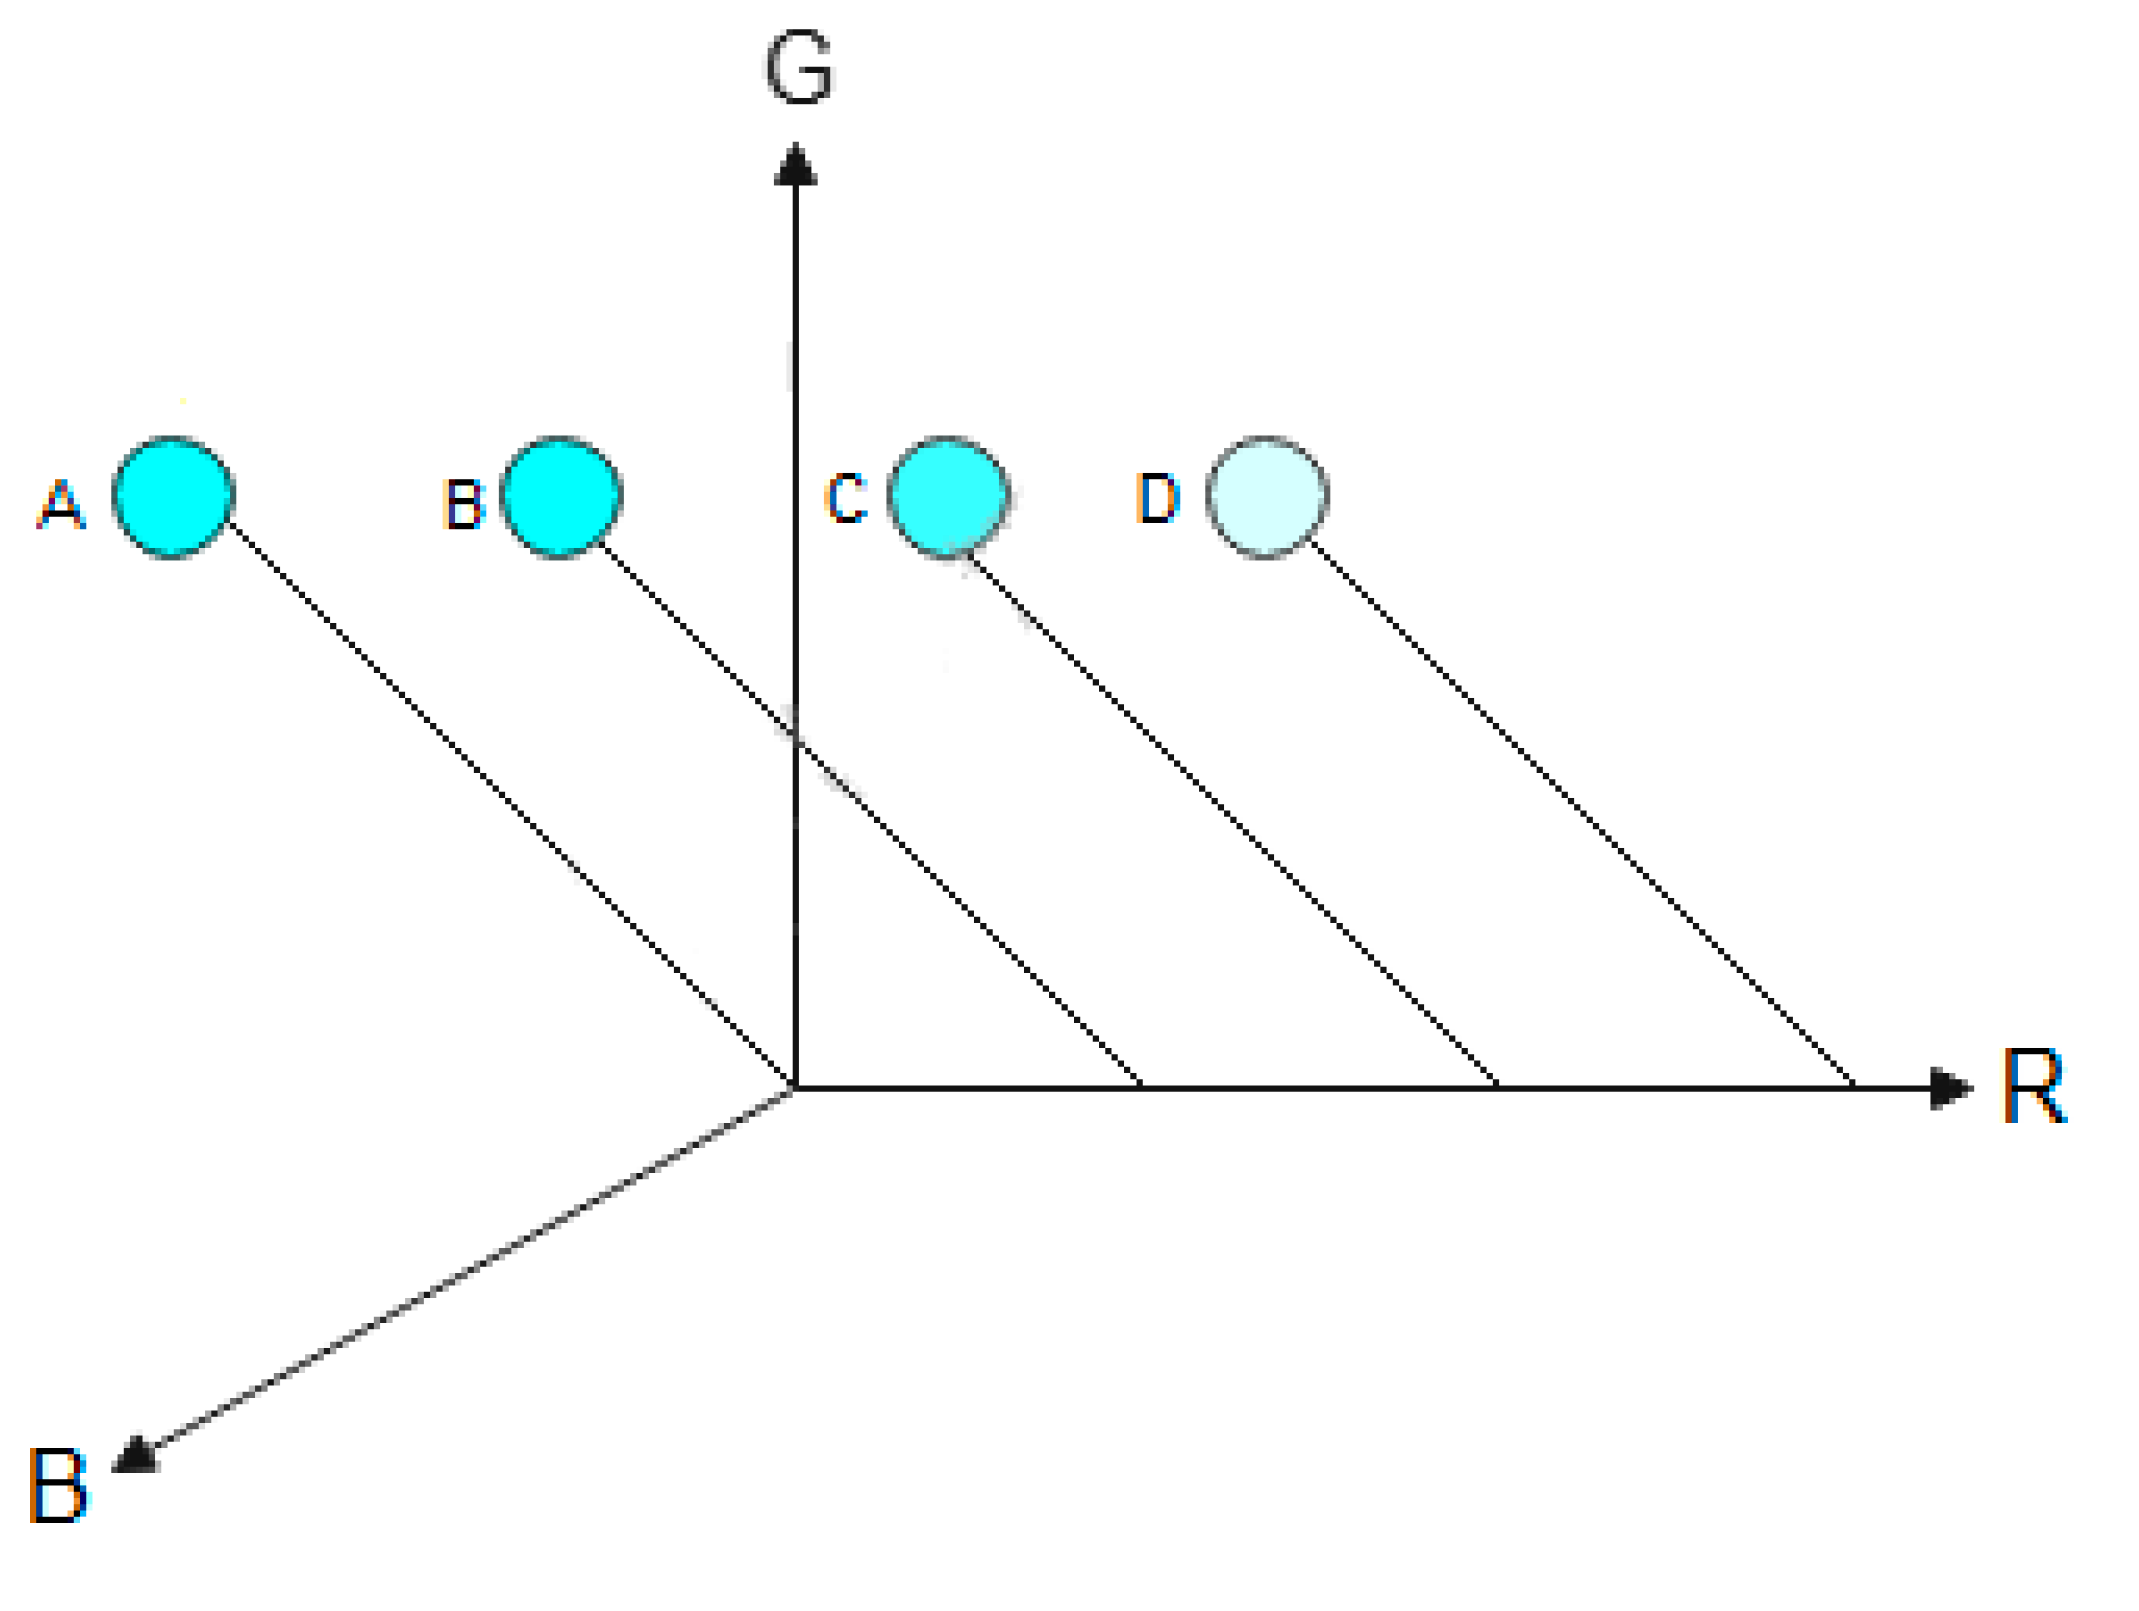
For the sRGB system, the channels green and blue did not give enough variation against concentration changes to construct an analytical curve. Therefore, S in Equation (1) represents values obtained as a function of the color intensity yielded only by the channel R, and these values were related to the concentration of MG for the construction of the calibration curve. Figure 9 represents the variation of the color intensity as a function of channel R.
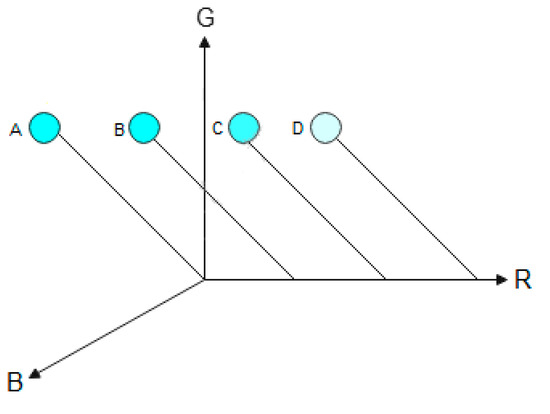
Figure 9.
Behavior of the cyan color as a function of the red channel. A (0, 255, 255). B (75, 255, 255). C (150, 255, 255). D (225, 255, 255). For (R, G, B) values.
As can be seen in Figure 9, as the green (y-direction) and blue (z-direction) channels are maintained constant and the red channel (x-direction) varies, the intensity of the cyan color varies. The letters (A–D) represent the variations of the color. The first circle (A) represents the maximum intensity (0, 255, 255) and the last circle (250, 255, 255) represents the intensity close to the minimum with a red channel equal to 250. The maximum cyan intensity is when the green and blue channels are equal to 255 and the red channel is equal to 0. If the red channel increases, the cyan color intensity decreases, as demonstrated by Cheng et al. [34].
A dynamic linear range with a good correlation coefficient from 0.05 to 0.3 mg/L was obtained after the adsorption assay and under the optimized experimental conditions.
The linear equation was S = 0.253X + 0.0016, where X is the concentration of MG and S the values obtained as a function of color intensity of channel R according to Equation (1). Standard error of 0.18% with a correlation coefficient of 0.997 indicates a reliable linear correlation between the concentration of MG and the variation of color intensity for channel R. The limit of detection (LOD) and limit of quantitation (LOQ) were calculated from the analytical curve, based on 3 and 10 times the standard deviation of the intercept divided by the angular coefficient, respectively [35].
Although the articles showing the determination of MG through image analysis are scarce, Table 2 shows the most relevant methods described in the literature for MG determination in real samples for comparison purposes. As shown in Table 2, the methods involving image analysis provide lower limits of detection and higher recovery values. However, the method developed with nanofiber applies the least amount of adsorbent. Compared to the other methods using different processes for detection, the methods based on image analysis are rather simple, cheap, less time consuming and environmentally friendly.
Table 2.
Comparison of the proposed method to determine MG in water to other similar methods.
3.5. Selectivity
The selectivity of the developed detector was evaluated considering two different dyes as interferents. Crystal violet was chosen since it is from the same family as MG and may be found in aquaculture waters. A second dye (methyl orange) was also chosen because it belongs to a different family than MG.
The study was conducted by evaluating the recovery percentage of MG in the presence of crystal violet and methyl orange at two concentrations levels (0.05 and 0.3 mg/L). The concentrations of MG were maintained constant and equal to 0.1, 0.2 and 0.3 mg/L for each of the studied interfering concentration levels. The results can be observed in Figure 10.
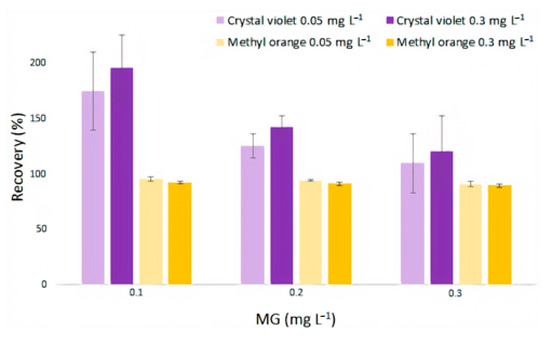
Figure 10.
Recovery of MG in the presence of crystal violet and methyl orange.
Malachite green is the oldest and most widely used dye in fish production due to its availability, reduced acquisition cost and well-recognized effectiveness as anti-fungi compared to other dyes, and the presence of potential interferents such as crystal violet, in aquaculture water is very remote [11].
Concerning crystal violet interference, Figure 10 shows a very high recovery percentage for MG in the presence of crystal violet, ranging from 109.9 to 196.0%. This was expected because crystal violet is chemically similar to MG, as both are from the triphenylmethane family. Crystal violet may interact with polyimide nanofiber in a similar way as MG, therefore, a considerable contribution to the color registered by the R channel by crystal violet is also responsible for the interference. The study performed with methyl orange in the same conditions as the crystal violet show that the interference is possibly more related to the color registered in the R channel than to the dye adsorption by the nanofiber. A little suppression of the response of MG over channel R was observed once the recovery varied from 95.4 to 89.6%, when the MG concentration increased from 0.1 to 0.3 mg/L.
Differently from crystal violet, the color of methyl orange solutions does not behave as a function of channel R; that is, whatever the intensity of the colors of these solutions, channel R remains almost constant at high values. This could explain the suppression of the response of MG, because as much as channel R tends to go down as the concentration of MG increases, methyl orange seems to hold this channel at a constant value, not allowing the recovery to hit a 100% or more. Thus, the recovery of MG in the presence of methyl orange stayed in an acceptable interval. In addition, there is no positive contribution as for low concentrations of crystal violet, probably because methyl orange does not interact with the nanofiber the same way MG and crystal violet do.
3.6. Real Sample Analysis
To evaluate the analytical utility of the proposed detector, malachite green content in a real sample (water sample from the Douro River, Portugal) was determined. The sample was collected, vacuum filtered with cellulose membrane of 0.45 µm pore size and kept at a temperature of 4 °C after pH adjustment to pH 5 by using a citric acid, NaOH and HCl aqueous solution at 0.1 mol/L. The sample was spiked with MG in different concentrations (0.1, 0.2 and 0.3 mg/L) and the respective recovery values were determined. The results are shown in Table 3.
Table 3.
Results for the recovery study in a real water sample.
4. Conclusions
A new method based on electrospun polyimide nanofibers for MG adsorption and color intensity determination was successfully developed.
The color adsorption processes of electrospun polyimide nanofiber coupled to image analyses is simple and feasible, allowing MG control at very low concentration levels.
The detection process is simple, effective, inexpensive, environmentally friendly and can be used in field analysis. These aspects are especially advantageous when compared to the diagnostic methods described above, which require sample preparations and do not allow real-time measurements.
The evaluation of the nanofiber’s selective capabilities showed that crystal violet is a potential interference as it interacts with the nanofiber in similar way to MG. This interferent at low concentrations greatly estimates the concentration of MG but when the concentration of MG increases, its competitive effect on the nanofiber is reduced.
Author Contributions
Conceptualization: A.d.N.A., C.G.A. and M.C.B.S.M.M.; methodology, F.L.A.d.S., C.G.A., A.d.N.A. and M.C.B.S.M.M.; validation: F.L.A.d.S.; investigation: F.L.A.d.S., C.G.A., A.d.N.A., A.P.S.P. and M.C.B.S.M.M.; resources: M.C.B.S.M.M., C.G.A., A.d.N.A. and D.Š.; writing—original draft preparation: F.L.A.d.S., C.G.A., A.P.S.P. and M.C.B.S.M.M.; writing—review and editing: F.L.A.d.S., C.G.A., A.P.S.P. and M.C.B.S.M.M.; visualization: F.L.A.d.S., C.G.A., A.d.N.A., A.P.S.P., M.C.B.S.M.M. and D.Š.; supervision: C.G.A., A.P.S.P. and M.C.B.S.M.M.. All authors have read and agreed to the published version of the manuscript.
Funding
The authors are grateful to the agencies FACEPE/NUQAAPE (PRONEX Proc. APQ-0346-1.06/14) and CNPq/FAPESP/INCTAA (CNPq 465768/2014-8, FAPESP 2014/50951-4) for financial support. This research was financed in part by the Programa Institucional de Internacionalização, PRINT-88887.371647/2019-00. Research fellowships and scholarships granted by CNPq (Proc. 307397/2018-1). This work was financed by national funds through FCT/MCTES–Portuguese Foundation for Science and Technology within the scope of the project UIDB/50006/2020 from the European Union (FEDER funds through COMPETE POCI-01-0145-FEDER-031322) and national funds (FCT) through project PTDC/MEC-CAR/31322/2017 and from the North Portugal Regional Coordination and Development Commission (CCDR-N)/NORTE2020/Portugal 2020 (Norte-01-0145-FEDER-000024). D.Š. acknowledges the financial support of the project EFSA-CDN (No. CZ.02.1.01/0.0/0.0/16_019/0000841), co-funded by ERDF.
Acknowledgments
The authors are grateful to Jakub Erben from The Technical University of Liberec, Faculty of Textile Engineering, Department of Nonwovens and Nanofibrous Materials for the polyimide nanofibers. The English text of this paper has been revised by Sidney Pratt, Canadian, MAT (Johns Hopkins University), RSAdip-TESL (Cambridge University).
Conflicts of Interest
The authors declare that they have no known competing financial interests or personal relationships that could have influenced the work reported in this paper.
References
- Hashimoto, J.C.; Paschoal, J.A.R.; De Queiroz, J.F.; Reyes, F.G.R. Considerations on the use of malachite green in aquaculture and analytical aspects of determining the residues in fish: A review. J. Aquat. Food Prod. Technol. 2011, 20, 273–294. [Google Scholar] [CrossRef]
- Šafařík, I.; Šafaříková, M. Detection of low concentrations of malachite green and crystal violet in water. Water Res. 2002, 36, 196–200. [Google Scholar] [CrossRef]
- Sudova, E.; Machova, J.; Svobodova, Z.; Vesely, T. Negative effects of malachite green and possibilities of its replacement in the treatment of fish eggs and fish: A review. Vet. Med. 2007, 52, 527–539. [Google Scholar] [CrossRef]
- Mitrowska, K.; Posyniak, A.; Zmudzki, J. Determination of malachite green and leucomalachite green residues in water using liquid chromatography with visible and fluorescence detection and confirmation by tandem mass spectrometry. J. Chromatogr. A 2008, 1207, 94–100. [Google Scholar] [CrossRef]
- Srivastava, S.; Sinha, R.; Roy, D. Toxicological effects of malachite green. Aquat. Toxicol. 2004, 66, 319–329. [Google Scholar] [CrossRef]
- Hajee, C.A.J.; Haagsma, N. Simultaneous determination of malachite green and its metabolite leucomalachite green in eel plasma using post-column oxidation. J. Chromatogr. B Biomed. Sci. Appl. 1995, 669, 219–227. [Google Scholar] [CrossRef]
- Sagar, K.; Smyth, M.R.; Wilson, J.G.; McLaughlin, K. High-performance liquid chromatographic determination of the triphenylmethane dye, malachite green, using amperometric detection at a carbon fibre microelectrode. J. Chromatogr. A 1994, 659, 329–336. [Google Scholar] [CrossRef]
- Xie, J.; Peng, T.; Chen, D.D.; Zhang, Q.J.; Wang, G.M.; Wang, X.; Guo, Q.; Jiang, F.; Chen, D.; Deng, J. Determination of malachite green, crystal violet and their leuco-metabolites in fish by HPLC-VIS detection after immunoaffinity column clean-up. J. Chromatogr. B Anal. Technol. Biomed. Life Sci. 2013, 913–914, 123–128. [Google Scholar] [CrossRef]
- Wang, Y.; Chen, L. Analysis of malachite green in aquatic products by carbon nanotube-based molecularly imprinted-matrix solid phase dispersion. J. Chromatogr. B Anal. Technol. Biomed. Life Sci. 2015, 1002, 98–106. [Google Scholar] [CrossRef]
- Alipanahpour Dil, E.; Ghaedi, M.; Asfaram, A.; Zare, F.; Mehrabi, F.; Sadeghfar, F. Comparison between dispersive solid-phase and dispersive liquid–liquid microextraction combined with spectrophotometric determination of malachite green in water samples based on ultrasound-assisted and preconcentration under multi-variable experimental design optimization. Ultrason. Sonochem. 2017, 39, 374–383. [Google Scholar] [CrossRef]
- Ling, Y.Y.; Mohd Suah, F.B. Extraction of malachite green from wastewater by using polymer inclusion membrane. J. Environ. Chem. Eng. 2017, 5, 785–794. [Google Scholar] [CrossRef]
- Sabzroo, N.; Bastami, T.R.; Karimi, M.; Heidari, T.; Agarwal, S.; Gupta, V.K. Synthesis and characterization of magnetic poly(acrylonitrile-co-acrylic acid) nanofibers for dispersive solid phase extraction and pre-concentration of malachite green from water samples. J. Ind. Eng. Chem. 2018, 60, 237–249. [Google Scholar] [CrossRef]
- Apolônio, L.F.; de Oliveira, A.F.; Almeida, C.A.; Neves, A.A.; de Queiroz, M.E.L.R.; Zampier, L.M. Direct determination of malachite green and leucomalachite green in natural waters by exploiting solid-phase sorption and digital image. Orbital 2020, 12, 193–204. [Google Scholar] [CrossRef]
- Háková, M.; Havlíková, L.C.; Chvojka, J.; Švec, F.; Solich, P.; Šatínský, D. Nanofiber polymers as novel sorbents for on-line solid phase extraction in chromatographic system: A comparison with monolithic reversed phase C18 sorbent. Anal. Chim. Acta 2018, 1018, 26–34. [Google Scholar] [CrossRef]
- Háková, M.; Havlíková, L.C.; Chvojka, J.; Erben, J.; Solich, P.; Švec, F.; Šatínský, D. A comparison study of nanofiber, microfiber, and new composite nano/microfiber polymers used as sorbents for on-line solid phase extraction in chromatography system. Anal. Chim. Acta 2018, 1023, 44–52. [Google Scholar] [CrossRef]
- Háková, M.; Chocholoušová Havlíková, L.; Solich, P.; Švec, F.; Šatínský, D. Electrospun nanofiber polymers as extraction phases in analytical chemistry–The advances of the last decade. TrAC-Trends Anal. Chem. 2019, 110, 81–96. [Google Scholar] [CrossRef]
- Wang, X.; Si, Y.; Wang, J.; Ding, B.; Yu, J.; Al-Deyab, S.S. A facile and highly sensitive colorimetric sensor for the detection of formaldehyde based on electro-spinning/netting nano-fiber/nets. Sens. Actuator. B Chem. 2012, 163, 186–193. [Google Scholar] [CrossRef]
- Valdez, M.; Gupta, S.K.; Lozano, K.; Mao, Y. ForceSpun polydiacetylene nanofibers as colorimetric sensor for food spoilage detection. Sens. Actuator. B Chem. 2019, 297, 126734. [Google Scholar] [CrossRef]
- Huang, Z.M.; Zhang, Y.Z.; Kotaki, M.; Ramakrishna, S. A review on polymer nanofibers by electrospinning and their applications in nanocomposites. Compos. Sci. Technol. 2003, 63, 2223–2253. [Google Scholar] [CrossRef]
- Ellison, C.J.; Phatak, A.; Giles, D.W.; Macosko, C.W.; Bates, F.S. Melt blown nanofibers: Fiber diameter distributions and onset of fiber breakup. Polymer 2007, 48, 3306–3316. [Google Scholar] [CrossRef]
- Zhang, Y.; Kang, X.; Chen, L.; Pan, C.; Yao, Y.; Gu, Z.Z. Fiber-packed SPE tips based on electrospun fibers. Anal. Bioanal. Chem. 2008, 391, 2189–2197. [Google Scholar] [CrossRef] [PubMed]
- Ding, Y.; Hou, H.; Zhao, Y.; Zhu, Z.; Fong, H. Electrospun polyimide nanofibers and their applications. Prog. Polym. Sci. 2016, 61, 67–103. [Google Scholar] [CrossRef]
- Zhang, Y.; Ou, H.; Liu, H.; Ke, Y.; Zhang, W.; Liao, G.; Wang, D. Polyimide-based carbon nanofibers: A versatile adsorbent for highly efficient removals of chlorophenols, dyes and antibiotics. Collo. Surf. A Physicochem. Eng. Asp. 2018, 537, 92–101. [Google Scholar] [CrossRef]
- Oberholzer, M.; Östreicher, M.; Christen, H.; Brühlmann, M. Methods in quantitative image analysis. Histochem. Cell Biol. 1996, 105, 333–355. [Google Scholar] [CrossRef]
- Safarik, I.; Baldikova, E.; Prochazkova, J.; Pospiskova, K. Smartphone-based image analysis for evaluation of magnetic textile solid phase extraction of colored compounds. Heliyon 2019, 5, e02995. [Google Scholar] [CrossRef] [PubMed]
- Safarik, I.; Mullerova, S.; Pospiskova, K. Semiquantitative determination of food acid dyes by magnetic textile solid phase extraction followed by image analysis. Food Chem. 2019, 274, 215–219. [Google Scholar] [CrossRef] [PubMed]
- Dos Santos Benedetti, L.P.; Dos Santos, V.B.; Silva, T.A.; Filho, E.B.; Martins, V.L.; Fatibello-Filho, O. A digital image-based method employing a spot-test for quantification of ethanol in drinks. Anal. Methods 2015, 7, 4138–4144. [Google Scholar] [CrossRef]
- Sicard, C.; Glen, C.; Aubie, B.; Wallace, D.; Jahanshahi-Anbuhi, S.; Pennings, K.; Daigger, G.T.; Pelton, R.; Brennan, J.D.; Filipe, C.D.M. Tools for water quality monitoring and mapping using paper-based sensors and cell phones. Water Res. 2015, 70, 360–369. [Google Scholar] [CrossRef]
- Mohan, D.; Sarswat, A.; Singh, V.K.; Alexandre-Franco, M.; Pittman, C.U. Development of magnetic activated carbon from almond shells for trinitrophenol removal from water. Chem. Eng. J. 2011, 172, 1111–1125. [Google Scholar] [CrossRef]
- Schneider, C.A.; Rasband, W.S.; Eliceiri, K.W. NIH Image to ImageJ: 25 years of image analysis. Nat. Methods 2012, 9, 671–675. [Google Scholar] [CrossRef]
- Saif Ur Rehman, M.; Munir, M.; Ashfaq, M.; Rashid, N.; Nazar, M.F.; Danish, M.; Han, J.I. Adsorption of Brilliant Green dye from aqueous solution onto red clay. Chem. Eng. J. 2013, 228, 54–62. [Google Scholar] [CrossRef]
- Li, J.; Song, G.; Yu, J.; Wang, Y.; Zhu, J.; Hu, Z. Preparation of solution blown polyamic acid nanofibers and their imidization into polyimide nanofiber mats. Nanomaterials 2017, 7, 395. [Google Scholar] [CrossRef]
- De Assis Gonsalves, A.; Araújo, C.R.M.; Filho, C.A.L.; De Medeiros, F.S. Contextualizando reações ácido-base de acordo com a teoria protônica de brönsted-lowry usando comprimidos de propranolol e nimesulida. Quim. Nova 2013, 36, 1236–1241. [Google Scholar] [CrossRef]
- Cheng, H.D.; Jiang, X.H.; Sun, Y.; Wang, J. Color image segmentation: Advances and prospects. Pattern Recognit. 2001, 34, 2259–2281. [Google Scholar] [CrossRef]
- Ribani, M.; Bottoli, C.B.G.; Collins, C.H.; Jardim, I.C.S.F.; Melo, L.F.C. Validação em métodos cromatográficos e eletroforéticos. Quim. Nova 2004, 27, 771–780. [Google Scholar] [CrossRef]
- Lin, K.Y.A.; Lee, W. Der Highly efficient removal of Malachite green from water by a magnetic reduced graphene oxide/zeolitic imidazolate framework self-assembled nanocomposite. Appl. Surf. Sci. 2016, 361, 114–121. [Google Scholar] [CrossRef]
- Li, Y.H.; Yang, T.; Qi, X.L.; Qiao, Y.W.; Deng, A.P. Development of a group selective molecularly imprinted polymers based solid phase extraction of malachite green from fish water and fish feed samples. Anal. Chim. Acta 2008, 624, 317–325. [Google Scholar] [CrossRef]


Publisher’s Note: MDPI stays neutral with regard to jurisdictional claims in published maps and institutional affiliations. |
© 2022 by the authors. Licensee MDPI, Basel, Switzerland. This article is an open access article distributed under the terms and conditions of the Creative Commons Attribution (CC BY) license (https://creativecommons.org/licenses/by/4.0/).