Article

Nanowire Gas Sensor to Support Optical and Volatile Changes in the Production Chain of Fruit Jams

by
Estefanía Núñez-Carmona
1,
Giuseppe Greco
2,
Dario Genzardi
1,*,
Pierpaolo Piccoli
3,
Ivano Zottele
3,
Armando Tamanini
3,
Giorgio Sberveglieri
2,4 and
Veronica Sberveglieri
1,2,*
1
CNR-IBBR, Institute of Bioscience and Bioresources, 50019 Firenze, Italy
2
Nano Sensor Systems, NASYS Spin-Off University of Brescia, 25125 Brescia, Italy
3
Menz & Gasser S.p.A., Sede Legale Zona Industriale, 38050 Novaledo, Italy
4
Department of Information Engineering, University of Brescia, 25123 Brescia, Italy
*
Authors to whom correspondence should be addressed.
Chemosensors 2022, 10(9), 345; https://doi.org/10.3390/chemosensors10090345
Submission received: 28 July 2022 / Revised: 9 August 2022 / Accepted: 18 August 2022 / Published: 23 August 2022
(This article belongs to the Special Issue Nanomaterials Based on Bio/Chemical Sensors)

Abstract

:
The marmalade and jam market is growing worldwide, with the European countries being the main producers in this sector. The market has ancient origins and the production is aimed at conserving the surplus fruits during some period of the year. Nowadays, the automatic production processes are wide-ranging but start with high-quality raw materials and follow an appropriate cooking process to conserve the main features of the final product. On the other hand, cases of overcooking may occur which lead to the production of hydroxy-methyl-furfural and derivatives with consequent browning and poor organoleptic characteristics of the final product. This study aimed to use chemical oxide nanowire gas sensors device S3 coupled with optical techniques and recognizing algorithms to create a multi-actor platform able to control the production process of jams and marmalades with a fast response time, to assist the production process and avoid economical losses in the sector. PCA shows that this innovative technology can recognize changes in the volatile fingerprint, distinguishing when the positive and more natural organoleptic characteristics of the fruit are still present from the appearance of the organoleptic defects due to a faulty production process.

1. Introduction

Jams and marmalade are processed and preserved products based on fruit and sugar. Both were introduced to maintain the edible quality of food for a long time; they were used by the working classes to manage the enormous availability of fruit in the season of the ripening of the fruit on the trees. For the legal norms of agri-food law, only the citrus-based products (orange, lemon, mandarin, cedar, grapefruit, bergamot, and clementine) can be indicated with the term marmalade, while the term “jams” indicates all of the products that have other fruits as a base [1,2].
Another important difference between the two is the minimum quantity of fruit required by law: in marmalade, the product must be no less than 20% fruit, of which at least 7.5% must come from the endocarp (the innermost and fleshy part of the fruit). The European directive specifies that the parts of the citrus fruits that can be used to prepare the marmalade are: pulp, puree, juice, aqueous extracts, and zest. For jams, at least 35% of the fruit pulp must be present, in the case of an “extra jam”, however, it must be checked that the percentage of fruit exceeds 45% of the total. The marmalade and jam market is growing more and more, the value of exports in recent years has been around 3.2 billion dollars. The European countries are the main producers in this sector with an export of about 2 billion dollars, that is 61.1% of the global total.
The EU is followed by Asian producers (20.2%), those of Latin America (9.3%), North America (5.6%), Africa (2.7%), and Oceania (1.1%). In Europe, Italy is the second-largest exporter of jams (8.4% of total exports for a value of 270.3 million dollars), preceded by France (12%), and followed by Turkey (8%) [3].
In recent years, consumers’ interest in the quality of the products purchased has increased, greater attention has been paid to the raw materials used and the composition of the products consumed; buyers are also willing to spend more to have a higher quality product. For these reasons, companies have therefore tried to implement the percentage of fruit used per unit of weight, up to the production of 100% fruit products. The hydroxy-methyl-furfural, more commonly abbreviated as HMF, and furfural are substances that consistently influence the organoleptic properties, such as flavor and color, of the foods cooked; these compounds are attributable to the Maillard reaction and the caramelization process in foods containing high quantities of sugar [4,5].
As the times and temperatures of exposure to heat increase, a process of dehydration of the sugars starts, which begins their transformation into a furanic compound. For this compound to form HMF it will be enough to keep the product at temperatures above 30 °C for prolonged times, while at higher temperatures the formation is faster. So, as the temperature and time of exposure to heat increase, the amount of HMF produced also increases and therefore the appearance and taste of the product changes [6]. Generally, the HMF and furfural are formed when the food is subjected to heat treatments, such as sterilization or pasteurization, and for this reason they are called “markers of heat treatments”.
However, they can also be found following poor storage conditions of some foods, due to an exposure to light or due to the increase in acidity which causes a degradation of fructose until the formation of these compounds occurs. The consequences of the Maillard reaction and caramelization are a reduction in the nutritional value of the food, as there is a destruction of the essential amino acids, such as lysine, methionine, and tryptophan, and a destruction of some of the vitamins. In addition, there is the production of antinutritive and toxic compounds, the proteins become less digestible, there is an inhibition of intestinal enzymes, and a change in the plasma transaminases, the enzymes that intervene in transamination, that is, in the transformation of one amino acid into another [7,8].
The analyzed jams, used in this work, are produced starting from frozen fruit and not from semi-finished products, guaranteeing their further naturalness, and also their lower amount of kilocalories.
Specifically, the changes and organoleptic parameters found due to the caramelization processes and the production of compounds of the Maillard reaction were evaluated. The samples before and after cooking were then analyzed with various chemical and physical, traditional and innovative instruments, such as a colorimeter and a portable device called Small Sensor Systems (S3) [9]. This tool is equipped with an array of chemical nanosensors able to verify precisely the variations in the volatile components of the product. In particular, this type of study will be helpful to companies operating in the fruit and vegetable jams’ sector, to quickly determine the real organoleptic qualities of production.
In fact, once a specific database has been created, this method will be able to make the industrial cooking process completely automatic, and above all able to calibrate the process on the specific prepared matrix. The cooking process that can be stopped when the correct quantity of volatile compounds is detected and not beyond, in order to avoid the damaging of the product or the reduction in its nutritional and organoleptic quality.

2. Materials and Methods

2.1. Sample Preparation

All of the samples were prepared in the same way, regardless of the type of raw material used in production or the fruit content within the product. Three different kinds of samples for each jam were prepared in this work. For the first one, the jam samples were in the standard form, the other two jams samples were thermally treated (Table 1).
For the two aforementioned samples, the open jam jars were placed in a water-bath and under stirring conditions were heated until the geometric center of the jar reached 100 °C. The information was obtained by placing a temperature probe with a digital indicator in the center of the jar.
During this process, the temperature was continuously monitored inside the jars and in the water-bath, using a digital ThermoPro (Model No.: TP-08S, Toronto, ON, Canada) probe. Once each jam reached 100 °C, at the geometric center of the product, it was left stable at this temperature for different times: one sample for 20 min; the other one for 40 min; thus doubling the cooking times. Both of the jams were compared with the one that had not been reheated.
Regarding the S3 sampling, for the three kinds of samples, sterile chromatographic vials with a capacity of 20 mL were used and filled, in sterility, with 10 g of jam and closed using an aluminum ferrule and a circular septum constructed of silicon and PTFE. All of the materials that were exposed to the jams were previously sterilized to avoid any alteration of the normal composition of the sample (Figure 1).
Concerning the colorimeter, the sampling was performed directly on the jam; 30 g of jam were laid out on a Petri Dish in order to obtain a homogeneous distribution and thickness to reduce the difference between the measurements

2.2. CIELab Optical Measurements

Concerning the colorimeter, the sampling was performed directly on the jam; 30 g of jam were laid out on a Petri Dish in order to obtain a homogeneous distribution and thickness to reduce the difference between the measurements.
This analysis was designed to detect the browning of the samples subjected to overcooking. For this work, the portable colorimeter CR-400 (Minolta Co., Osaka, Japan) was used, working in reflectance mode, that is, by measuring the wavelengths reflected by the sample.
The instrument was calibrated thanks to a white reference plate, using the illuminating mode D65 (standard daylight; z = 93.6; x = 0.3133; y = 0.3195) and CIELab color space (L* a* b*) [10].
  • L*: defines the brightness, this parameter could change from 0 to 100; therefore the color can change from white (100) to black (0).
  • a*: first color coordinate, which defines the color from green (negative values) to red (positive values).
  • b*: second color coordinate, which defines it from blue (negative values) to yellow (positive values).
For each measurement, five repetitions were completed and the average values were subsequently calculated, in order to minimize the error, based on these average values, the actual color of the sample was determined.

2.3. Small Sensor Systems (S3)

S3, an acronym for Small Sensor Systems, is an instrument that was built in collaboration with the University of Brescia and with Nano Sensor Systems Srl (www.nasys.it, accessed on 1 July 2022), a start-up of the University of Brescia. S3 [11] is composed of three fundamental parts (Figure 2):
  • Pneumatic components, such as actuators, pumps, and pipes that make the sample inside the vial pass through the instrument;
  • Electronic parts that manage the pneumatic components, flow systems, and collect the data produced by the sensors by sending it to the dedicated online web app;
  • Sensor chamber, the main part, which can accommodate up to 10 sensors and is thermally insulated in order to have a controlled environment within which only VOC samples can enter.
S3 has already been used with considerable success in other areas of the agri-food sector [2,12,13]. The sensor array is composed of different sensors, each of which possesses different characteristics, such as the sensitive element, the catalyst, or the operating temperature. In our study, the sensors used were five produced at Nano Sensor Systems S.r.l., a spin-off from the University of Brescia [14,15], Italy, listed in Table 2.
The data, deriving from the variation of the sensor resistance, were automatically sent to the network and were collected in the cloud, which was associated with a web app where the data were processed both in terms of statistical analysis and in terms of self-learning algorithms.

2.4. Data Analysis

The S3 outputs consist of the resistance variation of the sensors due to the VOCs that react on sensors’ surfaces. For the analysis of their signals, first the sensors’ responses in terms of resistance (Ω) were normalized compared to the first value of the acquisition (R0). For all of the sensors, the difference between the first value and the minimum value during the analysis time was calculated, resulting in a “ΔR/R0” feature for each signal. For each taste, a specific feature data matrix was created.
Principal Component Analysis (PCA) was applied to visualize the capacity of the sensors to discriminate between the standard product from the two stages of overcooking. One PCA for each fruit jam was elaborated.

3. Results and Discussion

3.1. CIELab Optical Measurements

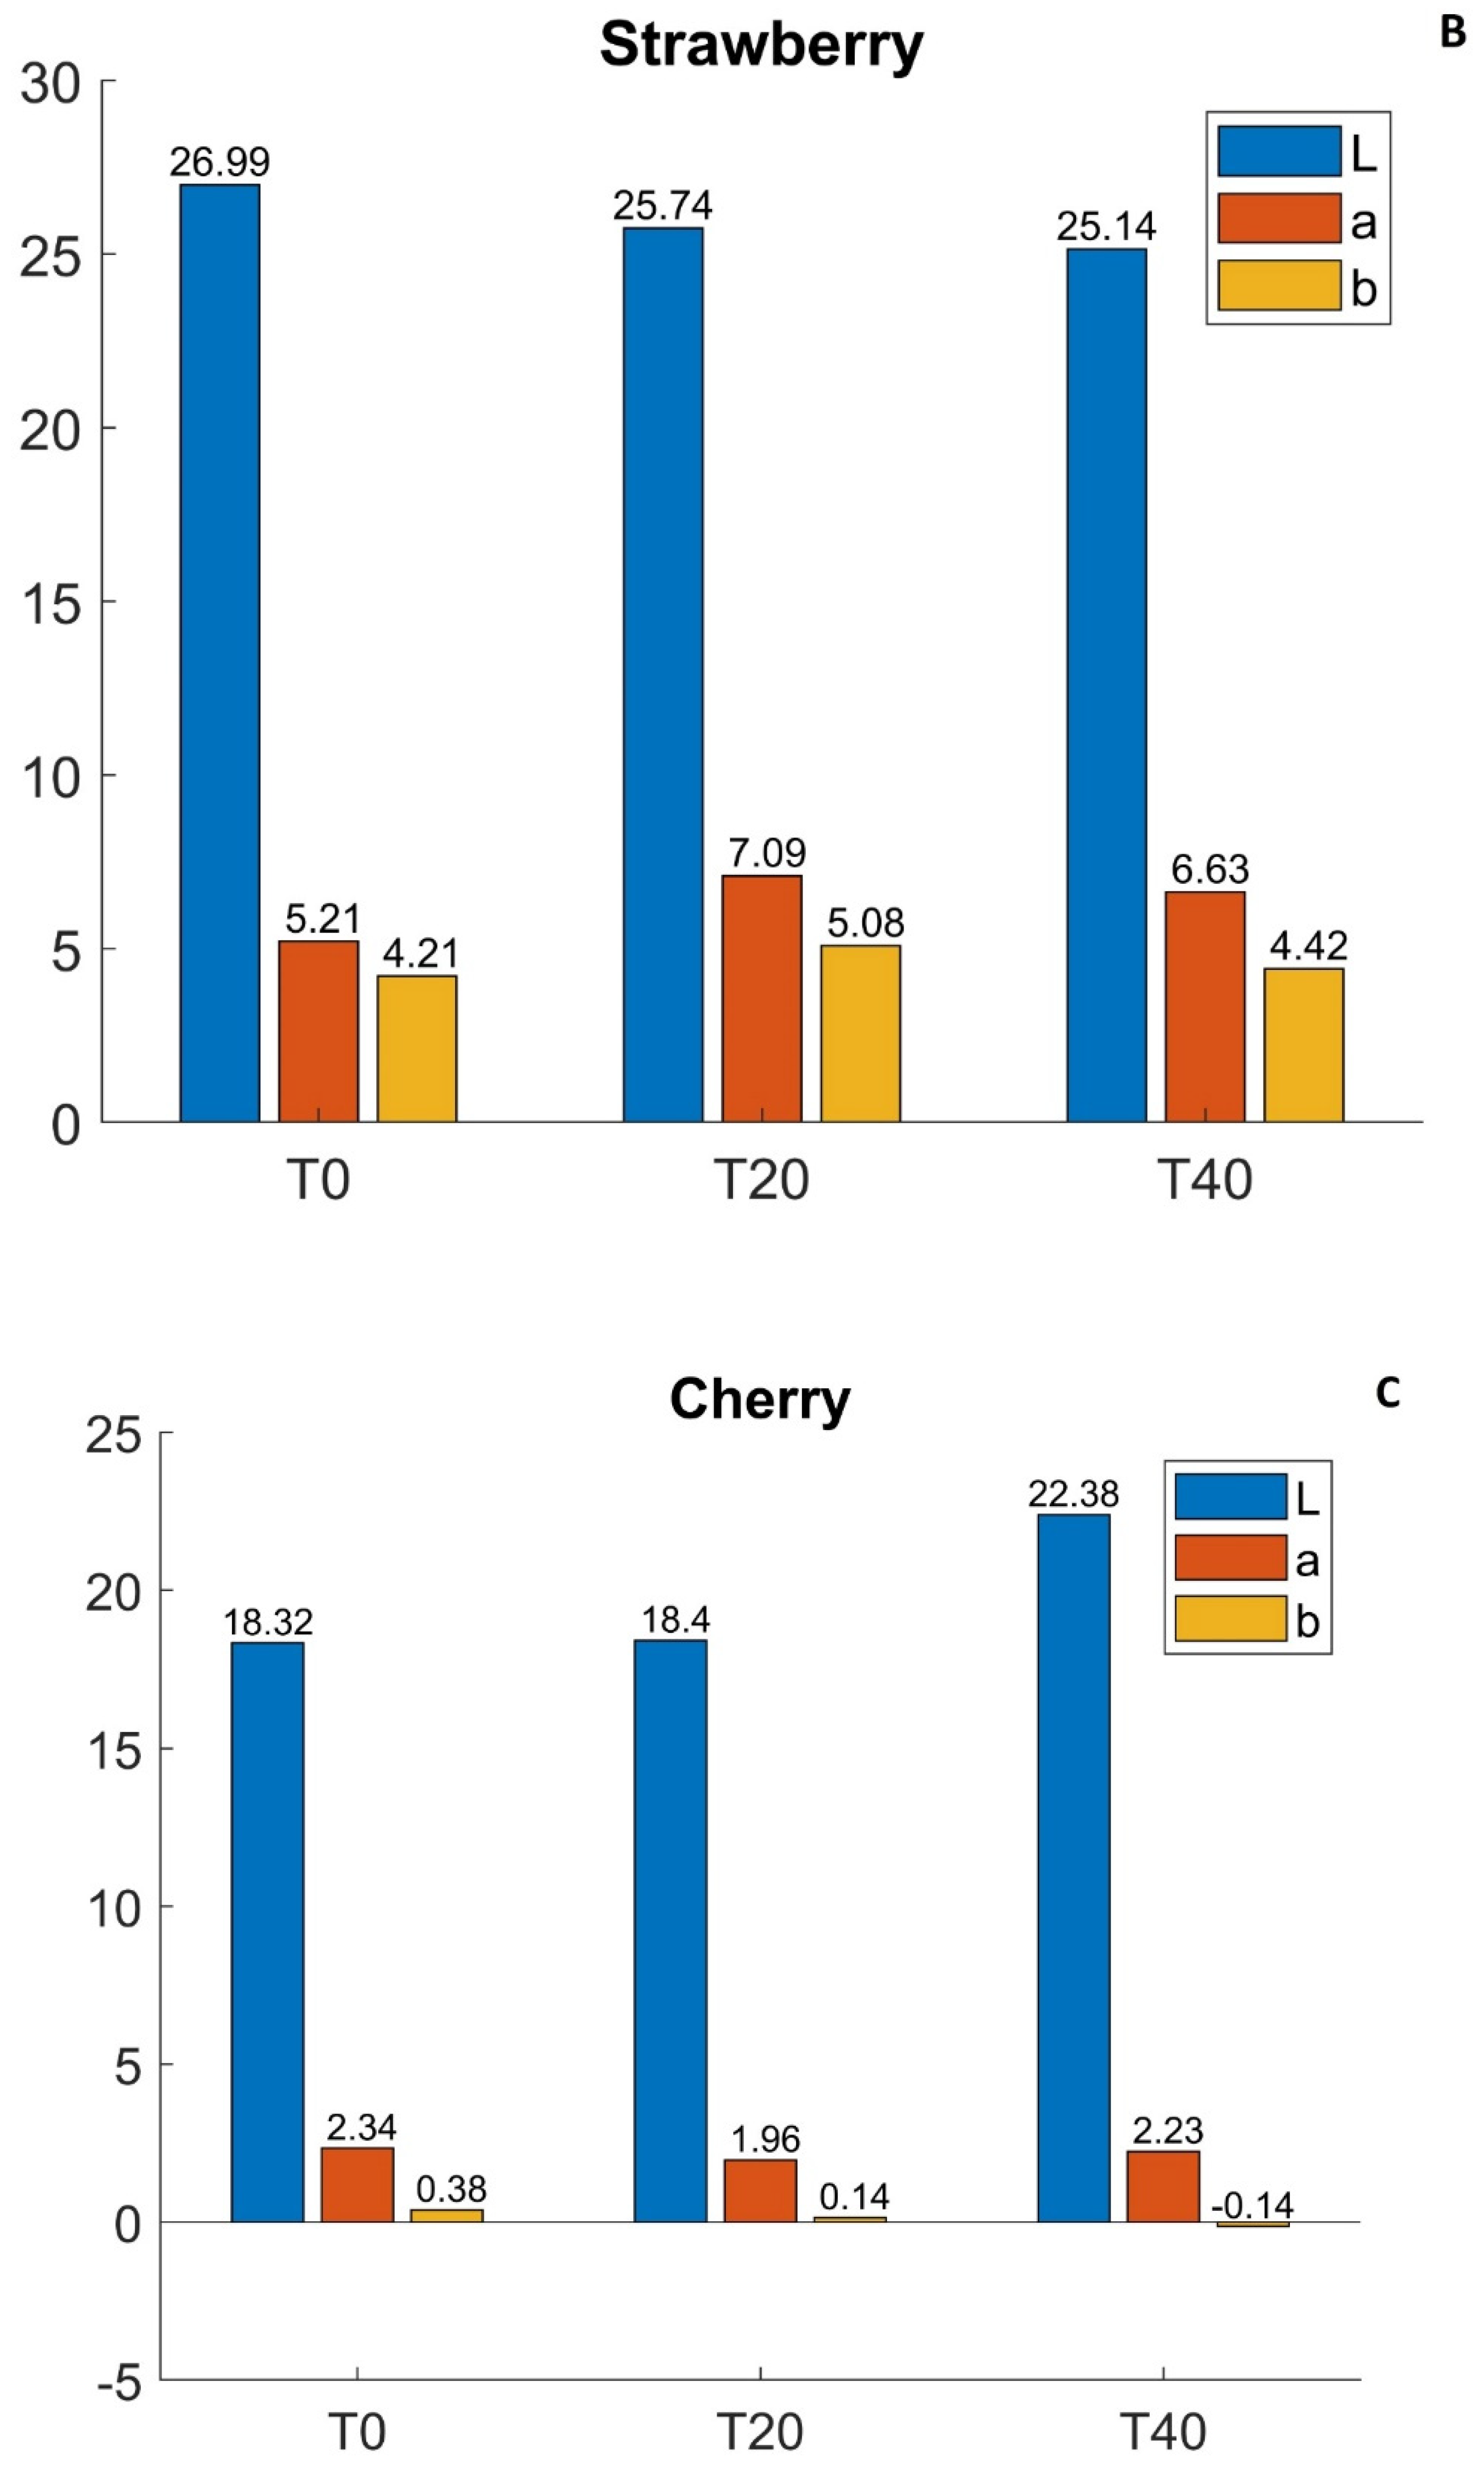
All of the results reported in the histograms were obtained from the average of the five measurements completed for each sampled time:
  • before cooking (T0);
  • after 20 min of cooking (T20);
  • after 40 min of cooking (T40).
The results relating to the tastes analyzed are reported below (Figure 3):
Regarding the results obtained for the raspberry jam (Figure 3A), it can be seen that the value of L increases from T0 to T20 (+2.14) and slightly decreases to T40 (−0.22), however, remaining higher than the value of T0 (+1.92). The value of a* decreases from T0 to T20 (−0.71), increases slightly to T40 (+0.22), however, remaining lower than the value of T0 (−0.49). The value of b* decreases from T0 to T20 (−1.84) and remains practically unchanged at T40 (+0.07). In general, it is possible to say that during the overcooking process there is an increase in the brightness and at the same time a decreasing trend in the values of a* and b*, which at a color level can be translated as a bluish-greener darker color.
The values of the colorimetric analysis of strawberry jams are shown in Figure 3B; it can be seen that the value of L* decreases from T0 to T20 (−1.25) and further decreases to T40 (−0.60), keeping it therefore lower than the value of T0 (−1.85). The value of a* increases from T0 to T20 (+1.85), subsequently decreases to T40 (−0.46), remaining higher than the value of T0 (+1.42). The value of b* increases from T0 to T20 (+0.87) and decreases to T40 (−0.66), remaining, albeit slightly, above T0 (+0.21).
Concerning the optical c data obtained from the cherry jam analysis (Figure 3C), the value of L slightly increases from T0 to T20 (+0.08) and continues to increase to T40 (+3.98), thus maintaining a higher value than T0 (+4.06). The value of a* decreases from T0 to T20 (−0.38), increases to T40 (+0.27), remaining lower than T0 (0.11). The value of b* decreases from T0 to T20 (−0.24) and further decreases to T40 (−0.28), maintaining a lower value than T0 (−0.52). As in the case of the raspberry jam, it is possible to say that during the overcooking process there is an increase in the brightness and at the same time a decreasing trend in the values of a* and b*, which at a color level can be translated as a bluish-greener darker color.
These variations are due to the presence of specific molecules inside the jam, which is a complex sample itself. In fact, the browning process is not only due to the caramelization processes of the sugars’ effect, but also to the contribution of the other components present inside the fruit [7].
Overcooking induces a brownish-yellow color and, according to the authors of [16], who studied the composition of pigments in fresh and canned kiwi fruit slices, this color change is due to the development of chlorophyll degradation compounds, such as pheophytin, pyrophyophyte, and pyrophophores. It has also been reported that several decomposition reactive products are formed by the degradation of vitamin C, and these compounds can combine with amino acids causing the formation of brown pigments [17]; HMF is one of the decomposition products of ascorbic acid [18] and is a precursor of the brown pigments [19,20,21].
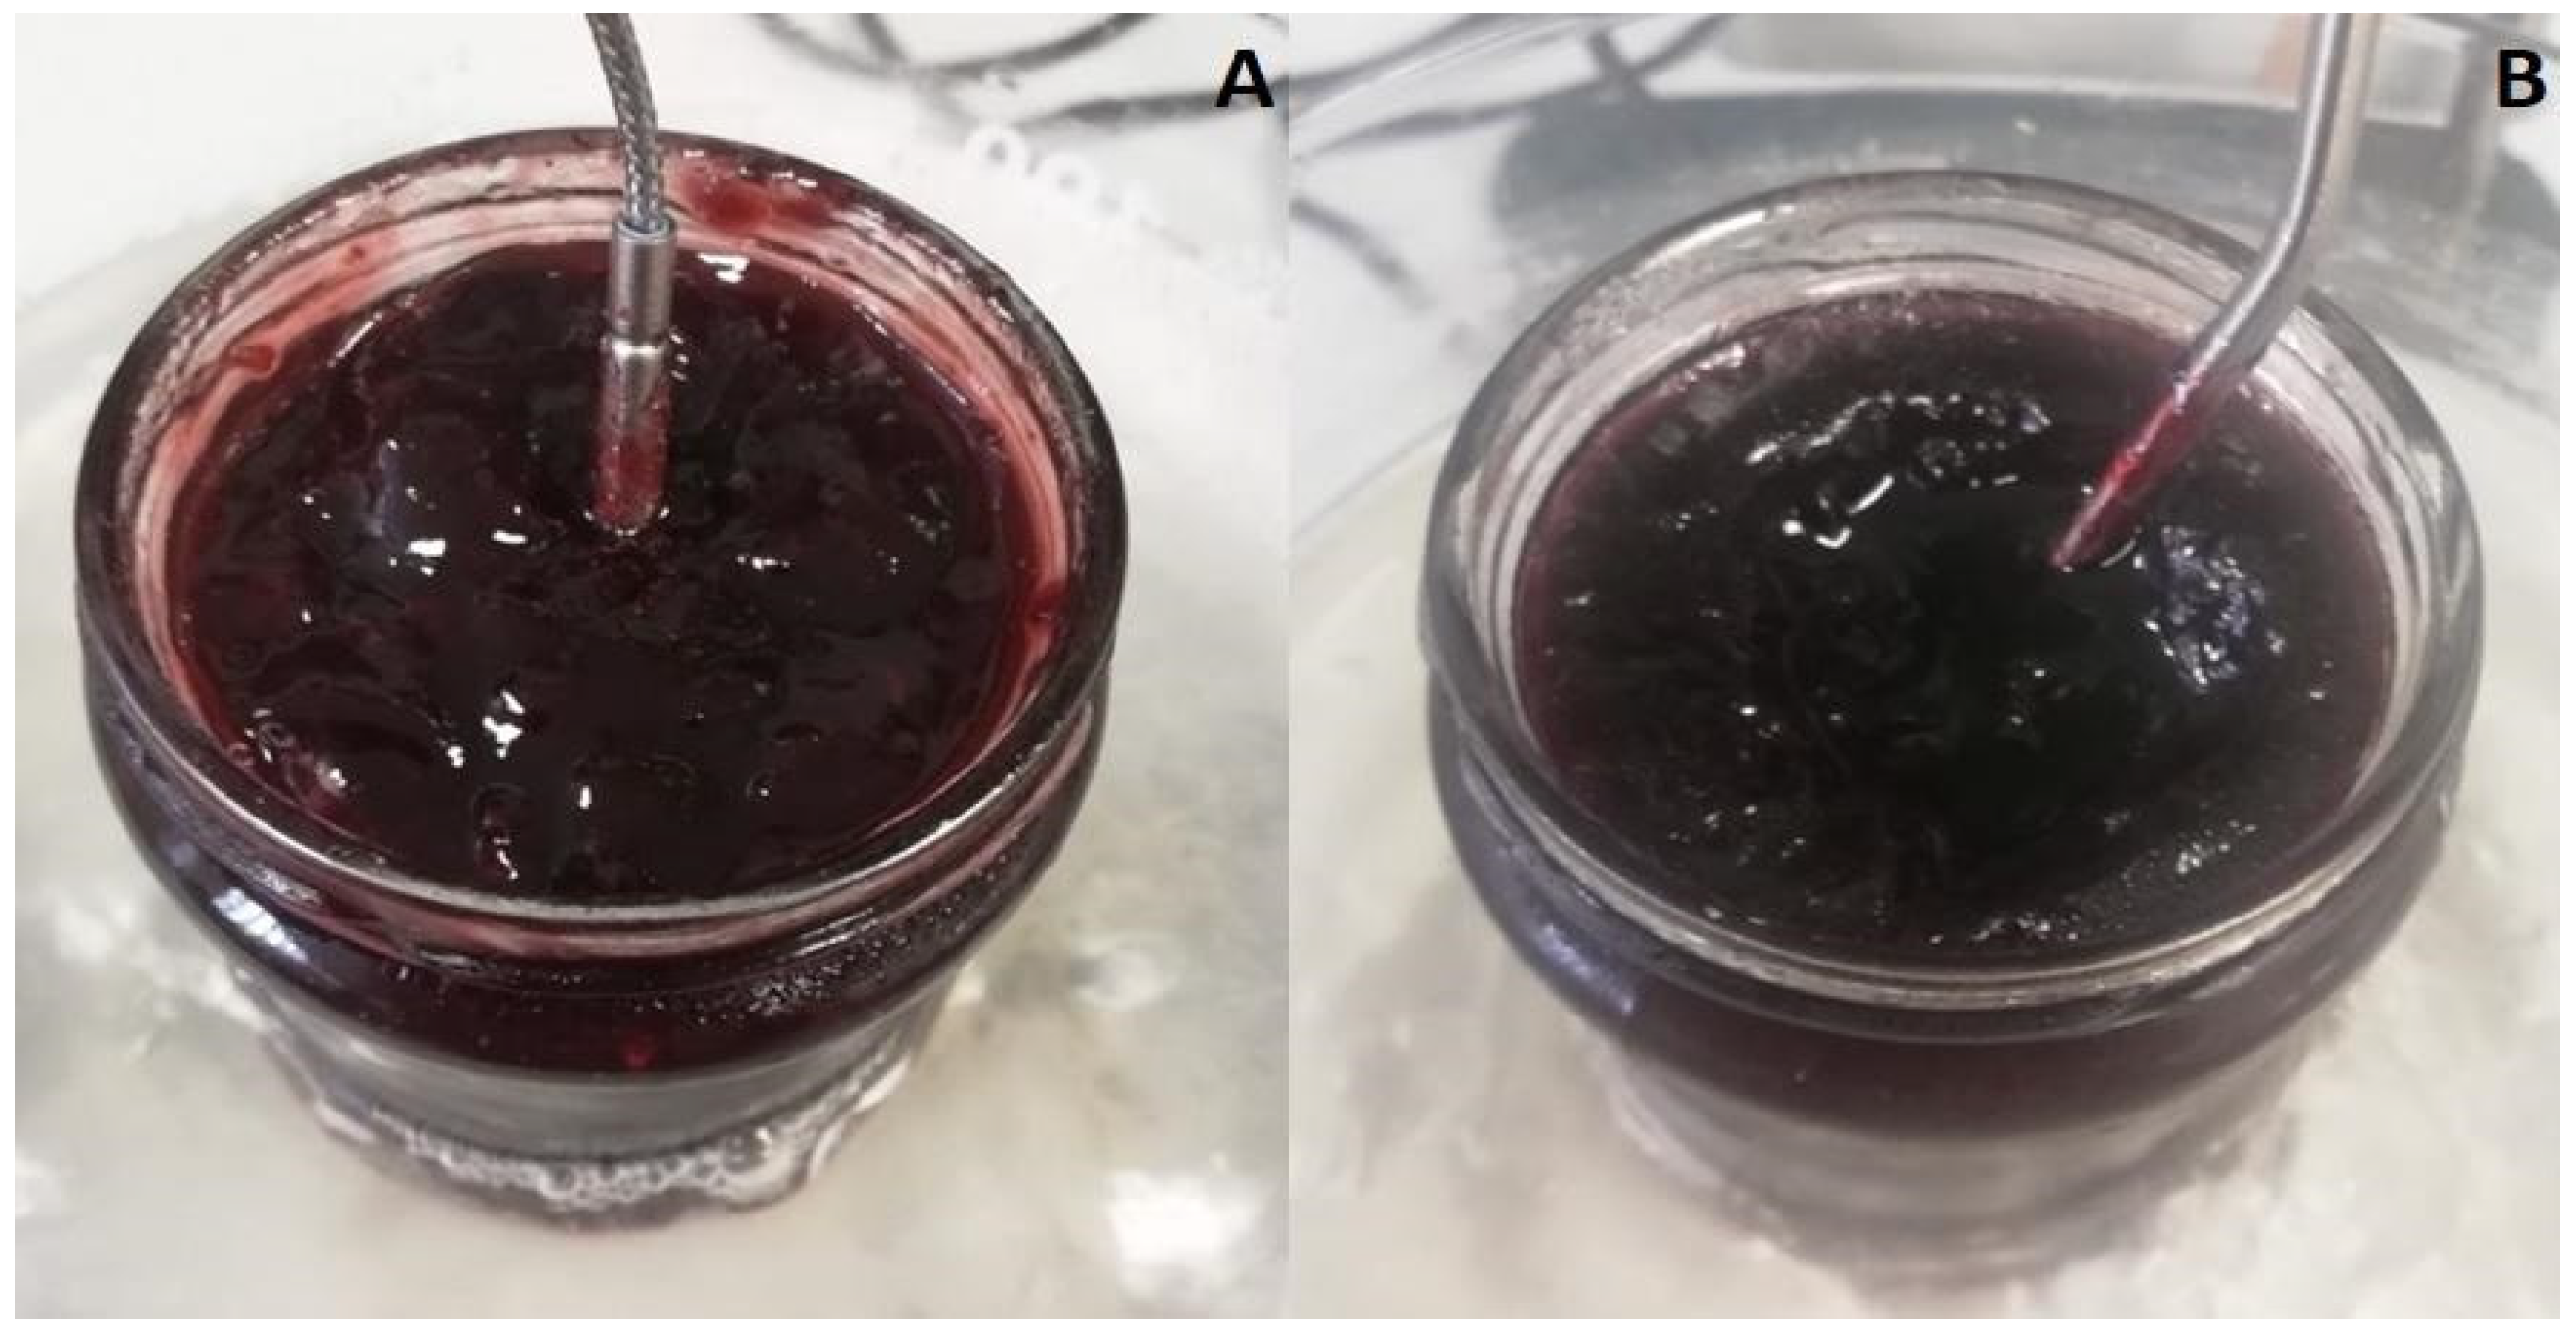
In the analyzed jams, the values of L, a*, and b* remain positive, except for the cherry jam in which they are negative and slightly decrease with overcooking. This may be due to the anthocyanins present inside the skin of the cherries and which are released during cooking. The anthocyanins, therefore, create a color change towards blue (Figure 4) [20].

3.2. Small Sensor Systems (S3)

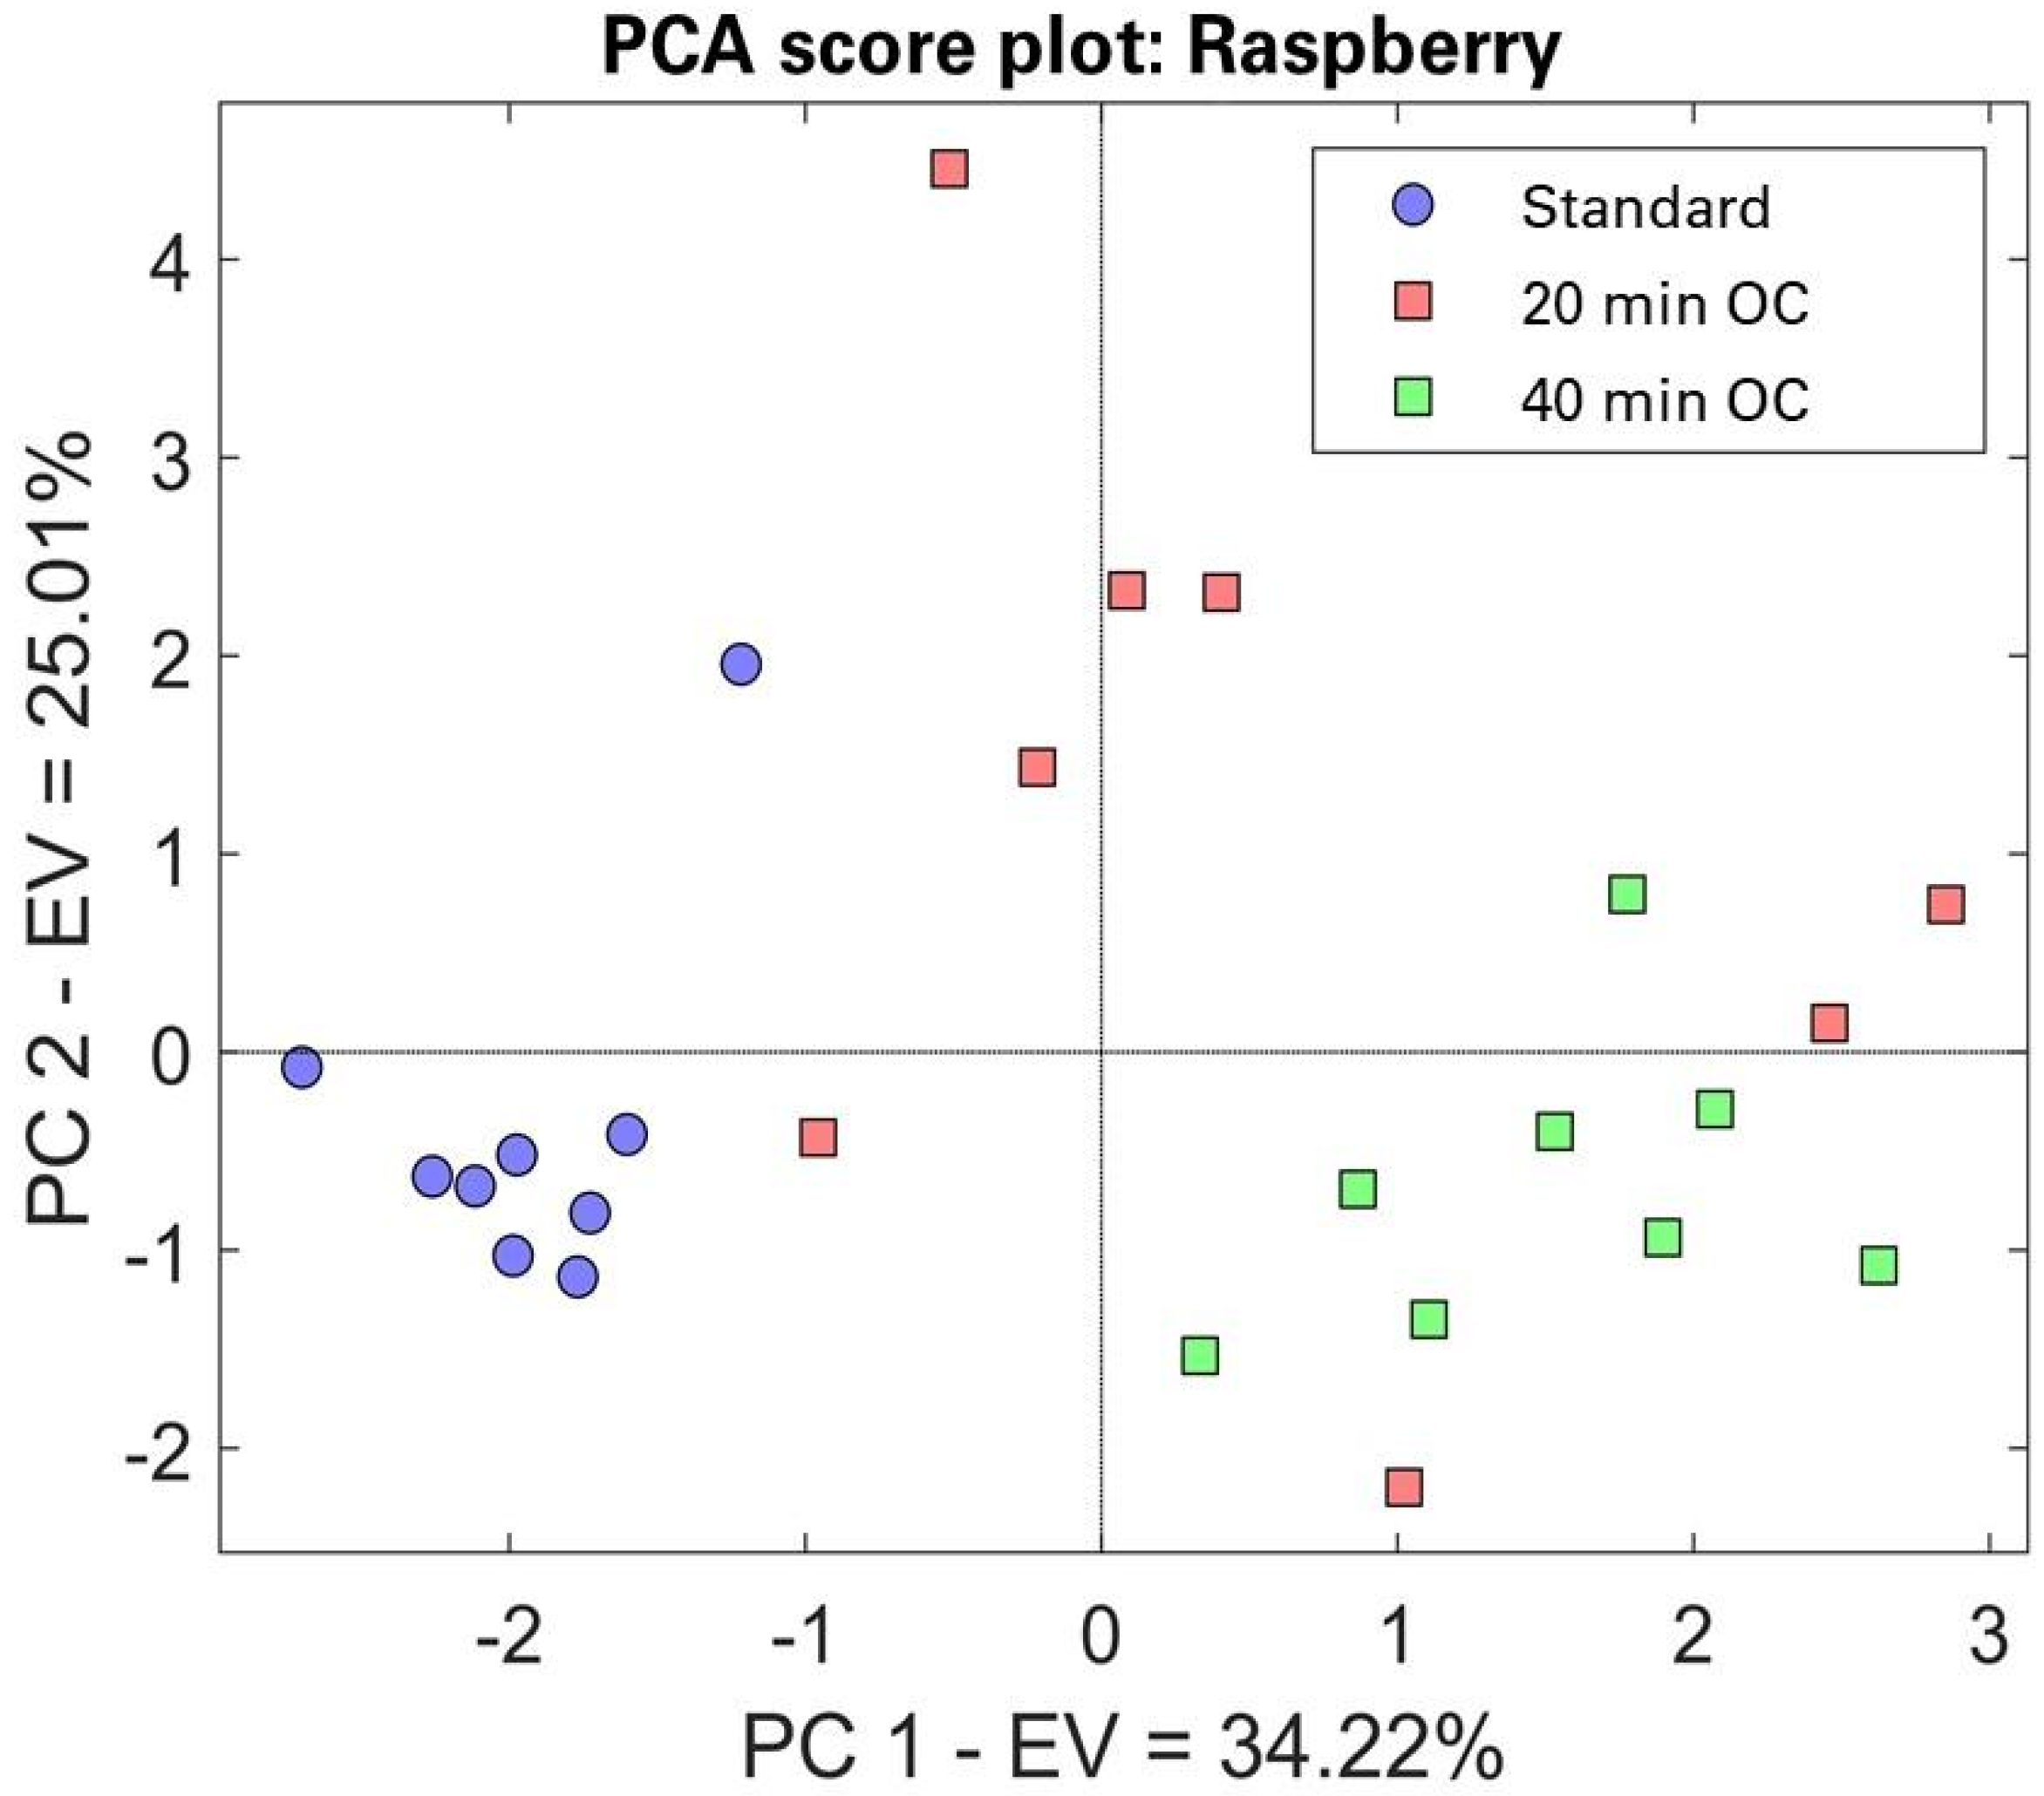
The results obtained with the sensor device S3 are represented in form of PCAs. Figure 5 shows the PCA of the raspberry jam at the various cooking times in comparison with the standard sample; the variability explained in PC1 corresponds to 34.22%, while in PC2 it is 25.01%, with an overall total variability of 59.23%. In general, it is possible to observe that the standard samples, in those not subjected to overcooking (T0), are well separated from the others and are almost all found in the negative part of both PC1 and PC2; for the other samples, which have instead been overcooked (20 min overcooked (OC)), it is possible to note a slight overlap due to the dispersion of the sample at T20, while the sample at T40 (40 min OC) is mainly found in the positive part of PC1 and the negative part of PC2, forming a compact cluster.
Figure 6 shows the PCA of the strawberry jam sample at the various cooking times; the variability explained in PC1 corresponds to 66.92%, while in PC2 it corresponds to 18.31% with an overall total explained variability of 85.23%.
In general, it is possible to observe a significant difference between the overcooked samples (T20 and T40) and the standard samples (T0): the T0 samples are in the negative part of PC1 while all of the overcooked samples, both at T20 and T40, are in the positive part of PC1; moreover, most of the samples at T0 are in the positive part of PC2, while those at T20 and T40 are in the negative part of PC2. The overcooked samples (T20 and T40) form a compact overlapped cluster.
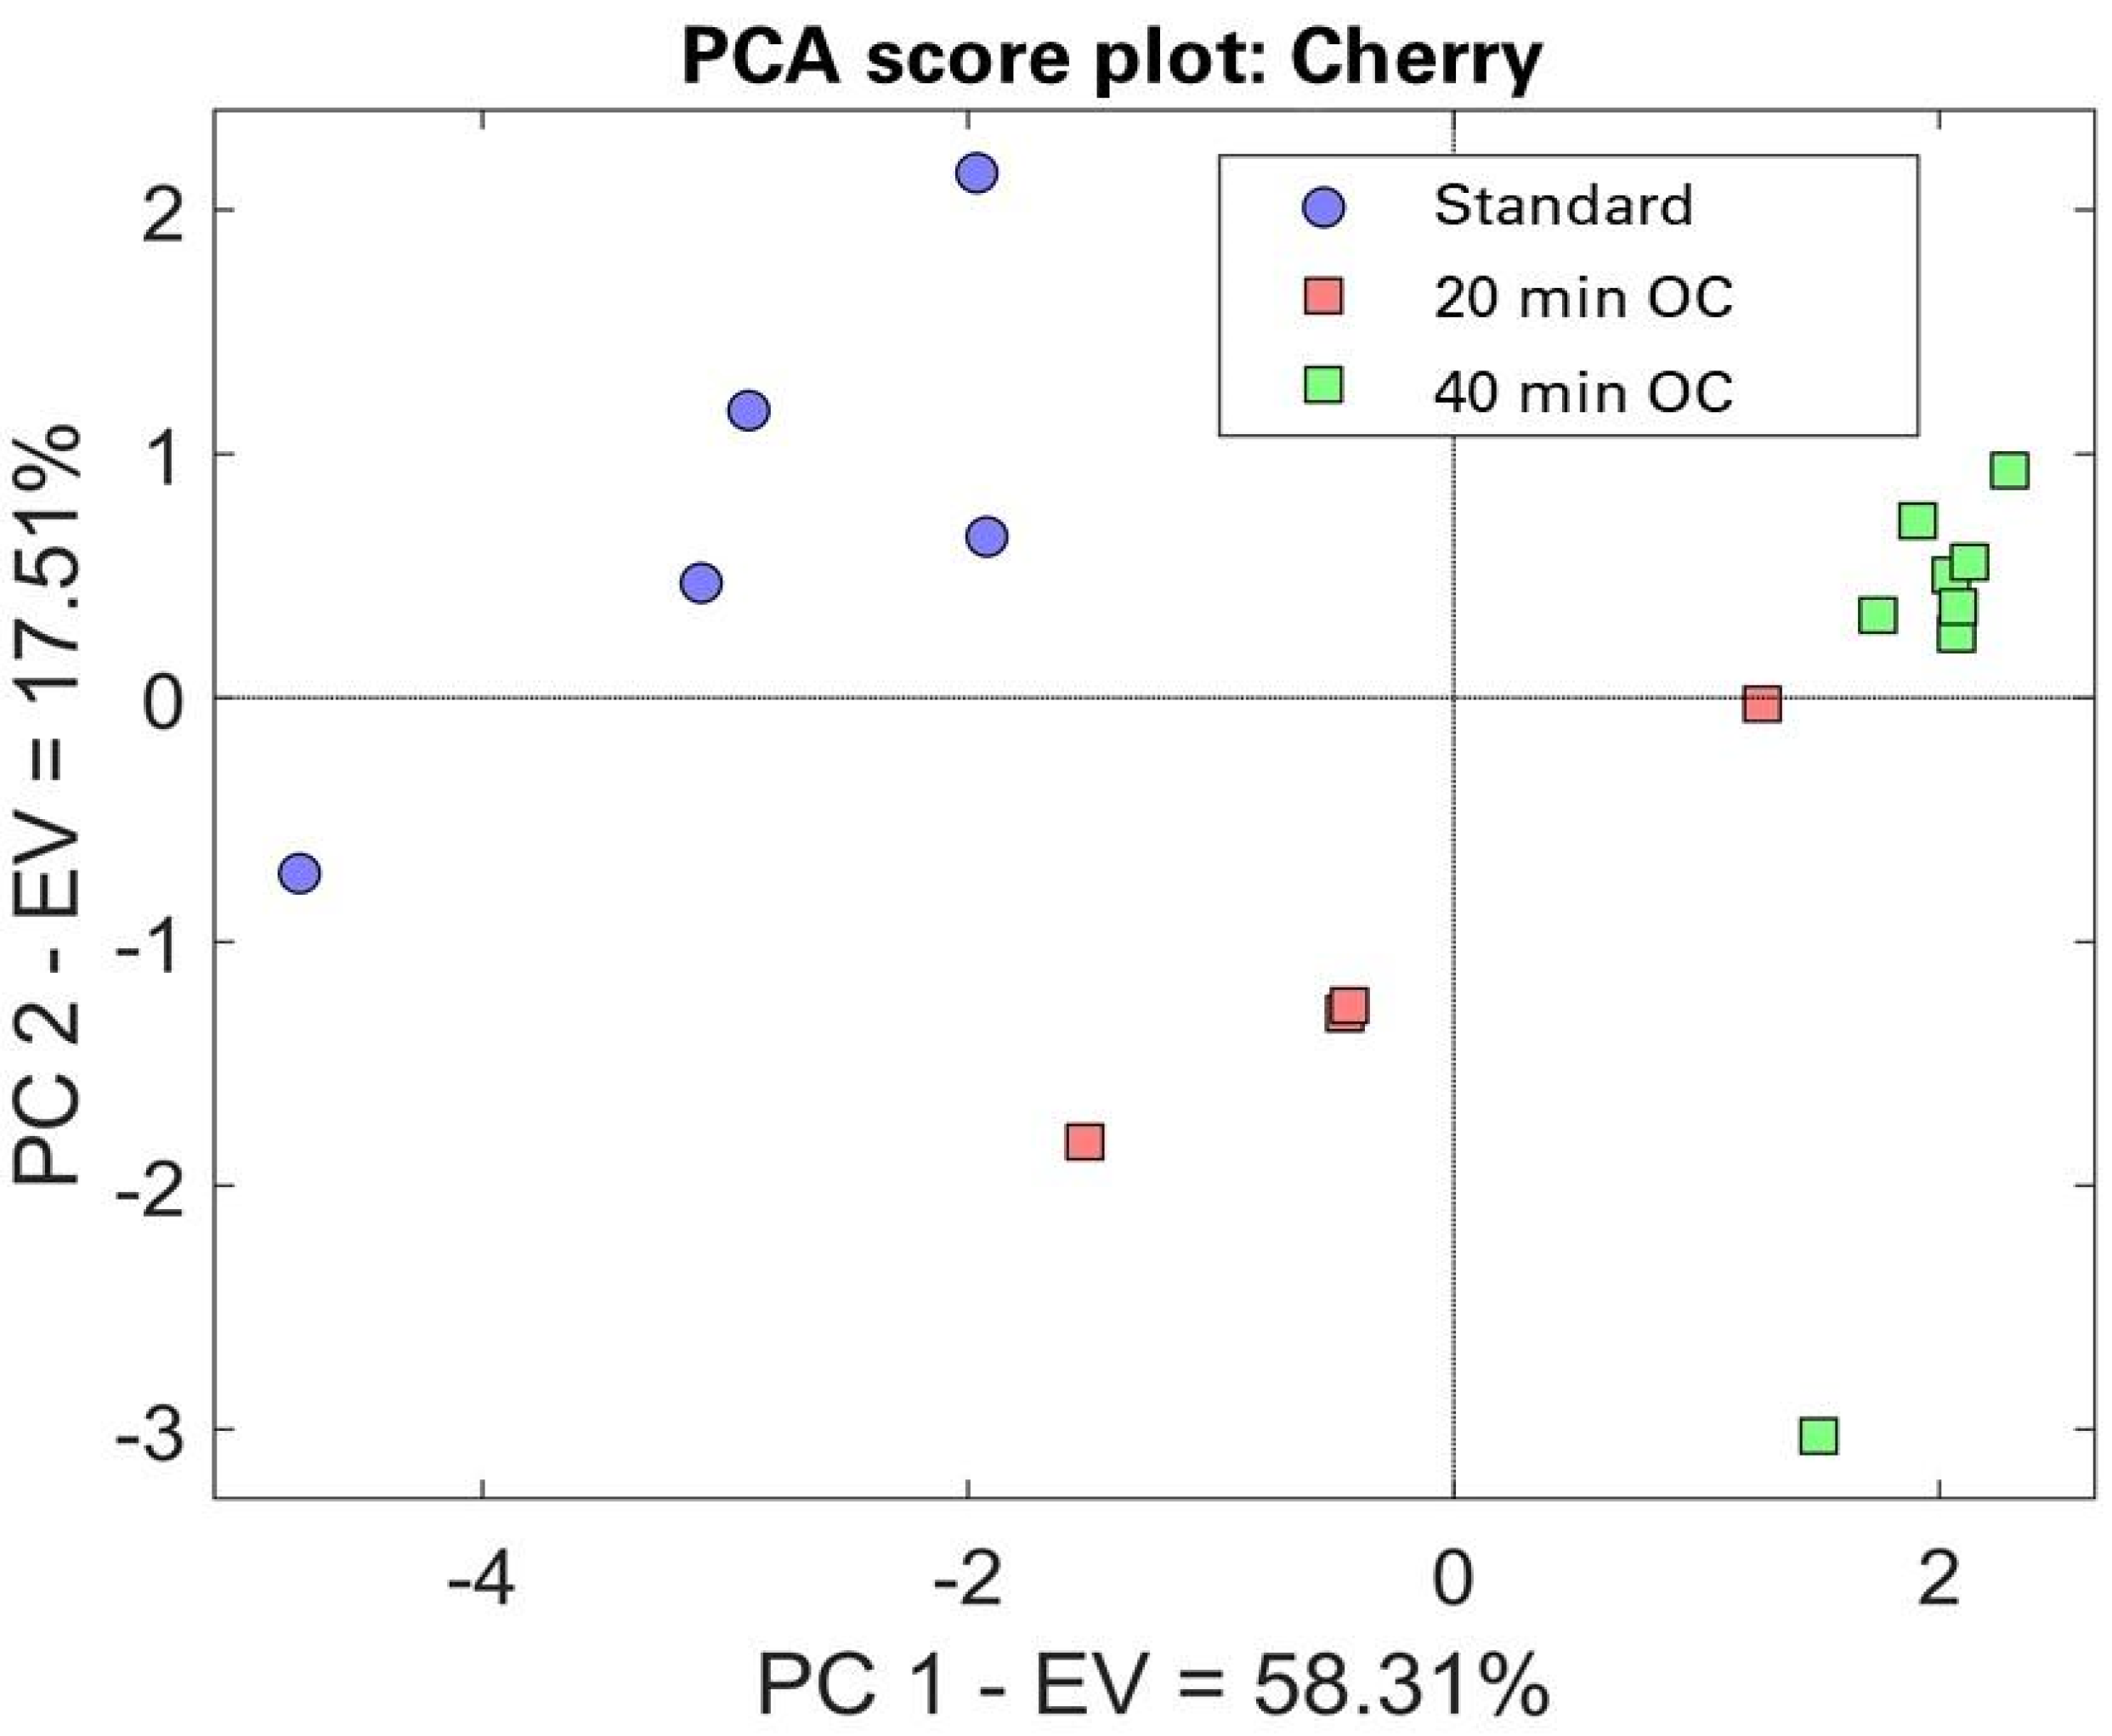
Regarding the results obtained with the analysis of the cherry jam (Figure 7), the samples at the different overcooking time, it is possible to say that the variability explained in PC1 corresponds to 58.31%, while in PC2 it corresponds to 17.51%, with an overall total variability of 75.82%. In general, it is possible to observe that all three types of samples differ from each other: most of the samples at T0 are in the negative part of PC1 and the positive part of PC2, those at T20 are in the negative part of both PC1 and PC2, while those at T40 are in the positive part of both PC1 and PC2.
Analyzing the results obtained from the jams considered in this study, the ability of the sensors to discriminate between the standard and overcooked samples was highlighted. In general, the samples belonging to the 40 min of overcooking are highly clustered in all three cases of studied jams. The reason for this could be explained by the production of furfural and derivative molecules, such as HMF, in higher concentrations than the present in the standard jam, being precisely detected by the sensors thus making possible to accurately identify the overcooked samples.

4. Conclusions

From the results obtained, it can be concluded that in the production of jams, the best choice is to limit the time and temperatures of exposure to heat as much as possible–making sure that the product is healthy and stable, but that at the same time it keeps intact all of the organoleptic characteristics and nutritional properties of the fruit.
This claim is confirmed by the outcome of the study carried out. Thanks to the use of the optical technique used, we have analytically found an effective color change caused by the overcooking of the jams. This color change, which is a physical parameter, was then confirmed by the chemical analysis carried out with the S3, which can identify the overcooked samples in all three types of jams tested.
The results obtained confirm that this new system, based on metal oxide sensors, could be implemented in order to be able to stop cooking when the positive and more natural organoleptic characteristics of the fruit are still present. Thus, avoiding the formation of the molecules due to overcooking which would reduce the nutritional and organoleptic properties of the product and the quality of the product [22,23,24,25,26].
This will allow us to create a system that can detect the overcooking of products in the jam production sector before the defects begin to appear which could affect the final quality, to make the industrial cooking process automatic by calibrating it based on the type of raw material used.

Author Contributions

Conceptualization, E.N.-C., G.G., D.G. and V.S.; methodology, E.N.-C., G.G., D.G. and V.S.; software, G.G. and D.G.; validation, P.P., I.Z. and A.T.; formal analysis, E.N.-C., G.G., D.G. and V.S.; investigation, E.N.-C., G.G., D.G. and V.S.; resources, P.P., I.Z. and A.T.; data curation, G.G. and D.G.; writing—original draft preparation, E.N.-C. and V.S.; writing—review and editing, E.N.-C., G.G., D.G. and V.S.; visualization, E.N.-C., G.G. and P.P.; supervision, V.S., I.Z., G.S. and A.T. All authors have read and agreed to the published version of the manuscript.

Funding

This research was co-funded by Menz & Gasser S.p.A. and the Autonomous Province of Trento, Legge provinciale 13 Dicembre 1999, n. 6 e ss.mm. art. 5: Aiuti per la promozione della ricerca e sviluppo—art. 14: Procedura negoziale. Domanda di agevolazione di data 31 agosto 2018—pratica n. 38-18. Progetto “NanoSensorFood”. Provincial Law 13 December 1999, n. 6 and subsequent amendments art. 5: Aid for the promotion of research and development—art. 14: Negotiation procedure. Facilitation application dated 31 August 2018—file no. 38-18. “NanoSensorFood”.

Data Availability Statement

Not applicable.

Conflicts of Interest

The authors declare no conflict of interest.

References

  1. Smith, D.A. Jams and preserves, Methods of Manufacture. In Encyclopedia of Food Sciences and Nutrition, 2nd ed.; Caballero, B., Finglas, P., Toldra, F., Eds.; Academic Press: Cambridge, MA, USA, 2003; pp. 3409–3415. [Google Scholar] [CrossRef]
  2. Núñez-Carmona, E.; Abbatangelo, M.; Zottele, I.; Piccoli, P.; Tamanini, A.; Comini, E.; Sberveglieri, G.; Sberveglieri, V. Nanomaterial Gas Sensors for Online Monitoring System of Fruit Jams. Foods 2019, 8, 632. [Google Scholar] [CrossRef] [PubMed] [Green Version]
  3. Producers and the Fair-Trade Distribution Systems: What Are the Benefits and Problems? Available online: https://onlinelibrary.wiley.com/doi/full/10.1002/sd.420 (accessed on 13 July 2020).
  4. Ellis, G.P. The Maillard Reaction. In Advances in Carbohydrate Chemistry, 2nd ed.; Wolfrom, M.L., Ed.; Elservier: Amsterdam, The Netherlands, 1959; Volume 14, pp. 63–134. [Google Scholar]
  5. Reineccius, G. Kinetics of flavor formation during Maillard browning. In Flavor Chemistry: Thirty Years of Progress, 2nd ed.; Teranishi, R., Wick, E.L., Hornstein, I., Eds.; Kluwer Academic/Plenum Publishers: New York, NY, USA, 1999; pp. 346–352. [Google Scholar]
  6. Barta, J.; Balla, C.; Vatai, G. Dehydration Preservation of Fruits. In Handbook of Fruits and Fruit Processing, 2nd ed.; Sinha, N.K., Sidhu, J.S., Barta, J., Wu, J.S.B., Cano, M.P., Eds.; John Wiley & Sons, Ltd.: Chichester, UK, 2012; pp. 133–151. [Google Scholar]
  7. Friedman, M. Food Broening and Its Prevention: An Overview. J. Agric. Food Chem. 1996, 44, 631–653. [Google Scholar] [CrossRef]
  8. Delatour, T.; Huertas-Pérez, J.F.; Dubois, M.; Theurillat, X.; Desmarchelier, A.; Ernest, M.; Stadler, R.H. Thermal degradation of 2-furoic acid and furfuryl alcohol as pathways in the formation of furan and 2-methylfuran in food. Food Chem. 2020, 303, 125406. [Google Scholar] [CrossRef] [PubMed]
  9. Sberveglieri, V.; Núñez-Carmona, E.; Comini, E.; Ponzoni, A.; Zappa, D.; Pirrotta, O.; Pulvirenti, A. A Novel Electronic Nose as Adaptable Device to Judge Microbiological Quality and Safety in Foodstuff. BioMed Res. Int. 2014, 2014, 529519. [Google Scholar] [CrossRef] [PubMed]
  10. Aimonino, D.R.; Comba, L.; Gay, P. Image processing for the determination of jam browning kinetics. In Proceedings of the Image Analysis for Agricultural Products and Processes, Workshop on Image analysis for agricultural processes and products, Potsdam, Germany, 27–28 August 2009; Bornim, E.V., Ed.; Institut fuer Agrartechnik, Bornimer Agrartechnische Berichte: Potsdam, Germany, 2009; pp. 132–137. [Google Scholar]
  11. Abbatangelo, M.; Núñez-Carmona, E.; Sberveglieri, V.; Comini, E.; Sberveglieri, G. k-NN and k-NN-ANN Combined Classifier to Assess MOX Gas Sensors Performances Affected by Drift Caused by Early Life Aging. Chemosensors 2020, 8, 6. [Google Scholar] [CrossRef] [Green Version]
  12. Abbatangelo, M.; Núñez-Carmona, E.; Sberveglieri, V.; Zappa, D.; Comini, E.; Sberveglieri, G. An Array of MOX Sensors and ANNs to Assess Grated Parmigiano Reggiano Cheese Packs’ Compliance with CFPR Guidelines. Biosensors 2020, 10, 47. [Google Scholar] [CrossRef] [PubMed]
  13. Núñez-Carmona, E.; Abbatangelo, M.; Zappa, D.; Comini, E.; Sberveglieri, G.; Sberveglieri, V. Nanostructured MOS Sensor for the Detection, Follow up, and Threshold Pursuing of Campylobacter Jejuni Development in Milk Samples. Sensors 2020, 20, 2009. [Google Scholar] [CrossRef] [PubMed] [Green Version]
  14. Zappa, D.; Bertuna, A.; Comini, E.; Kaur, N.; Poli, N.; Sberveglieri, V.; Sberveglieri, G. Metal oxide nanostructures: Preparation, characterization and functional applications as chemical sensors. Beilstein J. Nanotechnol. 2017, 8, 1205–1217. [Google Scholar] [CrossRef] [PubMed] [Green Version]
  15. Ponzoni, A.; Zappa, D.; Comini, E.; Sberveglieri, V.; Faglia, G.; Sberveglieri, G. Metal oxide nanowire gas sensors: Application of conductometric and surface ionization architectures. Chem. Eng. Trans. 2012, 30, 31–36. [Google Scholar] [CrossRef]
  16. Cano, M.P.; Marín, M.A. Pigment composition and color of frozen and canned kiwi fruit slices. J. Agric. Food Chem. 1992, 40, 2121–2146. [Google Scholar] [CrossRef]
  17. Burdurlu, H.S.; Koca, N.; Karadeniz, F. Degradation of vitamin C in citrus juice concentrates during storage. J. Food Eng. 2006, 74, 211–216. [Google Scholar] [CrossRef]
  18. Eskin, N.A.M. Biochemistry of food processing: Browning reactions in foods. In Biochemistry of Foods, 2nd ed.; Eskin, N.A.M., Ed.; Academic Press: London, UK, 1990; pp. 240–295. [Google Scholar] [CrossRef]
  19. Lespinard, A.R.; Bambicha, R.R.; Mascheroni, R.H. Quality parameters assessment in kiwi jam during pasteurization. Modelling and optimization of the thermal process. Food Bioprod. Process. 2012, 90, 799–808. [Google Scholar] [CrossRef]
  20. Wrolstad, R.E.; Durst, R.W.; Lee, J. Tracking color and pigment changes in anthocyanin products. Trends Food Sci. Technol. 2005, 16, 423–428. [Google Scholar] [CrossRef]
  21. Martinsen, B.K.; Aaby, K.; Skrede, G. Effect of temperature on stability of anthocyanins, ascorbic acid and color in strawberry and raspberry jams. Food Chem. 2020, 316, 126297. [Google Scholar] [CrossRef] [PubMed]
  22. Xia, A.N.; Liu, L.-X.; Tang, X.-J.; Lei, S.-M.; Meng, X.-S.; Liu, Y.-G. Dynamics of microbial communities, physicochemical factors and flavor in rose jam during fermentation. LWT 2022, 155, 112920. [Google Scholar] [CrossRef]
  23. Umar, R.; Naz, A.; Razzaq, K.; Raza, N.; Farooq, U.; Sharif, M.; Naz, N.; Ahmad, S.; Waheed, U. Physiochemical comparison of black and green grapes varieties and sensory evaluation of jam in Punjab, Pakistan. Int. J. Agric. Ext. 2022, 10, 219–231. [Google Scholar]
  24. Estoquia, L.Q.; Teleron, J.I. Operations Research on Product Development, Sensory Evaluation, Consumer’s Acceptability of Coco Sweet Jam. Int. J. Adv. Eng. Res. Sci. 2022, 7, 289–292. [Google Scholar]
  25. Núñez-Carmona, E.; Abbatangelo, M.; Sberveglieri, V. Internet of Food (IoF), Tailor-Made Metal Oxide Gas Sensors to Support Tea Supply Chain. Sensors 2021, 21, 4266. [Google Scholar] [CrossRef] [PubMed]
  26. Greco, G.; Carmona, E.N.; Sberveglieri, G.; Genzardi, D.; Sberveglieri, V. A New Kind of Chemical Nanosensors for Discrimination of Espresso Coffee. Chemosensors 2022, 10, 186. [Google Scholar] [CrossRef]
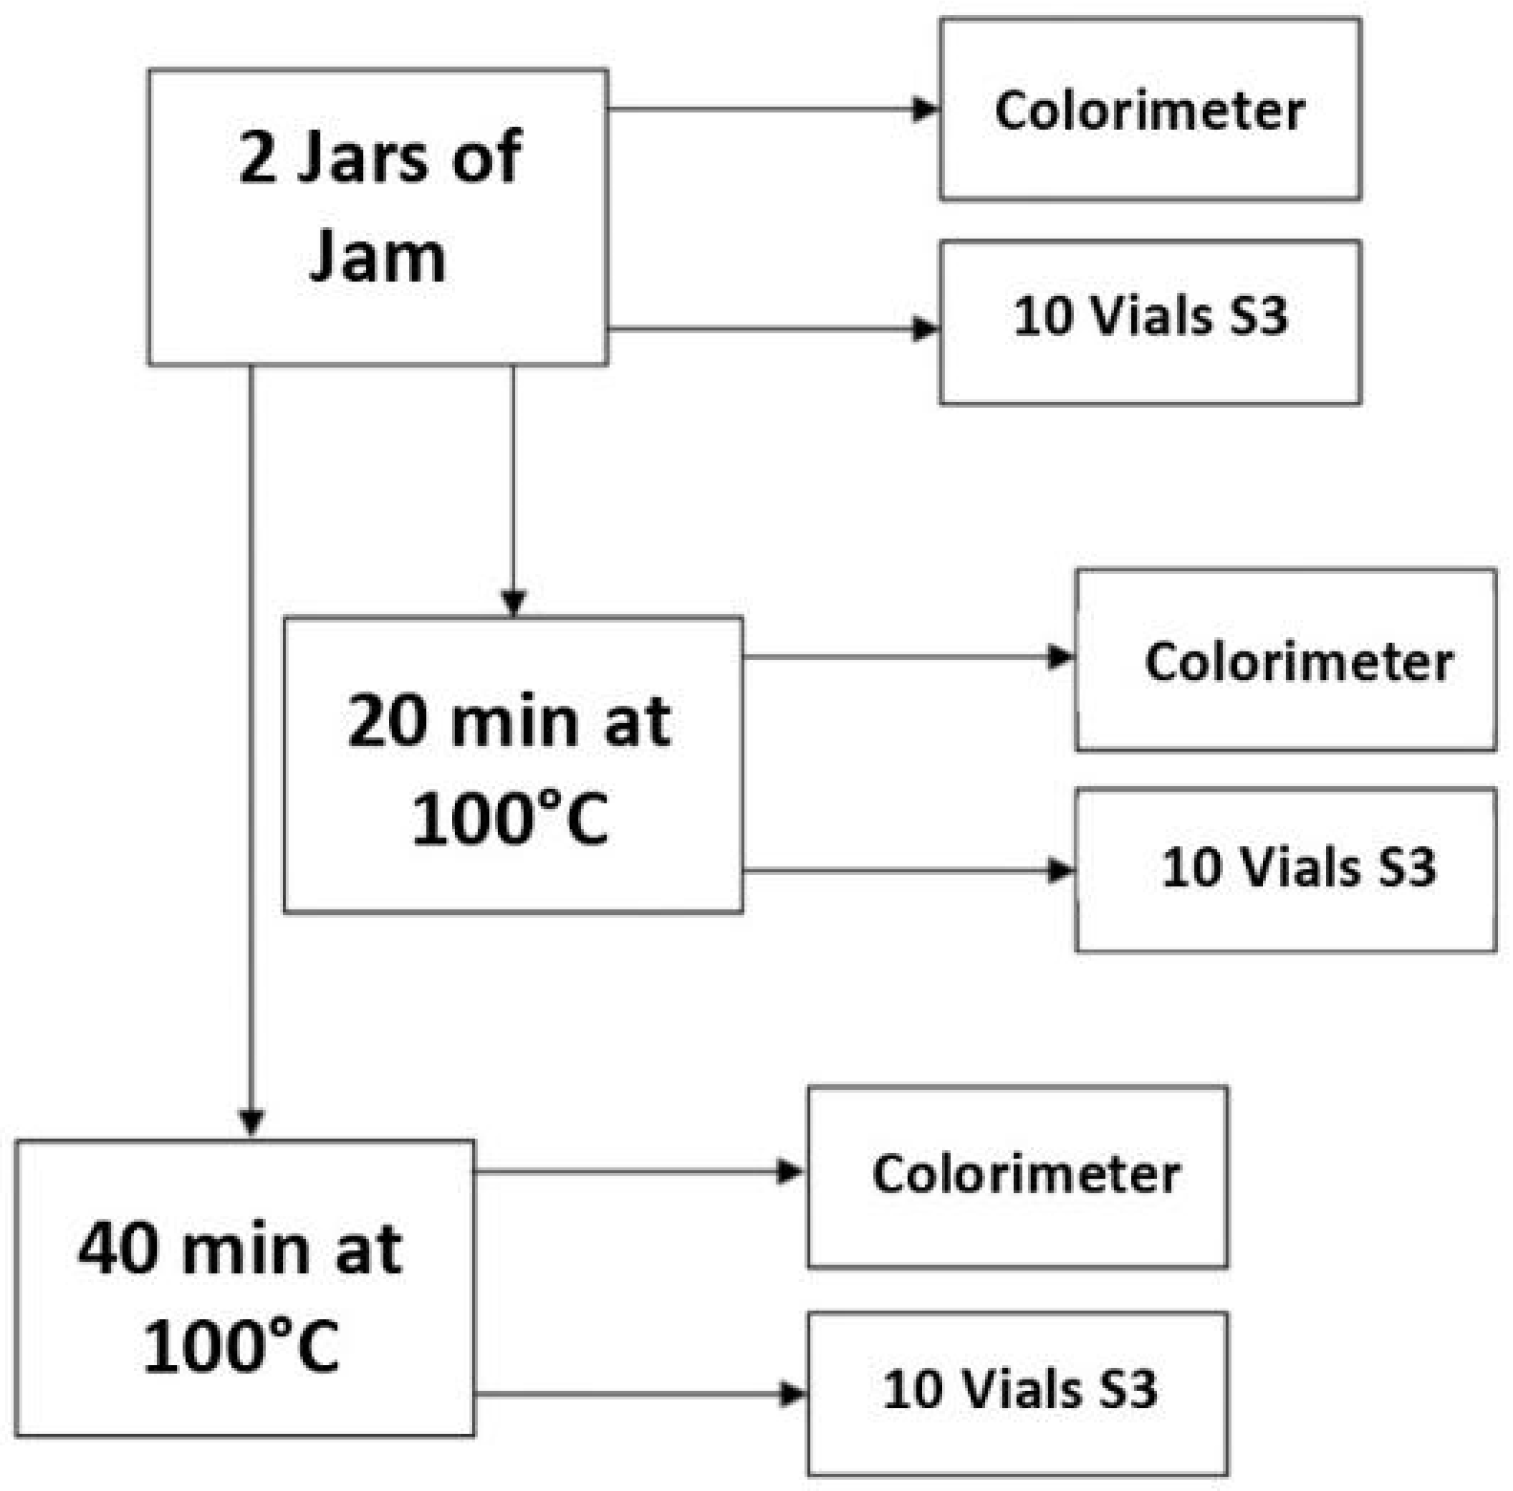
Figure 1. Samples path diagram.
Chemosensors 10 00345 g001
Figure 2. S3+ instrument.
Chemosensors 10 00345 g002
Figure 3. Histograms showing the average L*, a*, b* values for raspberry jam (A) and strawberry (B) and cherry (C) jam.
Chemosensors 10 00345 g003aChemosensors 10 00345 g003b
Figure 4. Comparison between the uncooked cherry jam (A) and the cherry jam after 40 min of overcooking (B).
Chemosensors 10 00345 g004
Figure 5. Principal Component Analysis result of the different tested raspberry jam samples.
Chemosensors 10 00345 g005
Figure 6. Principal Component Analysis result of the different tested strawberry jam samples.
Chemosensors 10 00345 g006
Figure 7. Principal Component Analysis result of the different tested Cherry jam samples.
Chemosensors 10 00345 g007
Table 1. Sample description and number of replicates.
Fruit Jam KindIngredientsSample Description
RaspberryRaspberry; grape sugar; gelling agent: pectin; concentrated elderberry juice. Fruit used 100 g per 100 g.Standard10
20 min overcooked10
40 min overcooked10
StrawberryStrawberry; grape sugar; gelling agent: pectin; acidity corrector: citric acid; concentrated elderberry juice. Fruit used 70 g per 100 g.Standard10
20 min overcooked10
40 min overcooked10
CherryCherries; sugar; concentrated lemon juice; gelling agent: pectin; acidity corrector: calcium citrate. Fruit used 50 g per 100 g of product.Standard10
20 min overcooked10
40 min overcooked10
Table 2. List of used sensors, Reotaxial Growth Thermal Oxidation (RGTO) and Nanowires.
MaterialsType of SensorWorking Temperature (°C)
SnO2 + AuRGTO400
SnO2 + AuRGTO300
CuONanowire350
SnO2 + AuNanowire350
SnO2 Nanowire350
Publisher’s Note: MDPI stays neutral with regard to jurisdictional claims in published maps and institutional affiliations.