Abstract
In this work, a simple analytical strategy combining high-performance liquid chromatography–diode array detection (HPLC-DAD) and the chemometric method was developed for the simultaneous quantification of 5-hydroxymethyl-2-furfural (HMF), paeoniflorin (PAE), ferulic acid (FER), baicalin (BAI), and berberine (BER) in a Chinese medicine formula Wen-Qing-Yin (WQY). The alternating trilinear decomposition (ATLD) algorithm and alternating trilinear decomposition assisted multivariate curve resolution (ATLD-MCR) algorithm were used to realize the separation and rapid determination of five target analytes under the presence of time shifts, solvent peaks, peak overlaps, and unknown interferences. All analytes were eluted within 10 min and the linear correlation coefficients of calibration sets were between 0.9969 and 0.9996. In addition, the average recoveries of the five active compounds obtained by ATLD and ATLD-MCR analysis were in the range of 91.8–112.5% and 88.6–101.6%, respectively. For investigating the accuracy and reliability of the proposed method, figures of merit including limit of detection (LOD), limit of quantitation (LOQ), sensitivity (SEN), and selectivity (SEL) were calculated. The proposed analytical strategy has the advantages of being fast, simple, and sensitive, and can be used for the qualitative and quantitative analysis of WQY, providing a feasible option for the quality monitoring of the traditional Chinese medicine formula.
1. Introduction
Traditional Chinese medicine (TCM) is mainly derived from natural medicines such as herbal medicine and its processed products have attracted wide attention due to their low toxicity and good curative effect. TCM contains multiple components, and the content of active components will affect its quality and effectiveness. Therefore, it is very important to develop appropriate methods to monitor the content of active constituents in TCM.
Wen-Qing-Yin (WQY) is a traditional Chinese medicine formula, which is composed of Huang Lian Jie Du Tang and Si Wu Tang, including Radix Angelicae Sinensis, Radix Paeoniae Alba, Radix Rehmanniae Praeparata, Rhizoma Chuanxiong, Rhizoma Coptidis, Radix Scutellaria, Cortex Phellodendri, and Fructus Gardeniae. According to previous research, alkaloids, flavonoids, terpene glycosides, and iridoid glycosides are the predominant constituents in Wen-Qing-Yin [1,2]. The study found that there is anti-oxidation [3,4,5], anti-ulcer [6,7,8], anti-inflammatory [9,10,11,12], anti-microbial [13,14,15], and anti-cancer [16,17,18] activity for the treatment of gynecological bleeding disorders, skin diseases, recurrent aphthous ulcer, etc. [19]. At present, many quantitative methods have been developed for simultaneously determining active constituents in TCM, including ultra-high-performance liquid chromatography, high-performance liquid chromatography (HPLC), and capillary electrophoresis in combination with MS, diode array detector, or UV, etc. [20,21,22,23,24].
Among these methods, high-performance liquid chromatography–diode array detection (HPLC-DAD) is the most widely used, with excellent separation ability and great stability. However, due to the similar and complex structure of TCM, traditional HPLC methods usually require complex sample pretreatment for the complete separation of target analytes and to avoid background interference. It takes a lot of time to optimize experimental conditions and requires longer elution time; also, the background interference of actual samples is ever-changing. At the same time, baseline shifts and time shifts will affect the accuracy of the analysis results.
5-hydroxymethyl-2-furfural (HMF), paeoniflorin (PAE), ferulic acid (FER), baicalin (BAI), and berberine (BER) are the indicator components of WQY [3,25,26,27,28,29]; the specific physicochemical information of five analytes is shown in Table S1. At present, there are few reports on simultaneous quantitative analysis of these compounds. According to the published literature, a chromatographic analysis takes more than 30 min [30,31], which is very time-consuming. Therefore, it is urgent to find a more efficient analysis strategy to solve the aforementioned issues. In recent years, chemometrics multivariate calibration has been widely used in chromatographic analysis. Among them, second-order calibration has successfully and quickly used “mathematical separation” to solve many complex problems. Multiple target analytes can be quantified accurately when various unknown interferences exist, which benefits from the “second-order advantage” of the second-order calibration method [32].
Therefore, two second-order calibration algorithms, alternating trilinear decomposition (ATLD) algorithm and alternating trilinear decomposition assisted multivariate curve resolution (ATLD-MCR) algorithm were combined with HPLC-DAD for simultaneous and rapid determination of the five active constituents in WQY. The proposed strategy reduced complicated separation and purification processes and overcame the interference of time shifts, solvent peaks, and chromatographic peak overlap. Finally, the performances of the two algorithms were briefly compared.
2. Materials and Methods
2.1. Chemicals and Reagents
The analytical standards (≥98.0%) of 5-hydroxymethyl-2-furfural, paeoniflorin, ferulic acid, baicalin, and berberine were purchased from Macklin (Shanghai, China), and the ultrapure water (18.2 MΩ cm) was prepared by Milli-Q water purification system (Millipore, Bedford, MA, USA). HPLC-grade acetonitrile and methanol were supplied by Sigma-Aldrich (St. Louis, MO, USA) and HPLC-grade formic acid was obtained from Thermo Fisher Scientific (Waltham, MA, USA).
An appropriate amount of standard was dissolved in methanol to prepare a stock solution, and then working standard solutions were newly prepared by dilution with methanol to the final concentration of 0.4–2.0 µg mL−1. All stock solutions were kept at 4 °C in the refrigerator until they were utilized.
2.2. Chromatographic Instrument and Conditions
This work was carried out on an LC-20AT liquid chromatographic system (Shimadzu, Japan) equipped with a diode array detector, a 20 μL loop, degasser, and a quaternary pump. The chromatographic separation was performed on a WondaSilTM C18 column (5 μm, 200 mm × 4.6 mm) with the column temperature of 30 °C and the column pressure at 6.7 MPa. The flow rate was set at 1.00 mL min−1 and the injection volume was 20 μL. In order to enhance the resolution and improve the peak symmetry, small amounts of formic acid were added to the aqueous phase with the optimal concentration of 1.0 mL L−1. The mobile phase was composed of 0.1% formic acid aqueous solution (solvent A) and acetonitrile solution (solvent B). Under the isocratic elution condition of 30% B, all analytes were eluted within 10 min in isometric elution mode.
2.3. Sample Preparation Procedures
WQY commercial samples were purchased from three different manufacturers, namely Sun Ten Pharmaceutical Co., Ltd. (Taipei, China), Kaiser Pharmaceutical Co., Ltd. (Tainan, China), and Sheng Chang Co., Ltd. (Taipei, China), indicated in the text as Q01 to Q03, respectively. First, 1.00 g WQY powder samples were weighed and dissolved with 10 mL HPLC-grade methanol. Secondly, the mixtures were sonicated for 30 min and left for 12 h to be completely extracted and were then filtered with 0.22 μm nylon filters before HPLC-DAD analysis.
The calibration samples (C01–C08) were prepared by diluting the working solution with pure methanol solution into a 10.0 mL brown volumetric flask. The concentration design of the calibration set adopted the uniform design U8* (85) to minimize the potential co-linear factor. Three spiked prediction samples were prepared by transferring the processed WQY actual sample (manufactured by Sun Ten Pharmaceutical Co., Ltd., Taipei, China) and the appropriate volume of the working solution to a 10 mL volumetric flask and diluting it with methanol. Considering that the concentrations of BAI and BER in the WQY real sample are much higher than the concentrations of HMF, PAE, and FER, the real samples of WQY were added to the predicted samples in two concentrations, diluted 20 times to detect HMF, PAE, and FER (P01–P03), and 50 times to detect BAI and BER (P04-P06). The concentrations of the calibration set samples are shown in Table S2.
2.4. Theory
2.4.1. Trilinear Component Model
For each sample, a two-dimensional data matrix composed of I elution time scan points and J wavelength points can be obtained. After all K samples (including the calibration samples, spiked prediction samples, and real samples) are measured under the same conditions, these two-dimensional data matrices can be stacked in sequence along the sample dimension into a three-way array X (I × J × K). The array X can be represented by a mathematical equation as follows:
N denotes the total number of factors, including analytes of interest, co-eluted interfering compounds, backgrounds, baseline shifts, and noises. xijk is the element of the three-way array X (I × J × K), and it represents the response value of the sample k at elution time i and spectral channel J. ain, bjn, ckn, and eijk are the corresponding elements of normalized chromatographic matrix A (I × N), normalized UV spectral matrix B (J × N), and relative concentration matrix C (K×N) elements and three-way residue array E (I × J × K).
2.4.2. ATLD Algorithm
ATLD algorithm is a universal unconstrained alternating iteration algorithm proposed by Wu et al. in 1996 [33], which is insensitive to the number of factors estimated. It also has the advantage of fast convergence because the trilinear structural model of the sliced matrices is used for calculation [32]. Therefore, ATLD is very suitable for processing large-size data such as HPLC-DAD, LC-MS, and liquid chromatography–fluorescence detection data. When using this algorithm to process second-order chromatographic data, the background information can be fitted by increasing the number of factors, so that the baseline shifts can be eliminated as part of the interference [34]. At the same time, ATLD algorithm can tolerate slight time shifts. However, it is not suitable if the time shifts are serious. ATLD algorithm alternately minimizes the following three objective functions to obtain the qualitative matrixes (A and B) and the relative concentration matrix (C) by using the Moore–Penrose generalized inverse based on singular value decomposition:
Concrete theoretical descriptions and more detailed information on ATLD can be found in relevant Ref. [33]
2.4.3. ATLD-MCR Algorithm
ATLD-MCR algorithm, proposed in 2019 by Wang et al. [35] is a newly published algorithm which can successfully solve the problem of retention time shifts in liquid chromatographic data. The brief principle is: first, ATLD is used to fit the data with time shifts to obtain an approximate value and initial spectra matrix Bini. Then, based on the MCR strategy, the retention time profiles matrix Ak of each sample is obtained through the optimized least square calculation (see Equation (5)). X..k is the slice matrix of each sample. Finally, qualitative information (Ak and B) and quantitative information (C) are obtained by the following equation:
where + and × denote the Moore–Penrose generalized inverse Hadamard product, respectively; −1 represents the inverse of a matrix; (.) indicates that the diagonal elements of the square matrix in brackets are extracted to form a column vector.
3. Results and Discussion
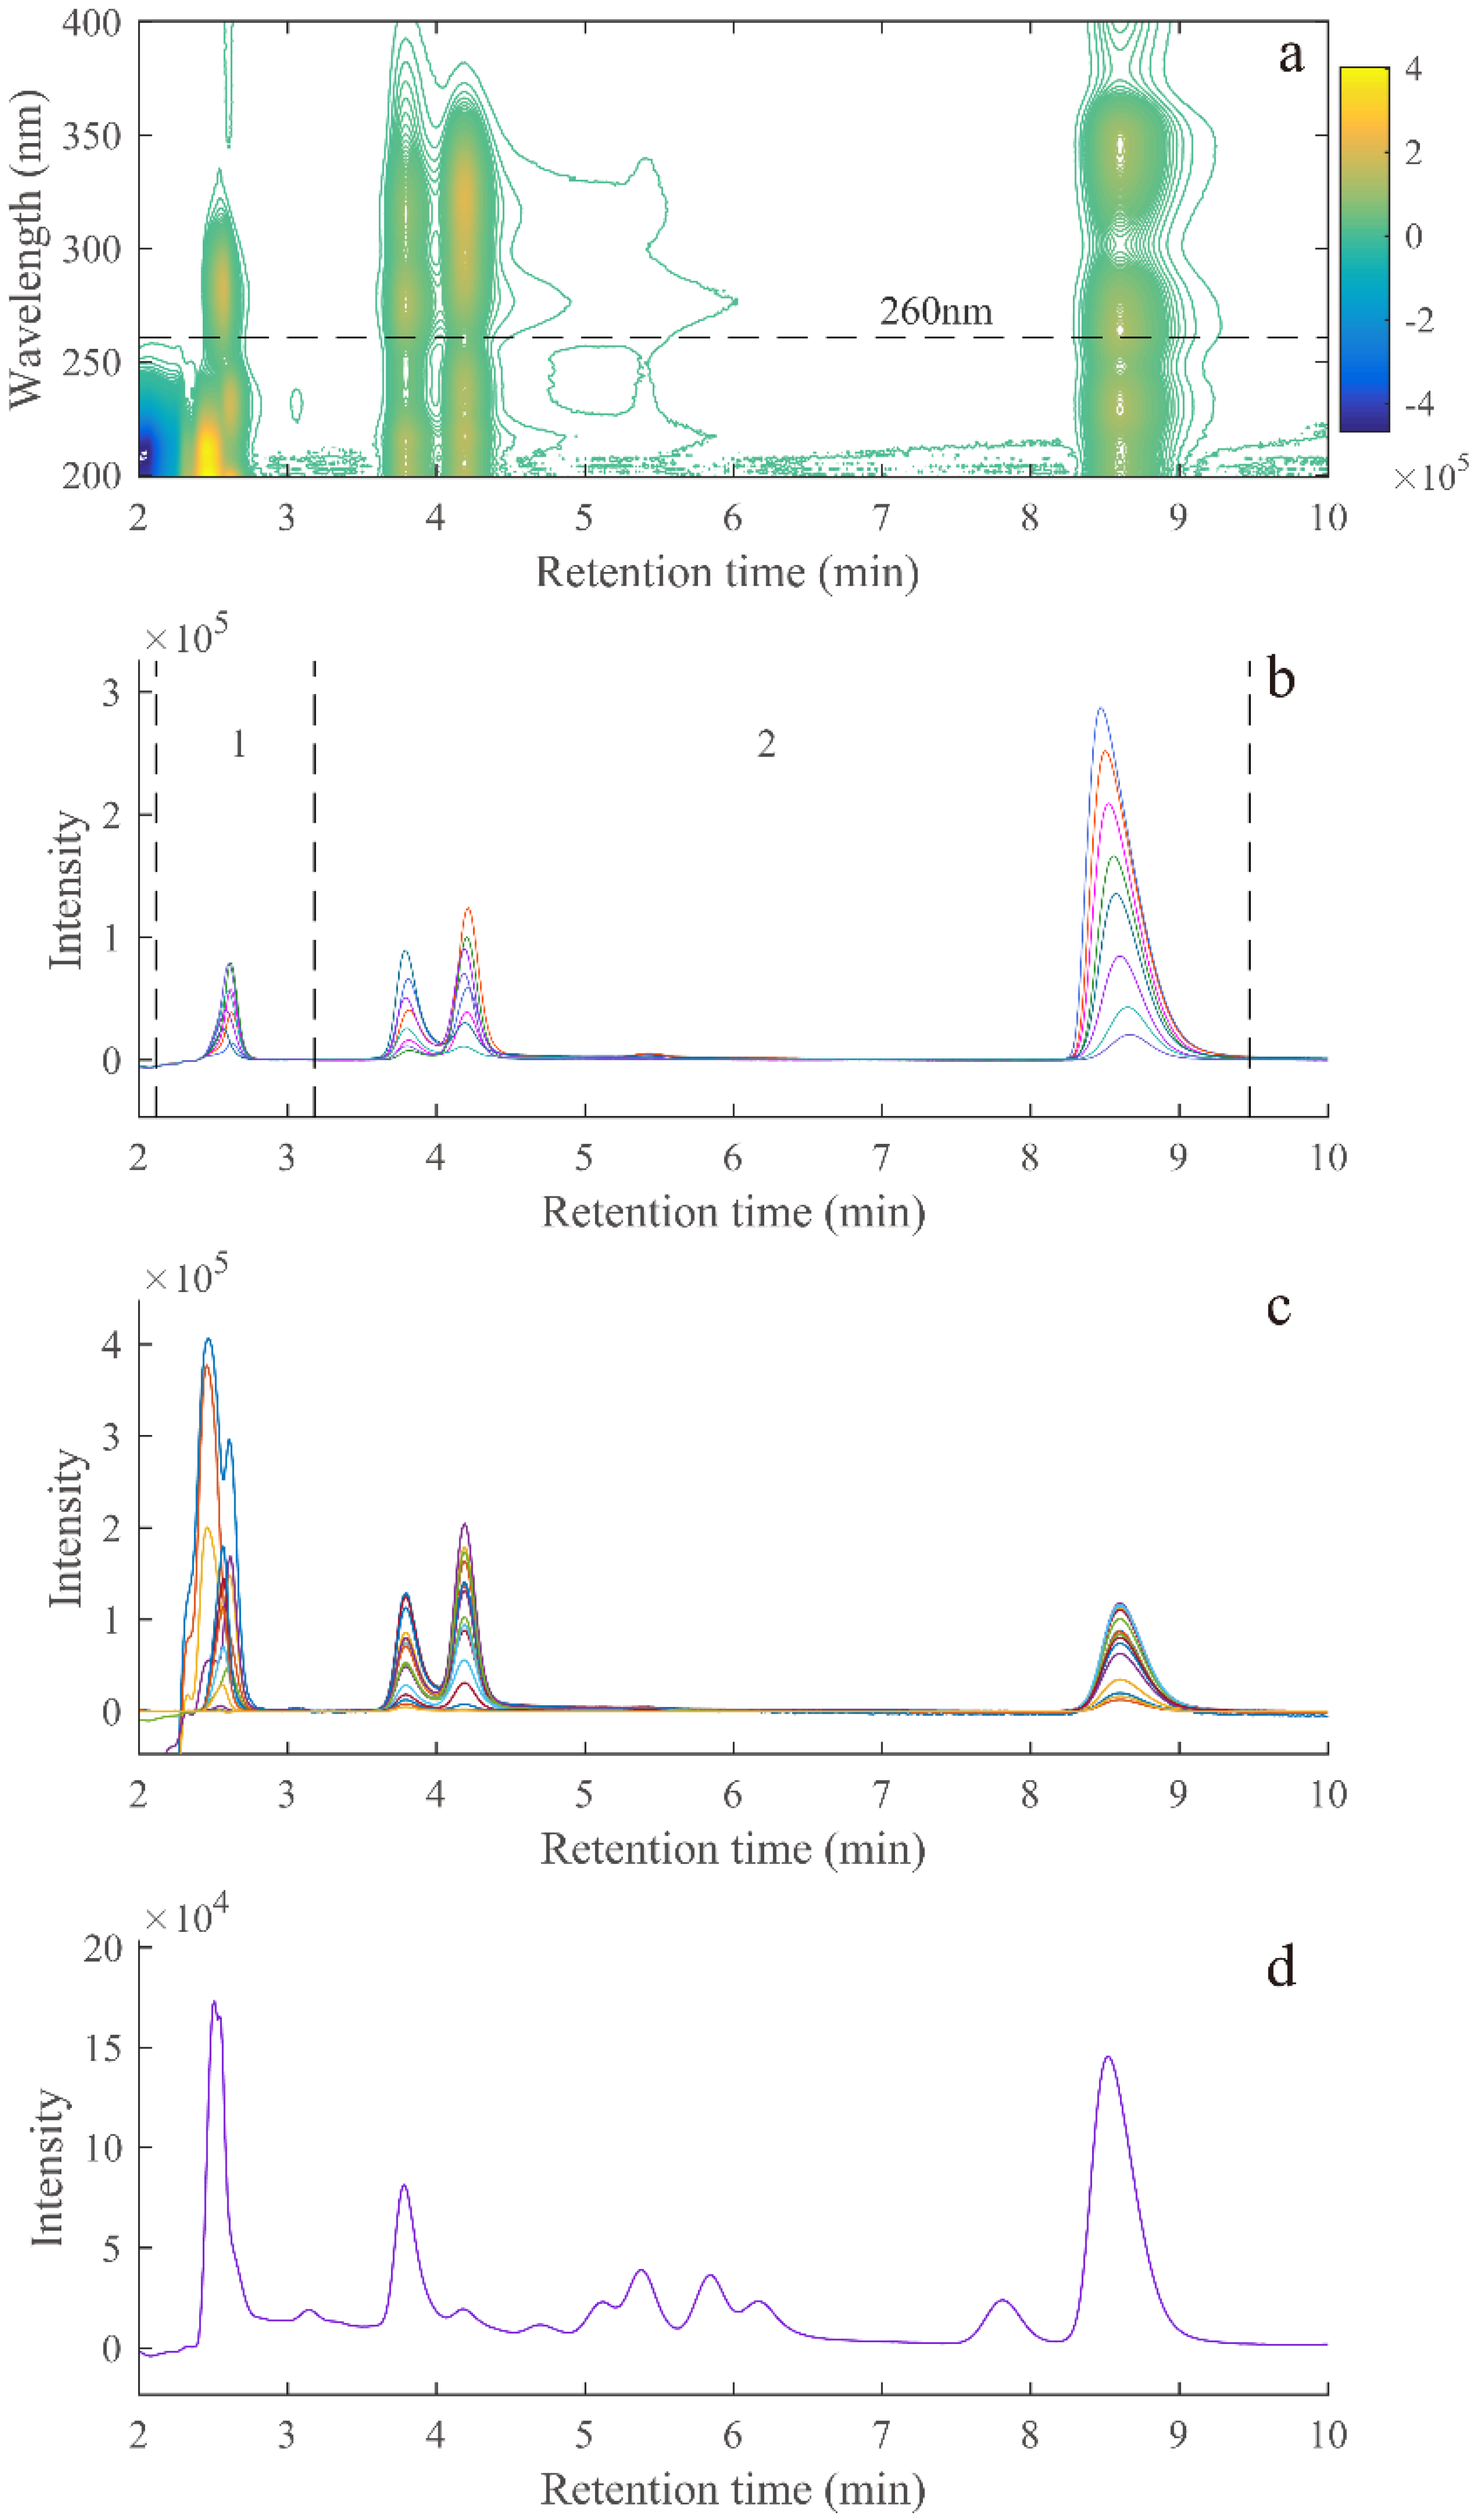
3.1. General Considerations of the HPLC-DAD Experiment
The spectral profiles and chromatographic profiles of the 6th mixed standard sample (C06) are shown in Figure 1a,c. As can be seen, the five target analytes are completely eluted within 10 min and all the peaks are sharp. However, the chromatographic peaks of HMF and PAE overlap severely when eluted quickly; it seems that there is only one response peak and it is heavily affected by the solvent peak. The peaks of FER and BAI were also co-eluted. Figure 1d shows the elution time profiles at 260 nm for real samples. The unknown compounds or interferences are overlapped with the peaks of the target analytes. It indicates that under the same conditions, it is difficult to obtain satisfactory and universal separation results with the classic HPLC method. However, the combination of HPLC-DAD and the second-order calibration method is good at solving the above problems.
Figure 1.
(a) Two−dimensional contour profile of a mixed standard solution (C06); (b) the elution time profiles at 260 nm for eight calibration samples; (c) multi−channel chromatographic profile of a mixed standard solution (C06); (d) the elution time profiles at 260 nm for six predicted samples.
It can be seen from Figure 1b that in the measurement on the same day, no obvious peak shifts and serious time shifts were observed. At the same time, the ATLD algorithm can handle baseline shifts and tolerate slight time shifts [34]. In addition, if the time shifts affect the accuracy of the results, ATLD-MCR algorithm can be used to eliminate this effect.
In order to remove invalid information and achieve better resolution, two different subregions were divided according to the elution time ranges of each sample. HMF and PAE are in the first region, and the second region includes three target analytes, BAI, FER, and BER. In this work, the number of components estimated as N indicates that there are N different signals (including analytes and interference signals) in the selected region. The details of the two three-way subregions are summarized in Table S3.
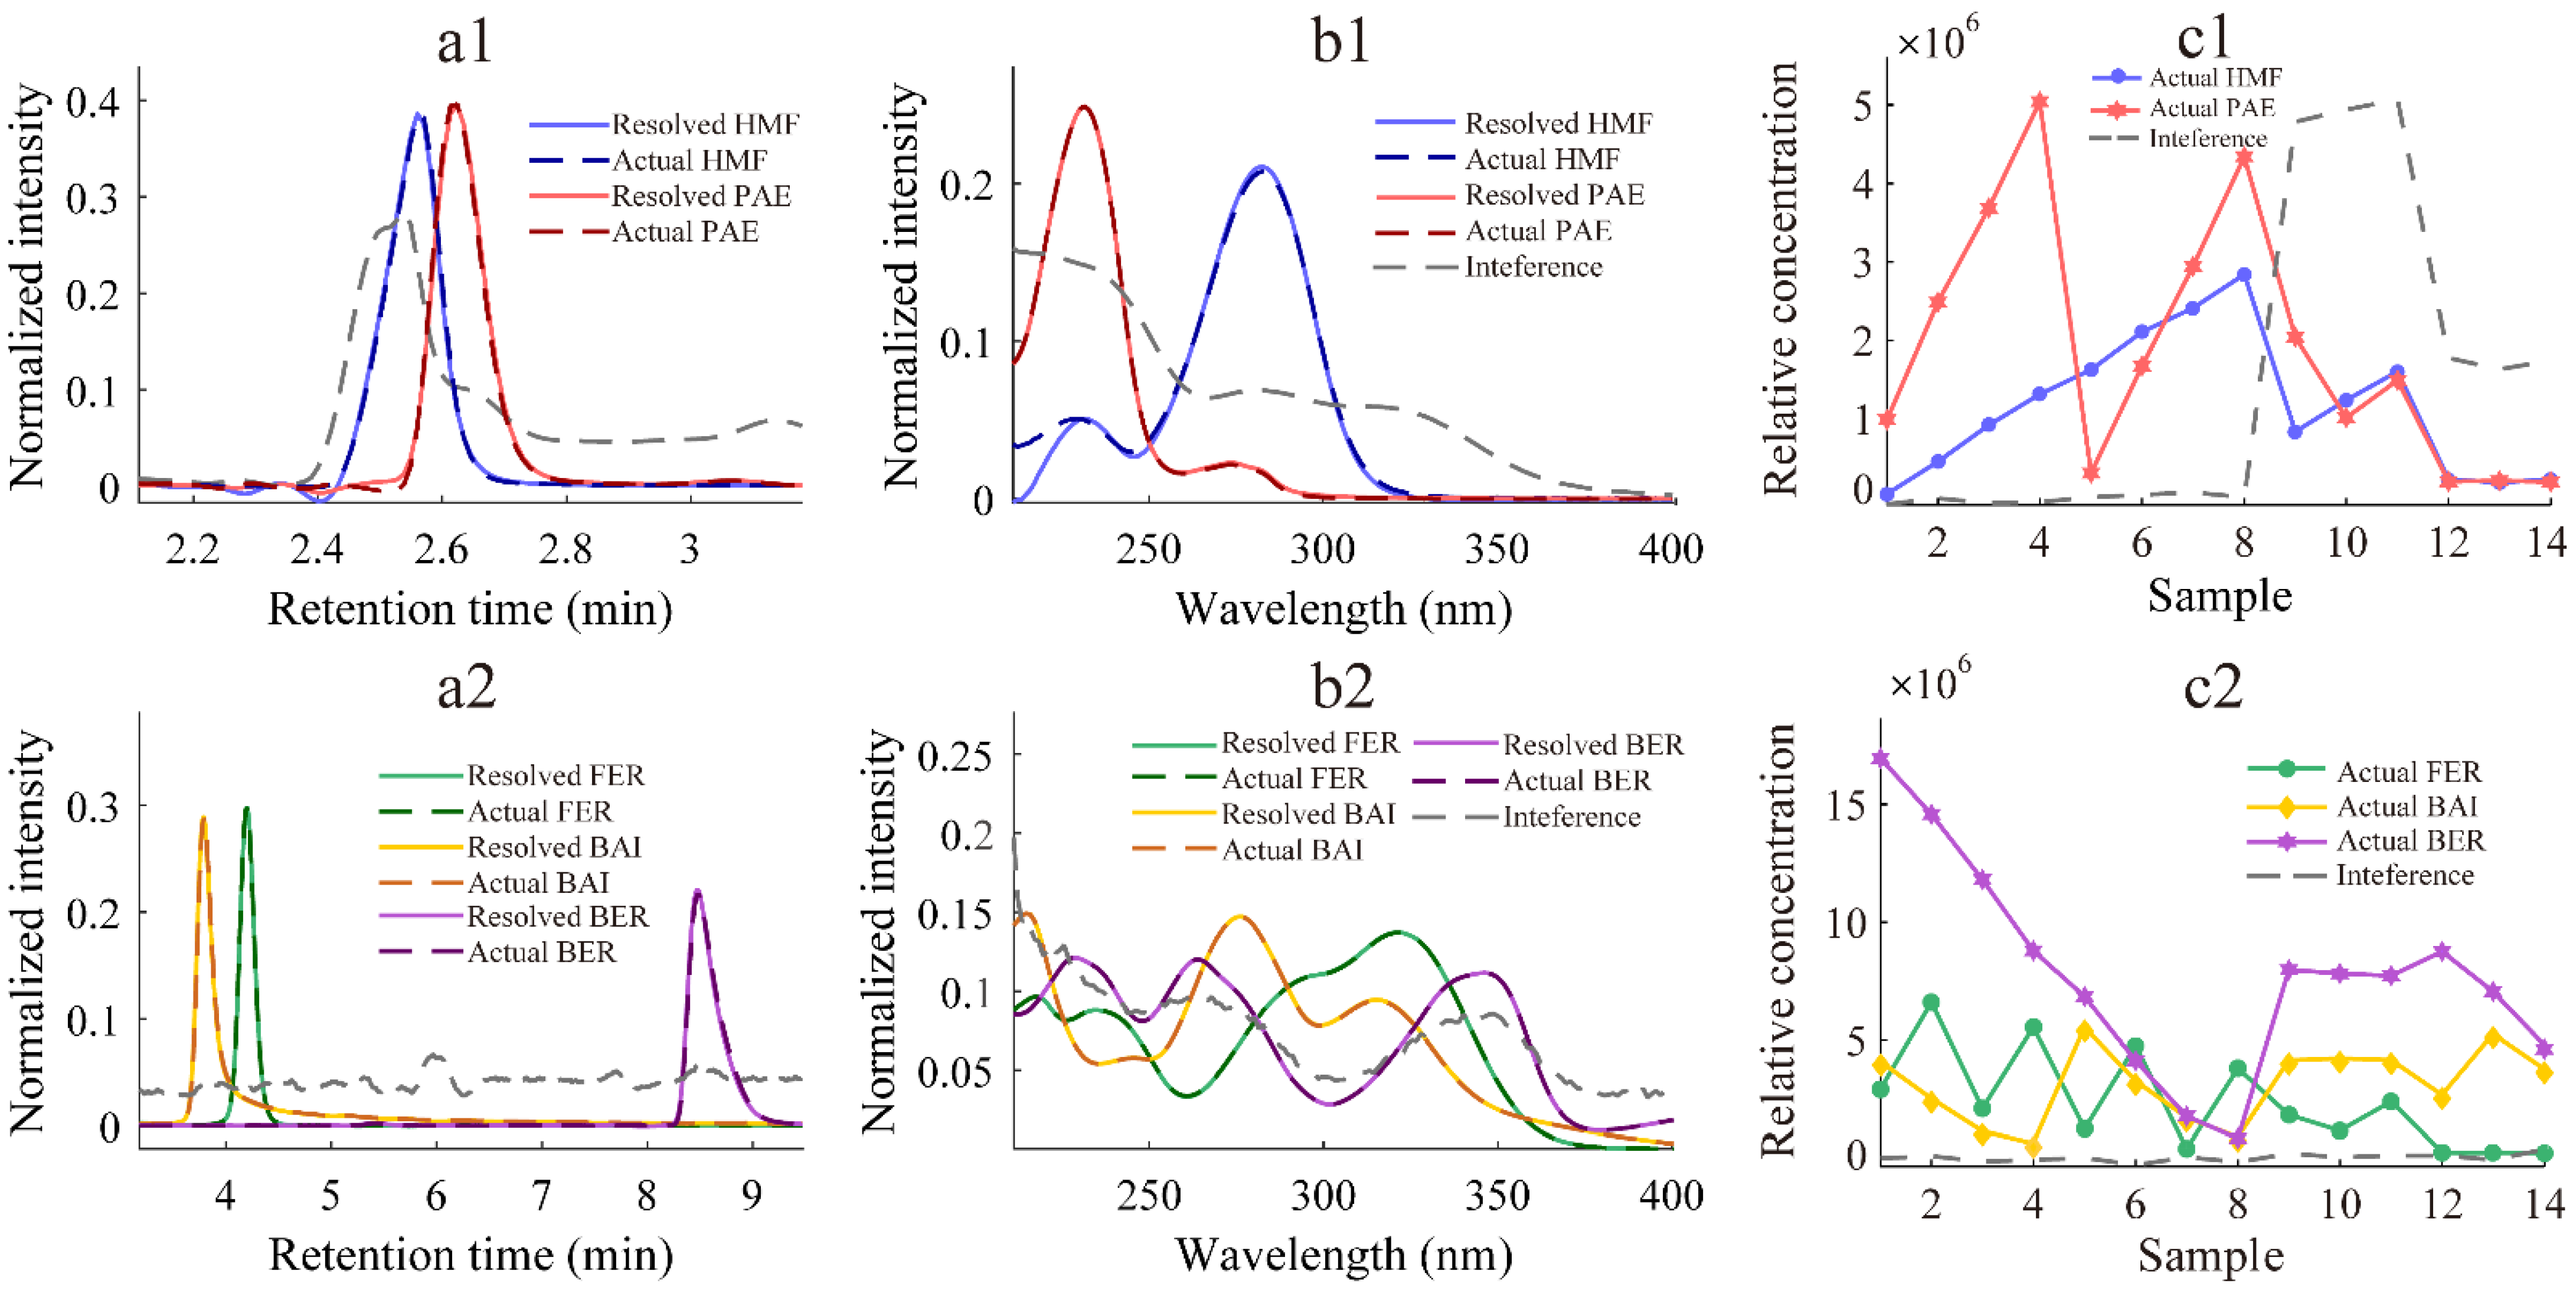
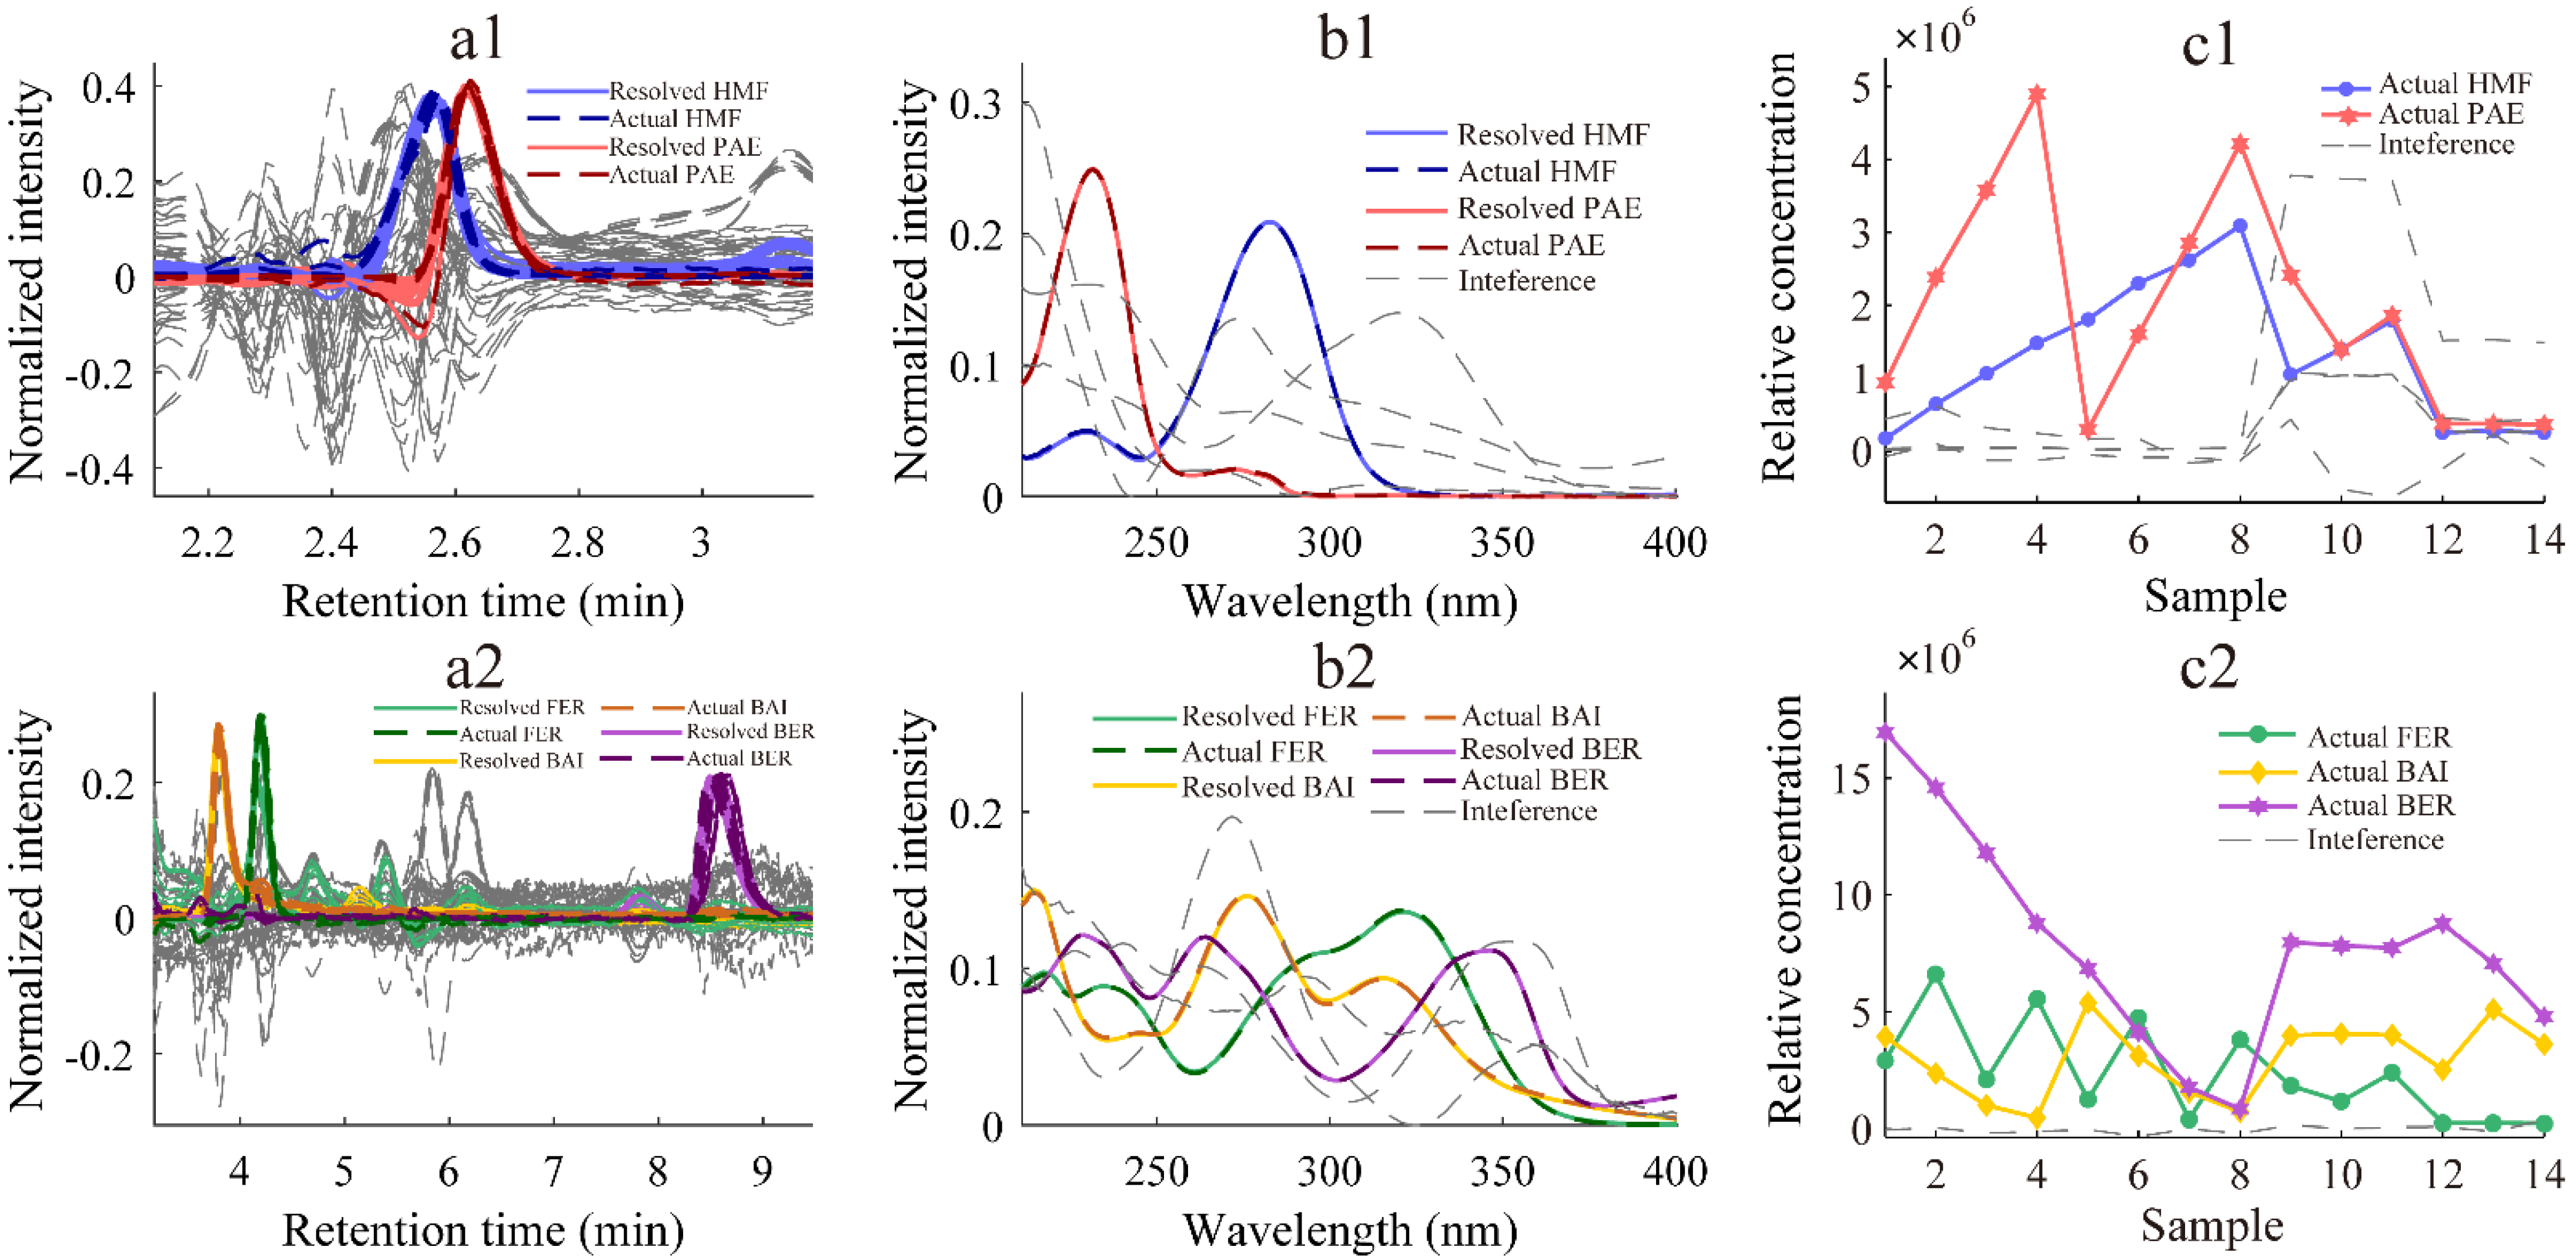
3.2. Quantification of Five Active Constituents in WQY
As shown in Figure 2 and Figure 3, the normalized chromatograms (a1,a2), normalized spectrograms (b1,b2), and relative concentration profiles (c1,c2) were well-resolved by ATLD and ATLD-MCR algorithms from two three-way subarrays. Even if there is interference of solvent peak, peak overlaps, and unknown components co-eluted, the target information such as pure chromatogram and spectrum of the analyte can be successfully extracted out from the information-rich HPLC-DAD data array. For ATLD and ATLD-MCR algorithms, the resolved chromatographic and spectral profiles of analytes are fairly consistent with corresponding real profiles. Especially for HMF and PAE, satisfactory qualitative results were obtained under similar retention times and interference from solvent peaks.
Figure 2.
The normalized chromatograms (a1,a2), the normalized spectrograms (b1,b2), and the relative concentration profiles (c1,c2) resolved by the ATLD algorithm from two three-way subarrays.
Figure 3.
The normalized chromatograms (a1,a2), the normalized spectrograms (b1,b2), and the relative concentration profiles (c1,c2) resolved by the ATLD−MCR algorithm from two three−way subarrays.
3.3. Accuracy and Precision
Through the linear regression of the corresponding column in peak heights (relative concentrations C) to the real concentrations of the analytes in calibration samples, the pseudo-univariate calibration curves can be built, and then the absolute concentration of the component of interest in the unknown samples can be obtained by the established linear regression equations. The linear range and regression equation of the target analytes are shown in Table S4 and the prediction results of five target analytes based on ATLD and ATLD-MCR algorithms are summarized in Table 1; also, the detailed spiked concentration and recoveries of the six prediction samples are shown in Table S5.
Table 1.
Accuracy of five target analytes in spiked prediction samples (P01–06) of WQY commercial products using ATLD and ATLD-MCR methods.
For ATLD algorithm, the average recoveries of all analytes are in the range of 91.8–112.5% with the SDs less than 9.7%, the correlation coefficients (r) of the analyte prediction between 0.9969 and 0.9993, and root-mean-square errors of predictions (RMSEPs) <4.05 μg mL−1. For ATLD-MCR algorithm, the r values are between 0.9973 and 0.9995 with the RMSEPs less than 3.04 μg mL−1; the average recoveries ranged from 88.6 to 101.6% with the SDs <10.3%. The results obtained are relatively close. The RMSEPs values of ATLD-MCR are small, and all the recoveries are within acceptable ranges, indicating that the predicted concentrations are consistent with the standard concentrations, which are generally satisfactory.
3.4. Repeatability and Reproducibility
In order to investigate the repeatability and reproducibility of the method, intra-day and inter-day precisions (expressed as RSD %) were calculated by analyzing the same batch of WQY real sample three times on the same day and three consecutive days, respectively. Two types of RSDs (n = 3) are summarized in Table 2.
Table 2.
The figures of merit and precision for determination of five analytes in selected WQY samples using ATLD and ATLD-MCR methods.
The intra-day and inter-day RSDs obtained by ATLD-MCR are better than ATLD. Especially for BER, the inter-day RSD obtained by ATLD is 40.8% due to the serious time shifts in the measurement on consecutive days (see Figure S1). The first four analytes are eluted quickly, so the slight time drift was eliminated by ATLD algorithm as part of the interference. BER was eluted as the last substance, and the time shifts generated needed to be solved by other algorithms. Fortunately, the retention time shifts in second-order calibration were effectively processed by ATLD-MCR algorithm. In addition, the intra-day RSDs were usually smaller than the inter-day RSDs.
3.5. Analytical Figures of Merit
To evaluate the performances of the proposed analytical methods, figures of merit, including selectivity (SEL), sensitivity (SEN), limit of detection (LOD), and limit of quantitation (LOQ) were calculated and are summarized in Table 2. The mathematical theory of figures of merit has been discussed in detail and will not be repeated here [36]. In this experiment, the SEN values are between 1.04 × 10⁴ and 1.24 × 10⁵ mAu mL μg−1 for ATLD and 7.74 × 10³ and 7.93 × 10⁴ mAu mL μg−1 for ATLD-MCR, and the SEL values of each analyte obtained by ATLD and ATLD-MCR are in the range of 0.20–0.56 and 0.13–0.35. It is worth noting that the lower SEL values of the target analytes are due to the severe impact of peak overlaps and unknown interferences. The LOD ranges of ATLD and ATLD-MCR are 0.07–11.67 µg mL−1 and 0.22–4.53 µg mL−1, respectively. As can be seen, the results of LOD values obtained by ATLD are acceptable, except that the LOD of BER is lower than the minimum concentration of the calibration samples, which is due to the influence of time shifts. At the same time, the results obtained by the ATLD-MCR algorithm are reasonable and satisfactory.
3.6. Evaluation of Two Methods
Based on the above discussion, it can be noted from the results of ATLD algorithm and ATLD-MCR that satisfactory results are obtained when the time shifts are relatively light. The two methods are statistically analyzed by using the two-tailed paired t-test. There are significant differences if the p value is less than 0.05. The analysis results summarized in Table S5 show that the p values of HMF, PAE, FER, and BAI are 0.358, 0.258, 0.063, and 0.332, respectively, indicating that there are no significant differences in the results of these four analytes. However, the p value of BER is 0.001 because of the influences of retention time shifts. Other statistical parameters also show that when there are time shifts, ATLD-MCR can obtain better results. In the chromatographic analysis, when the elution time is short enough and the retention time shifts are not serious, the ATLD algorithm can be directly used for analysis with good repeatability and reproducibility. In addition, the ATLD-MCR algorithm can handle the impact of retention time shifts well and assisted the HPLC-DAD method to accurately determine the main active constituents in WQY.
3.7. Analysis of the Other WQY Samples
When ATLD algorithm is used to forcibly fit the non-trilinear structural data with retention time shifts, a certain level of accuracy will be the cost [35]. Therefore, we applied the ATLD-MCR strategy to determine the main active constituents in the other two commercial WQY samples. The corresponding results are summarized in Table S6.
4. Conclusions
In this work, a smart strategy based on the combination of HPLC-DAD with the second-order calibration methods was developed to simultaneously and rapidly quantify the five active constituents in WQY. The ability of the two methods to analyze chromatographic data with retention time shifts was properly discussed. The proposed strategy is sensitive and time-saving for the analysis of chromatographic data with slight time shifts, and all target analytes showed good linearity within the calibration range. Moreover, the ATLD-MCR algorithm also properly solved the problem of serious time shifts. This work takes Wen-Qing-Yin as an example, which shows that the proposed strategy can be used as a reliable tool for determining the active constituents and quality monitoring in the formulations of traditional Chinese medicines.
Supplementary Materials
The following supporting information can be downloaded at: https://www.mdpi.com/article/10.3390/chemosensors10070238/s1, Figure S1: The elution time profiles at 260 nm for WQY real sample on three consecutive days; Table S1: The specific physic-chemical information of five analytes; Table S2: Concentrations of five target analytes in calibration samples; Table S3: The ranges of elution time and spectral wavelength in the two subregions for the five target analytes, the number of estimated factors for exact decomposition of the three-way array using the ATLD and ATLD-MCR algorithms; Table S4: The linear range of five target analytes, regression equation and correlative coefficient (r); Table S5: The spiked concentration and recoveries of the six prediction samples and the p values; Table S6: The concentrations of five analytes in another two WQY commercial products obtained from ATLD-MCR method.
Author Contributions
J.-C.C.: conceptualization, methodology, writing—original draft preparation, writing—review and editing. H.-L.W.: conceptualization, methodology, funding acquisition. T.W.: methodology, validation, data curation. M.-Y.D.: validation. Y.C.: investigation. R.-Q.Y.: supervision. All authors have read and agreed to the published version of the manuscript.
Funding
This research was funded by the National Natural Science Foundation of China under Grant (No. 22174036, No. 21775039 and No.21575039).
Institutional Review Board Statement
Not applicable.
Informed Consent Statement
Not applicable.
Data Availability Statement
Not applicable.
Conflicts of Interest
The authors declare no conflict of interest.
Abbreviations
| HPLC-DAD | high performance liquid chromatography-diode array detection |
| ATLD | alternating trilinear decomposition |
| ATLD-MCR | alternating trilinear decomposition assisted multivariate curve resolution |
| WQY | Wen-Qing-Yin |
| TCM | traditional Chinese medicine |
| RMSEP | relative root mean square error of prediction |
| SD | standard deviation |
| RSD | relative standard deviation |
| SEL | selectivity |
| SEN | sensitivity |
| LOD | limit of detection |
| LOQ | limit of quantitation |
References
- Zhou, F.; Li, J.; He, Y.; Mu, R.; Fu, C. Simultaneous determination of eight components in Siwu decoction by HPLC and analysis of transmitting of the components in water extraction and ethanol precipitation process. Chin. J. Pharm. Anal 2019, 39, 983–991. [Google Scholar]
- Qi, Y.; Zhang, Q.; Zhu, H. Huang-Lian Jie-Du decoction: A review on phytochemical, pharmacological and pharmacokinetic investigations. Chin. Med. 2019, 14, 57. [Google Scholar] [CrossRef] [PubMed] [Green Version]
- Xu, Z.F.; Feng, W.; Shen, Q.; Yu, N.N.; Yu, K.; Wang, S.J.; Chen, Z.G.; Shioda, S.; Guo, Y. Rhizoma Coptidis and Berberine as a Natural Drug to Combat Aging and Aging-Related Diseases via Anti-Oxidation and AMPK Activation. Aging Dis. 2017, 8, 760–777. [Google Scholar] [CrossRef] [PubMed] [Green Version]
- Zdunska, K.; Dana, A.; Kolodziejczak, A.; Rotsztejn, H. Antioxidant properties of ferulic acid and its possible application. Ski. Pharmacol. Physiol. 2018, 31, 332–336. [Google Scholar] [CrossRef] [PubMed]
- Grzegorczyk-Karolak, I.; Golab, K.; Gburek, J.; Wysokinska, H.; Matkowski, A. Inhibition of advanced glycation end-product formation and antioxidant activity by extracts and polyphenols from Scutellaria alpina L. and S. altissima L. Molecules 2016, 21, 739. [Google Scholar] [CrossRef] [PubMed] [Green Version]
- Sun, Y.; Lenon, G.B.; Yang, A.W.H. Phellodendri cortex: A phytochemical, pharmacological, and pharmacokinetic review. Evid. Based Complement. Altern. Med. 2019, 2019, 7621929. [Google Scholar] [CrossRef] [PubMed] [Green Version]
- Yuan, Z.W.; Yang, L.H.; Zhang, X.S.; Ji, P.; Hua, Y.L.; Wei, Y.M. Mechanism of Huang-lian-Jie-du decoction and its effective fraction in alleviating acute ulcerative colitis in mice: Regulating arachidonic acid metabolism and glycerophospholipid metabolism. J. Ethnopharmacol. 2020, 259, 112872. [Google Scholar] [CrossRef] [PubMed]
- Zheng, Y.H.; You, X.R.; Guan, S.Y.; Huang, J.; Wang, L.Y.; Zhang, J.Y.; Wu, J. Poly (ferulic acid) with an anticancer effect as a drug nanocarrier for enhanced colon cancer therapy. Adv. Funct. Mater. 2019, 29, 1808646. [Google Scholar] [CrossRef]
- Kim, K.S.; Rhee, H.I.; Park, E.K.; Jung, K.; Jeon, H.J.; Kim, J.H.; Yoo, H.; Han, C.K.; Cho, Y.B.; Ryu, C.J.; et al. Anti-inflammatory effects of Radix Gentianae Macrophyllae (Qinjiao), Rhizoma Coptidis (Huanglian) and Citri Unshiu Pericarpium (Wenzhou migan) in animal models. Chin. Med. 2008, 3, 1–7. [Google Scholar] [CrossRef] [Green Version]
- Meng, F.C.; Wu, Z.F.; Yin, Z.Q.; Lin, L.G.; Wang, R.; Zhang, Q.W. Coptidis rhizoma and its main bioactive components: Recent advances in chemical investigation, quality evaluation and pharmacological activity. Chin. Med. 2018, 13, 1–18. [Google Scholar] [CrossRef]
- Kang, O.H.; Chae, H.S.; Oh, Y.C.; Choi, J.G.; Lee, Y.S.; Jang, H.J.; Kim, J.H.; Kim, Y.C.; Sohn, D.H.; Park, H.; et al. Anti-nociceptive and anti-inflammatory effects of Angelicae dahuricae radix through inhibition of the expression of inducible nitric oxide synthase and NO production. Am. J. Chin. Med. 2008, 36, 913–928. [Google Scholar] [CrossRef] [PubMed]
- Liao, H.F.; Ye, J.; Gao, L.L.; Liu, Y.L. The main bioactive compounds of Scutellaria baicalensis Georgi. for alleviation of inflammatory cytokines: A comprehensive review. Biomed. Pharmacother. 2021, 133, 110917. [Google Scholar] [CrossRef] [PubMed]
- Lu, Y.J.; Joerger, R.; Wu, C.Q. Study of the chemical composition and antimicrobial activities of ethanolic extracts from roots of Scutellaria baicalensis Georgi. J. Agric. Food Chem. 2011, 59, 10934–10942. [Google Scholar] [CrossRef] [PubMed]
- Qian, W.; Zhang, J.; Wang, W.; Wang, T.; Liu, M.; Yang, M.; Sun, Z.; Li, X.; Li, Y. Antimicrobial and antibiofilm activities of paeoniflorin against carbapenem-resistant Klebsiella pneumoniae. J. Appl. Microbiol. 2020, 128, 401–413. [Google Scholar] [CrossRef]
- Lin, S.J.; Chen, C.S.; Lin, S.S.; Chou, M.Y.; Shih, H.C.; Lee, I.P.; Kao, C.T.; Ho, C.C.; Chen, F.L.; Ho, Y.C.; et al. In vitro anti-microbial and in vivo cytokine modulating effects of different prepared Chinese herbal medicines. Food Chem. Toxicol. 2006, 44, 2078–2085. [Google Scholar] [CrossRef]
- Wang, H.; Chan, Y.L.; Li, T.L.; Wu, C.J. Improving cachectic symptoms and immune strength of tumour-bearing mice in chemotherapy by a combination of Scutellaria baicalensis and Qing-Shu-Yi-Qi-Tang. Eur. J. Cancer 2012, 48, 1074–1084. [Google Scholar] [CrossRef]
- Chen, Z.; Liu, W.M.; Qin, Z.G.; Liang, X.T.; Tian, G.R. Geniposide exhibits anticancer activity to medulloblastoma cells by downregulating microRNA-373. J. Biochem. Mol. Toxicol. 2020, 34, e22471. [Google Scholar]
- Ma, Z.; Otsuyama, K.; Liu, S.Q.; Abroun, S.; Ishikawa, H.; Tsuyama, N.; Obata, M.; Li, F.J.; Zheng, X.; Maki, Y.; et al. Baicalein, a component of Scutellaria radix from Huang-Lian-Jie-Du-Tang (HLJDT), leads to suppression of proliferation and induction of apoptosis in human myeloma cells. Blood 2005, 105, 3312–3318. [Google Scholar] [CrossRef] [Green Version]
- Koda, A.; Ono, Y.; Nishiyori, T.; Nagai, H.; Matsuura, N.; Mase, A.; Matsuyama, T. Immunopharmacological studies of Wen-Qing-Yin, a chinese blended medicine: Effects of type IV allergic reactions and humoral antibody production. Int. J. Immunopharmacol. 1987, 9, 289–295. [Google Scholar] [CrossRef]
- Zheng, Z.J.; Zhao, X.E.; Zhu, S.Y.; Dang, J.; Qiao, X.G.; Qiu, Z.C.; Tao, Y.D. Simultaneous determination of oleanolic acid and ursolic acid by in vivo microdialysis via UHPLC-MS/MS using magnetic dispersive solid phase extraction coupling with microwave-assisted derivatization and its application to a pharmacokinetic study of Arctiumlappa L. root extract in rats. J. Agric. Food Chem. 2018, 66, 3975–3982. [Google Scholar]
- Liu, Y.K.; Zhou, W.; Mao, Z.K.; Liao, X.Y.; Chen, Z.L. Analysis of six active components in Radix tinosporae by nonaqueous capillary electrophoresis with mass spectrometry. J. Sep. Sci. 2017, 40, 4628–4635. [Google Scholar] [CrossRef] [PubMed]
- Zhang, Y.; Zou, Z.Z.; Chou, G.X. Fast simultaneous detection of three diterpenoids in Herba Siegesbeckiae using solid phase extraction followed by HPLC-UV with a core-shell particle column. Anal. Methods 2018, 10, 1325–1330. [Google Scholar] [CrossRef]
- Li, Y.Y.; Guo, M.Q.; Li, X.M.; Yang, X.W. Simultaneous qualitative and quantitative evaluation of the Coptidis Rhizoma and Euodiae Fructus herbal pair by using UHPLC-ESI-QTOF-MS and UHPLC-DAD. Molecules 2020, 25, 4782. [Google Scholar] [CrossRef]
- Fu, S.; Cheng, R.R.; Xiang, Z.L.; Deng, Z.X.; Liu, T.G. Rapid profiling of chemical constituents in Qingfei Paidu granules using high performance liquid chromatography coupled with Q exactive mass spectrometry. Chromatographia 2021, 84, 1035–1048. [Google Scholar] [CrossRef]
- Committee, N.P. Pharmacopoeia of the People’s Republic of China 2020; China Medical Science Press: Beijing, China, 2020. [Google Scholar]
- Zhang, W.S.; Cui, N.; Su, F.Z.; Wang, Y.Y.; Yang, B.Y.; Sun, Y.P.; Guan, W.; Kuang, H.X.; Wang, Q.H. Comprehensive Metabolomics and Network Pharmacology to Explore the Mechanism of 5-Hydroxymethyl Furfural in the Treatment of Blood Deficiency Syndrome. Front. Pharmacol. 2022, 12, 811331. [Google Scholar] [CrossRef] [PubMed]
- Huang, T.; Liu, Y.A.; Zhang, C.L. Pharmacokinetics and Bioavailability Enhancement of Baicalin: A Review. Eur J. Drug Metab. Pharmacokinet. 2019, 44, 159–168. [Google Scholar] [CrossRef] [PubMed]
- Wang, J.; Yuan, Z.; Zhao, H.P.; Ju, D.H.; Chen, Y.J.; Chen, X.Y.; Zhang, J.P. Ferulic acid promotes endothelial cells proliferation through up-regulating cyclin D1 and VEGF. J. Ethnopharmacol. 2011, 137, 992–997. [Google Scholar] [CrossRef] [PubMed]
- Jiao, F.; Varghese, K.; Wang, S.; Liu, Y.; Yu, H.; Booz, G.W.; Roman, R.J.; Liu, R.; Fan, F. Recent Insights Into the Protective Mechanisms of Paeoniflorin in Neurological, Cardiovascular, and Renal Diseases. J. Cardiovasc. Pharmacol. 2021, 77, 728–734. [Google Scholar] [CrossRef]
- Yeh, C.C.; Huang, S.S.; Liu, P.Y.; Wang, B.C.; Tsai, C.F.; Wang, D.Y.; Cheng, H.F. Simultaneous quantification of six indicator compounds in Wen-Qing-Yin by high-performance liquid chromatography-diode array detection. J. Food Drug Anal. 2019, 27, 749–757. [Google Scholar] [CrossRef] [Green Version]
- Chang, Y.X.; Ge, A.H.; Yu, X.A.; Jiao, X.C.; Li, J.; He, J.; Tian, J.; Liu, W.; Azietaku, J.T.; Zhang, B.L.; et al. Simultaneous determination of four phenolic acids and seven alkaloids in rat plasma after oral administration of traditional Chinese medicinal preparation Jinqi Jiangtang Tablet by LC-ESI–MS/MS. J. Pharm. Biomed. Anal. 2016, 117, 1–10. [Google Scholar] [CrossRef]
- Wu, H.L.; Nie, J.F.; Yu, Y.J.; Yu, R.Q. Multi-way chemometric methodologies and applications: A central summary of our research work. Anal. Chim. Acta 2009, 650, 131–142. [Google Scholar] [CrossRef] [PubMed]
- Wu, H.L.; Shibukawa, M.; Oguma, K. An alternating trilinear decomposition algorithm with application to calibration of HPLC–DAD for simultaneous determination of overlapped chlorinated aromatic hydrocarbons. J. Chemom. 1998, 12, 1–26. [Google Scholar] [CrossRef]
- Zhang, Y.; Wu, H.L.; Xia, A.L.; Hu, L.H.; Zou, H.F.; Yu, R.Q. Trilinear decomposition method applied to removal of three-dimensional background drift in comprehensive two-dimensional separation data. J. Chromatogr. A 2007, 1167, 178–183. [Google Scholar] [CrossRef] [PubMed]
- Wang, T.; Wu, H.L.; Yu, Y.J.; Long, W.J.; Cheng, L.; Chen, A.Q.; Yu, R.Q. A simple method for direct modeling of second-order liquid chromatographic data with retention time shifts and holding the second-order advantage. J. Chromatogr. A 2019, 1605, 360360. [Google Scholar] [CrossRef] [PubMed]
- Olivieri, A.C. Analytical figures of merit: From univariate to multiway calibration. Chem. Rev. 2014, 114, 5358–5378. [Google Scholar] [CrossRef]
Publisher’s Note: MDPI stays neutral with regard to jurisdictional claims in published maps and institutional affiliations. |
© 2022 by the authors. Licensee MDPI, Basel, Switzerland. This article is an open access article distributed under the terms and conditions of the Creative Commons Attribution (CC BY) license (https://creativecommons.org/licenses/by/4.0/).


