Abstract
Sugarcane bagasse is an abundant biomass waste and a promising carbon source for preparing carbon-based materials such as carbon quantum dots (CQDs). Low quantum yield is a major problem for sugarcane bagasse-based carbon quantum dots. Heteroatom-doped modification is an efficient approach to improve the quantum yield. A facile hydrothermal carbonization method was applied to synthesize the nitrogen-doped carbon quantum dot N-CQDs using urea as the nitrogen source. The synthetic procedure was determined by the single-factor experiments and the response surface methodology (RSM) based on Box–Behnken design (BBD). The optical properties of optimized N-CQD-13 were more excellent than those of undoped CQD. Higher quantum yields (both absolute and relative) were observed in N-CQD-13. Additionally, N-CQD-13 exhibited high stability for long-time storage and excellent pH tolerance in aqueous solutions. N-CQD-13 were applied to detect Fe3+ in aqueous solutions with a low detection limit of 0.44 μM. The fluorescence lifetime decay of the N-CQD-13 solutions untreated and treated with Fe3+ indicated the probable involvement of a dynamic fluorescence-quenching mechanism. Thus, this work explored a reliable method for the high-quality utilization of bagasse.
1. Introduction
Sugarcane bagasse is a major by-product of the sugarcane-related industry. However, most sugarcane bagasse is abandoned as biomass waste in global areas, such as China [1], Brazil [2], and India [3]. This waste can easily cause environmental issues and a deterioration of resources [4]. Converting waste sugarcane bagasse to new classes of nanomaterials is a promising way of high-quality bagasse utilization. Sugarcane bagasse consists of abundant lignocellulosic materials like cellulose (38%), hemicellulose (28%), and lignin (18%) [5]. Such components make sugarcane bagasse excellent carbon sources for carbon-based materials, such as biochar [6], nanocrystal [7], graphene [8], carbon quantum dots (CQDs) [9], etc.
CQDs are spherical- or quasi-spherical-shaped carbon-based nanomaterials with sizes less than 10 nm, which have advantages including aqueous solubility, low toxicity, high stability, and facile modification, exhibiting excellent application potential in energy conversion [10], fluorescence sensing [11,12,13], and drug delivery [14]. Different carbon sources including small organic molecular materials [15,16], biomolecules [17], inorganic carbon materials [18], and biomass [19] have been applied in preparing the CQDs. With the advantages of being sustainable, low-costing, and easily doping, biomass drew extensive attention for use in CQD preparations [9]. Nevertheless, the main problem of biomass-based CQDs is that their fluorescence properties are not satisfying, such as low quantum yields (QYs, Φf), which would severely limit their applications. Many methods, such as surface modification, functionalization, and different heteroatom doping [20], have been developed to improve the QY of biomass-based CQDs.
The nitrogen-doped modification was proven as an efficient method to enhance the fluorescence properties of CQDs. By the nitrogen-doped modification, nitrogen atoms were incorporated into the sp2 hybridized carbon framework causing large-scale conjugated structure destruction and more surface defects, which would change the energy bandgap to improve the fluorescence intensity and QY [21,22]. Nitrogen sources were essential in preparing nitrogen-doped CQDs (N-CQDs). These nitrogen sources mainly originate from additional nitrogen-containing compounds, such as ammonia [23], ethylenediamine [24], amino acid [25], and urea [26]. In the past few decades, different methods were developed to prepare N-CQDs [27]. Some researchers have prepared N-CQDs using complicated methods such as laser ablation [28] or arc discharge [29], thereby limiting their practical application [30]. As a new green synthetic procedure, hydrothermal carbonization is environmentally friendly, of easy operation and mild, and is widely used in N-CQD preparation [31,32,33]. Similar to other biomass-based CQDs, bagasse-based N-CQDs are still limited by their poor fluorescence properties [21]. Hence, more efficient nitrogen-doped hydrothermal methods should be developed to achieve better fluorescence properties of bagasse-based N-CQDs.
Iron is a vital element for living organisms and the environment [34,35]. Fe3+ is one of the most abundant micronutrients, and plays an essential role in many life processes. However, excess Fe3+ might induce severe diseases [36] or environmental pollution [37]. Therefore, developing a reliable and efficient method for Fe3+ detection is significant for human health and environmental protection. Up to now, many Fe3+ detection methods, such as atomic absorption spectrometry (AAS), and inductively coupled plasma mass spectrometry (ICP-MS), have been developed [38]. However, these methods require skillful users [39] and face the problems like lacking sensitivity [40]. Many N-CQDs-based nanosensors for Fe3+ detection have been developed in the past few years [23,24,25,41,42,43,44,45,46,47] As the comparison shows in Table 1, most of the reported hydrothermal-prepared biomass-based N-CQD sensors faced the problem of a narrow linear range of detection concentration and high LOD. Hence, more wide-range and sensitive N-CQDs should be developed to meet the demand for Fe3+ detection.

Table 1.
Comparison of some reported hydrothermal-prepared biomass-based nitrogen-doped CQDs for detecting Fe3+ ions.
In this work, sugarcane bagasse was used as a precursor carbon source to synthesize two different carbon dots (CQDs and N-CQDs) using a mild hydrothermal carbonization method. Additionally, urea was used as the nitrogen source for preparing N-CQDs, expecting an improvement in the QY against the CQDs by the nitrogen-doped modification. The single-factor experiments and the response surface methodology (RSM) based on the Box–Behnken design (BBD) experiments were performed to optimize the preparation conditions to yield the optimal N-CQD-13. The N-CQD-13 exhibited excitation-dependent properties with a relative QY of 12.2%. N-CQD-13 was sensitive in detecting ferric ions in aqueous solutions with a low detection limit of 0.44 μM, probably involving a dynamic quenching mechanism.
2. Materials and Methods
2.1. Materials
The raw material of sugarcane bagasse was purchased from a local sugar factory in Guangxi, China. Chemical reagents were analytical grade (AR). Urea and different metal salts (MnCl2, FeCl2, BaCl2, KCl, NaCl, Cd(NO3)3, Cu(NO3)2, Hg(NO3)2, and Ni(NO3)2) were procured from Sinopharm Chemical Reagent Co., Ltd., Shanghai, China. AlCl3 and SnCl2 were obtained from Tianjin Damao Chemical Reagent Co., Ltd., Tianjin, China. Fe2(SO4)3 was purchased from Shanghai Epee Chemical Reagent Co., Ltd., Shanghai, China. Pb(NO3)2 was ordered from Xilong Chemical Co., Ltd. Guangzhou, China. Water was ultrapure unless otherwise mentioned in the experiments.
2.2. Methods
2.2.1. Preparation of CQDs and N-CQDs
CQD and N-CQDs were synthesized using a procedure similar to a previous report [48].
Sugarcane bagasse pretreatment: The sugarcane bagasse was thoroughly washed with water and dried at 70 °C in a blowing-type drying oven for 24 h. The dried bagasse was crushed into powder by a traditional Chinese medicine crusher and passed through a 100-mesh standard sieve. The fine bagasse powder was stored in a dryer for standby.
For N-CQD preparation, pretreated bagasse powder (1 g) and a certain addition of urea dosage (0–1.0 g) were dispersed with 30 mL distilled water in a 50 mL polytetrafluoroethylene-lined reactor. Then the mixture reacted at a certain temperature (180–260 °C) in the muffle furnace for a certain reaction time (2–10 h). After cooling down to room temperature, the reaction solution was ultrasonicated for 30 min and then centrifuged for 10 min at 8000 rpm. The supernatant was collected by passing through the 0.22 μM mixed fiber microporous membrane. The filtrate was dialyzed in distilled water for 12 h with a 500 D dialysis bag. The dialysate was collected and freeze-dried to yield the target nitrogen-doped carbon quantum dots (N-CQDs) as a dark powder.
For CQD preparation, a similar preparation procedure as N-CQDs was applied. Pretreated bagasse powder (1 g) was dispersed with 30 mL distilled water in a 50 mL polytetrafluoroethylene-lined reactor. The reaction solution was heated to 220 °C in a muffle furnace for 4 h. The post-treatments were the same as those for N-CQDs. Carbon quantum dots (N-CQDs) were obtained after being freeze-dried as a dark powder.
2.2.2. Single-Factor Experiments
The reaction temperature, time, and urea dosage were chosen as the three independent variables for optimizing the preparation conditions of N-CQDs. In the experiments, two factors were kept constant while the third one was changed. The detailed reaction information is shown in Table 2.
Table 2.
Design of single-factor experiments for N-CQD preparation conditions.
2.2.3. Response Surface Methodology (RSM) Design
The RSM was based on the Box–Behnken statistical experimental design for optimizing the preparation conditions of N-CQDs. Three independent factors A, B, and C were designed at three different levels coded as –1, 0, and +1 (Table 3). The factors were set as follows: the temperature was A (°C), the time was B (h), and urea dosage was C (g). The relative fluorescence intensity (a. u.) was the response for evaluating whether the condition was good or not.
Table 3.
Box–Behnken experimental factors and levels design for optimizing preparation conditions of N-CQDs.
2.2.4. Characterization
Atomic force microscopy (AFM) was performed using a MultiMode8 Atomic Force Microscope (Bruker Corporation, Billerica, MA, USA). The TEM was collected using a JEM-2100plus transmission electron microscope (JEOL Ltd., Tokyo, Japan). XRD was studied using a MiniFlex600 X-ray powder diffractometer (Rigaku Corporation, Tokyo, Japan). The scanning speed was 8.0 °/min, the step width was 0.02°, the voltage was 40 kV, the current was 15 mA, and the scanning angle was 2θ = 5–50°. FT-IR spectra were obtained from a MAGNA-IR550 infrared spectrometer (Thermo Fisher Scientific, Waltham, MA, USA) from 500–4000 cm−1. The UV-2600 UV-Visible spectrophotometer (Shimadzu Corporation, Tokyo, Japan) was used to measure the absorption spectra. The fluorescence excitation and emission spectra were collected on an F-7000 fluorescence spectrophotometer (Hitachi High-Tech Corporation, Tokyo, Japan). In general, the fluorescence spectra of N-CQDs were collected at the following excitation condition unless mentioned otherwise: excitation wavelength λex = 330 nm, emission intensities were obtained at λem = 417 nm, slits: ex/em = 5 nm/5 nm, voltage: 400 V. Absolute fluorescence quantum yields and lifetime were collected on an FLS1000 steady-state/transient fluorescence spectrophotometer (Edinburgh Instruments, Livingston, UK).
2.2.5. Optical Properties
The UV-Vis absorption spectra of the CQD (80 mg/L) and N-CQD (80 mg/L) solutions were collected in the range of 200–600 nm. In the emission spectra experiments, general excitation conditions were maintained: λex = 330 nm, voltage 400 V, and excitation/emission slits = 5 nm/5 nm. In the excitation-dependent experiments, excitation wavelengths ranged from 300 to 400 nm, and the intensities were collected at λem = 417 nm.
2.2.6. Fluorescence Quantum Yield and Lifetime
- (1)
- Absolute quantum yield and fluorescence lifetime
The absolute QY(ΦfA) was measured on the steady-state/transient fluorescence spectrometer at λex = 330 nm and the emission intensities were collected at λem = 417 nm using the integrating sphere. The fluorescence lifetime was collected at λex = 344 nm and λem = 417 nm, and calculated according to Formula (1):
where τ represents the fluorescence lifetime; Bi (i = 1, 2) and τi (i = 1, 2) are obtained by a nonlinear second-order fitting using Formula (2):
where I represents the intensity (a. u.); I0 is the maximum intensity; Bi indicates the amplitude (a. u., i = 1, 2); τi is the decay time (ns, i = 1, 2).
I = I0 + B1 ∗ exp(−x/τ1) + B2 ∗ exp(−x/τ2),
- (2)
- Relative quantum yield
The relative QYs (ΦfR) of CQD and N-CQD-13 solutions were calculated using quinine sulfate solution (55% quantum yield under 330 nm excitation, η = 1.33) as the standard reference from Formula (3):
where S represents the testing solution and R represents the quinine sulfate standard solution, respectively. Y indicates the quantum yield. I is the intensity integral of the emission spectrum. A is the absorbance at 360 nm; η is the refractive index.
2.2.7. Sensing of Fe3+ in Aqueous Solution
- (1)
- Titration of Fe3+ to N-CQD-13 and detection limit:
Equal volume mixtures of 4 mL Fe3+ aqueous solution (concentrations ranging from 20 to 2000 μM) and 4 mL N-CQD-13 aqueous solution (160 mg/L) yielded the final testing mixture solution containing 10–1000 μM Fe3+ and 80 mg/L of N-CQD-13, and emission spectra were collected. F0 and F represent the emission intensities of N-CQD-13 solutions untreated and treated with Fe3+. The Stern–Volmer plot was based on the ratio F0/F and the concentration of Fe3+.
The detection limit (LOD) was calculated using Formula (4):
where σ represents the standard deviation of the emission intensities of N-CQD-13 (80 mg/L) solution at λem = 417 nm for detecting 20 times [49]. S is the slope of the linear regression equation in the Stern–Volmer plot.
LOD = 3σ/S,
- (2)
- Selectivity
Different metal ions stock solutions (1 mM) were prepared from the corresponding salts as: Pb(NO3)2, MnCl2, FeCl2, BaCl2, KCl, NaCl, SnCl2, AlCl3, Ni(NO3)2, Cd(NO3)3, Cu(NO3)2, FeCl2, Hg(NO3)2, and Fe2(SO4)3. Stock solutions of different metal ions (Pb2+, Mn2+, Ba2+, K+, Na+, Sn2+, Al3+, Cd3+, Ni2+, Cu2+, Fe2+, Hg2+, and Fe3+, 1 mM) were mixed with 160 mg/L N-CQD-13 solutions in equal volume to obtain the respective mixture solutions. The emission spectra of mixture solutions were then collected.
- (3)
- pH tolerance
Solutions of different pH values ranging from 1 to 13 were adjusted by acidizing (with concentrated HCl solution) and alkalizing (with concentrated NaOH solution) PBS solutions. The emission spectra of the N-CQD-13 (80 mg/L) solutions at different pH values were tested and the intensities were collected at λem = 417.
- (4)
- Long-time storage of N-CQD-13 solution
The N-CQD-13 (80 mg/L) in PBS (pH = 7.40, 10 mM) solution was prepared and stored at ambient temperature over time under the light. The emission intensities at λem = 417 nm were collected at different time points (0, 2, 4, 6, 12, 24, 36, 48, 60, 72, 96, 120, 144, 168, 192, and 216 h).
3. Results and Discussion
3.1. Single-Factor Experimental Analysis
To obtain an optimal synthetic method for the N-CQD preparation, different conditions were evaluated in the hydrothermal synthesis experiments. Three parameters, reaction temperature (A), time (B), and urea dosage (C), were investigated by setting two parameters as constants while changing the third one. When the reaction temperature (A) ranged from 180 to 220 °C (B = 4 h, C = 0.2 g, Figure 1a), the intensities of the N-CQD solutions enhanced gradually until 220 °C and then decreased as the temperature increased. We supposed that the higher temperature probably promoted the degree of aggregation, thereby slightly quenching the fluorescence. At this point, 220 °C was selected as the optimal reaction temperature. The reaction time (ranging from 2 to 10 h, A = 220 °C, and C = 0.2 g) and urea dosage (ranging from 0.2 to 10 h, A = 220 °C, and B = 4 h) were investigated by similar treatments of temperature experiments. The optimal reaction time and urea dosage were identified as 4 h and 0.4 g, respectively. In brief, the optimal synthetic conditions obtained from the single-factor experiments were: the reaction temperature of 220 °C, the reaction time of 4 h, and the urea dosage of 0.4 g.
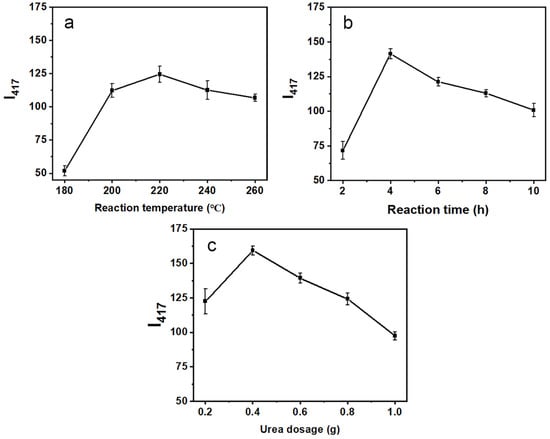
Figure 1.
Variations in the emission intensities at 417 nm of the N-CQD solutions (80 mg/L) under different reaction temperatures (a) 2–10 h, reaction times (b) 180–260 °C, and urea dosages (c) 0.2–0.6 g.
3.2. BBD and RSM Analysis
The combined effect on the emission intensities of the N-CQD (80 mg/L) solutions was investigated using the three independent BBD factors of different synthetic conditions, including temperature (A: 200, 220, and 240 °C), time (B: 2, 4, and 6 h), and urea dosage (C: 0.2, 0.4, and 0.6 g) at three levels (Table 3) according to the results of the single-factor experiments. Emission intensity at λem = 417 nm (I417) was the response. Different combinations of three factors were performed in the experiments (Table 4).
Table 4.
Coded and uncoded BBD of N-CQD preparation conditions.
The reliability and accuracy of the model were further evaluated by the analysis of variance (ANOVA). As shown in Table 5, the p-values of the interaction models were below 0.0001, indicating that the model could perform well in the emission intensity prediction of the N-CQD solutions. The F-value (0.79) and p-value (0.5592) of the model indicated that the lack of fit was insignificant owing to the relative pure error. On the other hand, the determination R-squared (R2) of the quadratic regression model was 0.9951, implying that the model could be used to explain 99.51% of the variability. The adjusted R-squared (R2a) of 0.9888 was high and close to R2, indicating that the model was significant and had a good fitness to the experimental data [50]. Moreover, the model had high precision and reliability due to the low coefficient of variance (CV) (2.29%) [51].
Table 5.
ANOVA of the regression model for the emission intensities prediction of N-CQD preparation.
According to the RSM model, a second-order polynomial equation was obtained by Design Expert 8.0.6.1 (Formula (5)). As shown in the equation, the coefficient of A, B, and C were 5.64, 3.25, and 2.34, respectively, indicating that the effects on the intensity could be in the order of A > B > C. In other words, the influence of temperature was the most affected among the three factors [52]. The contour plot and 3D response surface between the three factors and the response are shown in Figure 2. In the contour plot, the more elliptical trend shapes indicated a stronger interaction between the two factors [53]. Therefore, an order for the degree of the interaction strength between A, B, and C was obtained as AC > AB > BC.
Y = 163.22 + 5.64A + 3.25B + 2.34C − 5.50AB + 10.43AC + 3.10BC − 25.65A2 − 22.97B2 − 32.85C2
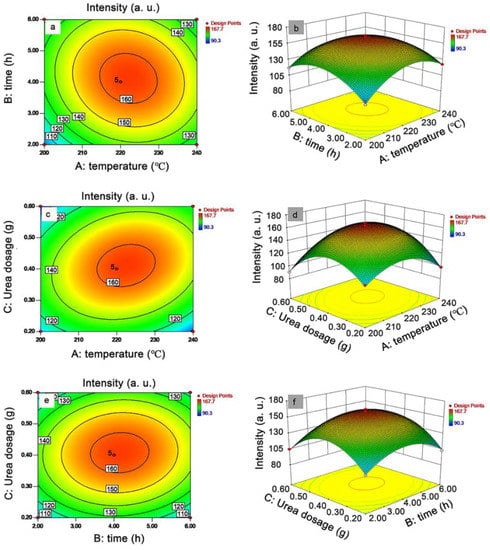
Figure 2.
Contour plot and 3D response surface between each factor (A = temperature, B = time, C = urea dosage) and the intensity at 417 nm of the N-CQD solutions: contour plot and 3D response surface between A and B (a,b), A and C (c,d), B and C (e,f).
The optimal solutions obtained by the Design Expert software were: temperature = 217.75 °C, time = 4.17 h, and urea dosage = 0.40 g. Considering the actual operation effects, the conditions were adjusted as temperature = 220 °C, time = 4 h, and urea dosage = 0.4 g. Replication experiments of N-CQD preparation were performed by using the adjusted conditions three times (Table 6). The average intensity of the three times of replication experiments was 162.5, while the predictive intensity of the model was 163.7. The error of the actual and predictive intensity was calculated as 0.73%. Such a slight error indicated that the model was reliable in intensity predicting. Notably, the N-CQD-13 was prepared by these adjusted optimal conditions (Table 4). Hence, N-CQD-13 was selected as the optimized N-CQD in the following experiments.
Table 6.
Replication experiments of actual and predictive intensities of N-CQD preparation.
3.3. Characterizations
With CQD prepared by the optimal conditions and N-CQD-13 in hand, the surface morphology and spectroscopic properties were studied initially. The surface morphology of the CQD (Figure 3a) and N-CQD-13 (Figure 3b) were characterized by AFM. The smaller size was observed in the N-CQD-13 (around 1.5 nm in height) than in the CQD (about 2 nm in height). TEM experiment results (Figure 3c,d) showed that the diameter of N-CQD-13 was 3.33 ± 0.63 nm. The X-ray diffraction (XRD) patterns of CQD and N-CQD-13 showed broad-band diffraction peaks at 2θ = 22° for CQD and 2θ = 20° for N-CQD-13, respectively (Figure 3e), indicating the amorphous carbon phase of the CQD and N-CQD-13 [48]. Fourier Transform Infrared spectra (FT-IR) were performed to investigate the functional groups on the surface of the CQD and N-CQD-13 (Figure 3f). In the IR spectra, the broad-band peak at 3410 cm−1 was associated with the O-H stretching vibration. Moreover, a new peak related to the N-H stretching vibration appeared at 3212 cm−1 in N-CQD-13 [54]. The peak at 2950 cm−1 arose due to the C-H stretching vibration. The C=C stretching vibration peak was observed at 1597 cm−1 [55]. The C-N bending vibration peak was found at 1400 cm−1 [56]. The peak at 1045 cm−1 was from the C-O vibration [57]. All the peaks revealed that both CQD and N-CQD-13 were oxygen-rich, and the N-CQD-13 had been successfully doped with nitrogen elements. Together with nitrogen-doped modification, CQD and N-CQD-13 exhibited good hydrophilic properties and had the potential to interact with metal ions.
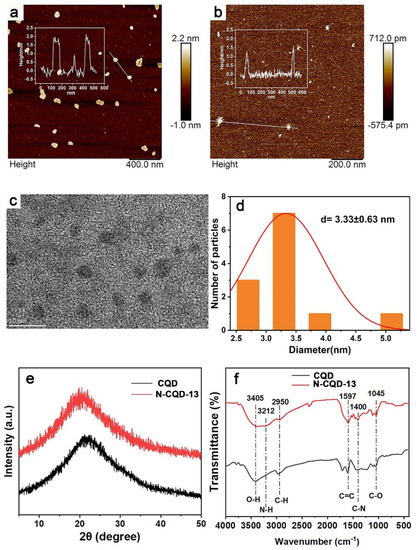
Figure 3.
AFM image of CQD (a) and N-CQD-13 (b). (Inserted with height statistics). TEM image (c) and size distribution (d) of N-CQDs-13. XRD patterns (e) and FT-IR spectra (f) of CQD and N-CQD-13.
3.4. Optical Properties
Subsequently, the UV-Vis absorption and fluorescence spectra (excitation and emission) of the CQD and N-CQD-13 solutions were studied (Figure 4 and Table 7) The maximum absorption wavelengths (λmax) of CQD and N-CQD-13 solutions were 268 nm, which could be associated with the π-π* transition in the sp2 domains of the aromatic structure [58]. A side peak at 305 nm was found as the n-π* transition of the C=O bond [59]. In the fluorescence spectra, the maximum excitation wavelength (λex) and emission wavelength (λem) of N-CQD-13 (λex = 330 nm, λem = 417 nm) exhibited a slightly hypochromatic shift compared to CQD (λex = 338 nm, λem = 428 nm). The general excitation wavelength λex = 330 nm and emission wavelength λem = 417 nm were chosen in the further experiments of N-CQD-13. The Stokes shifts of CQD and N-CQD-13 were 90 nm and 85 nm, respectively.
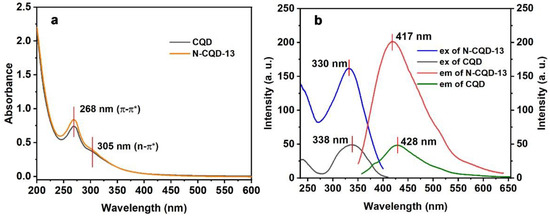
Figure 4.
UV-Vis absorption spectra (a) and fluorescence excitation and emission spectra (b) of CQD (80 mg/L) and N-CQD-13 (80 mg/L) in aqueous solutions.
Table 7.
Optical properties of CQD and N-CQD-13.
The fluorescence emission spectra of CQD and N-CQD-13 exhibited excitation-dependent behaviors (Figure 5, Table 8), which is general in fluorescent carbon materials [48]. When excited by various excitation wavelengths, the emission wavelengths displayed a bathochromic shift upon increasing the excitation wavelengths. For CQD, the intensity enhanced up to 340 nm and decreased at longer excitation wavelengths. A similar trend was found in N-CQD-13, which exhibited a maximum intensity at λex = 320 nm. Additionally, the emission intensity of N-CQD-13 was stronger than that of CQD when excited at the same excitation wavelength, revealing that the nitrogen-doped modification could enhance the optical property to some degree. Quantum yields of CQD and N-CQD-13 were also investigated (Table 6). The absolute and relative QY of N-CQD-13 were 1.69% and 12.2%, respectively, which were higher than CQD (0.53% for absolute QY and 2.56% for relative QY). Hence, N-CQD-13 was chosen as the more proper probe in further application studies.
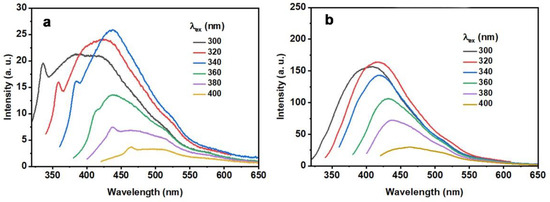
Figure 5.
Fluorescence emission and normalized fluorescence spectra of the CQD (a) 80 mg/L and N-CQD-13 (b) 80 mg/L collected at different excitation wavelengths ranging from 300 to 400 nm.
Table 8.
Maximum emission wavelengths (λem) and intensities of CQD and N-CQD-13 excited at different excitation wavelengths.
To confirm whether the intensity of N-CQD-13 was concentration-dependent, the emission intensities of different concentrations of N-CQD-13 aqueous solutions were investigated. As shown in Figure 6, the intensities enhanced along with the increment of concentrations of N-CQD-13 below 80 mg/L, and reached a plateau till the concentration of 160 mg/L. Intensities began to decrease when the concentrations were above 160 mg/L. At high concentrations, absorbers can absorb the excitation or emission light of fluorophores, inducing the inner filter effect (IFE) [60]. We suppose that when the concentration was above 80 mg/L, N-CQD-13 particles start to act as the absorbers, absorbing the excitation or emission light of other particles nearby, terminating the intensity enhancement [61]. With the further increase of concentrations, IFE enhances remarkably, leading to fluorescence quenching. Hence, 80 mg/L was used as the suitable concentration in further applications.
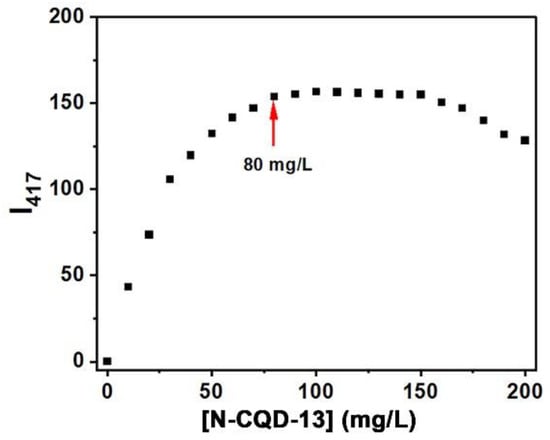
Figure 6.
Emission intensities at 417 nm of N-CQD-13 solutions in different concentrations (0–200 mg/L).
3.5. Stability of N-CQD-13 in Aqueous Solution
To verify the stability of N-CQD-13 in different conditions, the pH tolerance and long-time storage stability were studied. Intensities of N-CQD-13 solutions with different pH values ranging from 1 to 13 were investigated (Figure 7a). The I417 of N-CQD-13 was maintained at a stable level at pH values ranging from 2 to 12. Nevertheless, the reduction in the intensities at the extremely acidic (pH = 1) and alkaline (pH = 13) conditions might be due to an electron transition disruption by excess H+ or OH- [62]. Moreover, the intensity stability of N-CQD-13 for long-time storage was also studied. When the N-CQD-13 solution was placed at ambient temperature under the light for 30 h, the intensity decreased by about 10%. Even though the time was extended to 216 h, no significant change (less than 15% decrement) was observed as time progressed (Figure 7b). Therefore, the N-CQD-13 displayed excellent stability under different conditions.
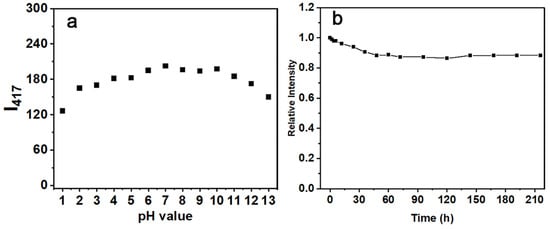
Figure 7.
(a) Fluorescence intensities at 417 nm of the N-CQD-13 solutions under different pH values (1–13). (b) Relative fluorescence intensities at 417 nm of the N-CQD-13 solutions at different time points (0–216 h).
3.6. Detection of Fe3+
The FT-IR results indicated the presence of many oxygen and nitrogen atoms in N-CQD-13. These atoms were excellent coordination centers for interacting with metal ions [63]. The intensity responses of N-CQD-13 to different metal ions were further studied (Figure 8). When treated with different kinds of metal ions (500 μM, including Pb2+, Mn2+, Ba2+, K+, Na+, Sn2+, Al3+, Cd3+, Ni2+, Cu2+, Fe2+, Hg2+, and Fe3+), no responses were observed in N-CQD-13 solutions except for Hg2+ and Fe3+. When N-CQD-13 (80 mg/L) was treated with Fe3+ (500 μM), a dramatic quenching of fluorescence emission intensity was observed. The intensity decrement caused by Hg2+ (40%) was slighter than that by Fe3+ (80%).
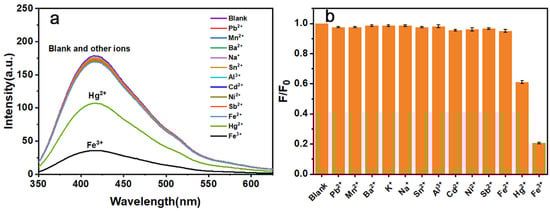
Figure 8.
Fluorescence emission spectra (a) and relative intensities at 417 nm (b) of N-CQD-13 treated with different metal ions (500 μM).
Together with the more significant fluorescence quenching phenomenon, further studies of the interaction between N-CQD-13 and Fe3+ were carried out. When dealing with different concentrations of Fe3+ (0–1000 μM), the emission intensity of the N-CQD-13 (80 mg/L) solutions decreased gradually with an increment in Fe3+ concentration (Figure 9a). Moreover, the Stern–Volmer plot between the concentrations of Fe3+ and the ratio F0/F (F0 and F represented the intensity at 417 nm of N-CQD-13 solutions untreated and treated with different concentrations of Fe3+) were plotted (Figure 9). The F0/F increased with the addition of Fe3+, exhibiting a good linear relationship with the concentration of Fe3+ ranging from 0 to 1000 μM with R2 = 0.99368 (Figure 9b). Under this condition, the detection limit calculated by the Formula (4) was 0.44 μM.
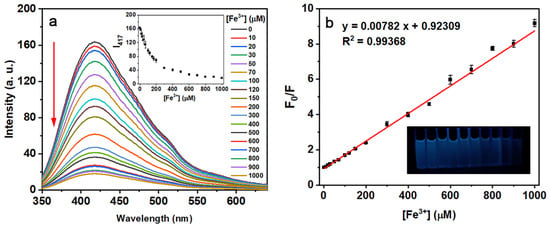
Figure 9.
(a) Fluorescence spectra of the N-CQD-13 (80 mg/L) solutions treated with different concentrations of Fe3+. (Inset: Intensity changes at 417 nm with the different concentrations of Fe3+). (b) The Stern–Volmer plot of adding different concentrations of Fe3+ (0–1000 μM) to the N-CQD-13 (80 mg/L) solutions.
3.7. Sensing Mechanism
In general, dynamic quenching (species interacting by molecular collision) and static quenching (species interacting by complexation and binding on the ground state) were used to explain the fluorescence intensity quenching phenomena [63]. A linear plot based on Stern–Volmer implied a dependent dynamic or static quenching [64]. However, the binding curves of the Stern–Volmer equation (F0/F vs. [Fe3+]) exhibited a good linear relation (R2 = 0.99368). Yet, it was challenging to identify whether the quenching mechanism was dynamic or static quenching, because both dynamic or static quenching progresses displayed a linear plot [64]. Fortunately, fluorescence lifetime was widely used in describing the type of quenching mechanism [57]. To clear the quenching mechanism, fluorescence lifetimes of the N-CQD-13 solutions before and after adding Fe3+ ions were studied (Figure 10a). According to Formula (2), the fluorescence lifetime of the N-CQD-13 solution without Fe3+ ion was 7.75 ns, while the fluorescence lifetime of the N-CQD-13 solution treated with Fe3+ ion was 7.19 ns. Fluorescence lifetime decay observed in N-CQD-13 between treated and untreated with Fe3+ possibly indicated a mainly dynamic quenching mechanism with a fast electron transfer process [65]. In the dynamic quenching process, the excited electrons of N-CQD-13 would transfer to the empty 3D orbits of Fe3+ through a nonradiative relaxation pathway of electron/hole recombination, blocking the transition of the electrons from the excited state to the ground state and inducing remarkable fluorescence quenching [66]. The probable interaction model for the quenching process is shown in Figure 10b.
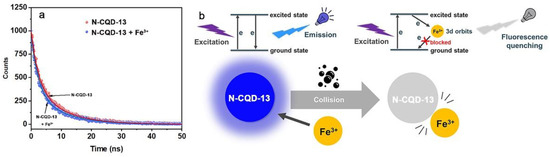
Figure 10.
(a) Fluorescence lifetime of N-CQD-13 (80 mg/L) solutions untreated (red) and treated (blue) with Fe3+ (500 μM). (b) The probable interaction model between N-CQD-13 and Fe3+.
4. Conclusions
In summary, sugarcane bagasse-based nitrogen-doped carbon quantum dots, N-CQDs, were prepared by using the hydrothermal carbonization method with urea as the nitrogen source. The single-factor experiments and Box–Behnken design-based response surface methodology experiments were used to optimize the synthetic conditions as a reaction temperature of 220 °C, a reaction time of 4 h, and a urea dosage of 0.4 g, respectively, yielding the optimal quantum dot N-CQD-13. N-CQD-13 was characterized by AFM, XRD, and FT-IR, exhibiting the successfully nitrogen-doped modification with a size of 1.5 nm. N-CQD-13 indicated a large Stokes shift around 87 nm and an intrinsic excitation wavelength-dependent property. The N-CQD-13 was stable and pH-tolerant in the aqueous solution, which ensured that N-CQD-13 can be applied in different conditions. A more obvious fluorescence emission intensity quenching was observed when the Fe3+ ion was added to the N-CQD-13 solution among different metal ions, and the detection limit was 0.44 μM. The probable quenching mechanism might be a mainly dynamic quenching process induced by the collision between the N-CQD-13 particles and Fe3+. These results indicated that N-CQD-13 can be a suitable material for Fe3+ detection applications and provide a reliable way for the high-quality utilization of bagasse.
Author Contributions
Conceptualization, S.S. and Y.L.; Data curation, S.S. and S.G.; Formal analysis, Q.Q.; Funding acquisition, Y.L. and M.L.; Investigation, S.S. and S.G.; Methodology, M.L.; Project administration, S.S.; Resources, M.L.; Software, S.S.; Supervision, Y.L. and M.L.; Validation, S.S., Y.L. and M.L.; Visualization, Y.L.; Writing—original draft, Y.L.; Writing—review and editing, Y.L., M.L. and F.D. All authors have read and agreed to the published version of the manuscript.
Funding
This research was funded by the scientific research project of Guangxi Natural Science Foundation, grant number AD20238036, Guangxi Biological Polysaccharide Separation, Purification and Modification Research Platform, grant number GKZY18076005, Guangxi Minzu University, grant number 2018MDYB003, Innovation Project of Guangxi Graduate Education, grant number YCSW2021155, and the National Natural Science Foundation of China, grant number 11904059.
Institutional Review Board Statement
Not applicable.
Informed Consent Statement
Not applicable.
Data Availability Statement
Not applicable.
Conflicts of Interest
The authors declare no conflict of interest.
References
- Fang, X.; Shen, Y.; Zhao, J.; Bao, X.; Qu, Y. Status and prospect of lignocellulosic bioethanol production in China. Bioresour. Technol. 2010, 101, 4814–4819. [Google Scholar] [CrossRef] [PubMed]
- Dantas, G.A.; Legey, L.F.L.; Mazzone, A. Energy from sugarcane bagasse in Brazil: An assessment of the productivity and cost of different technological routes. Renew. Sust. Energ. Rev. 2013, 21, 356–364. [Google Scholar] [CrossRef]
- Konde, K.S.; Nagarajan, S.; Kumar, V.; Patil, S.V.; Ranade, V.V. Sugarcane bagasse based biorefineries in India: Potential and challenges. Sustain. Energy Fuels 2021, 5, 52. [Google Scholar] [CrossRef]
- Boruah, A.; Saikia, M.; Das, T.; Goswamee, R.L.; Saikia, B.K. Blue-emitting Fluorescent Carbon Quantum Dots from Waste Biomass Sources and Their Application in Fluoride Ion Detection in Water. J. Photochem. Photobiol. B 2020, 209, 111940. [Google Scholar] [CrossRef] [PubMed]
- Guilherme, A.A.; Dantas, P.V.F.; Santos, E.S.; Fernandes, F.A.N.; Macedo, G.R. Evaluation of composition, characterization and enzymatic hydrolysis of pretreated sugar cane bagasse. Braz. J. Chem. Eng. 2015, 32, 23–33. [Google Scholar] [CrossRef]
- Bai, L.; Su, X.; Feng, J.; Ma, S. Preparation of sugarcane bagasse biochar/nano-iron oxide composite and mechanism of its Cr (VI) adsorption in water. J. Clean. Prod. 2021, 320, 128723. [Google Scholar] [CrossRef]
- Ferreira, F.V.; Mariano, M.; Rabelo, S.C.; Gouveia, R.F.; Lona, L.M.F. Isolation and surface modification of cellulose nanocrystals from sugarcane bagasse waste: From a micro- to a nano-scale view. Appl. Surf. Sci. 2018, 436, 1113–1122. [Google Scholar] [CrossRef]
- Long, S.Y.; Du, Q.S.; Wang, S.Q.; Tang, P.D.; Li, D.P.; Huang, R.B. Graphene two-dimensional crystal prepared from cellulose two-dimensional crystal hydrolysed from sustainable biomass sugarcane bagasse. J. Clean. Prod. 2019, 241, 118209. [Google Scholar] [CrossRef]
- Kang, C.; Huang, Y.; Yang, H.; Yan, X.F.; Chen, Z.P. A Review of Carbon Dots Produced from Biomass Wastes. Nanomaterials 2020, 10, 2316. [Google Scholar] [CrossRef]
- Luo, H.; Guo, Q.; Szilágyi, P.G.; Jorge, A.B.; Titirici, M.M. Carbon Dots in Solar-to-Hydrogen Conversion. Trends Chem. 2020, 2, 623–637. [Google Scholar] [CrossRef]
- Qian, Z.; Shan, X.; Chai, L.; Ma, J.; Chen, J.; Feng, H. Si-Doped Carbon Quantum Dots: A Facile and General Preparation Strategy, Bioimaging Application, and Multifunctional Sensor. ACS Appl. Mater. Interfaces 2014, 6, 6797–6805. [Google Scholar] [CrossRef]
- Liang, Z.; Kang, M.; Payne, G.F.; Wang, X.; Sun, R. Probing Energy and Electron Transfer Mechanisms in Fluorescence Quenching of Biomass Carbon Quantum Dots. ACS Appl. Mater. Interfaces 2016, 8, 17478–17488. [Google Scholar] [CrossRef]
- Hou, J.T.; Zhang, M.; Liu, Y.; Ma, X.; Duan, R.; Cao, X.; Yuan, F.; Liao, Y.X.; Wang, S.; Ren, W.X. Fluorescent detectors for hydroxyl radical and their applications in bioimaging: A review. Coordin. Chem. Rev. 2020, 421, 213457. [Google Scholar] [CrossRef]
- Hua, X.W.; Bao, Y.W.; Wu, F.G. Fluorescent Carbon Quantum Dots with Intrinsic Nucleolus-Targeting Capability for Nucleolus Imaging and Enhanced Cytosolic and Nuclear Drug Delivery. ACS Appl. Mater. Interfaces 2018, 10, 10664–10677. [Google Scholar] [CrossRef]
- Hagiwara, K.; Horikoshi, S.; Serpone, N. Photoluminescent Carbon Quantum Dots: Synthetic Approaches and Photophysical Properties. Chem. Eur. J. 2021, 27, 9466–9481. [Google Scholar] [CrossRef]
- Miao, X.; Qu, D.; Yang, D.; Nie, B.; Zhao, Y.; Fan, H.; Sun, Z. Synthesis of Carbon Dots with Multiple Color Emission by Controlled Graphitization and Surface Functionalization. Adv. Mater. 2018, 30, 1704740. [Google Scholar] [CrossRef]
- Liu, J.M.; Lin, L.P.; Wang, X.X.; Lin, S.Q.; Cai, W.L.; Zhang, L.H.; Zheng, Z.Y. Highly selective and sensitive detection of Cu2+ with lysine enhancing bovine serum albumin modified-carbon dots fluorescent probe. Analyst 2012, 137, 2637–2642. [Google Scholar] [CrossRef]
- Singh, A.; Mohapatra, P.K.; Kalyanasundaram, D.; Kumar, S. Self-functionalized ultrastable water suspension of luminescent carbon quantum dots. Mater. Chem. Phys. 2019, 225, 23–27. [Google Scholar] [CrossRef]
- Wareing, T.C.; Gentile, P.; Phan, A.N. Biomass-Based Carbon Dots: Current Development and Future Perspectives. ACS Nano 2021, 15, 15471–15501. [Google Scholar] [CrossRef]
- Qu, J.H.; Wei, Q.Y.; Sun, D.W. Carbon dots: Principles and their applications in food quality and safety detection. Crit. Rev. Food Sci. 2018, 58, 2466–2475. [Google Scholar] [CrossRef]
- Naik, V.M.; Bhosale, S.V.; Kolekar, G.B. A brief review on the synthesis, characterisation and analytical applications of nitrogen doped carbon dots. Anal. Methods 2022, 14, 877–891. [Google Scholar] [CrossRef]
- Denis, P.A.; Faccio, R.; Mombru, A.W. Is It Possible to Dope Single-Walled Carbon Nanotubes and Graphene with Sulfur? Chem. Phys. Chem. 2009, 10, 715. [Google Scholar] [CrossRef] [PubMed]
- Atchudan, R.; Edison, T.N.J.I.; Perumal, S.; Muthuchamy, N.; Lee, Y.R. Hydrophilic nitrogen-doped carbon dots from biowaste using dwarf banana peel for environmental and biological applications. Fuel 2020, 275, 117821. [Google Scholar] [CrossRef]
- Krishnaiah, P.; Atchudan, R.; Perumal, S.; Salama, E.S.; Lee, Y.R.; Jeon, B.H. Utilization of waste biomass of Poa pratensis for green synthesis of n-doped carbon dots and its application in detection of Mn2+ and Fe3+. Chemosphere 2022, 286, 131764. [Google Scholar] [CrossRef] [PubMed]
- Qi, H.; Min, T.; Miao, L.; Liu, S.; Li, J.; Yu, H.; Teng, C.; Huang, Z.; Liu, H.; Shao, Q.; et al. Biomass-Derived Nitrogen-doped Carbon Quantum Qots: Highly Selective Fluorescent Probe for Detecting Fe3+ Ions and Tetracyclines. J. Colloid Interf. Sci. 2019, 539, 332–341. [Google Scholar] [CrossRef] [PubMed]
- Shejale, K.P.; Jaiswal, A.; Kumar, A.; Saxena, S.; Shukla, S. Nitrogen doped carbon quantum dots as Co-active materials for highly efficient dye sensitized solar cells. Carbon 2021, 183, 169–175. [Google Scholar] [CrossRef]
- Park, Y.; Kim, Y.; Chang, H.; Won, S.; Kim, H.; Kwon, W. Biocompatible nitrogen-doped carbon dots: Synthesis, characterization, and application. J. Mater. Chem. B 2020, 8, 8935. [Google Scholar] [CrossRef]
- Kang, S.; Jeong, Y.K.; Ryu, J.H.; Son, Y.; Kim, W.R.; Lee, B.; Jung, K.H.; Kim, K.M. Pulsed laser ablation based synthetic route for nitrogen-doped graphene quantum dots using graphite flakes. Appl. Surf. Sci. 2020, 506, 144998. [Google Scholar] [CrossRef]
- Dey, S.; Govindaraj, A.; Biswas, K.; Rao, C.N.R. Luminescence properties of boron and nitrogen doped graphene quantum dots prepared from arc-discharge-generated doped graphene samples. Chem. Phys. Lett. 2014, 595–596, 203–208. [Google Scholar] [CrossRef]
- Feng, J.; Wang, W.J.; Hai, X.; Yu, Y.L.; Wang, J.H. Green preparation of nitrogen-doped carbon dots derived from silkworm chrysalis for cell imaging. J. Mater. Chem. B 2016, 4, 387. [Google Scholar] [CrossRef]
- Zhang, R.; Chen, W. Nitrogen-doped carbon quantum dots: Facile synthesis and application as a “turn-off” fluorescent probe for detection of Hg2+ ions. Biosens. Bioelectron. 2014, 55, 83–90. [Google Scholar] [CrossRef]
- Liu, Y.; Li, W.; Wu, P.; Liu, S. Preparation and Applications of Carbon Quantum Dots Prepared via Hydrothermal Carbonization Method. Prog. Chem. 2018, 30, 349–364. [Google Scholar]
- Mohapatra, S.; Bera, M.K.; Das, R.K. Rapid “turn-on” detection of atrazine using highly luminescent N-doped carbon quantum dot. Sens. Actuator B Chem. 2018, 263, 459–468. [Google Scholar] [CrossRef]
- Atchudan, R.; Kishore, S.C.; Edison, T.N.J.I.; Perumal, S.; Vinodh, R.; Sundramoorthy, A.K.; Babu, R.S.; Alagan, M.; Lee, Y.R. Highly Fluorescent Carbon Dots as a Potential Fluorescence Probe for Selective Sensing of Ferric Ions in Aqueous Solution. Chemosensors 2021, 9, 301. [Google Scholar] [CrossRef]
- Li, Z.; Hou, J.T.; Wang, S.; Zhu, L.; He, X.; Shen, J. Recent advances of luminescent sensors for iron and copper: Platforms, mechanisms, and bio-applications. Coordin. Chem. Rev. 2022, 469, 214695. [Google Scholar] [CrossRef]
- Xie, X.; Hua, X.; Wang, Z.; Yang, X.; Huang, H. Real-Time Imaging Redox Status in Biothiols and Ferric Metabolism of Cancer Cells in Ferroptosis Based on Switched Fluorescence Response of Gold Carbon Dots. Anal. Chem. 2020, 92, 11420–11428. [Google Scholar] [CrossRef]
- Luan, F.; Burgos, W.D. Sequential Extraction Method for Determination of Fe(II/III) and U(IV/VI) in Suspensions of Iron-Bearing Phyllosilicates and Uranium. Environ. Sci. Technol. 2012, 46, 11995–12002. [Google Scholar] [CrossRef]
- Wallace, K.J.; Johnson, A.D.G.; Jones, W.S.; Manandhar, E. Chemodosimeters and chemoreactands for sensing ferric ions. Supramol. Chem. 2018, 30, 353–383. [Google Scholar] [CrossRef]
- Omer, K.M.; Tofiq, D.I.; Hassan, A.Q. Solvothermal synthesis of phosphorus and nitrogen doped carbon quantum dots as a fluorescent probe for iron(III). Microchim. Acta 2018, 185, 466. [Google Scholar] [CrossRef]
- Lesani, P.; Singh, G.; Viray, C.M.; Ramaswamy, Y.; Zhu, D.M.; Kingshott, P.; Lu, Z.; Zreiqat, H. Two-Photon Dual-Emissive Carbon Dot-Based Probe: Deep-Tissue Imaging and Ultrasensitive Sensing of Intracellular Ferric Ions. ACS Appl. Mater. Interfaces 2020, 12, 18395–18406. [Google Scholar] [CrossRef]
- Li, R.; Gao, M.; Zhang, J.; Li, Z.; Chen, J.; Liu, P.; Wu, D. An ionic liquid promoted microwave-hydrothermal route towards highly photoluminescent carbon dots for sensitive and selective detection of iron(III). RSC Adv. 2015, 5, 24205–24209. [Google Scholar] [CrossRef]
- Liu, R.; Zhang, Y.; Piao, Y.; Meng, L.Y. Development of nitrogen-doped carbon quantum dots as fluorescent probes for highly selective and sensitive detection of the heavy-ion Fe3+. Carbon Lett. 2021, 31, 821–829. [Google Scholar] [CrossRef]
- Xu, L.; Fan, H.; Huang, L.; Xia, J.; Huang, J.; Li, M.; Ding, H.; Huang, K.; Li, S. Eosinophilic nitrogen-doped carbon dots derived from tribute chrysanthemum for label-free detection of Fe3+ ions and hydrazine. J. Taiwan Inst. Chem. Eng. 2017, 78, 247–253. [Google Scholar] [CrossRef]
- Ahn, J.; Song, Y.; Kwon, J.E.; Lee, S.H.; Park, K.S.; Kim, S.; Woo, J.; Kim, H. Food waste-driven N-doped carbon dots: Applications for Fe3+ sensing and cell imaging. Mater. Sci. Eng. C 2019, 102, 106–112. [Google Scholar] [CrossRef] [PubMed]
- Deng, X.; Feng, Y.; Li, H.; Du, Z.; Teng, Q.; Wang, H. N-doped carbon quantum dots as fluorescent probes for highly selective and sensitive detection of Fe3+ ions. Particuology 2018, 41, 94–100. [Google Scholar] [CrossRef]
- Šafranko, S.; Stankovic, A.; Hajra, S.; Kim, H.J.; Strelec, I.; Dutour-Sikiric, M.; Weber, I.; Bosnar, M.H.; Grbcic, P.; Pavelic, S.K.; et al. Preparation of Multifunctional N-Doped Carbon Quantum Dots from Citrus clementina Peel: Investigating Targeted Pharmacological Activities and the Potential Application for Fe3+ Sensing. Pharmaceuticals 2021, 14, 857. [Google Scholar] [CrossRef]
- Santonocito, R.; Intravaia, M.; Caruso, I.M.; Pappalardo, A.; Sfrazzetto, G.T.; Tuccitto, N. Fluorescence sensing by carbon nanoparticles. Nanoscale Adv. 2022, 4, 1926–1948. [Google Scholar] [CrossRef]
- Jing, S.; Zhao, Y.; Sun, R.C.; Zhong, L.; Peng, X. Facile and High-yield Synthesis of Carbon Quantum Dots from Biomass-derived Carbons at Mild Condition. ACS Sustain. Chem. Eng. 2019, 7, 7833–7843. [Google Scholar] [CrossRef]
- Das, D.; Dutta, R.K. N-Doped Carbon Dots Synthesized from Ethylene Glycol and β-Alanine for Detection of Cr(VI) and 4-Nitrophenol via Photoluminescence Quenching. ACS Appl. Nano Mater. 2021, 4, 3444–3454. [Google Scholar] [CrossRef]
- Yetilmezsoy, K.; Demirel, S.; Vanderbei, R.J. Response surface modeling of Pb (II) removal from aqueous solution by Pistacia vera L.: Box–Behnken experi-mental design. J. Hazard. Mater. 2009, 171, 551–562. [Google Scholar] [CrossRef]
- Prakash Maran, J.; Manikandan, S.; Thirugnanasambandham, K.; Vigna Nivetha, C.; Dinesh, R. Box–Behnken design based statistical modeling for ultrasound-assisted extraction of corn silk polysaccharide. Carbohyd. Polym. 2013, 92, 604–611. [Google Scholar] [CrossRef]
- Su, Q.; Deng, L.; Ye, Q.; He, Y.; Cui, X. KOH-Activated Geopolymer Microspheres Recycle Co(II) with Higher Adsorption Capacity than NaOH-Activated Ones. ACS Omega 2020, 5, 23898–23908. [Google Scholar] [CrossRef]
- Wei, X.; Xu, X.; Yang, X.; Li, J.; Liu, Z. Visible light degradation of reactive black-42 by novel Sr/Ag-TiO2@g-C3N4 photocatalyst: RSM optimization, reaction kinetics and pathways. Spectrochim. Acta A 2020, 228, 117870. [Google Scholar] [CrossRef]
- Tammina, S.K.; Yang, D.; Koppala, S.; Cheng, C.; Yang, Y. Highly photoluminescent N, P doped carbon quantum dots as a fluorescent sensor for the detection of dopamine and temperature. J. Photochem. Photobiol. B Biol. 2019, 194, 61–70. [Google Scholar] [CrossRef]
- Zhang, H.; Li, Y.; Liu, X.; Liu, P.; Wang, Y.; An, T.; Yang, H.; Jing, D.; Zhao, H. Determination of Iodide via Direct Fluorescence Quenching at Nitrogen-Doped Carbon Quantum Dot Fluorophores. Environ. Sci. Technol. Lett. 2014, 1, 87–91. [Google Scholar] [CrossRef]
- Zhang, H.; Chen, Y.; Liang, M.; Xu, L.; Qi, S.; Chen, H.; Chen, X. Solid-Phase Synthesis of Highly Fluorescent Nitrogen-Doped Carbon Dots for Sensitive and Selective Probing Ferric Ions in Living Cells. Anal. Chem. 2014, 86, 9846–9852. [Google Scholar] [CrossRef]
- Wu, P.; Li, W.; Wu, Q.; Liu, Y.; Liu, S. Hydrothermal synthesis of nitrogen-doped carbon quantum dots from microcrystalline cellulose for the detection of Fe3+ ions in an acidic environment. RSC Adv. 2017, 7, 44144–44153. [Google Scholar] [CrossRef]
- Alam, A.M.; Park, B.Y.; Ghouri, Z.K.; Park, M.; Kim, H.Y. Synthesis of carbon quantum dots from cabbage with down- and up-conversion photoluminescence properties: Excellent imaging agent for biomedical applications. Green Chem. 2015, 17, 3791–3797. [Google Scholar] [CrossRef]
- Yang, Q.; Duan, J.; Yang, W.; Li, X.; Mo, J.; Yang, P.; Tang, Q. Nitrogen-doped carbon quantum dots from biomass via simple one-pot method and exploration of their application. Appl. Surf. Sci. 2018, 434, 1079–1085. [Google Scholar] [CrossRef]
- Yu, D.; Zhang, X.; Qi, Y.; Ding, S.; Cao, S.; Zhu, A.; Shi, G. Pb2+-modified graphene quantum dots as a fluorescent probe for biological aminothiols mediated by an inner filter effect. Sens. Actuat. B Chem. 2016, 235, 394–400. [Google Scholar] [CrossRef]
- Mendonça, A.; Rocha, A.C.; Duarte, A.C.; Santos, E.B.H. The inner filter effects and their correction in fluorescence spectra of salt marsh humic matter. Anal. Chim. Acta 2013, 788, 99–107. [Google Scholar] [CrossRef] [PubMed]
- Cheng, C.; Xing, M.; Wu, Q. A universal facile synthesis of nitrogen and sulfur co-doped carbon dots from cellulose-based biowaste for fluorescent detection of Fe3+ ions and intracellular bioimaging. Mater. Sci. Eng. C Mater. 2019, 99, 611–619. [Google Scholar] [CrossRef] [PubMed]
- Song, Y.; Qi, N.; Li, K.; Cheng, D.; Wang, D.; Li, Y. Green fluorescent nanomaterials for rapid detection of chromium and iron ions: Wool keratin-based carbon quantum dots. RSC Adv. 2022, 12, 8108–8118. [Google Scholar] [CrossRef] [PubMed]
- Wang, L.; Li, H.; Yang, Y.; Zhang, D.; Wu, M.; Pan, B.; Xing, B. Identifying structural characteristics of humic acid to static and dynamic fluorescence quenching of phenanthrene, 9-phenanthrol, and naphthalene. Water Res. 2017, 122, 337–344. [Google Scholar] [CrossRef]
- Wang, C.; Hu, T.; Wen, Z.; Zhou, J.; Wang, X.; Wu, Q.; Wang, C. Concentration-dependent color tunability of nitrogen-doped carbon dots and their application for iron(III) detection and multicolor bioimaging. J. Colloid Interfaces Sci. 2018, 521, 33–41. [Google Scholar] [CrossRef]
- Li, S.; Li, Y.; Cao, J.; Zhu, J.; Fan, L.; Li, X. Sulfur-Doped Graphene Quantum Dots as a Novel Fluorescent Probe for Highly Selective and Sensitive Detection of Fe3+. Anal. Chem. 2014, 86, 10201–10207. [Google Scholar] [CrossRef]
Publisher’s Note: MDPI stays neutral with regard to jurisdictional claims in published maps and institutional affiliations. |
© 2022 by the authors. Licensee MDPI, Basel, Switzerland. This article is an open access article distributed under the terms and conditions of the Creative Commons Attribution (CC BY) license (https://creativecommons.org/licenses/by/4.0/).