Article

Copper-Induced Fluorescence Quenching in a Bis[2-(2′-hydroxyphenyl)benzoxazole]pyridinium Derivative for Quantification of Cu2+ in Solution

1
Department of Chemistry, Faculty of Science, University of Colombo, Colombo 00700, Sri Lanka
2
Department of Chemistry, The University of Akron, Akron, OH 44325, USA
3
Department of Structural Biology, St Jude Children’s Research Hospital, Memphis, TN 38105, USA
*
Author to whom correspondence should be addressed.
Chemosensors 2022, 10(10), 382; https://doi.org/10.3390/chemosensors10100382
Submission received: 15 August 2022 / Revised: 14 September 2022 / Accepted: 20 September 2022 / Published: 22 September 2022
(This article belongs to the Special Issue Fluorescent Sensors for Disease Diagnosis and Therapy)

Abstract

:
Accurate determination of Cu2+ in solution is crucial for preventing several disease conditions. Spectroscopy-based techniques for metal ion detection are promising methods due to their excellent sensitivity and rapid response time. In this work, we are reporting a newly synthesized 2-(2′-Hydroxyphenyl) benzoxazole-based compound, probe 2, by incorporating a vinyl pyridinium segment into the bis(HBO) 4 system. Probe 2 exhibited excellent specificity toward Cu2+ in solution. The ratiometric absorbance (λ440370) and the quenching of fluorescence at λem ≈585 nm exhibited an excellent linear correlation. The formation of the 2-Cu complex can be utilized as a highly sensitive spectroscopic method for the detection of Cu2+ in solution with a detection limit of 0.15 µM. In addition, Cu2+-induced fluorescence quenching in probe 2 occurs mainly via a static quenching mechanism by forming a 2-Cu complex, and the stability constant for the 2-Cu complex was calculated based on spectroscopic measurements.

1. Introduction

Small-molecule organic fluorescent dyes have been widely used for various chemical sensing applications including metal ions, anions, pH, temperature, viscosity, and biomolecules [1,2,3,4,5,6,7,8,9,10,11]. An ideal fluorescent chemical sensor should exhibit high sensitivity and selectivity toward the analyte of interest while producing a discernible optical response upon binding of it. The optical response of fluorescent chemical sensors to an analyte binding event will be either an enhancement, quenching, or a shift in its fluorescence emission. 2-(2′-Hydroxyphenyl)benzoxazole (HBO) 1 is a unique molecular skeleton for developing fluorescent chemical sensors due to its ability to undergo excited-state intramolecular proton transfer (ESIPT), which enables HBO derivatives to produce emissions at dual wavelengths and produce a large Stokes’ shift due to enol and keto tautomerization (Scheme 1) [12,13]. In addition, the large Stokes’ shift (i.e., Δλ > 100 nm) observed in HBO structure can reduce the self-absorption of emitted fluorescence and thereby improve probe’s sensitivity. The rational designing of an efficient ESIPT-based chemical sensor is achieved by controlling the dual emissive keto/enol tautomer ratio in solution. Binding of metal ions to simple HBO models such as 1, would produce the metal complex (i.e., 1-M in Scheme 1) that will give only one emission (λmax ≈ 376 nm, λem ≈ 443 nm) as ESIPT is no longer possible [1]. In order to enable ESIPT emission in the HBO-metal complexes, we have introduced several bis(HBO) compounds that have two HBO fragments (i.e., 4) [14,15,16,17]. In this molecular design, one HBO subunit is used for metal ion binding, while the other HBO subunit is preserved for ESIPT to give keto emission. Inspired by this principle, we have developed an interesting bis(HBO)-Cyanine hybrid system 5 (Scheme 1) by incorporating a vinyl pyridinium segment to the bis(HBO) 4 skeleton to extend the conjugation [18]. Probe 5 exhibited an excellent selectivity to fluoride anion (F) and exhibited a large spectral shift (i.e., λem ≈ 600 nm to 720 nm) upon F binding [18].
Based on efficient anion sensing ability of probe 5, we hypothesized that this new bis(HBO)-Cyanine hybrid model will also be useful for cation sensing via metal ion binding similar to 1-M (Scheme 1). In this work we have synthesized a novel HBO-Cyanine hybrid 2 by introducing a phenyl substituent into the alkyl chain (R = Ph in Scheme 1) of the vinyl pyridinium group to evaluate its cation sensing ability (Scheme 1). Interestingly, probe 2 exhibited an excellent specificity toward Cu2+ ions in solution by quenching probe’s fluorescence emission at 585 nm upon introduction of Cu2+ ions to the medium. The accurate detection of Cu2+ content in an aqueous environment has biological importance as several disease conditions are triggered by high Cu2+ content such as Wilson’s disease, Hemolytic anemia, and genetic defects [19]. Therefore, the development of spectroscopy-based detection methods will be advantageous due to their high sensitivity and rapid response time. To date, many fluorescence-based detection methods have been developed for Cu2+ detection with calculated detection limits (LOD) ranging from 0.02 to 10 μM range, which clearly indicates the reliability of the fluorescence-based methods for quantification purposes [20,21,22,23,24,25,26,27,28,29,30]. In this study, we have developed spectroscopy-based methods (i.e., absorbance and emission) to analyze Cu2+content in aqueous environments by analyzing quenching of fluorescence (λem ≈ 585 nm) as well as the ratiometric absorbance (λ440370) response. Due to exhibited high specificity toward Cu2+, probe 2 will be a promising candidate toward accurate detection of Cu2+ in solution. In this article, we discuss in detail on the design, spectroscopic properties and the application of probe 2 toward the sensitive detection of Cu2+ in solution via graphical methods.

2. Materials and Methods

All chemicals for synthesis and spectroscopic studies were purchased from VWR International (Radnor, PA, USA) and Sigma-Aldrich (St. Louis, MO, USA) and used as received. NMR characterization data were acquired by a Bruker 500 MHz NMR spectrometer (Billerica, MA, USA). High-resolution mass spectrometry data were acquired by an ESI-TOF MS system (Waters, Milford, MA, USA). UV-vis studies were carried out in a GENESYS 10S UV-Visible spectrophotometer (Thermo Scientific, Waltham, MA, USA) at 25 °C. Fluorescence studies were carried out in a HITACHI F7000 fluorescence spectrophotometer. All spectroscopic work was conducted in spectroscopic-grade chemicals. Compounds 3 and 4 were synthesized according to the previously reported methodology without further modifications [14,15,18].

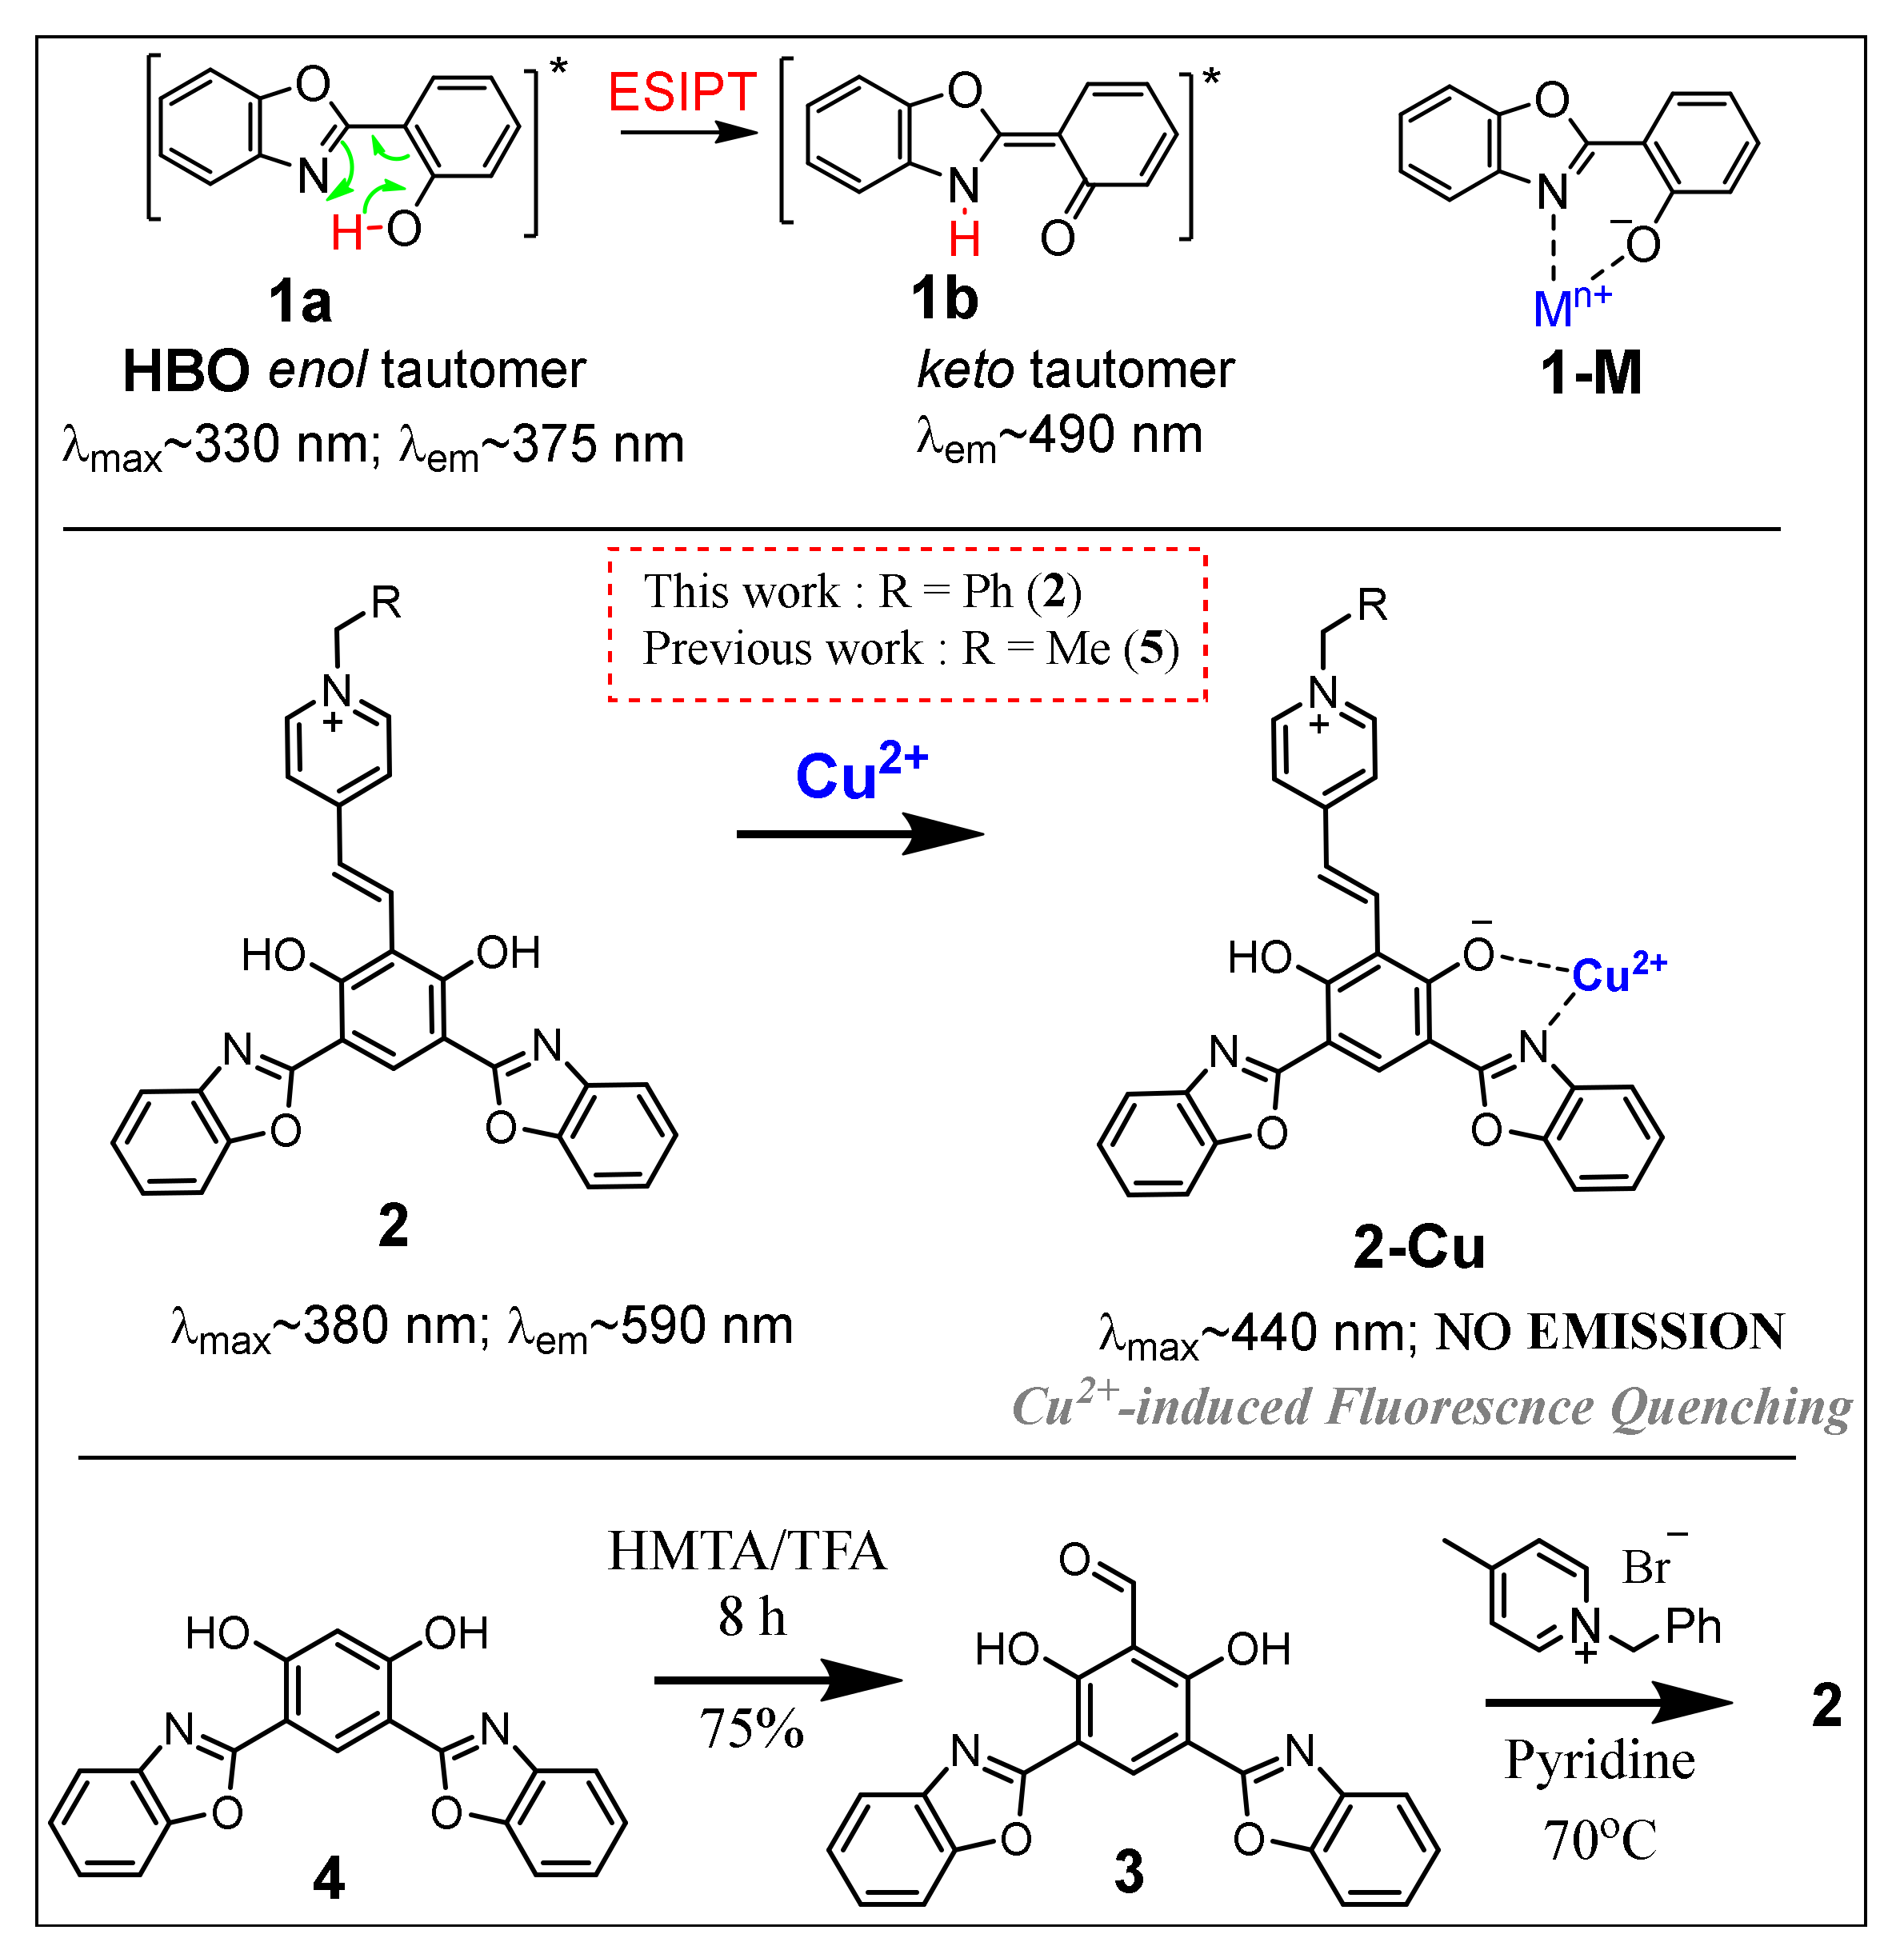
2.1. Synthesis of (E)-4-(3,5-Bis(benzo[d]oxazol-2-yl)-2,6-dihydroxystyryl)-1-benzylpyridin-1-ium Iodide (2)

In a 10 mL round bottom flask, 25 mg (0.067 mmol) of the aldehyde 2 was dissolved in 2 mL of ethanol, and 17 mg (0.064 mmol) of the 1-benzyl-4-methylpyridin-1-ium bromide salt was added at room temperature, and the solution was stirred for 5 min. Following the addition of pyridine (0.25 mL), the resulting yellow color solution mixture was heated to 70 ᴼC for 12 h with vigorous stirring. The progress of the reaction was monitored using TLC by monitoring the disappearance of the aldehyde 2. Upon completion, the bright yellow color reaction mixture was cooled down to room temperature, and ethyl acetate (15 mL) was added. Upon the addition of ethyl acetate, a yellow-colored solid product started to precipitate out from the solution. This solution mixture was stirred vigorously at room temperature was 10 min and allowed to settle for another 10 min. Then the solution mixture was filtered by vacuum filtration, and the resulting dark yellow solid product was further washed with hot ethyl acetate (50 °C) (3 × 50 mL). The final product 2 (25 mg; 0.04 mmol) was collected on the Buchner funnel (60% yield). 1H NMR (500 MHz, DMSO-d6) δ 13.00 (s, 2H), 8.90 (d, J = 6.0 Hz, 2H), 8.34 (s, 1H), 7.93 (d, J = 6.2 Hz, 2H), 7.80 (d, J = 16.3 Hz, 1H), 7.72–7.66 (m, 3H), 7.63 (d, J = 7.6 Hz, 2H), 7.54 (p, J = 7.5, 7.1 Hz, 4H), 7.29 (d, J = 8.8 Hz, 1H), 7.18 (dt, J = 21.6, 7.5 Hz, 4H), 5.74 (s, 2H). 13C NMR (126 MHz, DMSO) δ 161.73, 153.92, 148.70, 144.33, 138.75, 135.03, 130.01, 129.90, 129.78, 129.34, 127.36, 126.65, 126.23, 125.77, 124.17, 119.06, 111.42, 111.32, 103.89, 62.64. HRMS (TOF MS ES+) found (m/z) for [M+] 538.1761 [C34H24N3O4+]. HRMS calculated found (m/z) for [M+] 538.1761 [C34H24N3O4+]. The melting point was found at 338.6 °C.

2.2. Fluorescence Quantum Yield Calculation

The relative fluorescence quantum yields (φfl) for probe 2 were calculated by using Quinine Sulphate as the standard, where the fluorescence quantum yield of Quinine Sulphate is 0.54 in 0.1 M H2SO4. The following equation was used for fluorescence quantum yield determination of probe 2 at 370 nm.
fl)sample = φref × (Aref/Asample) × [(Isample)/(Iref)] × (ɳsample)2/(ɳref)2
where A is the absorbance of the sample, I is the integrated fluorescence intensity, and ɳ is the refractive index of the solvent.

2.3. Spectroscopic Titrations and Calculations

Stock solutions of probe 2 were prepared in spectroscopic-grade DMSO in 10 mM concentration. All cation and anion solutions were prepared with 10 mM concentration in double distilled water. For all spectroscopic studies, the working concentration of probe 2 was 1 × 10⁻⁵ M (10 µM). For emission studies in different solvents, probe 2 was excited at 370 and 440 nm wavelengths, and the emissions were collected from 460 nm to 720 nm. All spectroscopic analysis experiments were conducted in acetonitrile. For the initial screening of the cation and anion sensitivity, 10 equivalences of the analyte species were introduced to probe 2 (10 µM) in acetonitrile. To study the emission of probe 2 with respect to the addition of each analyte, probe 2 was excited at 370 and 440 nm wavelengths, and the emissions spectra were collected from 460 nm to 720 nm. Since all fluorescence-based analysis studies were conducted in diluted solutions (≈1 × 10⁻⁵ M), the acquired spectra were not corrected for the inner filter effects, assuming it was negligible.
The linearity plots for the ratiometric absorbance data were obtained by calculating the absorbance ratio at 440 nm and 370 nm wavelengths (λ440370) for each spectroscopic titration plot. The ratiometric emission plots were obtained by dividing the emission of the 2-Cu complex (I585) by the emission of probe 2 emission in the absence of quencher (Io585). The Stern–Volmer plot for the quenching of fluorescence emission was calculated by plotting the Fo/F as a function of Cu2+ concentration in the solution, where Fo and F are the emission of probe 2 and 2-Cu complex, respectively. The stability constant (K) for the 2-Cu complex was calculated by following the modified Stern–Volmer-type equation.
log[(Fo)/(Fo − F)] = log K + n log[Mm+]
where Fo is the emission of probe 2 in the absence of the quencher and F is the emission of the 2-Cu complex at a given titration interval. K is the stability constant for the 2-Cu complex, and n is the stoichiometric coefficient of the complex.

3. Results and Discussion

3.1. Optical Properties of Probe 2

Spectroscopic properties of probe 2 were studied in different solvents and summarized in Table 1 and Figure 1. The absorption maxima (λmax) of the probe 2 appeared in 365–390 nm range over a wide range of solvents. The absorption spectra of the probe 2 did not exhibit a noticeable solvatochromic effect while changing from non-polar to polar solvents (Table 1 and Figure 1a). However, in DMSO, probe 2 exhibited a strong absorption peak at λabs ≈ 530 nm (Figure 1a), which is attributed to the deprotonation of the phenolic group (Ph-OH → Ph-O) [18]. The sharp absorption peak at λabs ≈ 530 nm indicates the increased acidity of the phenolic group in probe 2 structure (in comparison to 4) due to the presence of strong electron-withdrawing vinyl pyridinium substituent. Similarly, the probe also exhibits moderate to weak deprotonation in polar protic solvents such as ethanol and methanol (Figure 1a). In all solvents except DMSO, the probe exhibited a consistent emission at λem ≈ 565–590 nm (Figure 1b,c), which is attributed to the emission resulting from the Excited-state Intramolecular Proton Transfer (ESIPT) process coupled with the intramolecular charge transfer (ICT) as explained in Scheme 2 (i.e., 2 -> 2a -> 2b. As a result, probe 2 exhibits a large Stokes’ shift (∆λ > 180 nm), providing strong evidence of efficient ESIPT coupling with ICT (Table 1). The weak emission observed at λem ≈530 upon excitation at 440 nm wavelength (Figure 1c) is attributed to the emission produced by the anionic form of 2 produced as a result of solvent-dependent deprotonation (Ph-OH → Ph-O) [18]. The observed significant hypsochromic shift in the emission resulted in DMSO (λem ≈ 515) can be attributed to the ICT process occurring in intermediate 2c, which is generated by the deprotonation of probe 2 (Scheme 2). The observed Stokes’ shift of probe 2 (∆λ ≈ 130 nm) was significantly reduced in DMSO (Table 1) due to the hampered ESPIT). The impact of strong ESIPT coupling to ICT was further verified by conducting low-temperature fluorescence studies for probe at −188 °C where the restricted ESIPT/ICT process in the frozen solvent matrix generated a significant hypsochromic shift (λem ≈535) in the emission spectra (Figure 1d).

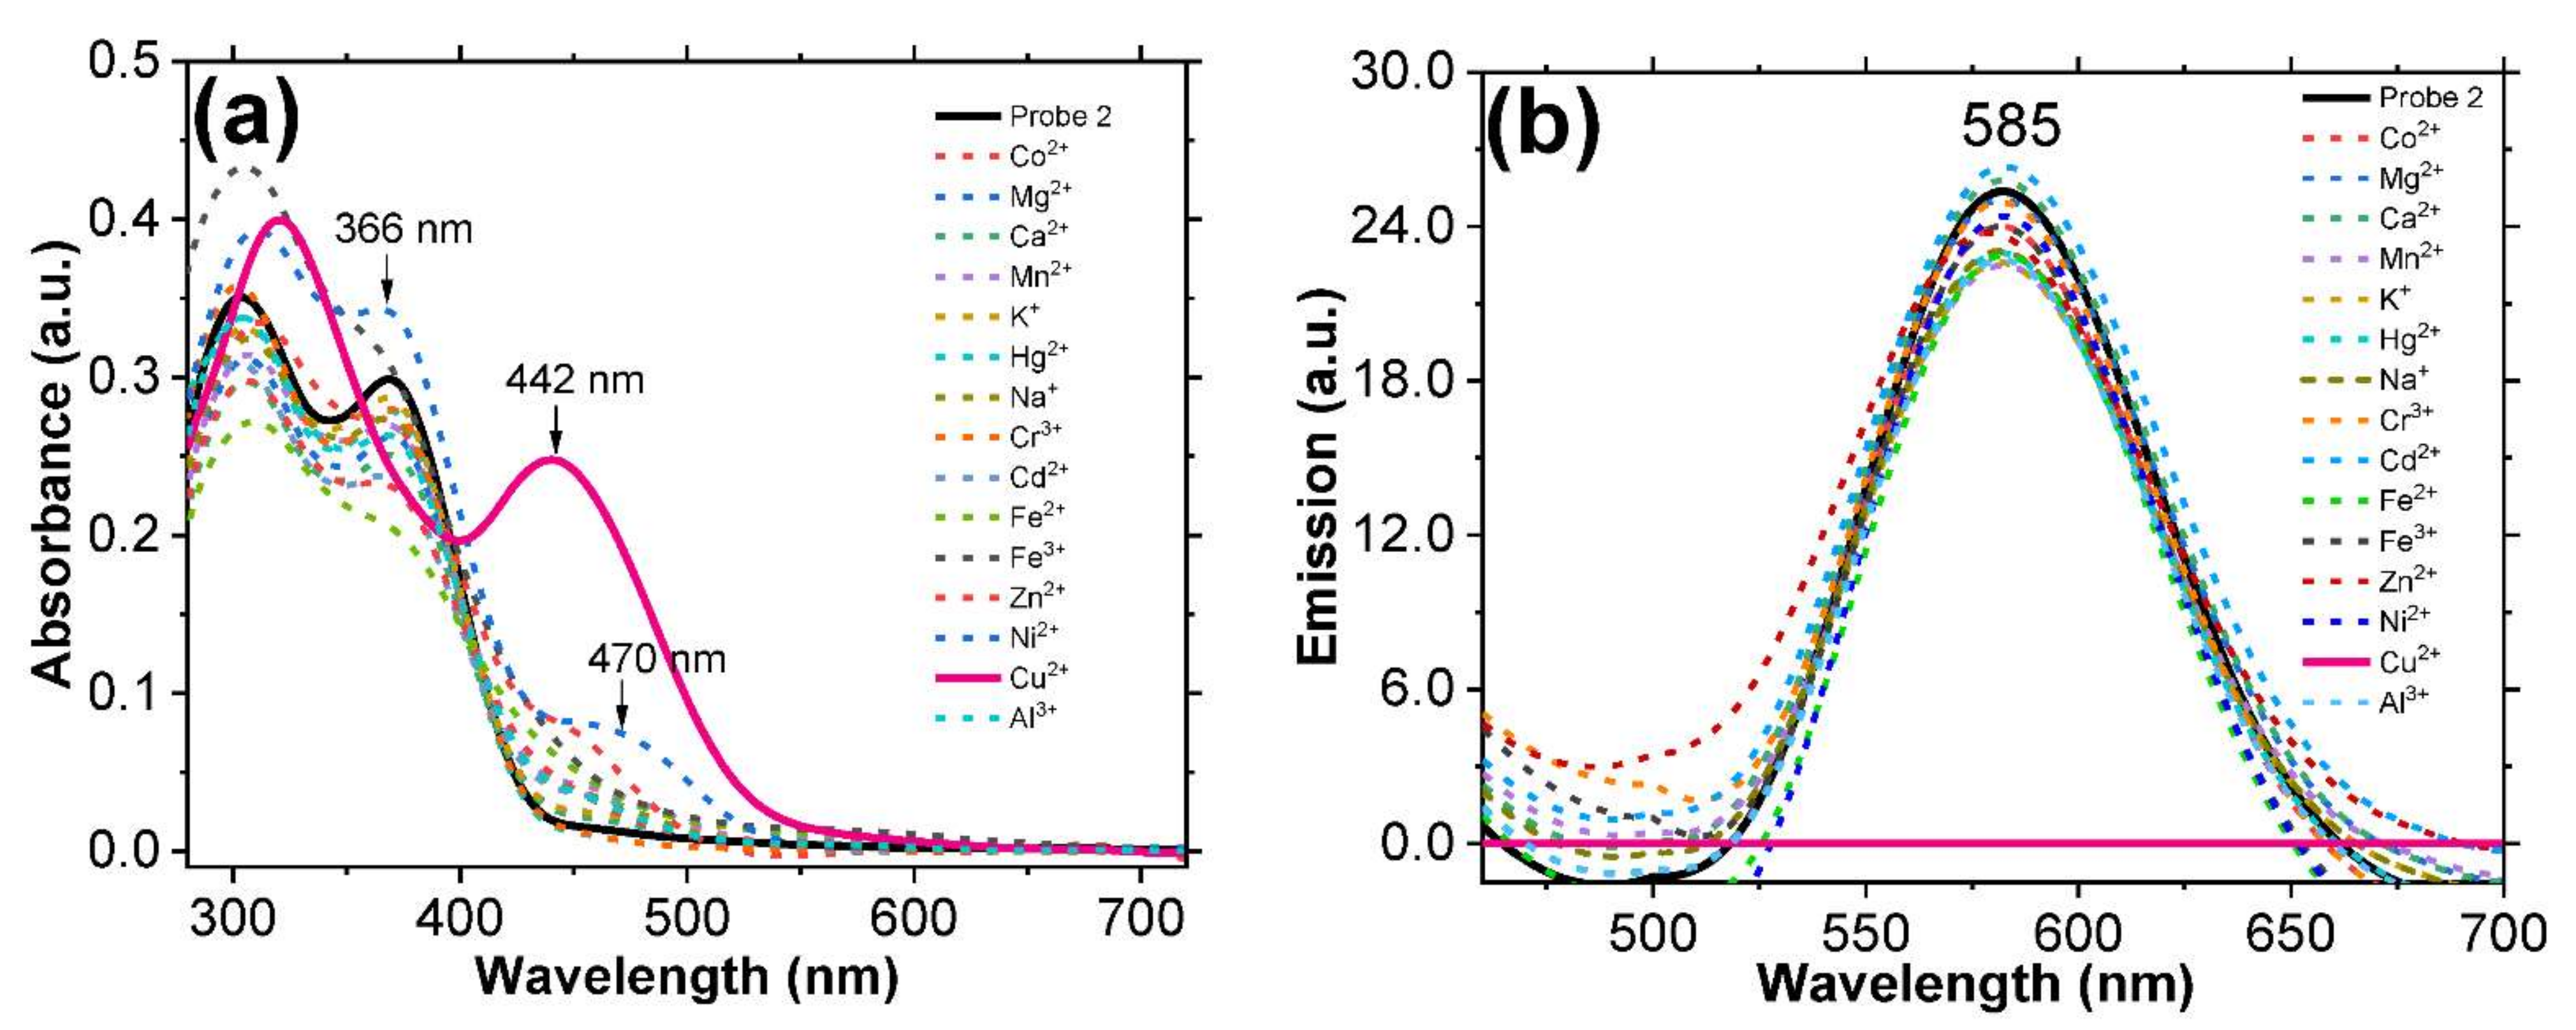
3.2. Evaluating Cation Sensing Ability of Probe 2 by Spectroscopy

In order to investigate the cation sensing ability of probe 2 in solution, various aqueous cations were tested against probe 2, and the resulting optical spectra were analyzed, as shown in Figure 2. To a 10 µM solution of probe 2 in acetonitrile, 10 equivalence of different cationic species were introduced, and the optical responses (absorbance and emission) were recorded (Figure 2). Probe 2 did not exhibit a noticeable change in the absorbance or emission spectra toward many cationic species (Figure 2). Interestingly, in the presence of Cu2+, the absorption spectra of probe 2 exhibited a sharp response at λabs ≈ 440 nm, indicating a strong interaction of the probe with Cu2+ ions (Figure 2a). Probe 2 also indicated a weak response at λabs 440 nm upon the addition of Ni2+ (Figure 2a). These results clearly indicated strong evidence of the potential ability of probe 2 toward Cu2+ binding in solution. The fluorescence emission spectra acquired for probe 2 in the presence of metal ions (10 equivalence) exhibited a bright red emission at λem ≈ 585 nm except for Cu2+, whereas the emission of probe 2 was completely quenched by Cu2+ (Figure 2b). Although Ni2+ generated a weak response in the absorption of probe 2 at λabs ≈ 440 nm (Figure 2a), the emission response of probe 2 remained unchanged upon the addition of Ni2+ (Figure 2b). These results suggested an outstanding specificity of probe 2 toward Cu2+ and indicated the probe’s ability to detect Cu2+ in solution by spectroscopic methods. In order to further validate the consistency and reproducibility of the observed Cu2+-induced changes in optical spectra of probe 2 and to rule out the effect of the counter ion during the analysis, different copper salts (i.e., CuCl2, CuSO4, and Cu(NO3)2) were tested against probe 2 (Figure S2). Probe 2 exhibited a steady response toward all Cu2+ species independent from the identity of the counter ion, indicating its remarkable specificity toward the copper(II) ions.

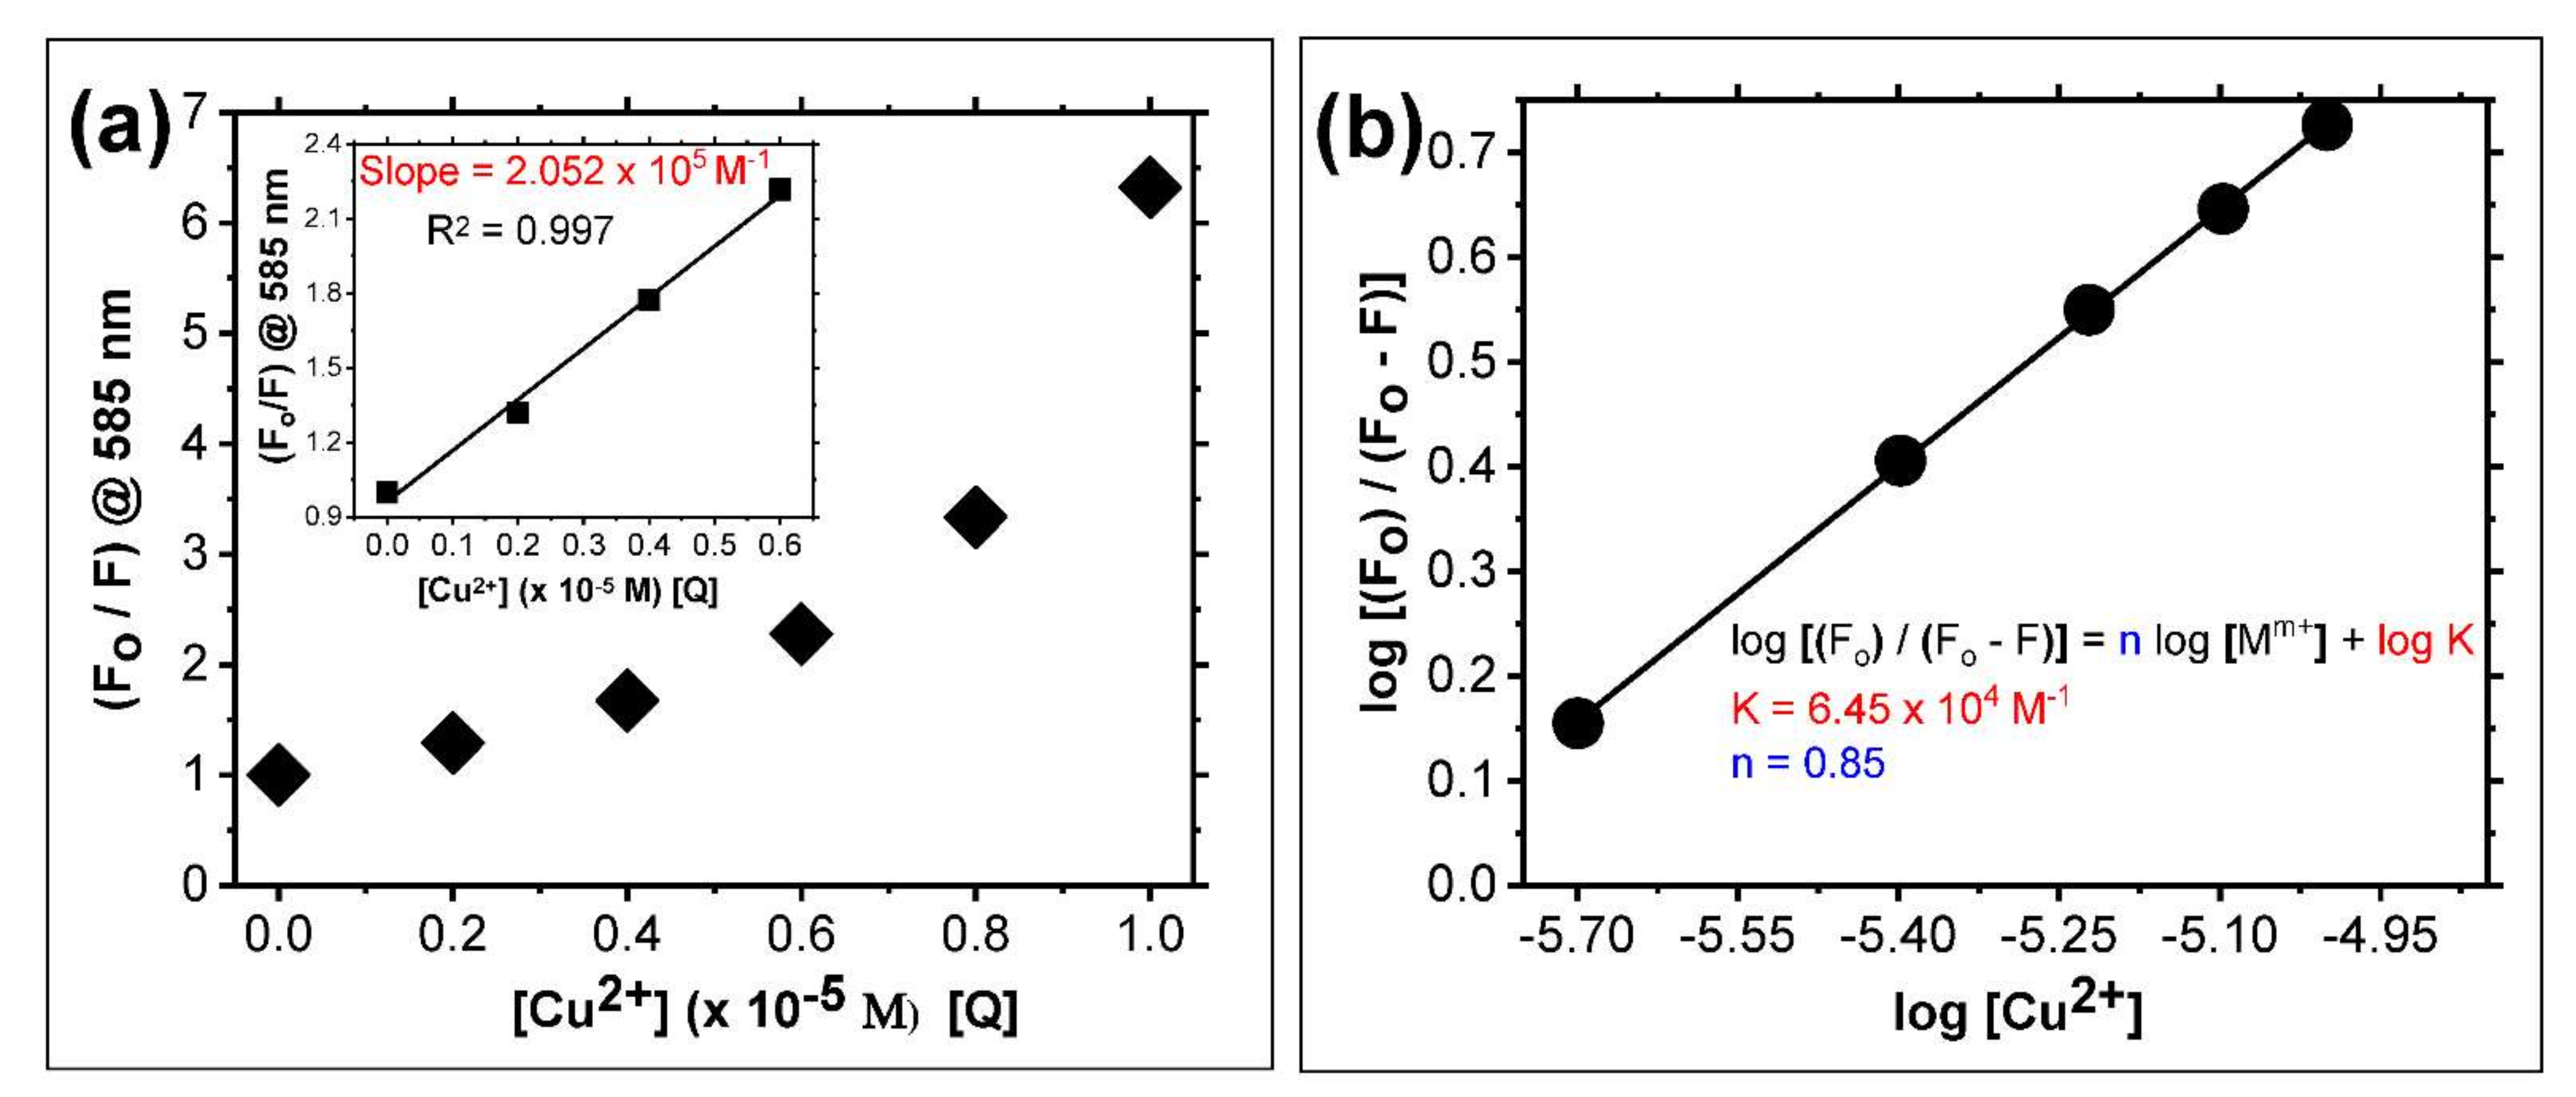
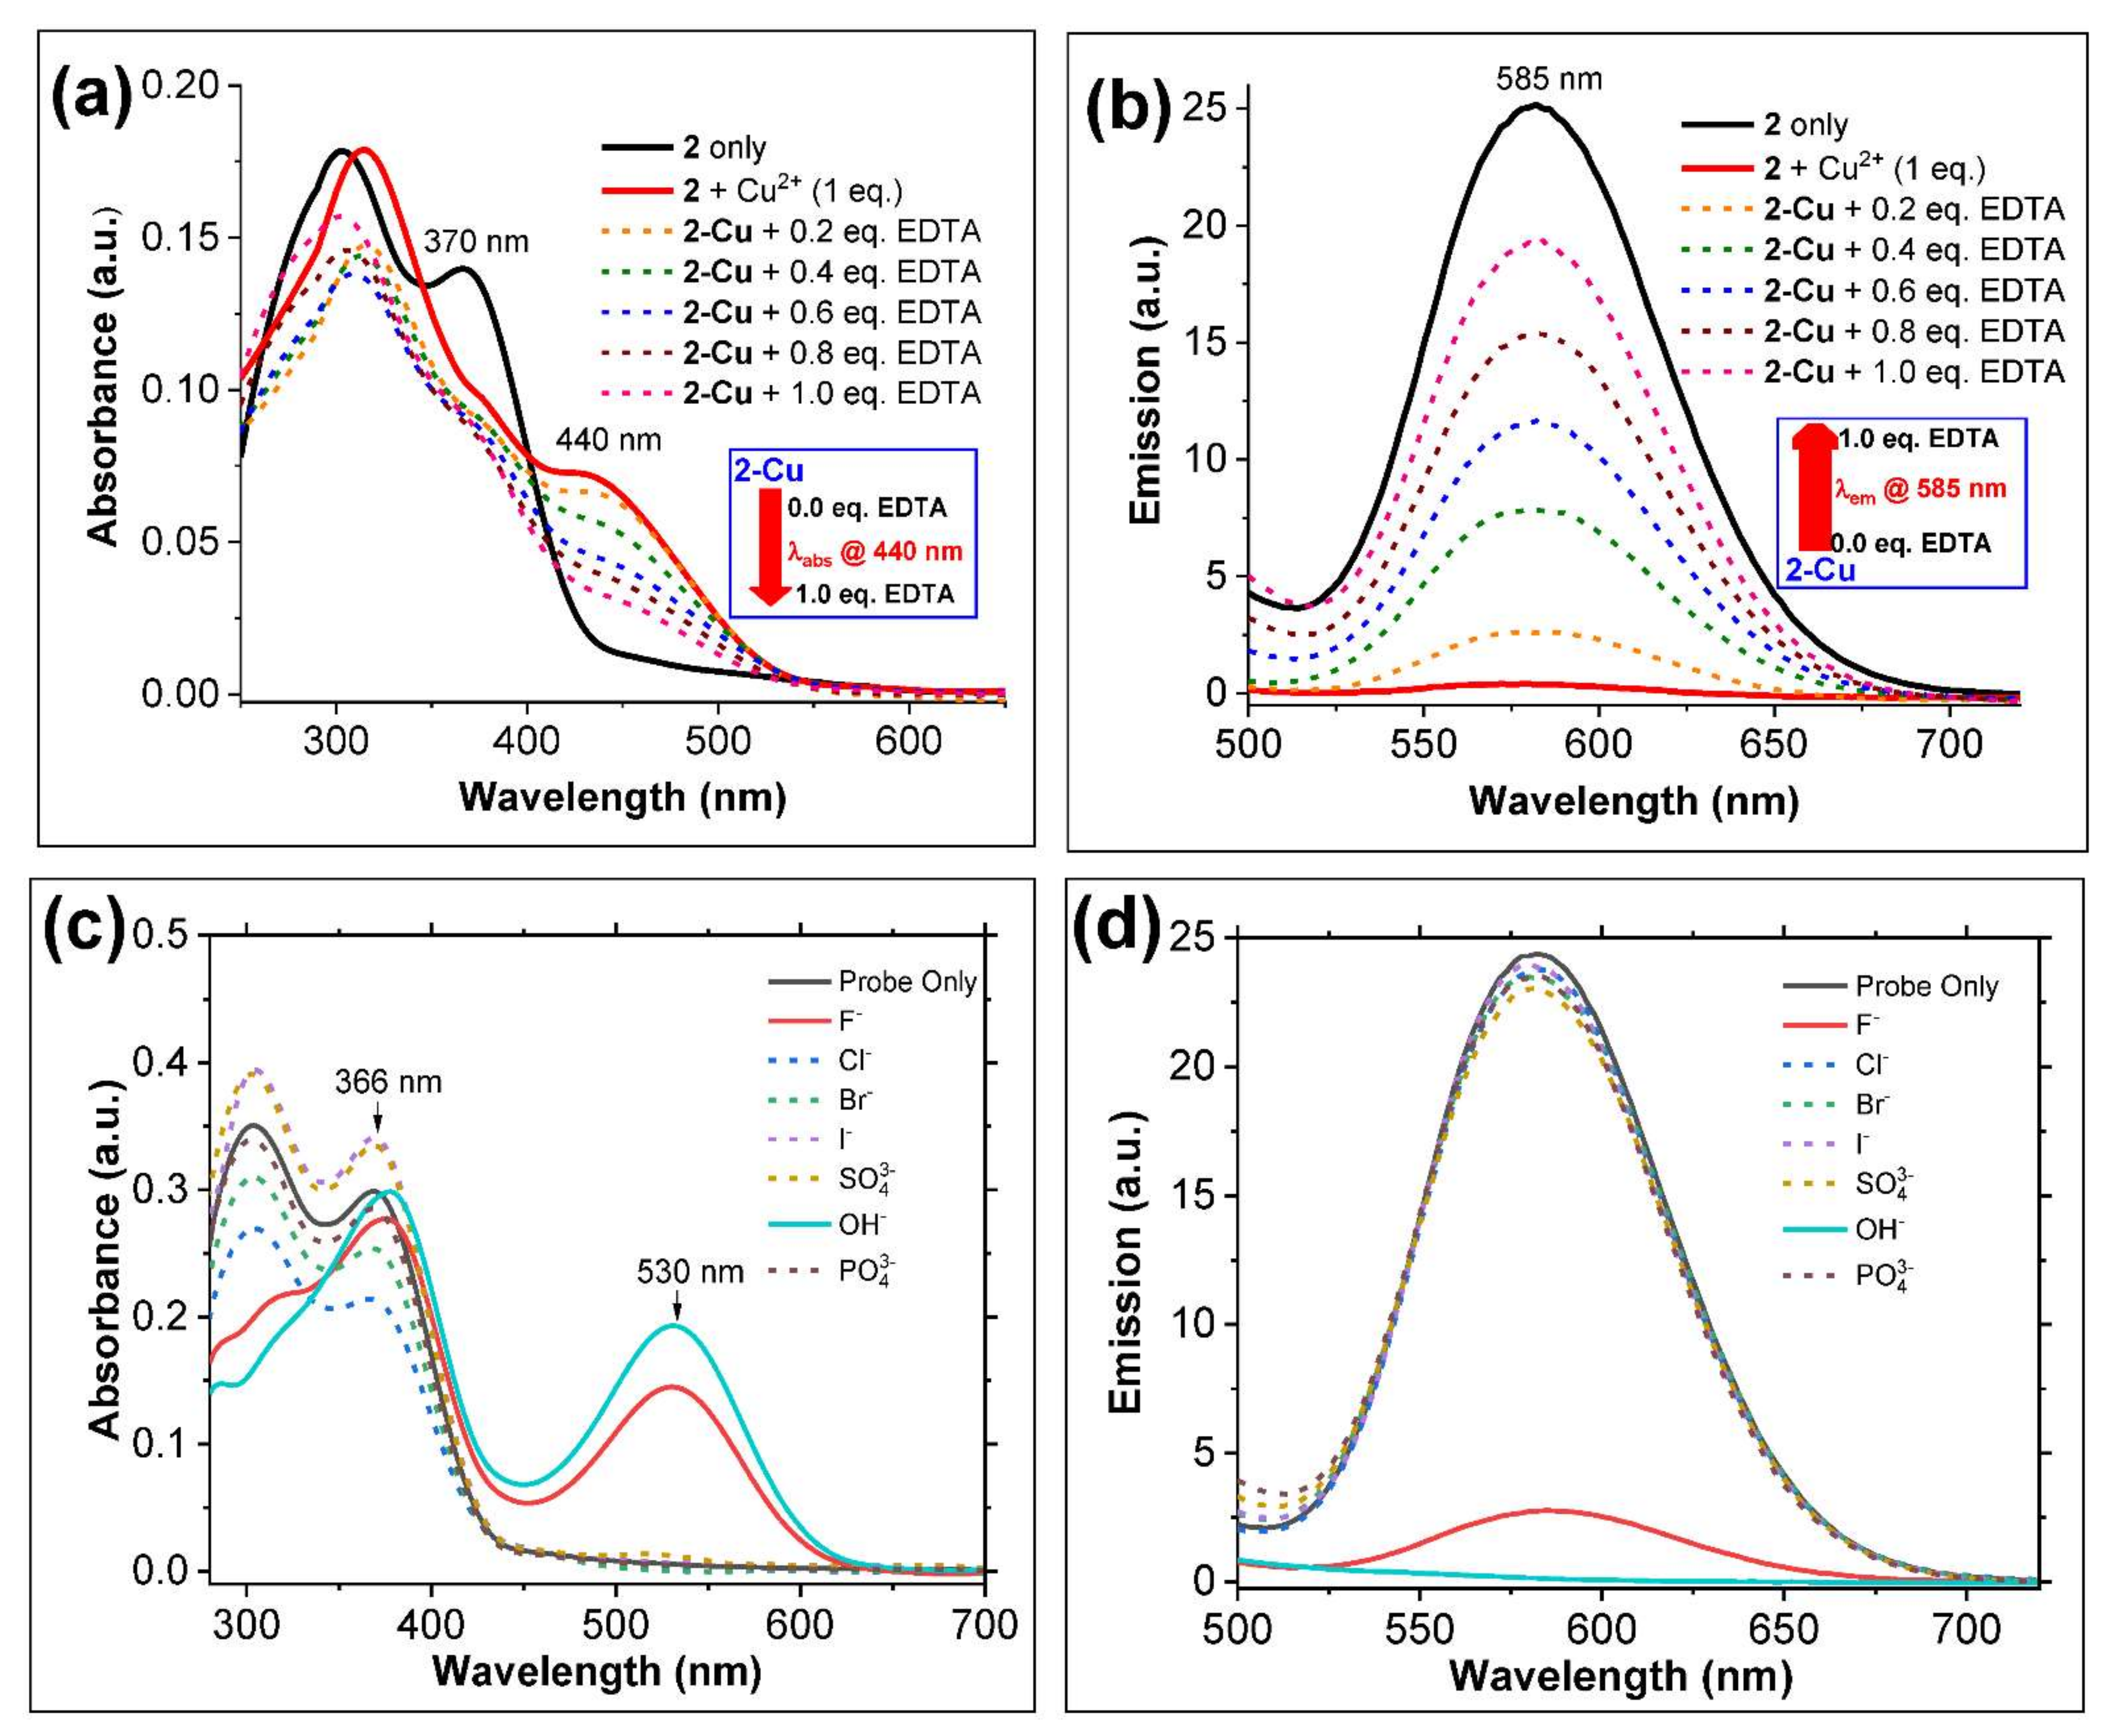
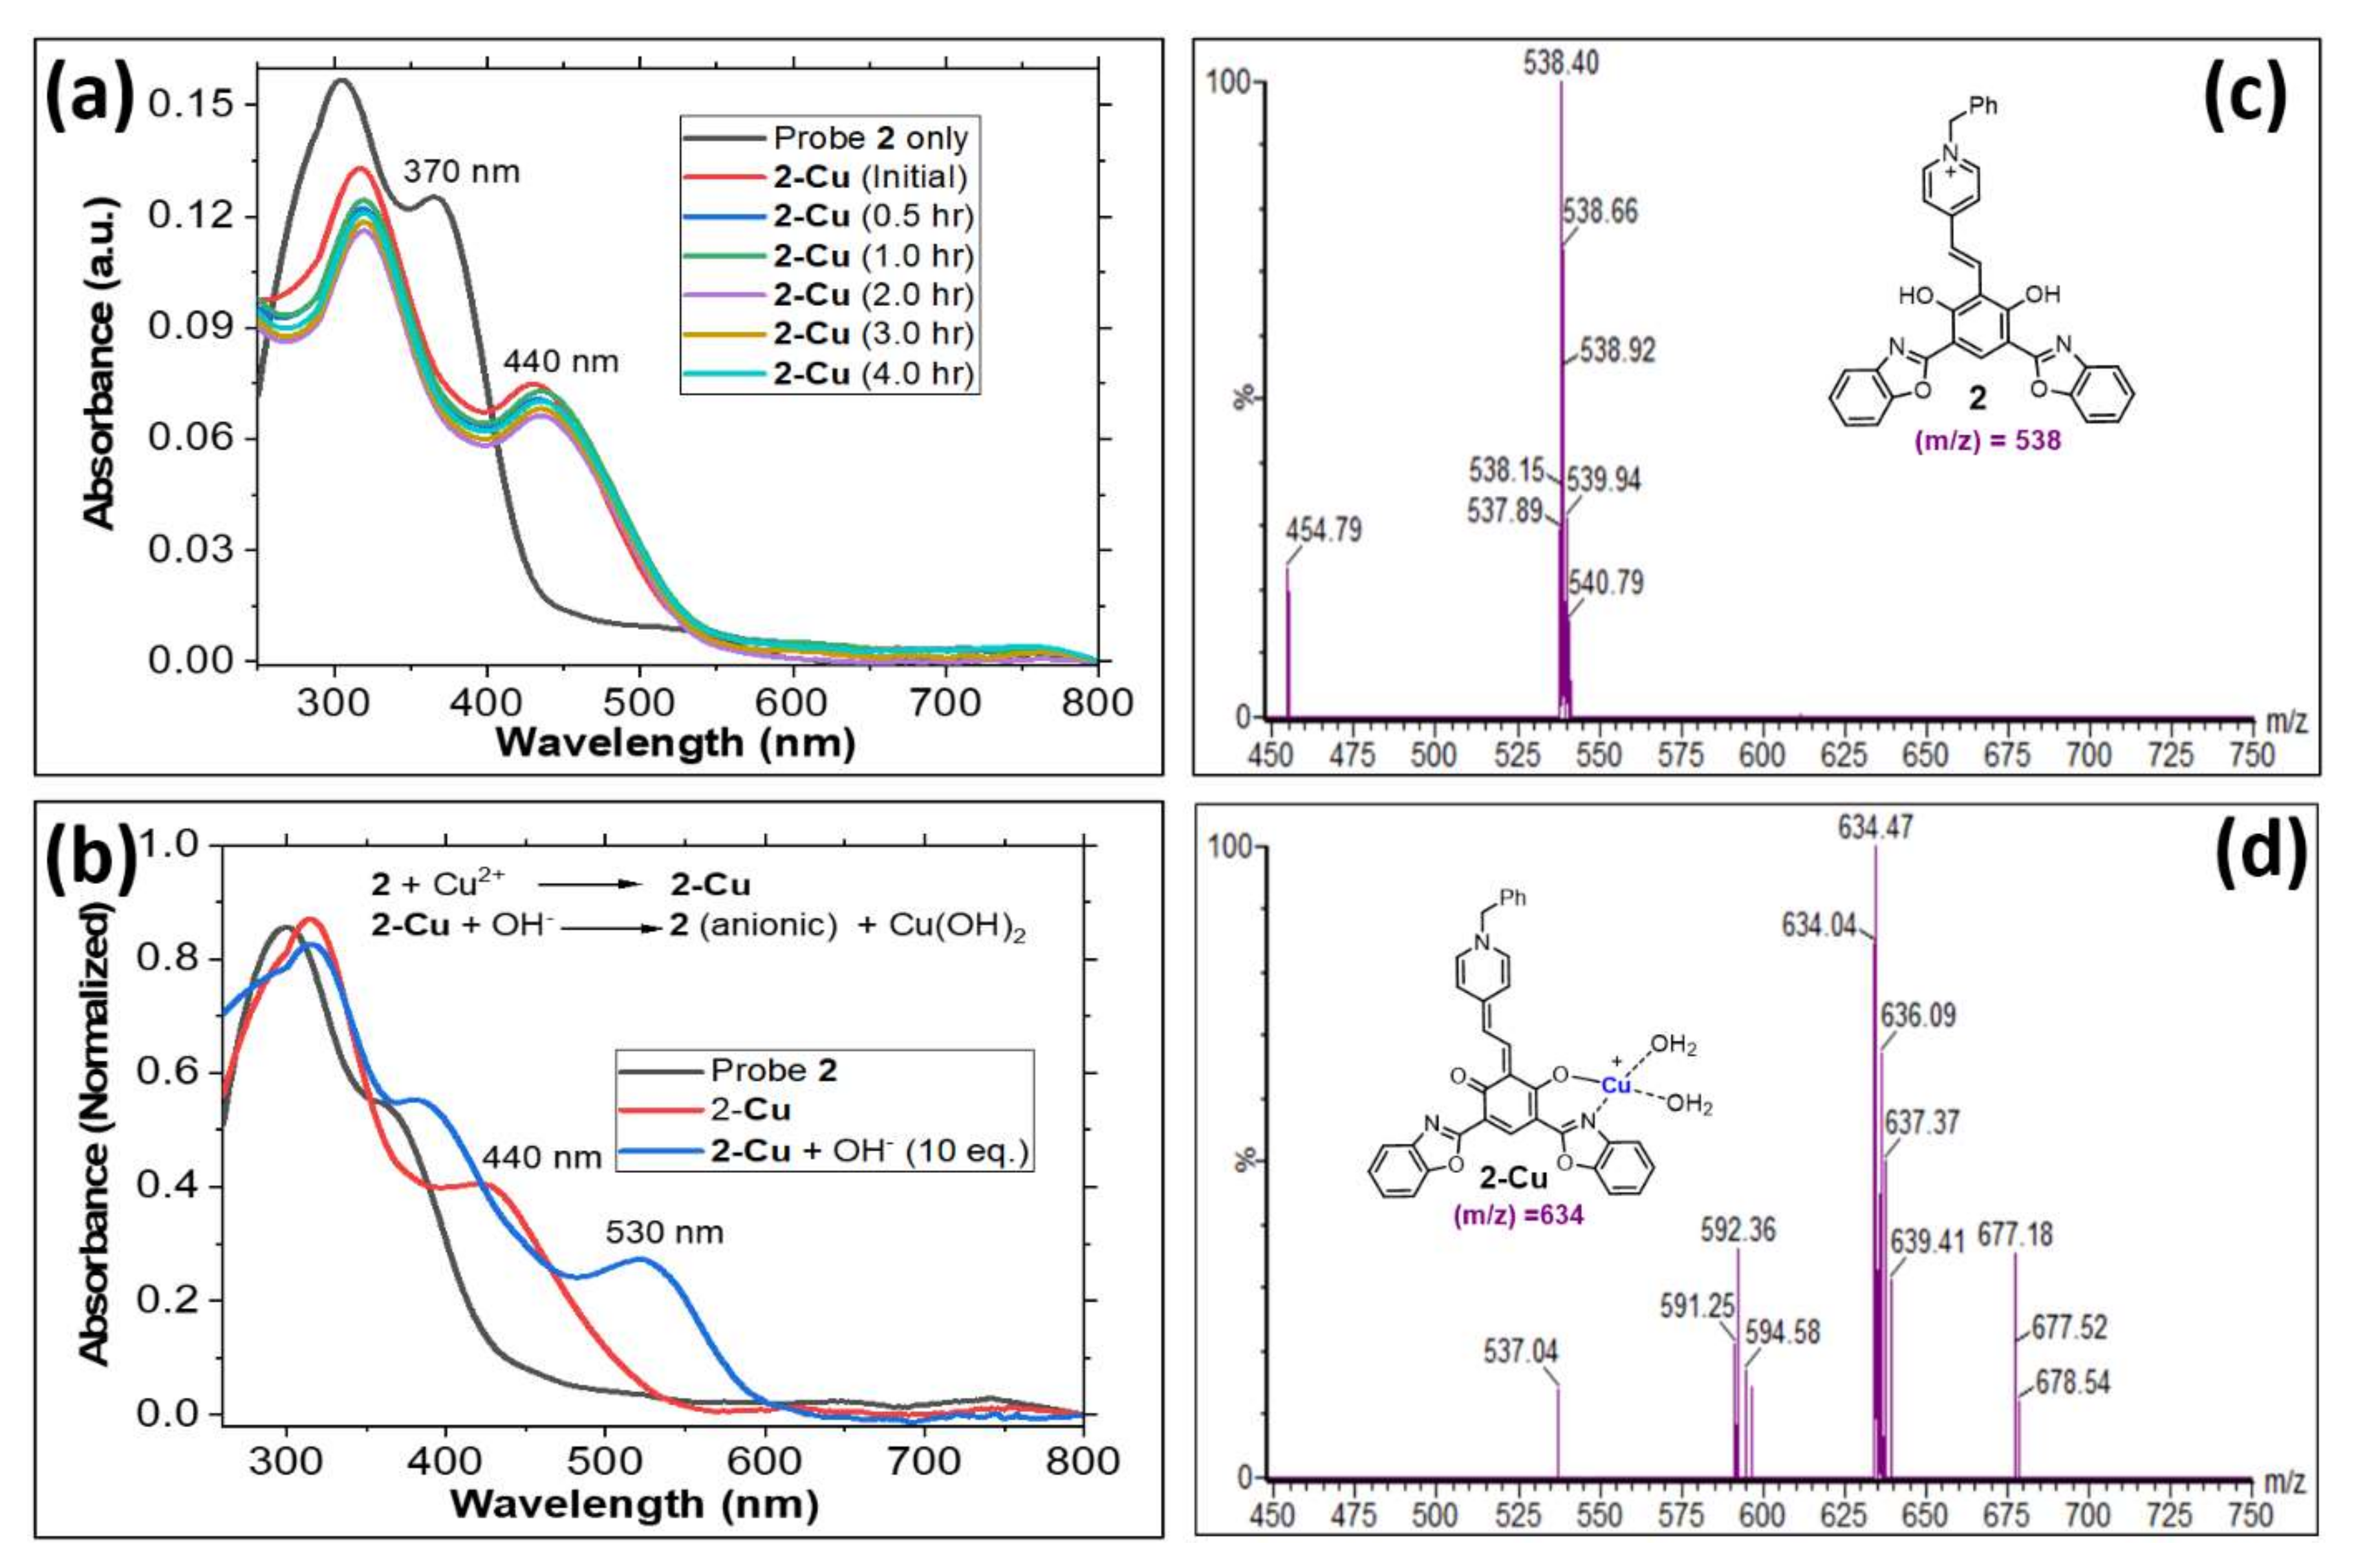
3.3. Study of Cu2+ Binding Properties of Probe 2 by Spectroscopic Titrations

The observed Cu2+-induced strong optical response of probe 2 encouraged us to further investigate the Cu2+ sensing mechanism and the binding stoichiometry of probe 2. Therefore, spectroscopic titrations were performed for probe 2 in the presence of Cu2+ in acetonitrile (Figure 3). The gradual addition of Cu2+ (i.e., 0.1 equiv. portions) into probe 2 (in acetonitrile) led to the appearance of an absorption peak at λabs ≈ 440 nm, which continued to increase with further additions of Cu2+ (Figure 3a). The absorption peak appeared at λabs ≈ 440 nm, reached a maximum with 1 equivalence of Cu2+, and further addition of Cu2+ exhibited a slight decrease in the peak at λabs ≈ 440 nm (Figure 3a). The calculated Job’s plot for copper binding to probe 2 exhibited a 1:1 binding stoichiometry (top insect in Figure 3a). In addition to the gradual increase in the peak at λabs ≈ 440 nm, the addition of Cu2+ into probe 2 also exhibited a gradual decrease in the absorbance peak at λabs ≈ 370 nm, indicating possible structural modifications to the probe 2 upon binding to Cu2+ (bottom insect in Figure 3a). The ratiometric absorbance for λ440/λ370 was plotted as a function of Cu2+ concentration, which exhibited an excellent linear relationship (R2 = 0.997), demonstrating the capacity of probe 2 to determine Cu2+ concentration in solutions based on the ratiometric absorbance response (Figure 3b). The calculated limit of detection (LOD) for this method was found to be 0.15 μM. It is important to note that the Cu2+-induced absorbance response that appeared at λabs ≈ 440 nm is significantly different from the absorption peak observed for probe 2 in DMSO (λabs ≈ 530 nm) due to the formation of the phenoxide anion by deprotonation of the phenolic group in probe 2. These data clearly indicate that when probe 2 interacts with Cu2+ ions, it does not lead to phenoxide anion generation in the solution. Rather, it generates a coordinated metal complex 2-Cu as proposed in Scheme 1. The observed 1:1 binding stoichiometry by Job’s plot and the single isobestic point observed at λabs ≈ 400 nm also provides evidence of the formation of the 2-Cu complex.
The emission of probe 2 at λem ≈ 585 nm decreased gradually with increasing concentration of Cu2+ added into the solution, and probe 2 was nearly non-fluorescent upon the addition of 1 equivalence of Cu2+ (Figure 3c). The relative fluorescence quenching (I585/Io585) of probe 2 induced by Cu2+ exhibited an excellent linear relationship (R2 = 0.991) with respect to the Cu2+ concentration in the solution (Figure 3d). However, the linearity of the response gradually diminished and plateaued with increasing Cu2+ concentration. It is also important to note that the addition of 0.1 to 1 equivalence of Cu2+ into probe 2 exhibited a strong fluorescence quenching at λem ≈ 585 and further increase in the Cu2+ equivalence in the solution (i.e., 2 equiv.) did not impact significantly (Figure 3c,d). The calculated limit of detection (LOD) for Cu2+-induced relative fluorescence quenching of probe 2 was found to be 0.38 μM.
The Stern–Volmer plot was generated to analyze the fluorescence quenching event based on the fluorometric titrations of probe 2 with Cu2+ (Figure 4a). In the generated Stern–Volmer plot, the relative quenching efficiency (Fo/F) did not exhibit the conventional linear relationship to the quencher (Cu2+) concentration (Figure 4a). Although the quenching of fluorescence exhibits a linear relationship with a lower concentration of Cu2+, the quenching efficiency tends to increase exponentially at higher quencher concentrations (Figure 4a). At lower concentrations of the Cu2+, the quenching of fluorescence likely occurs due to the static quenching process by forming the 2-Cu complex, which enables the metal-to-ligand electron transfer (MCLT) process [31,32,33,34,35]. The calculated fluorescence lifetime for probe 2 was found to be ≈2.25 ns (Figure S6). Based on these data, the bimolecular quenching rate constant (kq) calculated for the linear quenching range (i.e., 1–6 μM of Cu2+) of the graph 4a was 9.11 × 10¹³ M1 s1, which was found to be significantly higher than the diffusion-limited dynamic quenching value (kdiff ≈ 2 × 10¹⁰ M1s1). Therefore, the possibility of dynamic quenching can be ruled out for the 2-Cu complex (Figure 4a and Figure S6). However, at higher Cu2+ concentrations, the fluorescence quenching may likely be governed by a combination of static and dynamic quenching processes, which can increase the quenching efficiency exponentially (Figure 4a) [35,36,37]. The modified logarithmic scale Stern–Volmer plot was generated (Figure 4b) to calculate the stability constant of the 2-Cu complex according to the previously described methodology [9,38,39]. The calculated stability constant for the 2-Cu complex was found to be 6.45 × 10⁴ M1, and the stochiometric coefficient for the complexation was found to be n = 0.9 (≈1), which indicates 1:1 binding stoichiometry (Figure 4b).
Based on the spectroscopic data, we hypothesized that the quenching of probe 2 fluorescence occurs due to the formation of the 2-Cu complex, as described in Scheme 1. Therefore, the removal of the Cu2+ ions from the 2-Cu complex should turn on the fluorescence in 2. In order to validate our hypothesis, spectroscopic back titrations were performed with a 10 mM solution of EDTA to remove Cu2+ from the 2-Cu complex (Figure 5a,b). The addition of EDTA into the 2-Cu complex in acetonitrile gradually suppressed the new absorption peak that appeared at λabs ≈ 440 nm, indicating strong spectroscopic evidence for the dissociation of the 2-Cu complex (Figure 5a). Interestingly, the addition of EDTA (0 -> 1 eq.) also restored the emission in probe 2 (Figure 5b), which validates our initial hypothesis regarding the mechanism of fluorescence quenching by the formation of the 2-Cu complex. Due to the excellent stability of the Cu-EDTA complex (Kconditional ≈ 6.3 × 10¹¹), Cu2+ in the 2-Cu complex can be replaced by strong chelators such as EDTA (2-Cu + EDTA -> 2 + Cu-EDTA), which releases emissive probe 2 back to the solution. The reversibility of the 2-Cu complex can be useful for developing sensing applications where probe 2 can be successfully utilized as a colorimetric indicator to remove Cu2+ selectively from the solution. Probe 2 was tested against several anionic species (F, Cl, Br, I OH, PO43−, and SO43−) to investigate its optical response to anions by adding 10 equivalences from each species in solution (Figure 5c,d). As we reported in previous work, probe 5 exhibited a sharp response to F by generating a new absorbance band at λabs ≈ 530 nm, which can be attributed to the phenoxide ion formation by subsequent deprotonation of the probe 2 (Ph-OH + F -> Ph-O + HF) as shown in Figure 5c [18]. Similarly, the addition of NaOH (10 equivalence) to probe 2 also exhibited this sharp absorption band at λabs ≈ 530 nm, confirming the formation of the phenoxide anion (Figure 5c). The emission of probe 2ex = 370 nm) remained unchanged except for F and OH−, where the emission was quenched due to the formation of phenoxide anion via photo-induced electron transfer (PET). However, the distinct differences in absorption spectra (i.e., Cu2+: λabs ≈ 440 nm vs. phenoxide formation: λabs ≈ 530 nm) can be used as a reliable strategy to distinguish 2-Cu complex formation from the deprotonation event.
The solution stability of the 2-Cu complex (in acetonitrile) was studied for up to 4 h by analyzing the absorption and emission profiles of the 2-Cu complex (Figure 6a and Figure S3). Interestingly, the 2-Cu complex demonstrated exceptional stability up to 4 h with the absorbance band generated due to the 2-Cu complex formation (i.e., λabs ≈ 440 nm) remaining unchanged (Figure 6a). Similarly, the emission of the 2-Cu complex remained quenched, confirming high solution stability to the metal–ligand complex. To evaluate the stability of the 2-Cu complex under strong acidic and basic environments, large volumes (i.e., 10 equivalence) of strong base (i.e., NaOH) and strong acid (i.e., HCl) were introduced, and the resulting optical spectra were analyzed (Figure 6b, Figures S4 and S5). Upon addition of a strong base, a noticeable bathochromic shift in the absorption spectra was observed from λabs ≈ 440 nm to λabs ≈ 530 nm, which can be attributed to the dissociation of the 2-Cu complex to generate deprotonated probe 2 in the solution (Figure 6b). The emission of probe 2 and 2-Cu remained quenched in the strong base (Figure S4). However, the addition of a strong acid (i.e., HCl) did not alter the 2-Cu absorption band at λabs ≈ 440 nm, and a significant increase in the molar absorptivity was observed. Based on these results, it is assumed that the 2-Cu complex remained stable to a strong acid (Figure S5). Surprisingly, the 2-Cu complex exhibited a strong fluorescence turn-on at λem ≈ 585 nm in the strong acid (Figure S5). Although the 2-Cu complex remained unharmed in strong acid, it may likely interfere with the fluorescence quenching process by hampering the metal-to-ligand charge transfer (MLCT) process through subsequent protonation of the ligand. Therefore, these results suggest that the 2-Cu complex can be utilized as a useful candidate to sense sudden pH fluctuations in aqueous environments. The formation of the 2-Cu complex was verified by mass spectrometric (ESI-TOF) analysis of the 2-Cu complex prepared in situ (in acetonitrile) by treating probe 2 (1 × 10⁵ M) with 1 equivalence of CuCl2 (Figure 6c,d)). In sharp contrast to the (m/z) = 583 observed for probe 2 only, an intense peak was observed at (m/z) = 634, which was attributed to the 2-Cu complex, as shown in Figure 6d.

4. Conclusions

In summary, (E)-4-(3,5-bis(benzo[d]oxazol-2-yl)-2,6-dihydroxystyryl)-1-benzylpyridin-1-ium iodide (2) was synthesized in suitable yields. Probe 2 exhibited excellent selectivity toward Cu2+ ions in solution due to the formation of the 2-Cu complex in 1:1 stoichiometry. The formation of the 2-Cu complex revealed a new absorption band at λabs ≈ 440 nm, and the ratiometric absorbance at (A440/A370) was successfully used for linear detection of Cu2+ in solution. The calculated LOD for detection of ratiometric absorbance was found to be 0.15 μM. The formation of the 2-Cu complex resulted in the quenching of fluorescence at 585 nm, and the relative fluorescence quenching (Io585/I585) also exhibited a linear relationship to the Cu2+ concentration in the solution. LOD for fluorescence quenching (Io585/I585)-based method was found to be 0.38 μM. The formation of the 2-Cu complex was confirmed by spectroscopic and mass spectroscopic analysis. Based on the spectroscopic data, it was concluded that the fluorescence quenching process in the 2-Cu complex occurs via both static and dynamic quenching mechanisms. Therefore, probe 2 will be a reliable and highly sensitive colorimetric and fluorometric sensor for detecting Cu2+ in solution efficiently.

Supplementary Materials

The following supporting information can be downloaded at: https://www.mdpi.com/article/10.3390/chemosensors10100382/s1, Figure S1: Characterization data; Table S1: Detection limit calculation; Figures S2–S5: Spectroscopic analysis data; Figure S6: Fluorescence lifetime determination.

Author Contributions

C.S.A. designed, synthesized, and characterized the probes. C.S.A., K.J.W. and Y.P. planned, designed, and supervised all experimental setups. B.U.R. conducted all spectroscopic analysis experiments and data collection. Y.L. contributed significantly toward acquiring low-temperature spectroscopic data and fluorescence quantum yield calculations. B.C. conducted fluorescence lifetime measurement experiments. C.S.A., K.J.W. and B.U.R. wrote the manuscript with feedback from all authors. All authors have read and agreed to the published version of the manuscript.

Funding

This research received no external funding.

Institutional Review Board Statement

Not applicable.

Informed Consent Statement

Not applicable.

Data Availability Statement

Not applicable.

Acknowledgments

Authors acknowledge Sujatha Hewage and M.D.P de Costa from The Department of Chemistry, University of Colombo, Sri Lanka. C.S.A. respectfully acknowledges and pays gratitude to H.D. Gunawardhana from the University of Colombo, Sri Lanka.

Conflicts of Interest

The authors declare no conflict of interest.

References

  1. Taki, M.; Wolford, J.L.; O’Halloran, T. V Emission Ratiometric Imaging of Intracellular Zinc: Design of a Benzoxazole Fluorescent Sensor and Its Application in Two-Photon Microscopy. J. Am. Chem. Soc. 2004, 126, 712–713. [Google Scholar] [CrossRef] [PubMed]
  2. Kwon, J.E.; Lee, S.; You, Y.; Baek, K.H.; Ohkubo, K.; Cho, J.; Fukuzumi, S.; Shin, I.; Park, S.Y.; Nam, W. Fluorescent Zinc Sensor with Minimized Proton-Induced Interferences: Photophysical Mechanism for Fluorescence Turn-on Response and Detection of Endogenous Free Zinc Ions. Inorg. Chem. 2012, 51, 8760–8774. [Google Scholar] [CrossRef]
  3. Abeywickrama, C.S.; Bertman, K.A.; Plescia, C.B.; Stahelin, R.V.; Pang, Y. Structural Effect on the Cellular Selectivity of an NIR-Emitting Cyanine Probe: From Lysosome to Simultaneous Nucleus and Mitochondria Selectivity with Potential for Monitoring Mitochondria Dysfunction in Cells. ACS Appl. Bio Mater. 2019, 2, 5174–5181. [Google Scholar] [CrossRef] [PubMed]
  4. Valeur, B.; Leray, I. Design Principles of Fluorescent Molecular Sensors for Cation Recognition. Coord. Chem. Rev. 2000, 205, 3–40. [Google Scholar] [CrossRef]
  5. Mizukami, S.; Nagano, T.; Urano, Y.; Odani, A.; Kikuchi, K. A Fluorescent Anion Sensor That Works in Neutral Aqueous Solution for Bioanalytical Application. J. Am. Chem. Soc. 2002, 124, 3920–3925. [Google Scholar] [CrossRef]
  6. Wencel, D.; Abel, T.; McDonagh, C. Optical Chemical PH Sensors. Anal. Chem. 2014, 86, 15–29. [Google Scholar] [CrossRef]
  7. Li, C.; Liu, S. Responsive Nanogel-Based Dual Fluorescent Sensors for Temperature and Hg2+ Ions with Enhanced Detection Sensitivity. J. Mater. Chem. 2010, 20, 10716–10723. [Google Scholar] [CrossRef]
  8. Khan, Z.G.; Patil, P.O. A Comprehensive Review on Carbon Dots and Graphene Quantum Dots Based Fluorescent Sensor for Biothiols. Microchem. J. 2020, 157, 105011. [Google Scholar] [CrossRef]
  9. Abeywickrama, C.S.; Li, Y.; Ramanah, A.; Owitipana, D.N.; Wijesinghe, K.J.; Pang, Y. Albumin-Induced Large Fluorescence Turn ON in 4-(Diphenylamino)Benzothiazolium Dyes for Clinical Applications in Protein Detection. Sens. Actuators B Chem. 2022, 368, 132199. [Google Scholar] [CrossRef]
  10. Hu, Q.; Yao, B.; Owyong, T.C.; Prashanth, S.; Wang, C.; Zhang, X.; Wong, W.W.H.; Tang, Y.; Hong, Y. Detection of Urinary Albumin Using a “Turn-on” Fluorescent Probe with Aggregation-Induced Emission Characteristics. Chem. Asian J. 2021, 16, 1245–1252. [Google Scholar] [CrossRef]
  11. Abeywickrama, C.S.; Bertman, K.A.; McDonald, L.; Alexander, N.; Dahal, D.; Baumann, H.J.; Salmon, C.R.; Tessier, C.; Wesdemiotis, C.; Konopka, M. Synthesis of Highly Selective Lysosome Markers by Coupling 2-(2′-Hydroxyphenyl) Benzothiazole (HBT) with Benzothiazolium Cyanine (Cy): The Impact of Substituents towards Selectivity and Optical Properties. J. Mater. Chem. B 2019, 7, 7502–7514. [Google Scholar] [CrossRef]
  12. Chen, W.-H.; Pang, Y. Excited-State Intramolecular Proton Transfer in 2-(2′,6′-Dihydroxyphenyl)Benzoxazole: Effect of Dual Hydrogen Bonding on the Optical Properties. Tetrahedron Lett. 2010, 51, 1914–1918. [Google Scholar] [CrossRef]
  13. Pang, Y.; Chen, W. Excited-State Intramolecular Proton Transfer in 2-(2′-Hydroxyphenyl)Benzoxazole Derivatives. In Hydrogen Bonding Transfer Excited State; Springer: Berlin/Heidelberg, Germany, 2011; Volume 2, pp. 747–760. [Google Scholar]
  14. Abeywickrama, C.S.; Pang, Y. Synthesis of Fused 2-(2′-Hydroxyphenyl) Benzoxazole Derivatives: The Impact of Meta-/Para-Substitution on Fluorescence and Zinc Binding. Tetrahedron Lett. 2016, 57, 3518–3522. [Google Scholar] [CrossRef]
  15. Abeywickrama, C.S.; Pang, Y. Fused Bis [2-(2′-Hydroxyphenyl) Benzoxazole] Derivatives for Improved Fluoride Sensing: The Impact of Regiochemistry and Competitive Hydrogen Bonding. Tetrahedron Lett. 2017, 58, 1627–1632. [Google Scholar] [CrossRef]
  16. Qinghui, C.; Medvetz, D.A.; Yi, P. A Polymeric Colorimetric Sensor with Excited-State Intramolecular Proton Transfer for Anionic Species. Chem. Mater. 2007, 19, 6421–6429. [Google Scholar] [CrossRef]
  17. Xu, Y.; Liu, Q.; Dou, B.; Wright, B.; Wang, J.; Pang, Y. Zn2+ Binding-Enabled Excited State Intramolecular Proton Transfer: A Step toward New near-Infrared Fluorescent Probes for Imaging Applications. Adv. Healthc. Mater. 2012, 1, 485–492. [Google Scholar] [CrossRef]
  18. Abeywickrama, C.S.; Pang, Y. Synthesis of a Bis [2-(2′-Hydroxyphenyl) Benzoxazole] Pyridinium Derivative: The Fluoride-Induced Large Spectral Shift for Ratiometric Response. New J. Chem. 2021, 45, 9102–9108. [Google Scholar] [CrossRef]
  19. Council, N.R. Health Effects of Excess Copper. In Copper in Drinking Water; National Academies Press: Cambridge, MA, USA, 2000. [Google Scholar]
  20. Sivaraman, G.; Iniya, M.; Anand, T.; Kotla, N.G.; Sunnapu, O.; Singaravadivel, S.; Gulyani, A.; Chellappa, D. Chemically Diverse Small Molecule Fluorescent Chemosensors for Copper Ion. Coord. Chem. Rev. 2018, 357, 50–104. [Google Scholar] [CrossRef]
  21. Golbedaghi, R.; Justino, L.L.G.; Ooshall, F.; Jamehbozorgi, S.; Abdolmaleki, M.; Fausto, R. A New Schiff Base Ligand as a Fluorescence Probe for Cu (II) Detection in Semi-Aqueous Solution: Synthesis, Characterization, Fluorescence and Mechanistic Insight. Inorg. Chim. Acta 2021, 528, 120623. [Google Scholar] [CrossRef]
  22. Warrier, S.B.; Kharkar, P.S. A Coumarin Based Chemosensor for Selective Determination of Cu (II) Ions Based on Fluorescence Quenching. J. Lumin. 2018, 199, 407–415. [Google Scholar] [CrossRef]
  23. Li, C.; Han, X.; Mao, S.; Aderinto, S.O.; Shi, X.; Shen, K.; Wu, H. A New, Highly Potent 1, 8-naphthalimide-based Fluorescence Turn-off Chemosensor Capable of Detecting Cu (II) Ions in Real-world Water Samples. Color. Technol. 2018, 134, 230–239. [Google Scholar] [CrossRef]
  24. Zhang, Y.; Li, L.; Wang, J.; Jia, L.; Yang, R.; Guo, X. A 4,5-Quinolimide-Based Fluorescent Sensor for Sequential Detection of Cu2+ and Cysteine in Water and Living Cells with Application in a Memorized Device. Spectrochim. Acta Part A Mol. Biomol. Spectrosc. 2020, 230, 118030. [Google Scholar] [CrossRef] [PubMed]
  25. Luo, M.; Di, J.; Li, L.; Tu, Y.; Yan, J. Copper Ion Detection with Improved Sensitivity through Catalytic Quenching of Gold Nanocluster Fluorescence. Talanta 2018, 187, 231–236. [Google Scholar] [CrossRef] [PubMed]
  26. Zhou, Z.; Tang, H.; Chen, S.; Huang, Y.; Zhu, X.; Li, H.; Zhang, Y.; Yao, S. A Turn-on Red-Emitting Fluorescent Probe for Determination of Copper (II) Ions in Food Samples and Living Zebrafish. Food Chem. 2021, 343, 128513. [Google Scholar] [CrossRef] [PubMed]
  27. Guo, Z.; Wang, X.; Wei, P.; Gao, Y.; Li, Q. Highly Selective Fluorescent Probe for the Detection of Copper (II) and Its Application in Live Cell Imaging. J. Anal. Methods Chem. 2019, 2019, 8130767. [Google Scholar] [CrossRef]
  28. Makowska, J.; Żamojć, K.; Wyrzykowski, D.; Wiczk, W.; Chmurzyński, L. Copper (II) Complexation by Fragment of Central Part of FBP28 Protein from Mus Musculus. Biophys. Chem. 2018, 241, 55–60. [Google Scholar] [CrossRef]
  29. Jiao, Y.; Zhou, L.; He, H.; Yin, J.; Gao, Q.; Wei, J.; Duan, C.; Peng, X. A Novel Rhodamine B-Based “off-on’’fluorescent Sensor for Selective Recognition of Copper (II) Ions. Talanta 2018, 184, 143–148. [Google Scholar] [CrossRef]
  30. Żamojć, K.; Kamrowski, D.; Zdrowowicz, M.; Wyrzykowski, D.; Wiczk, W.; Chmurzyński, L.; Makowska, J. A Pentapeptide with Tyrosine Moiety as Fluorescent Chemosensor for Selective Nanomolar-Level Detection of Copper (II) Ions. Int. J. Mol. Sci. 2020, 21, 743. [Google Scholar] [CrossRef]
  31. Lakowicz, J.R. Principles of Fluorescence Spectroscopy; Springer Science: Berlin/Heidelberg, Germany, 2006; ISBN 0387312781. [Google Scholar]
  32. Lakowicz, J.R. Quenching of Fluorescence. In Principles of Fluorescence Spectroscopy; Springer Science: Berlin/Heidelberg, Germany, 1983; pp. 257–301. [Google Scholar] [CrossRef]
  33. Zu, F.; Yan, F.; Bai, Z.; Xu, J.; Wang, Y.; Huang, Y.; Zhou, X. The Quenching of the Fluorescence of Carbon Dots: A Review on Mechanisms and Applications. Microchim. Acta 2017, 184, 1899–1914. [Google Scholar] [CrossRef]
  34. Fraiji, L.K.; Hayes, D.M.; Werner, T.C. Static and Dynamic Fluorescence Quenching Experiments for the Physical Chemistry Laboratory. J. Chem. Educ. 1992, 69, 424. [Google Scholar] [CrossRef]
  35. Marton, A.; Clark, C.C.; Srinivasan, R.; Freundlich, R.E.; Narducci Sarjeant, A.A.; Meyer, G.J. Static and Dynamic Quenching of Ru (II) Polypyridyl Excited States by Iodide. Inorg. Chem. 2006, 45, 362–369. [Google Scholar] [CrossRef] [PubMed]
  36. Keizer, J. Nonlinear Fluorescence Quenching and the Origin of Positive Curvature in Stern-Volmer Plots. J. Am. Chem. Soc. 1983, 105, 1494–1498. [Google Scholar] [CrossRef]
  37. Tanwar, A.S.; Parui, R.; Garai, R.; Chanu, M.A.; Iyer, P.K. Dual “Static and Dynamic” Fluorescence Quenching Mechanisms Based Detection of TNT via a Cationic Conjugated Polymer. ACS Meas. Sci. Au 2021, 2, 23–30. [Google Scholar] [CrossRef]
  38. Tikhonova, T.N.; Shirshin, E.A.; Budylin, G.S.; Fadeev, V.V.; Petrova, G.P. Assessment of the Europium (III) Binding Sites on Albumin Using Fluorescence Spectroscopy. J. Phys. Chem. B 2014, 118, 6626–6633. [Google Scholar] [CrossRef]
  39. Da Silva, J.C.G.; Machado, A.; Pinto, M.S. Study of the Complexation of Cu (II) by Fulvic Acids Extracted from a Sewage Sludge and Its Compost. Fresenius. J. Anal. Chem. 1997, 357, 950–957. [Google Scholar] [CrossRef]
Scheme 1. The designing and Synthesis of HBO-based metal ion sensors.
Chemosensors 10 00382 sch001
Scheme 2. ESIPT-coupled ICT in probe 2.
Chemosensors 10 00382 sch002
Figure 1. Absorbance (a) and emission (b,c) of probe 2 (1 × 10⁻⁵ M) in different solvents at room temperature and the comparison of room-temperature and low-temperature (−188 °C) fluorescence of probe 2 (1 × 10⁻⁶ M) in ethanol (d).
Chemosensors 10 00382 g001
Figure 2. Absorbance (a) and emission (b) spectra recorded for probe 2 (1 × 10⁻⁵ M) in acetonitrile upon addition of 10 equivalence of aqueous metal ions at room temperature.
Chemosensors 10 00382 g002
Figure 3. (a)—Absorbance spectra recorded for probe 2 (1 × 10⁻⁵ M) in acetonitrile at room temperature upon addition of a 10 mM Cu2+ solution (in water). The red scatter plot insect shows the absorbance measured at 440 nm during the spectroscopic titration of probe 2 with Cu2+ and the green scatter plot insect shows the absorbance measured at 370 nm during the spectroscopic titration. The green dashed vertical line highlights the absorbance reading at 1:1 (probe 2: Cu2+) stoichiometry. (b)—The plot of ratiometric absorbance (λ440370) recorded as a function of Cu2+ concentration. (c)—Emission spectra recorded for probe 2 (1 × 10⁻⁵ M) in acetonitrile at room temperature upon addition of a 10 mM Cu2+ solution (in water). (d)—The plot of fluorescence quenching at 585 nm (I585/Io585) recorded as a function of Cu2+ concentration.
Chemosensors 10 00382 g003
Figure 4. (a) Stern–Volmer plot generated for fluorescence quenching in probe 2 by plotting (Fo/F) at 585 nm as a function of Cu2+ concentration. (b) Modified logarithmic-type Stern–Volmer plot for determination of the stability and the binding stoichiometry of the 2-Cu complex.
Chemosensors 10 00382 g004
Figure 5. Absorption (a) and emission (b) spectra recorded for 2-Cu complex (in acetonitrile) upon addition of EDTA (10 mM in water at room temperature). 2-Cu complex was prepared by the addition of 1 equivalence of CuCl2 (10 mM in water) into probe 2 (1 × 10⁻⁵ M) in acetonitrile. (c,d) represent the absorption (c) and emission (d) spectra recorded for probe 2 (1 × 10⁻⁵ M) in acetonitrile during the addition of 10 equivalence of various anions (10 mM in water) at room temperature.
Chemosensors 10 00382 g005
Figure 6. (a)—The evaluation of the stability of the 2-Cu complex (10 µM in acetonitrile) at room temperature. (b)—The analysis of the 2-Cu complex (10 µM in acetonitrile) upon addition of 50 equivalence of aqueous NaOH at room temperature. Figures (c,d) represent the ESI (TOF) mass spectroscopic analysis of the probe 2 (c) and 2-Cu complex (d).
Chemosensors 10 00382 g006
Table 1. Spectroscopic properties of probe 2.
SolventHexaneDCMCHCl3ACNDMSOEtOHMeOHWater
λabs (nm)390386383369382372370366
λem (nm)560582568585515586590592
∆λ (nm)170196185216133213220226
φfl<0.0010.0500.0570.0720.0160.0640.052<0.002
ε (M−1 cm−1)338535,60028,00330,77335,46129,79527,7573908
Publisher’s Note: MDPI stays neutral with regard to jurisdictional claims in published maps and institutional affiliations.

