Article

An Automated, Self-Powered, and Integrated Analytical Platform for On-Line and In Situ Air Quality Monitoring

by
Danielle da Silva Sousa
1,
Vanderli Garcia Leal
1,
Gustavo Trindade dos Reis
1,
Sidnei Gonçalves da Silva
1,
Arnaldo Alves Cardoso
2 and
João Flávio da Silveira Petruci
1,*
1
Institute of Chemistry, Federal University of Uberlândia (UFU), Uberlândia 38400-902, Brazil
2
Institute of Chemistry, São Paulo State University (UNESP), Araraquara 14800-060, Brazil
*
Author to whom correspondence should be addressed.
Chemosensors 2022, 10(11), 454; https://doi.org/10.3390/chemosensors10110454
Submission received: 7 October 2022 / Revised: 26 October 2022 / Accepted: 31 October 2022 / Published: 2 November 2022
(This article belongs to the Special Issue Green Analytical Chemistry: Current Trends and Future Developments)

Abstract

:
Air quality monitoring networks are challenging to implement due to the bulkiness and high prices of the standard instruments and the low accuracy of most of the described low-cost approaches. This paper presents a low-cost, automated, self-powered analytical platform to determine the hourly levels of O3 and NO2 in urban atmospheres. Atmospheric air was sampled at a constant airflow of 100 mL min−1 directly into vials containing 800 µL of indigotris sulfonate and the Griess–Saltzman reagent solutions for ozone and nitrogen dioxide, respectively. The analysis holder, containing a light-emitting diode and a digital light sensor, enabled the acquisition of the analytical signal on-site and immediately after the sampling time. The data were transmitted to a laptop via Bluetooth, rendering remote hourly monitoring. The platform was automated using two Arduino Uno boards and fed with a portable battery recharged with a solar panel. The method provided a limit of detection of 5 and 1 ppbv for O3 and NO2, respectively, which is below the maximum limit established by worldwide regulatory agencies. The platform was employed to determine the levels of both pollutants in the atmosphere of two Brazilian cities, in which one of them was equipped with an official air quality monitoring station. Comparing the results of both techniques revealed suitable accuracy for the proposed analytical platform. Information technology (IT) allied to reliable chemical methods demonstrated high potential to create air quality monitoring networks providing valuable information on pollutants’ emissions and ensuring safety to the population.

1. Introduction

Ozone (O3) is a secondary pollutant mainly found in urban scenarios. Its background concentration has been increasing since the industrial revolution [1]. The tropospheric ozone originates from photochemical reactions involving NO, NO2, and volatile organic compounds [2]. Nitrogen dioxide (NO2) is primarily emitted into the atmosphere from fuel and biomass burning processes and is also generated from the oxidation of nitric oxide (NO) [3]. This cycle of reactions occurs in sunlight under light irradiance at wavelengths less than 400 nm (Equations (1)–(3)). Usually, the concentration of ozone is low in the early morning and increases up to the early afternoon. After reaching its maximum local value, it decreases again [4]. Contrarily, the concentration of NO2 is higher in the morning and after sunset [5]. However, the typical behavior of these gases can undergo changes caused by atmospheric factors. The action of local winds and air masses can transport both gases through the atmosphere, and unusual concentrations can be detected throughout the day. Therefore, monitoring NO2 and O3 concentrations is essential as these are vital elements in the chemistry of urban atmospheres.
NO 2 + h v   ( λ < 430   nm ) NO + O
  O + O 2 O 3
NO + O 3 NO 2 + O 2
High ozone and nitrogen dioxide concentrations can cause severe adverse effects on human health, vegetation, crops, and materials. The United States Environmental Protection Agency (EPA) strengthened the ground-level ozone standard to 70 ppbv (130 µg m−3), averaged over 8 h [6]. Previously, the National Ambient Air Quality Standard (NAAAQS) replaced the 1-h to the 8-h standard [7]. A concentration of ozone higher than 100 ppbv (195 µg m−3) can be unhealthy for sensitive groups, and the significant harm level is 600 ppbv, averaged over 2 h. Therefore, many cities provide the hourly concentration of ozone to protect the population in urban areas. For NO2, EPA established a 1-h level at the concentration of 100 ppbv (240 µg m−3) to protect public health by limiting peoples’ exposure to short-term peak concentrations of air pollution [8]. NO2 above 150 ppbv can be dramatically unhealthy, and everyone should limit prolonged outdoor air exposure. The other worldwide agencies responsible for controlling urban air quality have followed the EPA’s recommendation.
Due to the high pollutant proprieties and their formation/degradation dependence, ozone and nitrogen dioxide levels must be monitored to access the air quality of cities in order to ensure the safety of people in outdoor environments and to evaluate the results of emission control policies. However, over half of the world’s population has no access to official data on air quality, even though 90% of the population breathes air containing high levels of pollutants [9]. Many questions remain unable to be answered, such as: how can the analytical sciences provide data for quantifying pollutants’ impact on climate, health, and crop productivity? The instruments used for determining ground levels of O3 and NO2 enable real-time quantification of the pollutant. However, they tend to be bulky, expensive, and unsuitable for high-spread applications, especially for cities with low budgets. Thus, one of the critical elements in demanding policies to reduce air pollution is to develop low-cost and portable analytical platforms.
The development of low-cost chemical and physical sensors for air quality monitoring has been pursued using a variety of approaches [10,11,12]. Solid-state sensors can be classified as metal oxide (MOX) semiconductors (e.g., Aeroqual Air Quality Devices) and amperometric sensors [13]. The interactions with the analyte lead to changes in the device’s electrical conductivity or output current. The use of solid-state sensors for air pollutants detection has the advantages of high sensitivity, rapid response time, low cost, lightweight, and low power consumption [14]. Additionally, these sensors are easily attached to electronic devices to store and transmit the obtained data. In this sense, many recently published papers have proposed deploying solid-state sensors to build an automated air quality network [11,15,16,17]. The main drawbacks of MOX sensors rely on the operating temperature (usually higher than 200 °C), the time required to achieve signal stability, the influence of relative humidity variations, and the lack of calibrations [14].
Passive diffusion sampling followed by either colorimetric, electrochemical, or chromatographic determination has been employed for gas sensing [18,19,20]. The passive samplers must be positioned in the sampling spot before each analysis, and after the sampling time—usually 8 h—the extraction/measurement is performed in the lab. Despite its inherent low cost, this approach is highly time and effort-consuming and allows the determination of the pollutant levels only as they relate to the averaged 8 h of exposure [21]. Moreover, the need for extraction procedures and relatively long sampling periods makes it unsuitable for automatization and in situ responses.
Wet indirect chemical methods are an excellent alternative to analyze reactive gaseous analytes such as ozone and nitrogen dioxide. In the sampling step, the air is bubbled into a solution of a specific reagent with constant airflow. The analyte–reagent interaction changes an optical or electrochemical property, resulting in a measurable analytical signal proportional to the analyte concentration. The selectivity and sensitivity of this approach are due to the interaction between the analyte and reagent and the quality of the analytical signal. The sensitivity enhancement can be obtained by optimizing the mass transference of the analyte from the gas to the liquid phase (i.e., achieving the optimum airflow), extending the sampling time, and eliminating dilution steps by measuring the variation in the analytical signal in the sampling flask. Furthermore, the formation of small bubbles facilitates the contact of the gaseous analyte with the reagent. This approach increases miniaturization by decreasing the sampling device and the reagent volume, as previously demonstrated [22].
The “smart” concept—such as smart cities and houses—comprises a device designed to collect and transmit data from a unique sensor or a variety of sensors, providing information that can be used for quick management of resources [15,17,23]. This concept originated from the internet of things (IoT) principles, in which the interconnection of multiple machines and computing devices through the internet is employed [24]. The development of analytical platforms using the IoT principles is called the Internet of the Analytical Things (IoAT). This approach has been used to address complex analytical challenges in many scenarios, such as environmental monitoring [17], clinical diagnostics, and food quality control [25]. In this sense, the use of the Arduino microcontroller board to design automatized analytical platforms is facilitated due to the integration of multiple sensors and devices for data transmission. Optical sensors are the most common Arduino-based detection employed in IoAT devices because of their easy-to-use hardware and software, portability, and robustness. By interfacing a Bluetooth module with an Arduino board, it is possible to send and receive data wirelessly to any computer or smartphone [24].
In this study, we describe a low-cost, fully automated, self-powered, and portable analytical platform to determine the hourly levels of O3 and NO2 in the atmosphere. Colorimetric reactions were used for each analyte, and the transmittance/absorbance was measured using a specific LED and a digital light sensor. The obtained concentration is immediately displayed after the sampling time. All the periphericals were operated using an Arduino board, enabling the automatization and data transmission of the results. To the best of our knowledge, this is the first report on applying a self-powered device for the outdoor monitoring of gaseous species using the wet chemical method approach.

2. Experimental

2.1. Reagents and Materials

Indigotris sulfonate (Sigma-Aldrich, St. Louis, MO, USA) stock solution with a concentration of 2 mmol L−1 was prepared by solubilizing an appropriate mass of the reagent in phosphate buffer with a pH of 2.0. The working solution of a concentration of 0.05 mmol L−1 was prepared by dilution. The Griess–Saltzman reagent for NO2 was prepared by dissolving 2.5 g of sulfanilic acid (Carlo Erba, Cornaredo, Italy) in a solution containing 300 mL of water, 70 mL of glacial acetic acid (Maia, Sao Paulo, Brazil), and 10 mg of N-(1-naphthyl)-ethylenediamine (Merck, Kenilworth, NJ, USA). The final volume was adjusted to 0.5 L with deionized water (Milli-Q system, Millipore, Burlington, MA, USA). Both solutions were stored in amber flasks and kept at 4 °C and can be used for one month.

2.2. Preparation of Standard Gaseous Solutions of O3 and NO2

The calibration and optimization of the analytical platform were performed using standard gaseous solutions of O3 and NO2. Compressed air was purified by passing the air through two columns containing silica gel and potassium iodide (KI). Flowmeters (Cole Palmer, Vernon Hills, IL, USA) were previously calibrated using a primary air calibrator (Gilibrator-2, Sensidyne, St. Petersburg, FO, USA) and used to regulate the airflows accordingly. The standard gaseous solutions systems are represented schematically in Figure S1. For ozone, airflows ranging from 50 to 2500 mL min−1 were directed through a germicide UV lamp using a lab-made gas flask, enabling air contact with the radiation at 185 nm. The ozone concentrations were standardized using a primary ozone meter instrument (model 49C, Thermo Environmental Instruments Inc., Franklin, MA, USA) positioned at the end of the generation system. With the airflow used, a range of 40 to 135 ppbv of ozone was obtained.
For nitrogen dioxide, airflows ranging from 10 to 2000 mL min−1 were directed through a lab-made flask containing a NO2 permeation tube (VICI Metronics, Santa Clara, CA, USA) with a certified permeation rate of 81.25 ng min−1 when kept at a constant temperature (35 °C). With the airflow used, a range of 2 to 250 ppbv of nitrogen dioxide was obtained.

2.3. Analytical Platform for Gas Monitoring

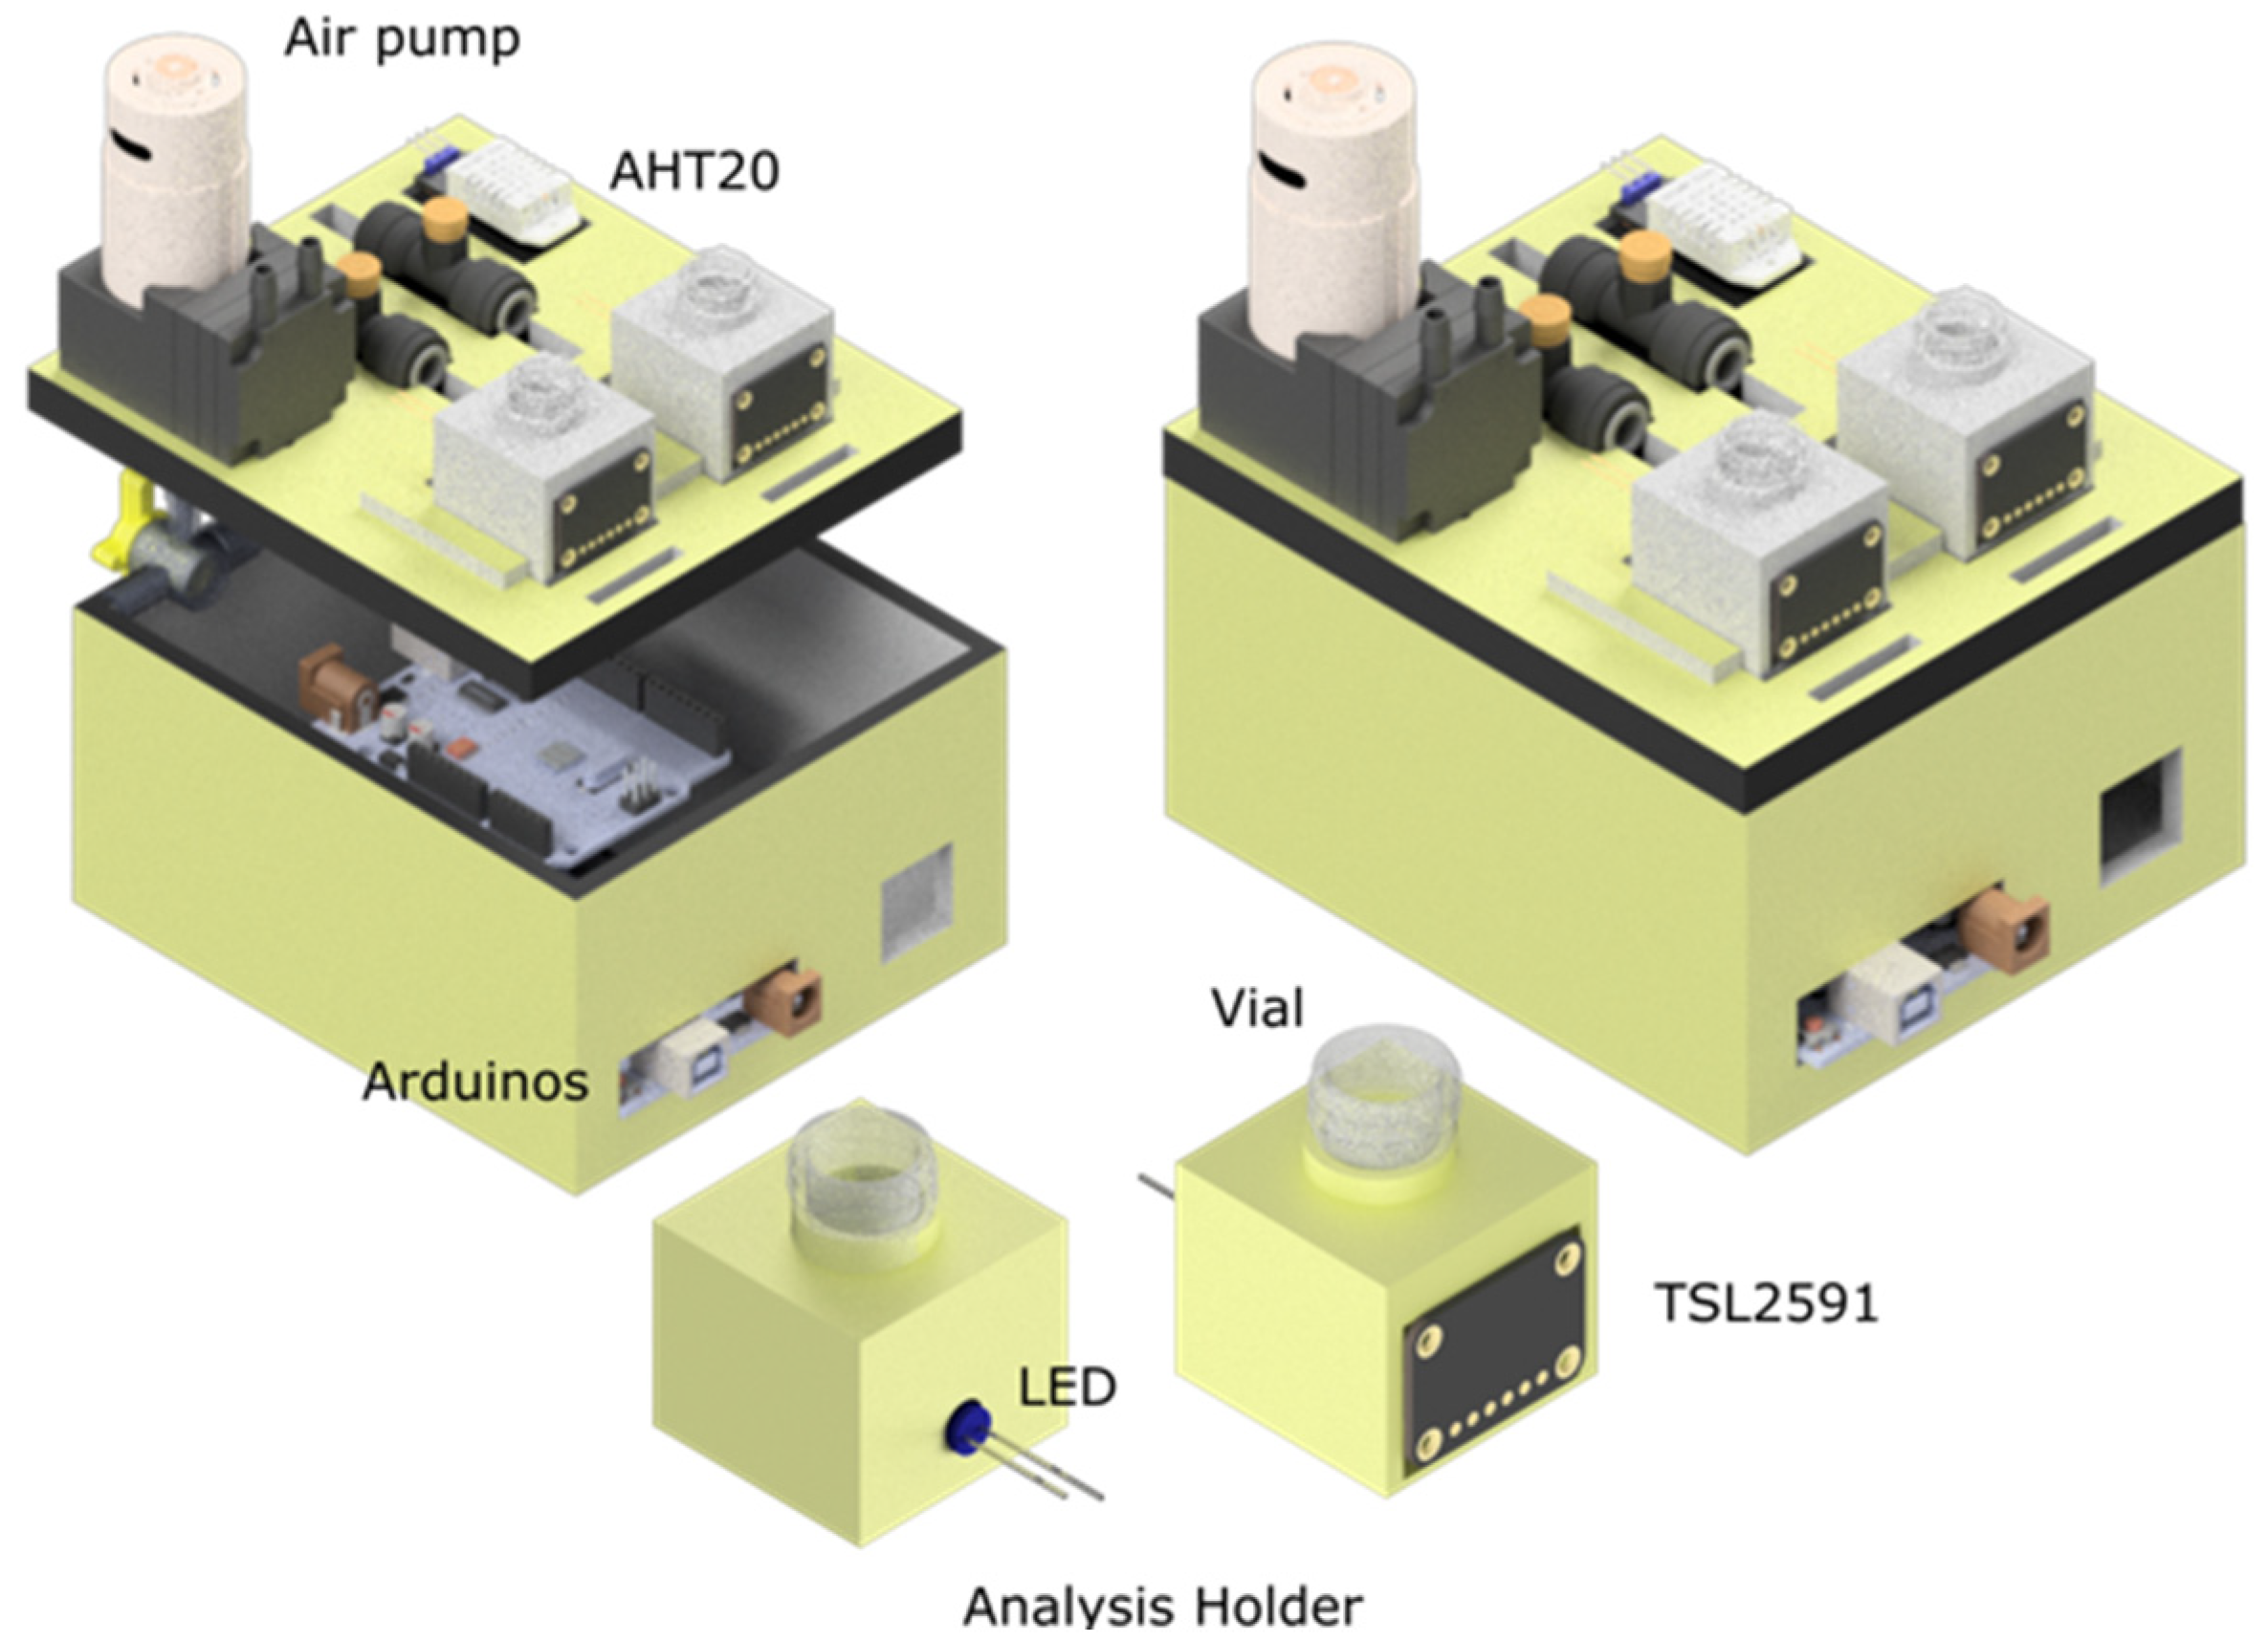
The integrated analytical platform was conceived using CAD software (Autodesk Inventor) and fabricated by a 3D printer (model A2 Core, GTMax, Americana, Brazil) using ABS as a thermoplastic filament. It contains two rectangular structures with dimensions of 120 × 120 × 20 mm and 120 × 120 × 60 mm for the top and bottom sides, respectively. The top side contains the two analysis holders, tubes and valves, a 5 V mini pump, a digital temperature/humidity sensor (AHT20, Adafruit, New York, NY, USA), and a 2.4 GHz Bluetooth module (RS232, HC-05). This part fits on the bottom side, accommodating two Arduinos Uno boards (Arduino, Turin, Italy), a portable rechargeable lithium-ion battery (5 V, 10,000 mAh), and cables. Additionally, a solar panel is externally positioned to provide 5 V to recharge the battery. Figure 1 presents the scheme of the proposed platform.
The analysis holder consists of a rectangular structure with dimensions of 30 × 30 × 30 mm, with a cylindric hole with a diameter of 12.5 mm and 25 mm deep through the device in which to place the vial containing the reagent. In front of one side is placed a hole of 5.5 mm to hold the LED (5 mm), and the digital light sensor (TSL2591, Adafruit, NY, USA) is positioned at 180° in relationship to the LED. For each holder, a different LED was used: orange and green LEDs with maximum emissions centered at 590 and 525 nm were employed for ozone (i.e., indigo) and nitrogen dioxide (i.e., Griess–Saltzman), respectively. The 3D model of the analytical platform is presented in Figure 2.
The LEDs were shined using a resistor-based circuitry (R = 300 ohm) attached to the Arduino, providing a constant current of 17 mA. The current generated by the sensors’ photodiodes is converted into a digital output by the integrated analogic-to-digital (ADC) circuitry representing the light intensity at the visible spectra range. The devices were attached and controlled by two Arduino Uno boards using the library provided by the manufacturer. The detector’s operational settings under optimized conditions were integration time of 200 ms and 1× gain (low). Additionally, the light sensors can continuously send the signals’ values to an Android app (Bluetooth Terminal HC-05, MightyIT, London, UK) or a laptop via Bluetooth. The complete electric circuit scheme is demonstrated in Figure S2.

2.4. Analysis Protocol

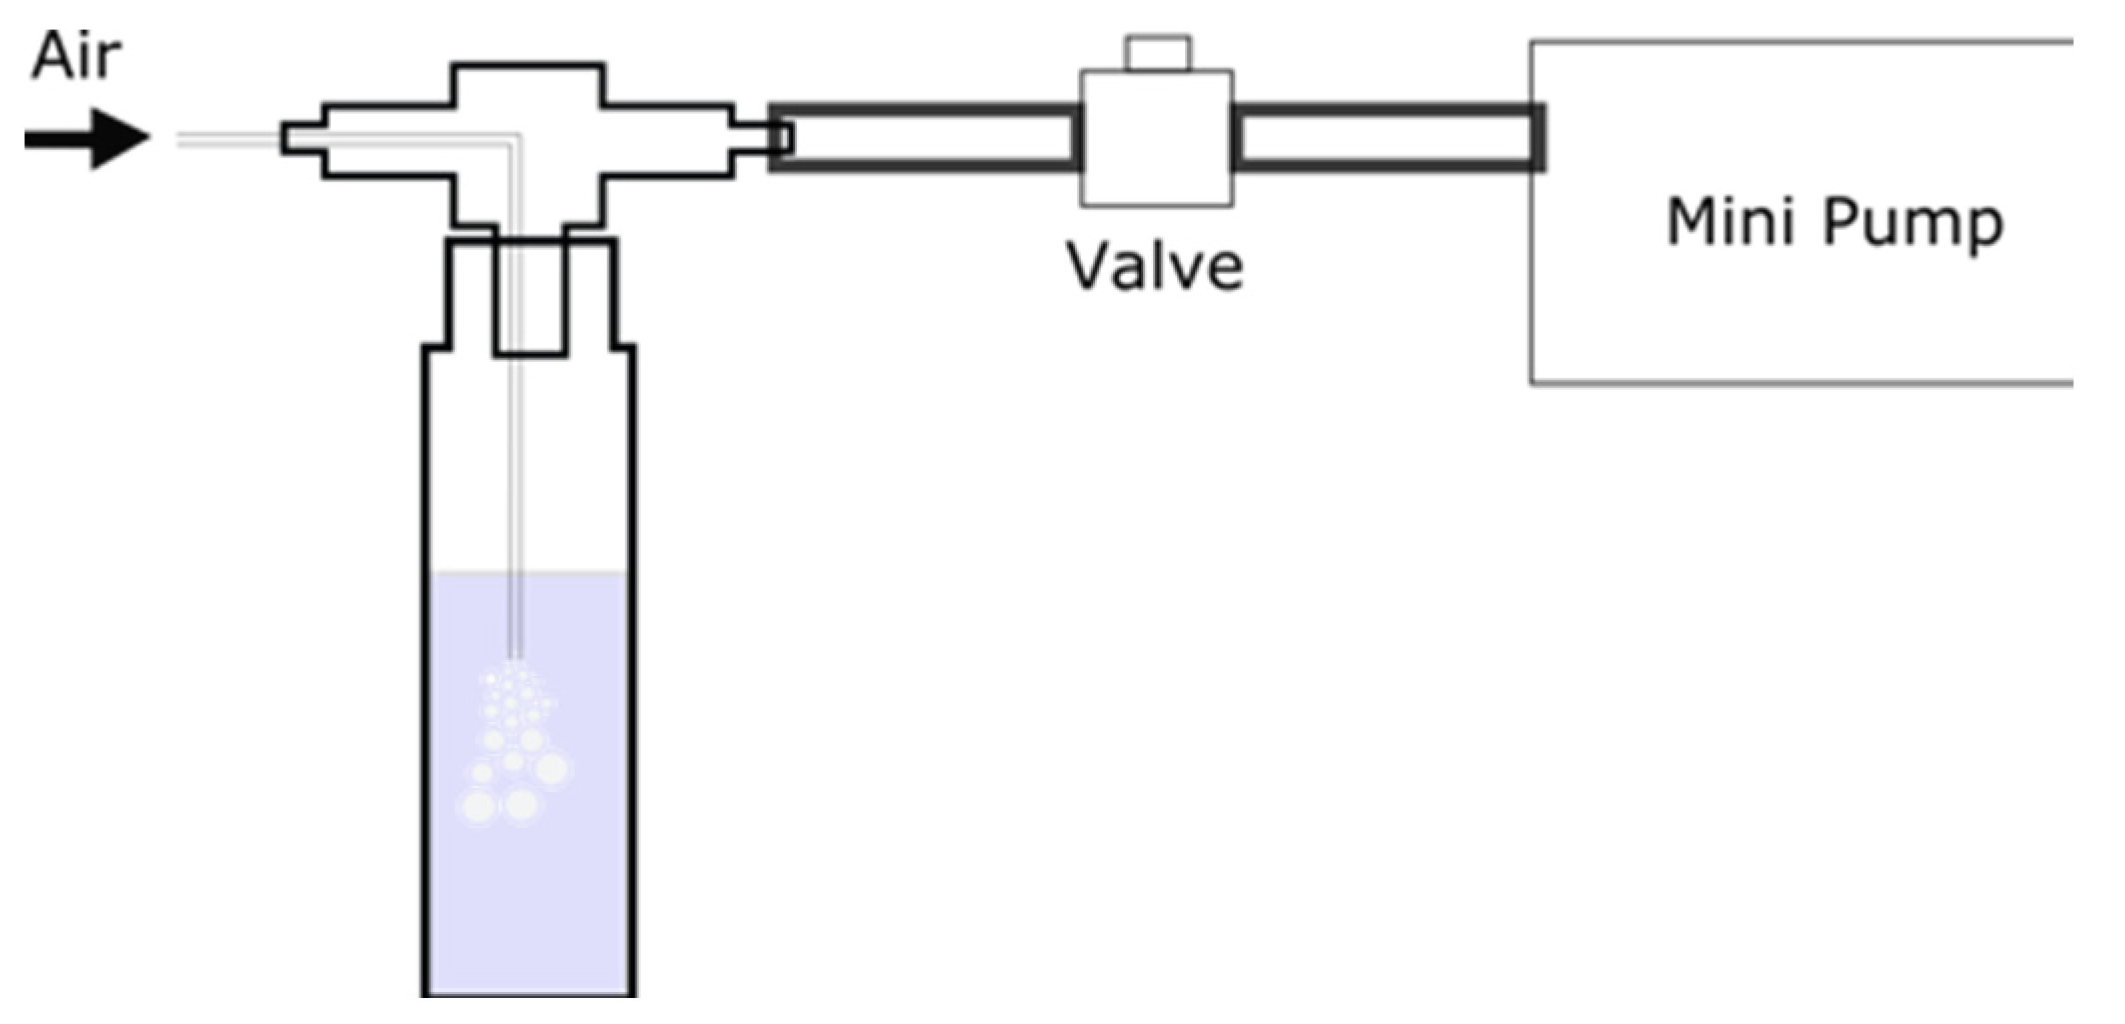
To begin, 800 µL of each reagent (i.e., indigo or Griess–Saltzman) was transferred to a 1.5 mL HPLC vial and inserted into each analysis holder. A Teflon tube of 2 mm in diameter was inserted into the vial capped with a three-way connector to enable air bubbling into the reagent. It is important to note that the bubbling was performed using the “sucking” mode of the pump to prevent the air from contacting the pump material prior to sampling (Figure 3). Then, the LED was switched on for 60 s, and the light intensity was measured for 10 s, obtaining the averaged initial intensity (II). After that, the mini pump was activated, enabling the atmospheric air sampling in both analysis holders with a constant flow of 100 mL min−1 each for 60 min. After the sampling time, the mini pump was switched off and the final light intensity (IF) was averaged for 10 s. The initial and final absorbances for each analysis are automatically calculated as the logarithm ratio of the signal and the blank, considering the light intensity obtained for a water solution (I0). It is recommended to deploy the device under the protection of sunlight, to avoid fast degradation of the indigo dye. Furthermore, it is advisable to change the reagent after each analysis.

3. Results and Discussion

3.1. Choice of the Reagents and Evaluation of the Performance of the Detection Device

LED-based photometers represent an excellent alternative to building portable and low-cost devices while still rendering suitable sensitivity and reproducibility [26]. According to the Lambert–Beer law, the absorbance is linear with the chromophore concentration when monochromatic radiation is employed. LEDs have emission bands of, typically, 20 or 30 nm in width. Therefore, a good match between the emission band of the LED with the absorbance bands of chromophores is required to achieve suitable linearity [27]. Next, the detection device’s performance was evaluated using two different reagents to be further employed for ozone and nitrogen dioxide determinations.

3.2. Ozone

Indigotris sulfonate (ITS) has proven to be an excellent reagent for selective ozone determination [20,28,29]. ITS has a strong absorption band with a maximum peak centered at 600 nm (ε ~ 20 × 103 L mol−1 cm−1) that quickly decreases after contact with ozone. According to the reaction stoichiometry, each mol of the dye is consumed by one mol of ozone. Initially, the relation of the absorbance measured using the proposed detection device was obtained using a LED emitting at 590 nm and the TSL2591 as a digital light detector. This light detector allows the signal gain to be set at four levels: 1, 25, 428, and 9876×, where the higher values are recommended for low light situations. Additionally, the integration time can be set in the range of 100 to 600 ms. As the light-emitting diode has high light power intensity, the gain was adjusted at 1× and the integration time at 100 ms. The TSL2591 light sensor provides light intensity output as LUX. The logarithm ratio of the light intensity measured from a blank solution (IB) and the indigo solution (IS) was considered as the absorbance (A = log (IB/IS)).
The linearity of the sensor’s response against different concentrations of ITS was observed in the range of 5 to 100 µmol L−1. For each concentration, an average of three independent measurements was calculated. As demonstrated in Figure S3a, the obtained linearity in the evaluated range was excellent (r2 = 0.9997), proving that the detection device provides a linear response against different concentrations of indigo and, therefore, can be used for further experiments.

3.3. Nitrogen Dioxide

The Griess–Saltzman reaction is widely employed for the colorimetric determination of nitrite ions due to the highly selective and sensitive reaction with sulfanilic acid and N-(1-naphthyl)-ethylenediamine to produce an azo dye with a maximum absorbance peak centered at 550 nm (ε = 5.24 × 10⁴ L mol−1 cm−1) [22,30]. Herein, the relationship between the analytical signal (absorbance), with nitrite concentrations in the range of 1 to 100 µmol L−1 using a LED emitting at 525 nm, was evaluated. For each concentration, an average of three independent measurements was calculated. As seen in Figure S3b, a linear relation was obtained in the evaluated range (r2 = 0.9939), indicating that the detection device is suitable for quantifying the dye produced after the reaction of NO2 and the Griess–Saltzman reagent. Table 1 summarizes the analytical parameters obtained by both reagent evaluations.

3.4. Evaluation of Zero Air Bubbling in the Analytical Signal

The analytical procedure for quantifying both pollutants is based on the bubbling of atmospheric air into the vial containing 800 µL of the reagent for a defined sampling time and reading the resulting signal from the color variation in the solution. A sampling time of 1 h was initially set, since most air quality control agencies establish the level limits based on 1 h of exposure and release hourly bulletins regarding the air quality of cities. Additionally, an enhancement of detectability can be reached by increasing the sampling time. On the other hand, higher sampling times combined with higher airflows can promote solvent evaporation, resulting in a decrease in sensitivity and poor reproducibility, leading to analytical errors. The ITS method for ozone determination is based on the decrease in absorbance, whereas the NO2 method is based on the increase in absorbance after the sampling time.
The following procedure was used to evaluate the effect of solvent evaporation: the vial was filled with 1 mL of the indigo solution with a concentration of 0.05 mmol L−1, kept at 30 °C and bubbled with zero air for 60 min with the airflow ranging from 20 to 100 mL min−1 at 25, 30, and 35 °C. The masses of the vial before and after the air bubbling were weighed using a balance with a sensitivity of 0.1 mg. The evaporated volume was calculated considering the water density of 0.997 kg m−3. With an airflow of 100 mL min−1, the maximum volume loss represented 3.3% of the initial volume of 800 µL of the reagent at 35 °C. This loss may not be significant for a sampling time of 60 min compared to other sources of errors.
Additionally, the absorbances before and after zero air bubbling were measured to verify the effect of solvent evaporation on the final absorbance. The air was passed through a KI column to eliminate the presence of ozone. An absorbance increase of 9.1 ± 1.1 mAU (n = 5) was observed, indicating that solvent evaporation affects the absorbance of the indigo solution when air without ozone is bubbled. This value was considered a blank signal and was subtracted from the final absorbance obtained when the ozone was determined (Equation (4)).
A b s O z o n e = ( log I 0 I F log I 0 I I ) 0.009
where I0 = light intensity of a blank (water), IF = light intensity of indigo solution after air sampling, and II = light intensity of indigo solution before air sampling
The same procedure was performed using the Griess–Saltzman reagent; however, no absorbance variation was observed after 1 h of zero air bubbling. The Griess–Saltzman reaction results in a dye with maximum absorbance at 590 nm and, therefore, the analytical signal for the determination of NO2 is simply the measured absorbance after the sampling time (Equation (5)).
A b s N O 2 = log I 0 I F

3.5. Evaluation of Airflow and Sampling Time

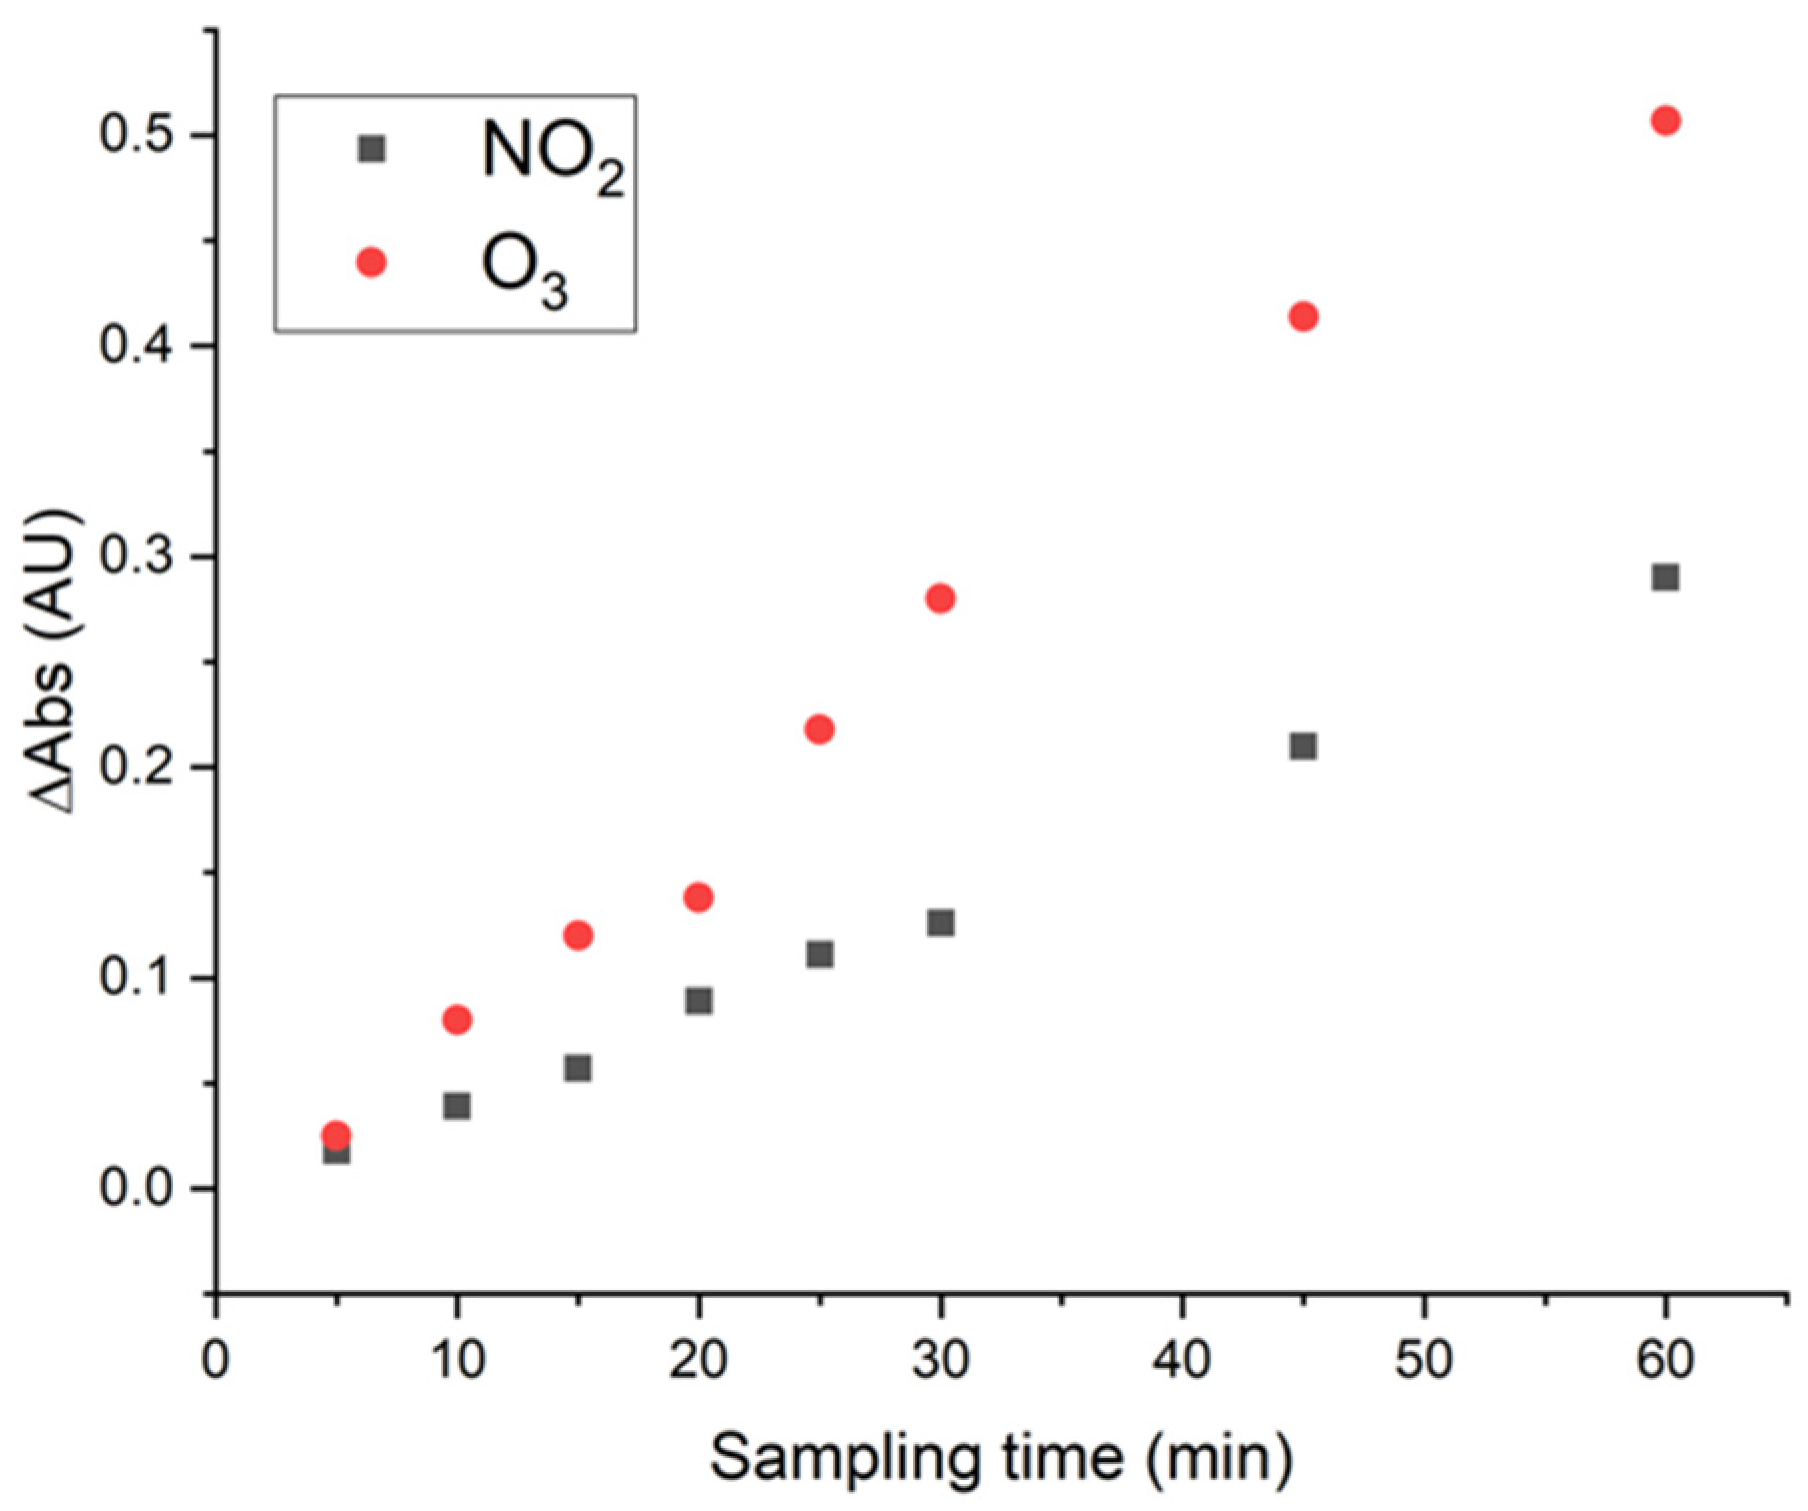
The influence of the sampling time on the analytical signal was evaluated. For this experiment, 70 ppbv of ozone and 50 ppbv of NO2 with airflows at 100 mL min−1 were bubbled into the vials containing 800 µL of each reagent for 60 min. The absorbances of the solutions were measured every 15 min, and the analytical signal was calculated by subtracting them from the respective initial absorbance (t = 0). As shown in Figure 4, the sampling time of 60 min can be used without loss of trapping efficiency, as the signal continuously increases.
Then, the effect of the sampling airflow on the analytical signal was evaluated in the range of 25 to 100 mL min−1. Although higher airflows could enhance the trapping efficiency, we verified that airflows higher than 100 mL min−1 resulted in the spilling of the reagent solution from the vial. The sampling airflow was evaluated using ozone with a concentration of 70 ppvb with a sampling time of 60 min. In the considered range, the analytical signal increased with the airflow (Figure 5), indicating that airflow of 100 mL min−1 provides a higher trapping efficiency of the gaseous analyte.

3.6. Calibration with Standard Gaseous Solutions

Both methods are based on the reaction of the gaseous analyte with a specific reagent resulting in either a decrease (indigo/ozone) or increase (GS/nitrogen dioxide) in the absorbance. Therefore, the quantification is obtained by relating the absorbance of the reaction product with the gaseous analyte’s concentration. Herein, the calibration was performed by measuring the analytical signal produced by the optimized sampling procedure using standard gaseous solutions of the analytes to achieve more accurate and reliable results. The sampling airflow of 100 mL min−1 for 60 min was used. Linear relations between the analytical signal and concentration were found for both gases in the range of 40 to 130 and 3 to 200 ppbv of O3 and NO2, respectively. In both cases, the lowest concentration value is below the maximum limit recommended by the EPA (70 ppbv for O3 and 100 ppbv for NO2). The detection limits were considered as three times the standard deviation of the blank signal (n = 5) and calculated as 5 ppbv for O3 and 1 ppbv for NO2. The repeatability was obtained as the relative standard deviation of five analyses of 70 and 50 ppbv of O3 and NO2, respectively. The validation results and the optimized conditions are summarized in Table 2.
The analytical features and performance of the described portable platform were compared to other methodologies employed for gaseous NO2 and O3 determination. MOX-based gas sensors have been considered the first remote air quality monitoring option due to their simplicity and fast response. However, this sort of sensor is highly affected by relative humidity and interference, resulting in the tendency to overestimate the air pollutants’ levels. This fact can be relevant when the concentration of the air pollutant exceeds the maximum allowed. As can be seen in Table 3, the sampling time of the platform is equal to or inferior to other approaches, such as passive sampling. Our device has the advantage of operating using a portable battery; therefore, it is capable of being deployed virtually everywhere and with low-cost components. In addition, our method enables automated sampling, measurement, concentration calculation, data transmission, and storage. In terms of LOD, the proposed device achieved similar values to others already published in the literature. It is important to note that the linear range of the proposed method is suitable for monitoring both NO2 and O3 in the threshold of concentration for human health protection.

3.7. Application of the Proposed Platform for Air Quality Monitoring

The device was used to monitor the concentration of O3 and NO2 in the urban atmosphere of two Brazilian cities. Araraquara is located in the São Paulo state—270 km away from the capital, São Paulo—with an estimated population of ~240,000. Around 40% of the area of the region is used for sugar cane plantations. Araraquara has an operating air quality monitoring station controlled by the São Paulo environmental protection agency (CETESB) that provides hourly data regarding the concentration of O3 and NO2. Therefore, our platform was placed next to the station (21°78′2.60″ S, 48°18′5.82″ W), and our data were compared to those obtained with official instruments. Moreover, the platform was placed in the urban center of Uberlândia (18°91′31.8″ S, 48°27′55.4″ E), where no control of air pollutants is performed. This city is located in the Minas Gerais state and has an estimated population of ~750,000.
The platform was placed in the sampling locations in the early afternoon (2 p.m.), and the analysis procedure was continuously performed after sunset (9 p.m.). No external power source was required, as the portable battery enabled 12 h of continuous operation without recharging. Under the sunlight, the solar panel was used to keep the battery charged. The generated data were transmitted to laptops via Bluetooth and stored for later processing (i.e., absorbance calculations). The air monitoring was performed on 4 July 2022, when sunset occurred at 6 p.m. Table 4 shows the obtained results using the proposed platform and their comparison with the data provided by the air quality station. The air quality data can be found in the following link: https://cetesb.sp.gov.br/ar/dados-horarios/ (accessed on 4 July 2022) The values obtained for both pollutants with the two techniques revealed good agreement after applying the paired t test at 95% confidence level. The application of the proposed method in the field demonstrates the potential of the developed platform to monitor the concentration of O3 and NO2.
Next, the atmosphere measurement of the city center of Uberlândia was performed on 15 July 2022, on which sunset took place at 6 p.m. Table 5 shows the monitoring results. Although no comparison was enabled, the concentration relation between both gases agrees with their behavior in an urban atmosphere. The majority of the ozone levels were found to be below the LOQ. The ozone levels are low in city centers due to their quick consumption by other gases. Therefore, there is a high potential to employ our proposed platform to monitor the air pollutant levels of the outdoor atmosphere.

4. Conclusions

The device was based on the colorimetric method of indigo and Griess–Saltzman for ozone and nitrogen dioxide, respectively. The air sampling was performed by bubbling air in a flask containing 800 µL of each reagent. The absorbances for each method were measured immediately after the sampling time, with no need for extraction, dilution, or transport procedure. The detection system was comprised of a specific LED and a digital light sensor attached to an Arduino Uno board, which also controlled the mini air pump, the humidity/temperature sensor, and the Bluetooth module.
The platform was employed to monitor the hourly concentration of both pollutants in the atmosphere of two cities. Whereas one contained an official air quality station, the other had no official monitoring of the gaseous pollutants. The obtained results were validated using the official data and showed a suitable agreement of our device to the official instruments, showing the potential of the platform to produce reliable data. Finally, this sensing platform concept can be used to assemble an air quality network by positioning multiple platforms in different sampling spots and implementing additional data transmission modes for IoT, such as the LoRA (Long Range) protocol.

Supplementary Materials

The following supporting information can be downloaded at: https://www.mdpi.com/article/10.3390/chemosensors10110454/s1, Figure S1: Schemes of the standard gaseous solutions systems; Figure S2: The electric circuit scheme of the IoAT platform; Figure S3: Analytical curve of absorbance versus indigotrissulfonate (a) and nitrite (b) concentrations built using the developed detection device.

Author Contributions

Conceptualization: D.d.S.S., S.G.d.S., A.A.C. and J.F.d.S.P.; methodology and validation: D.d.S.S., V.G.L., G.T.d.R. and J.F.d.S.P.; writing—original draft and review: D.d.S.S., A.A.C., S.G.d.S. and J.F.d.S.P.; writing—review and editing: J.F.d.S.P. All authors have read and agreed to the published version of the manuscript.

Funding

The authors thank the National Council for Scientific and Technological Development (CNPq)—Proc. 403929/2021-0 and 309168/2020-1—CAPES (001) and FAPEMIG APQ-00196-22.

Institutional Review Board Statement

Not applicable.

Informed Consent Statement

Not Applicable.

Data Availability Statement

Not applicable.

Acknowledgments

The authors wish to thank the Brazilian agencies CAPES (Coordination for the Improvement of Higher Education Personnel—Finance Code 001), FAPEMIG (APQ-00196-22) and CNPq (National Council for Scientific and Technological Development—Proc. 403929/2021-0 and 309168/2020-1) for the scholarships and for their financial support.

Conflicts of Interest

The authors declare no competing interest.

References

  1. Tarasick, D.; Galbally, I.E.; Cooper, O.R.; Schultz, M.G.; Ancellet, G.; Leblanc, T.; Wallington, T.J.; Ziemke, J.; Liu, X.; Steinbacher, M.; et al. Tropospheric Ozone Assessment Report: Tropospheric Ozone from 1877 to 2016, Observed Levels, Trends and Uncertainties. Elementa 2019, 7, 39. [Google Scholar] [CrossRef] [Green Version]
  2. Villena, G.; Bejan, I.; Kurtenbach, R.; Wiesen, P.; Kleffmann, J. Interferences of Commercial NO2 Instruments in the Urban Atmosphere and in a Smog Chamber. Atmos. Meas. Tech. 2012, 5, 149–159. [Google Scholar] [CrossRef] [Green Version]
  3. Machado, C.M.D.; Cardoso, A.A.; Allen, A.G. Atmospheric Emission of Reactive Nitrogen during Biofuel Ethanol Production. Environ. Sci. Technol. 2008, 42, 381–385. [Google Scholar] [CrossRef] [PubMed]
  4. Warmiński, K.; Bęś, A. Atmospheric Factors Affecting a Decrease in the Night-Time Concentrations of Tropospheric Ozone in a Low-Polluted Urban Area. Water Air Soil Pollut. 2018, 229, 13. [Google Scholar] [CrossRef] [PubMed] [Green Version]
  5. Passaretti Filho, J.; Da Silveira Petruci, J.F.; Cardoso, A.A. Development of a Simple Method for Determination of NO2 in Air Using Digital Scanner Images. Talanta 2015, 140, 73–80. [Google Scholar] [CrossRef]
  6. Available online: https://www.epa.gov/naaqs/ozone-o3-air-quality-standards (accessed on 6 October 2022).
  7. Bell, M.; Ellis, H. Comparison of the 1-Hr and 8-Hr National Ambient Air Quality Standards for Ozone Using Models. J. Air Waste Manag. Assoc. 2003, 53, 1531–1540. [Google Scholar] [CrossRef] [Green Version]
  8. Available online: https://www.epa.gov/naaqs/nitrogen-dioxide-no2-primary-air-quality-standards (accessed on 1 August 2022).
  9. Available online: https://www.who.int/news/item/02-05-2018-9-out-of-10-people-worldwide-breathe-polluted-air-but-more-countries-are-taking-action (accessed on 1 August 2022).
  10. Aleixandre, M.; Gerboles, M. Review of Small Commercial Sensors for Indicative Monitoring of Ambient Gas. Chem. Eng. Trans. 2012, 30, 169–174. [Google Scholar] [CrossRef]
  11. Thompson, J.E. Crowd-Sourced Air Quality Studies: A Review of the Literature & Portable Sensors. Trends Environ. Anal. Chem. 2016, 11, 23–34. [Google Scholar] [CrossRef]
  12. Castell, N.; Dauge, F.R.; Schneider, P.; Vogt, M.; Lerner, U.; Fishbain, B.; Broday, D.; Bartonova, A. Can Commercial Low-Cost Sensor Platforms Contribute to Air Quality Monitoring and Exposure Estimates? Environ. Int. 2017, 99, 293–302. [Google Scholar] [CrossRef]
  13. Fine, G.F.; Cavanagh, L.M.; Afonja, A.; Binions, R. Metal Oxide Semi-Conductor Gas Sensors in Environmental Monitoring. Sensors 2010, 10, 5469–5502. [Google Scholar] [CrossRef]
  14. da Silveira Petruci, J.F.; Barreto, D.N.; Dias, M.A.; Felix, E.P.; Cardoso, A.A. Analytical Methods Applied for Ozone Gas Detection: A Review. TrAC—Trends Anal. Chem. 2022, 149, 116552. [Google Scholar] [CrossRef]
  15. Toma, C.; Alexandru, A.; Popa, M.; Zamfiroiu, A. IoT Solution for Smart Cities’ Pollution Monitoring and the Security Challenges. Sensors 2019, 19, 3401. [Google Scholar] [CrossRef] [PubMed] [Green Version]
  16. Cai, C.; Han, S.; Zhang, X.; Yu, J.; Xiang, X.; Yang, J.; Qiao, L.; Zu, X.; Chen, Y.; Li, S. Ultrahigh oxygen evolution reaction activity in Au doped co-based nanosheets. RSC Adv. 2022, 12, 6205. [Google Scholar] [CrossRef] [PubMed]
  17. WangJian, J.; Changcang, C.; Ben, Q.; Wenting, N.; Yuchen, Z.; Yongqing, H.; Yongliang, F.; Tang, Y. Highly porous Fe2O3-SiO2 layer for acoustic wave based H2S sensing: Mass loading or elastic loading effects? Sens. Actuators B 2022, 367, 132160. [Google Scholar]
  18. Cerrato-Alvarez, M.; Miró-Rodríguez, C.; Pinilla-Gil, E. A Passive Sampling–Voltammetric Detection Approach Based on Screen-Printed Electrodes Modified with Indigotrisulfonate for the Determination of Ozone in Ambient Air. Sens. Actuators B Chem. 2018, 273, 735–741. [Google Scholar] [CrossRef]
  19. Lozano, A.; Usero, J.; Vanderlinden, E.; Raez, J.; Contreras, J.; Navarrete, B. Air Quality Monitoring Network Design to Control Nitrogen Dioxide and Ozone, Applied in Malaga, Spain. Microchem. J. 2009, 93, 164–172. [Google Scholar] [CrossRef]
  20. Garcia, G.; Allen, A.G.; Cardoso, A.A. Development of a Sensitive Passive Sampler Using Indigotrisulfonate for the Determination of Tropospheric Ozone. J. Environ. Monit. 2010, 12, 1325–1329. [Google Scholar] [CrossRef]
  21. Cerrato-Alvarez, M.; Frutos-Puerto, S.; Miró-Rodríguez, C.; Pinilla-Gil, E. Measurement of Tropospheric Ozone by Digital Image Analysis of Indigotrisulfonate-Impregnated Passive Sampling Pads Using a Smartphone Camera. Microchem. J. 2020, 154, 104535. [Google Scholar] [CrossRef]
  22. Filho, J.P.; Costa, M.A.M.; Cardoso, A.A. A Micro-Impinger Sampling Device for Determination of Atmospheric Nitrogen Dioxide. Aerosol Air Qual. Res. 2019, 19, 2597–2603. [Google Scholar] [CrossRef]
  23. Castell, N.; Schneider, P.; Grossberndt, S.; Fredriksen, M.F.; Sousa Santos, G.; Vogt, M.; Bartonova, A. Localized Real-Time Information on Outdoor Air Quality at Kindergartens in Oslo, Norway Using Low-Cost Sensor Nodes. Environ. Res. 2018, 165, 410–419. [Google Scholar] [CrossRef]
  24. Cadeado, A.; Machado, C.; Oliveira, G.; e Silva, D.; Muñoz, R.; Silva, S. Internet of Things as a Tool for Sustainable Analytical Chemistry: A Review. J. Braz. Chem. Soc. 2022, 33, 681–692. [Google Scholar] [CrossRef]
  25. Cesar Souza Machado, C.; da Silveira Petruci, J.F.; Silva, S.G. An IoT Optical Sensor for Photometric Determination of Oxalate in Infusions. Microchem. J. 2021, 168, 106466. [Google Scholar] [CrossRef]
  26. Bui, D.A.; Hauser, P.C. Analytical Devices Based on Light-Emitting Diodes–A Review of the State-of-the-Art. Anal. Chim. Acta 2015, 853, 46–58. [Google Scholar] [CrossRef] [PubMed]
  27. Fernandes, G.M.; Silva, W.R.; Barreto, D.N.; Lamarca, R.S.; Lima Gomes, P.C.F.; Petruci, J.F.d.S.; Batista, A.D. Novel Approaches for Colorimetric Measurements in Analytical Chemistry—A Review. Anal. Chim. Acta 2020, 1135, 187–203. [Google Scholar] [CrossRef] [PubMed]
  28. Felix, E.P.; Cardoso, A.A. Colorimetric Determination of Ambient Ozone Using Indigo Blue Droplet. J. Braz. Chem. Soc. 2006, 17, 296–301. [Google Scholar] [CrossRef]
  29. Maruo, Y.Y.; Kunioka, T.; Akaoka, K.; Nakamura, J. Development and Evaluation of Ozone Detection Paper. Sens. Actuators B Chem. 2009, 135, 575–580. [Google Scholar] [CrossRef]
  30. Jayawardane, B.M.; Wei, S.; McKelvie, I.D.; Kolev, S.D. Microfluidic Paper-Based Analytical Device for the Determination of Nitrite and Nitrate. Anal. Chem. 2014, 86, 7274–7279. [Google Scholar] [CrossRef]
  31. Cerrato-Alvarez, M.; Frutos-Puerto, S.; Arroyo, P.; Miró-Rodríguez, C.; Pinilla-Gil, E. A portable, low-cost, smartphone assisted methodology for on-site measurement of NO2 levels in ambient air by selective chemical reactivity and digital image analysis. Sens. Actuators B Chem. 2021, 338, 129867. [Google Scholar] [CrossRef]
  32. Caballero, S.; Esclapez, R.; Galind, N.; Mantilla, E.; Cresp, J. Use of a passive sampling network for the determination of urban NO2 spatiotemporal variations. Atmos. Environ. 2012, 63, 148–155. [Google Scholar] [CrossRef]
  33. Hossain, M.; Saffell, J.; Baron, R. Differentiating NO2 and O3 at low cost air quality amperometric gas sensors. ACS Sens. 2016, 1, 1291–1294. [Google Scholar] [CrossRef]
  34. Cavellin, L.D.; Weichenthal, S.; Tack, R.; Ragetti, M.S.; Smargiassi, A.; Hatzopoulou, M. Investigating the Use of Portable Air Pollution Sensors to Capture the Spatial Variability Of Traffic-Related Air Pollution. Environ. Sci. Technol. 2016, 50, 313–320. [Google Scholar] [CrossRef] [PubMed]
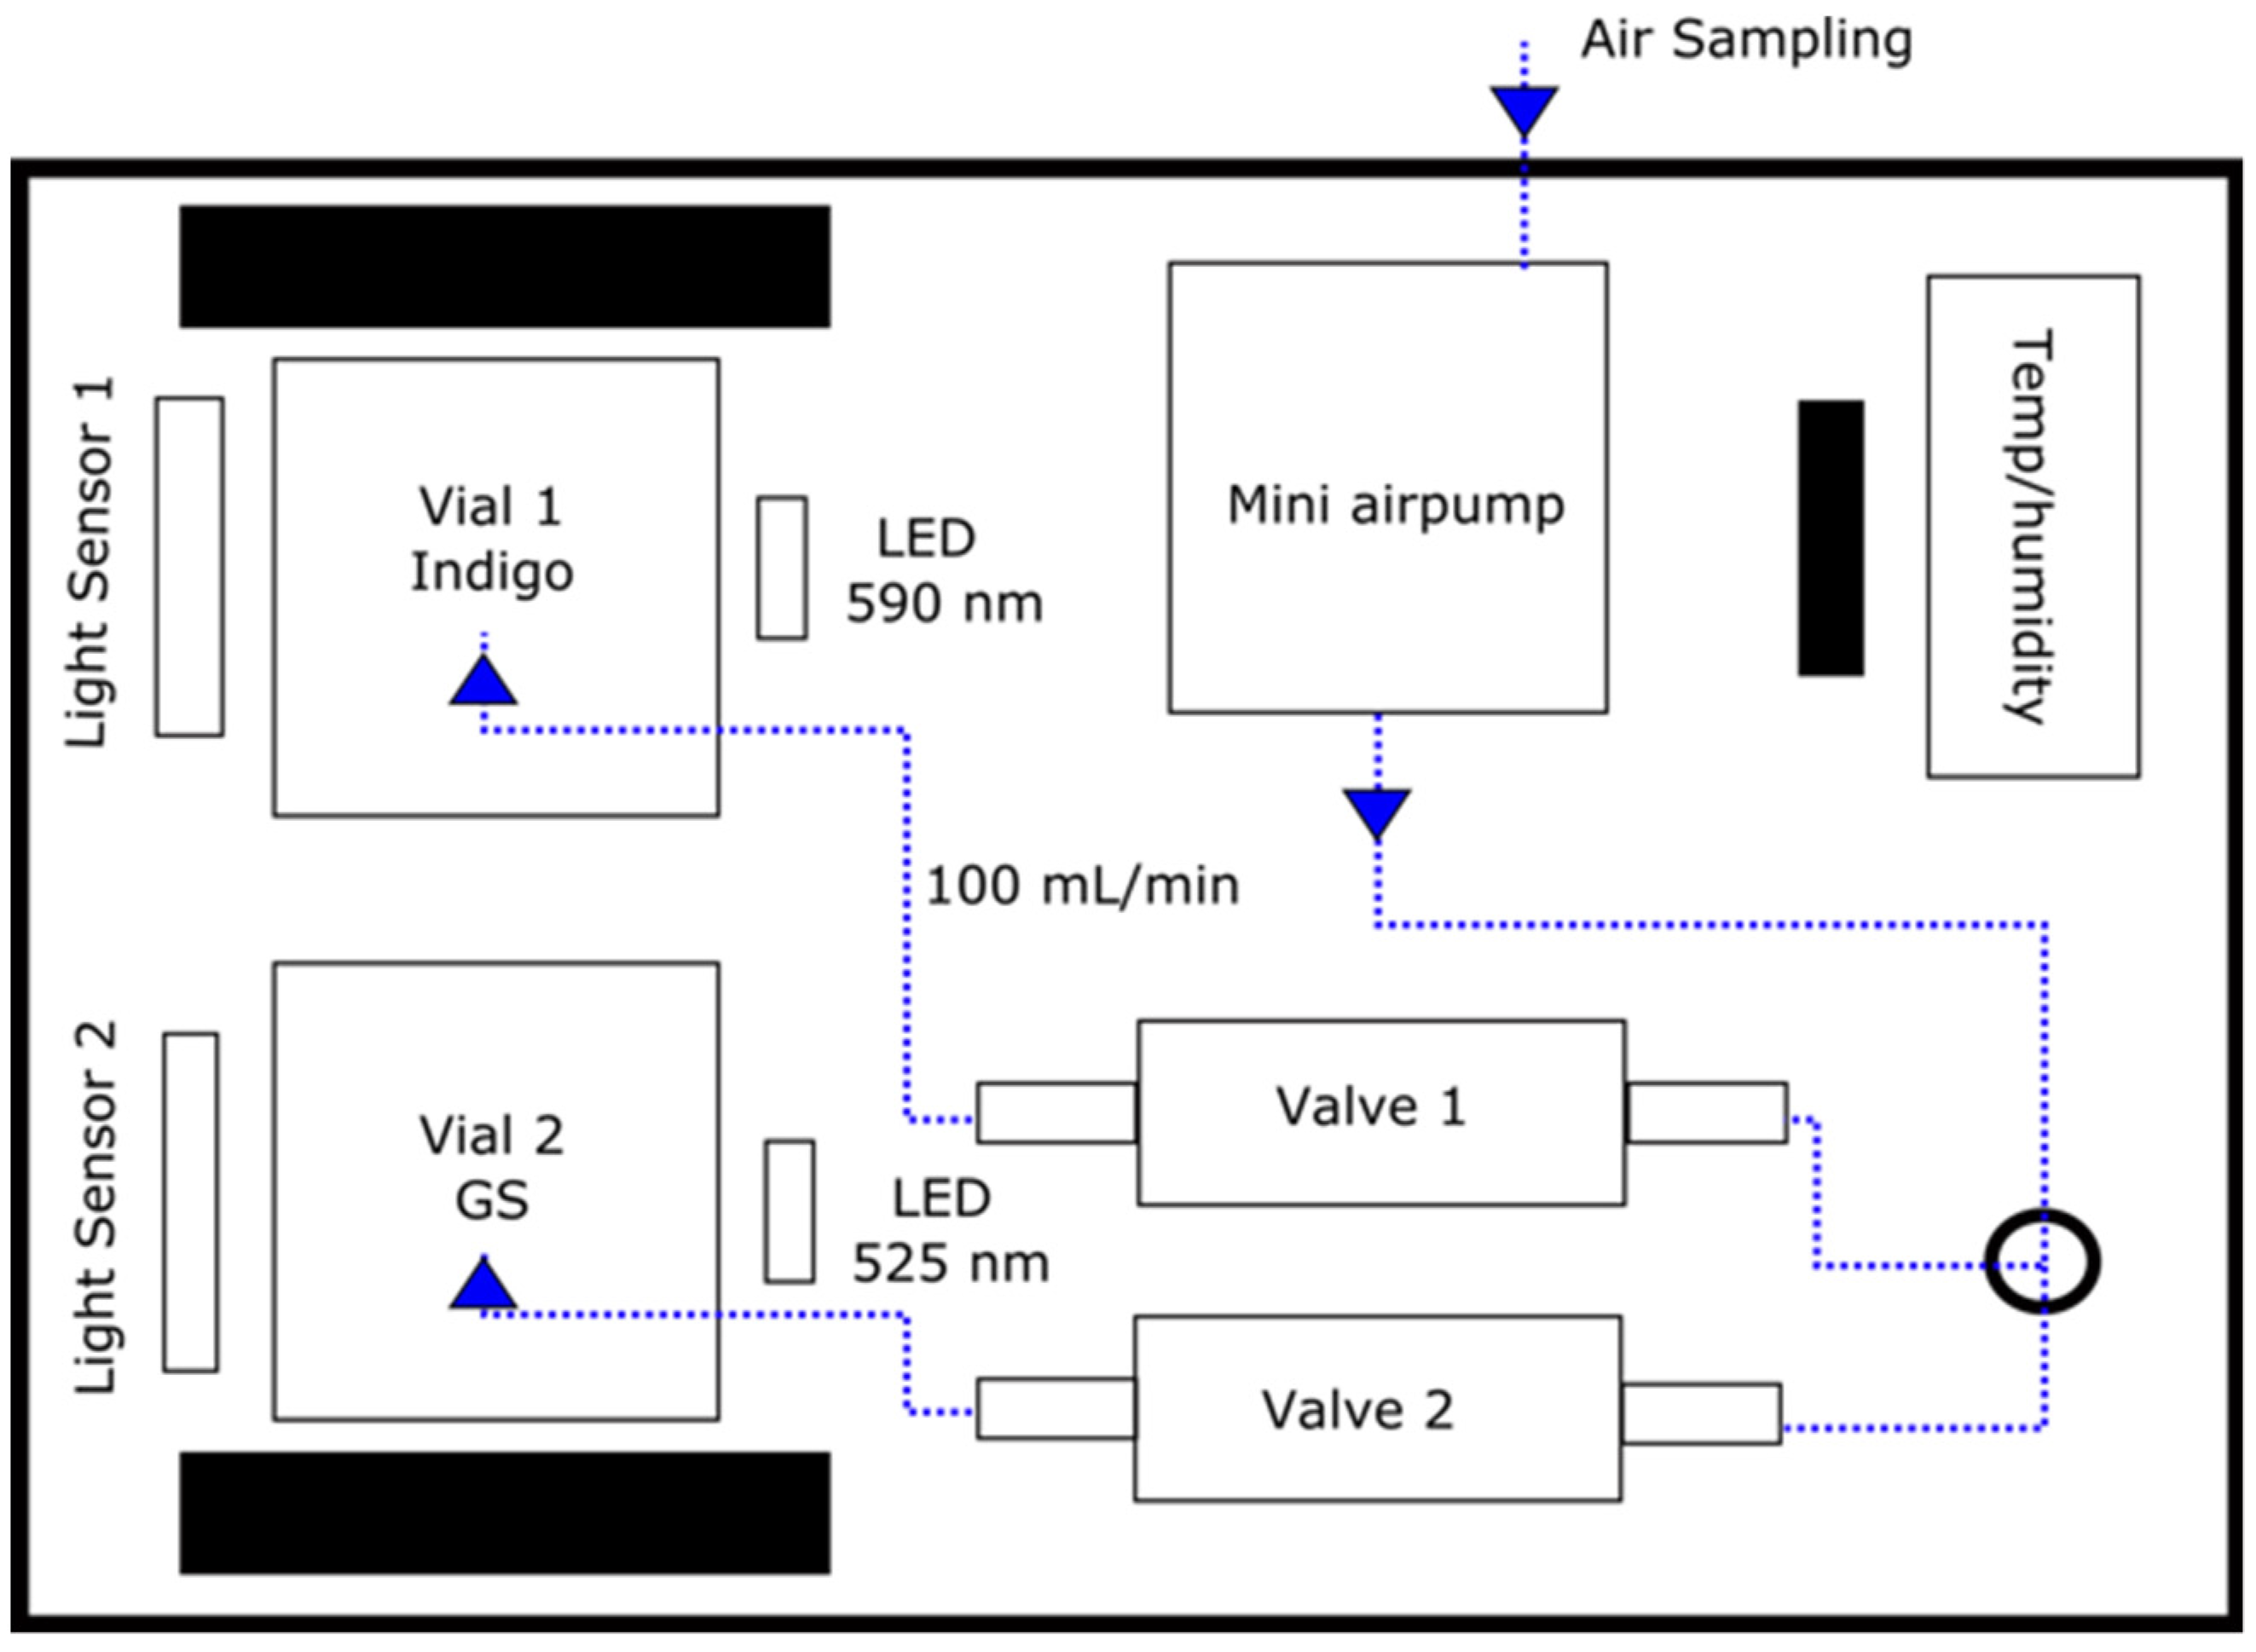
Figure 1. The analytical platform schematically represented.
Chemosensors 10 00454 g001
Figure 2. 3D model of the analytical platform for air quality monitoring.
Chemosensors 10 00454 g002
Figure 3. Atmospheric air sampling with constant air flow of 100 mL min−1.
Chemosensors 10 00454 g003
Figure 4. The effect of sampling time in the analytical signal for ozone and nitrogen dioxide determination.
Chemosensors 10 00454 g004
Figure 5. Effect of the sampling airflow in the analytical signal (AI-AF).
Chemosensors 10 00454 g005
Table 1. Analytical performance obtained for the indigo and nitrite determinations using the portable Arduino-based photometer.
ParameterIndigoNitrite (via GS)
Linear range 5 to 100 µM1 to 100 µM
Correlation coefficient0.99970.9939
Calibration equationA = 0.0142 [ITS] + 0.0094A = 0.0114 [NO2] + 0.1438
Limit of Detection (3*SD/Slope)0.6 µM0.5 µM
Limit of Quantification (10*SD/Slope)1.9 µM1.6 µM
Table 2. Analytical parameters and optimized conditions of the proposed analytical platform for O3 and NO2 quantification.
OzoneNitrogen Dioxide
Linear Range40 to 130 ppbv3 to 200 ppbv
EquationABS = 0.006 [O3] − 0.0151ABS = 0.025 [NO2] + 0.0092
R20.9910.994
Limit of Detection5 ppbv1 ppbv
Repeatability (RSD)2.7% (70 ppbv)2.2% (50 ppbv)
Sampling time60 min
Sampling airflow100 mL min−1
Reagent volume800 µL
Table 3. Comparison among other analytical platforms employed for gaseous NO2 and/or O3 monitoring.
Air PollutantsSampling System
and Time
Detection SystemRemarksLOD (ppbv)Ref.
NO2Filter paper/60 minSmartphone (Digital image)Off-line acquisition of the analytical signal. Low automatization3[31]
NO2Micro-impinger bubbler/60 minConventional spectrophotometerReagent solution must be transferred to the detection system. Off-line procedure7[22]
O3Cellulose pads/24 hSmartphone (digital image)24 h of sampling time (passive sampling). Low automatization2[21]
O3Screen-printed electrodes/5 hPortable potentiostatPassive sampling extends the sampling time. Measurement performed in the lab0.8[18]
NO2Glass fiber filter/1 weekIon chromatographyNot suitable to detect short time (i.e., 1 h) variations in NO2 concentration. High cost instrumentationNot available[32]
NO2 and O3Glass fiber filter/2 weeksConventional spectrophotometer and Ion chromatographyNot suitable to detect short time (i.e., 1 h) variations in NO2 and O3 concentrations. High cost instrumentation and off-line procedureNot available[19]
NO2 and O3Electrochemical sensor with MnO2 microparticlesAmperometry Affected by humidity and validated with high concentration of the pollutantsNot available[33]
NO2 and O3Aeroqual sensors (MOX)/20 minConductivity Tendency to overestimate NO2 and O3 concentrations. Not available[34]
NO2 and O3Micro-impinger bubbler/60 minDigital light sensors/ArduinoAll analytical steps are performed in the same platform. Automatic data transmission and storage1 and 5
Table 4. Comparative results obtained by the proposed method and the official air quality station.
HourO3 Platform (ppbv)O3 Air Quality Station (ppbv)NO2 Platform (ppbv)NO2 Air Quality Station (ppbv)Temp (°C) and RH (%)
2–3 p.m.6954<LOQ227/30
3–4 p.m.71564327/27
4–5 p.m.53556427/27
5–6 p.m.524912827/27
6–7 p.m.<LOQ *28262026/30
7–8 p.m.<LOQ26262324/34
8–9 p.m.<LOQ24282523/37
* LOQ = Limit of Quantification.
Table 5. Concentration levels obtained by the proposed platform for the monitoring of O3 and NO2 in the atmosphere of Uberlândia.
HourO3 (ppbv)NO2 (ppbv)Temp (°C) and RH (%)
8–9 a.m.<LOQ1417/59
9–10 a.m.<LOQ217/59
10–11a.m.<LOQ318/55
11–12 a.m.<LOQ520/52
12–1 p.m.47<LOQ22/46
1–2 p.m.41<LOQ24/44
2–3 p.m.40<LOQ25/38
3–4 p.m.42<LOQ26/31
4–5 p.m.<LOQ626/31
5–6 p.m.<LOQ2226/34
6–7 p.m.<LOQ3326/34
7–8 p.m.<LOQ5926/31
Publisher’s Note: MDPI stays neutral with regard to jurisdictional claims in published maps and institutional affiliations.