
Detection of Volatile Alcohol Vapors Using PMMA-Coated Micromechanical Sensors: Experimental and Quantum Chemical DFT Analysis


 , , and
Abstract
1. Introduction
2. Materials and Methods
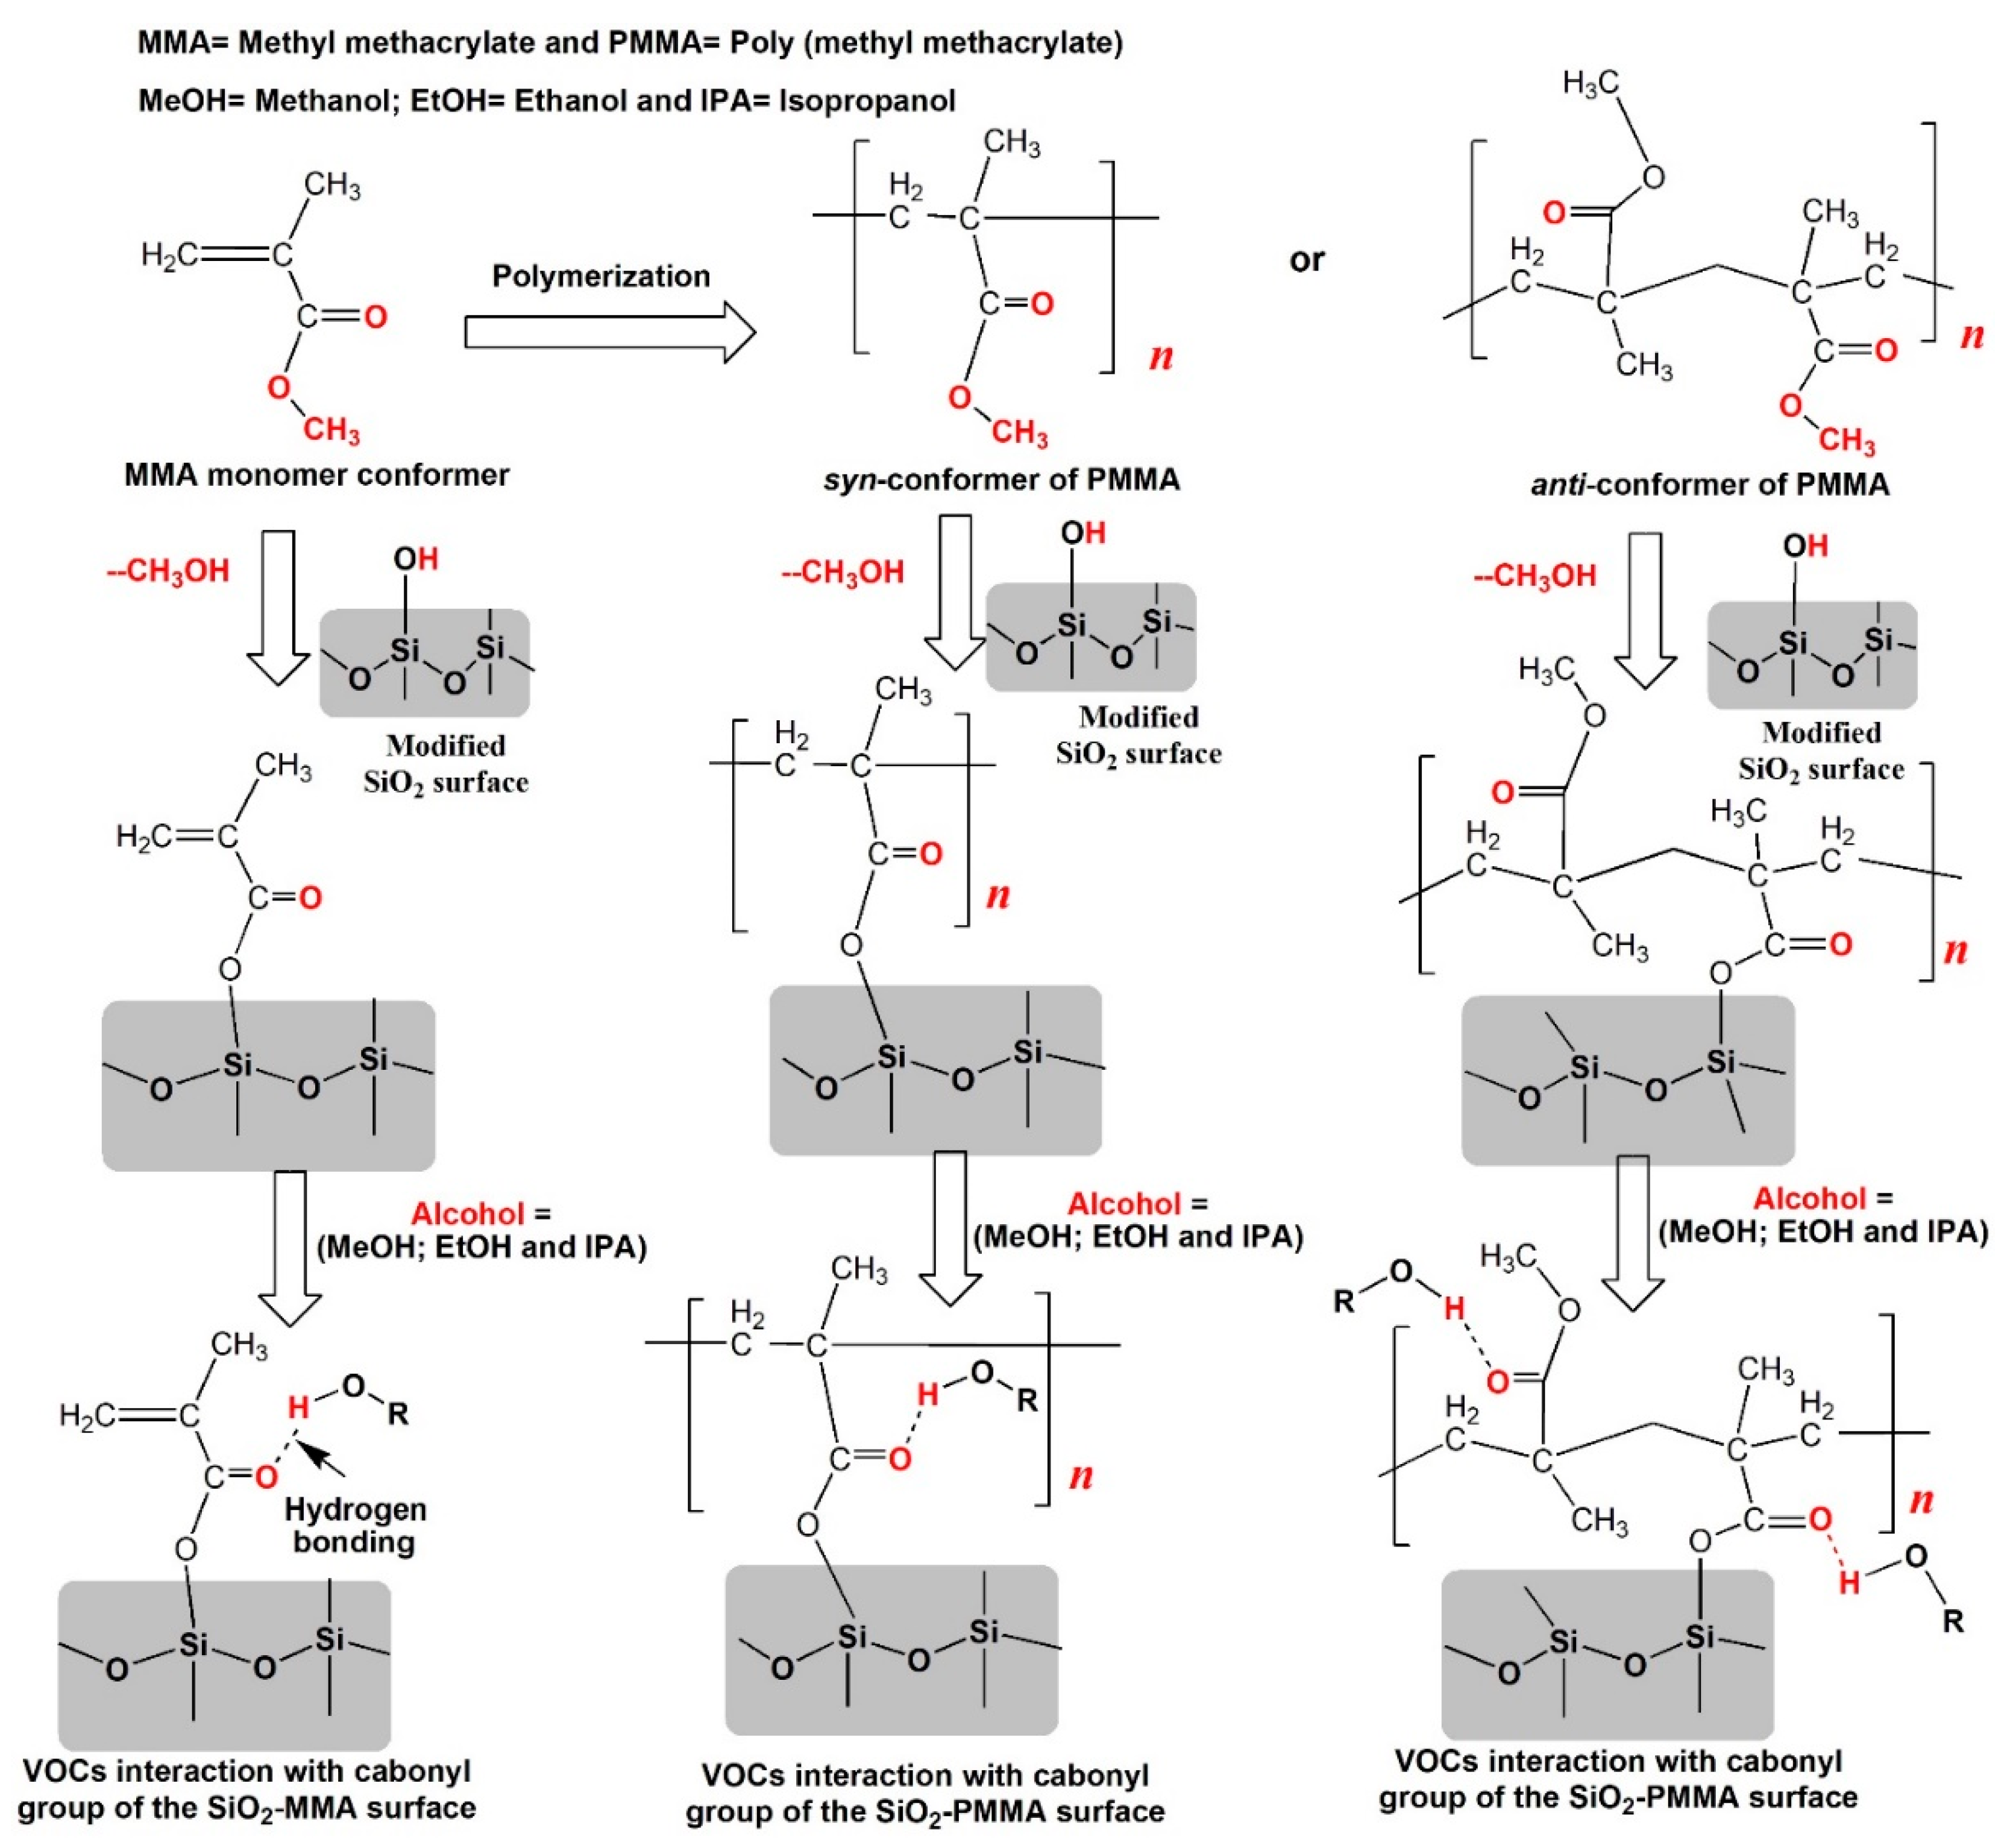
2.1. Chemicals and Materials
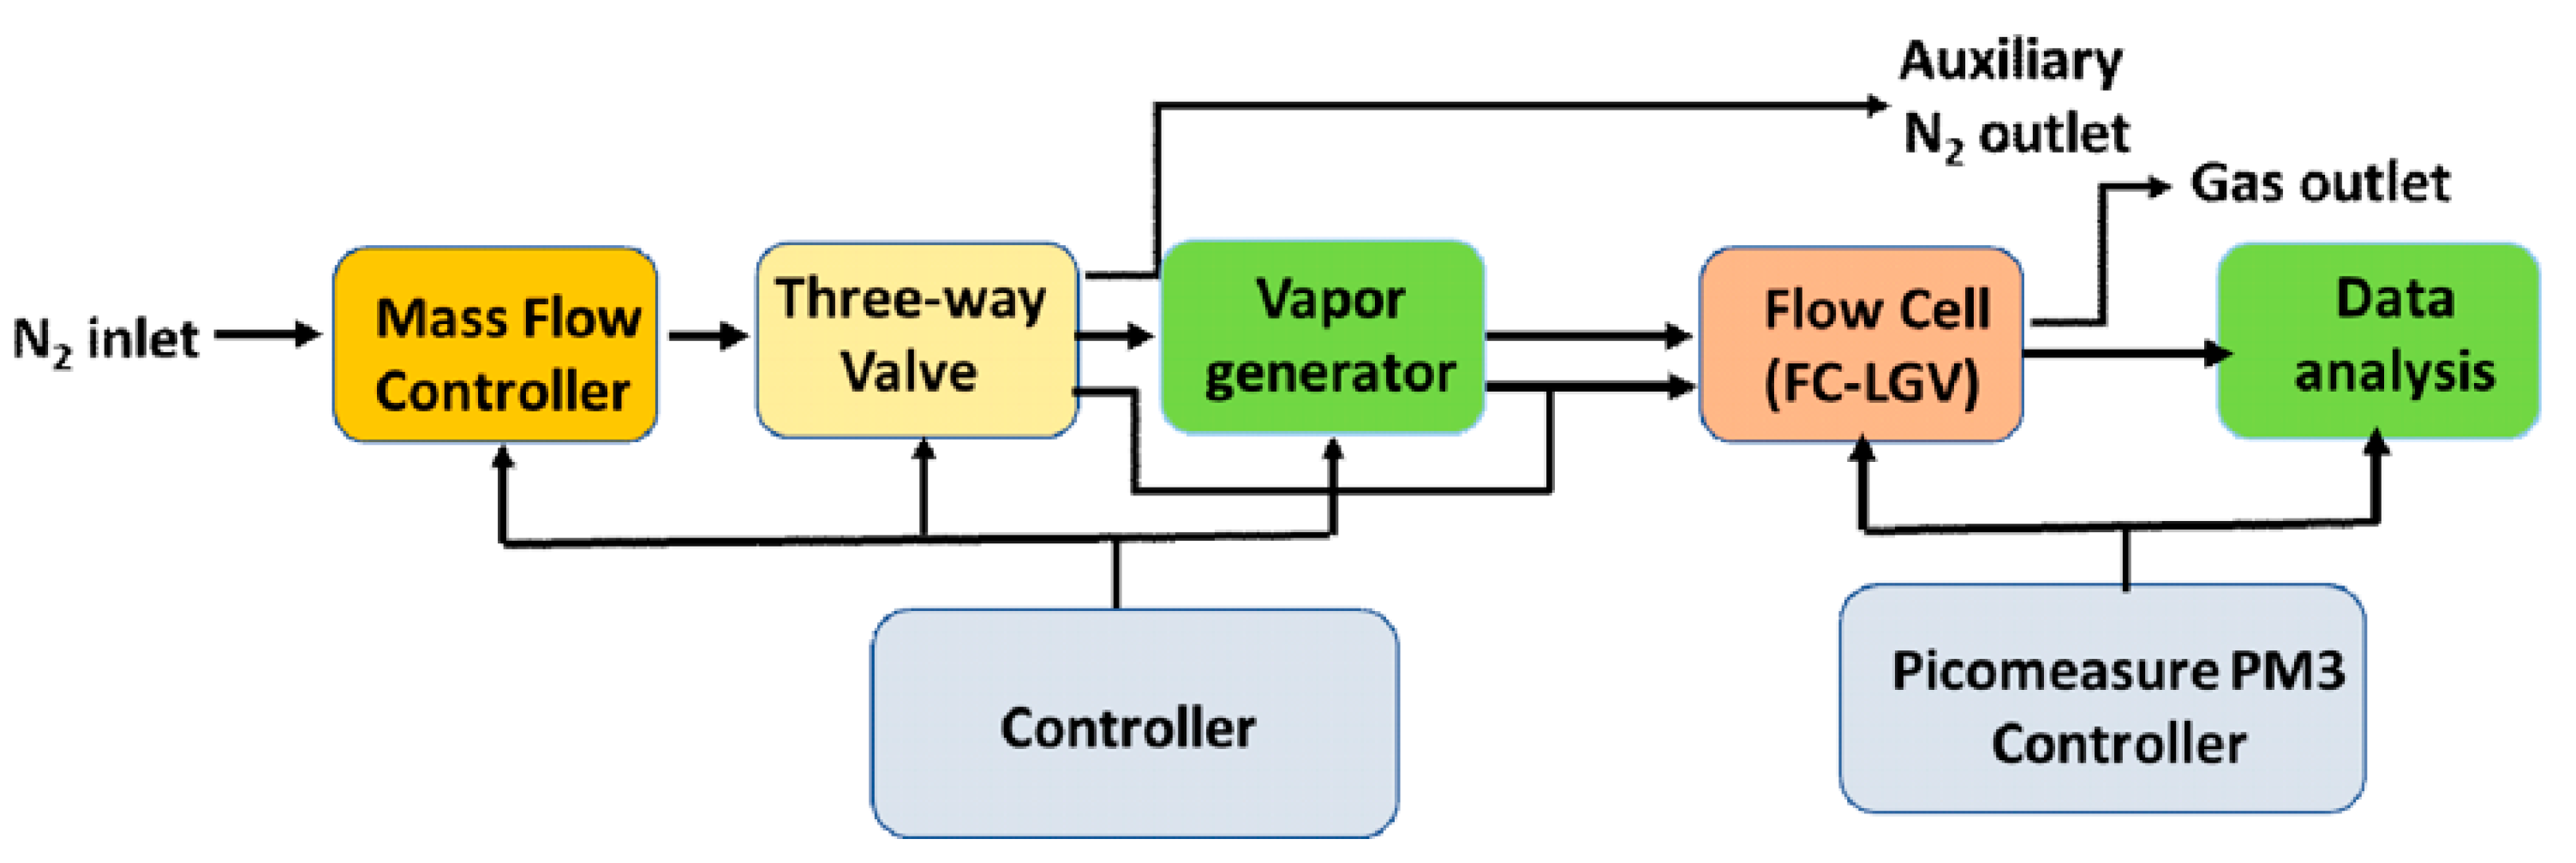
2.2. Experimental Setup and Instrumentation
2.3. Density Functional Theory (DFT) Calculations
3. Results
3.1. MCL Deflection Measurements
3.2. Quantum Chemical DFT Calculations
4. Conclusions
- (a)
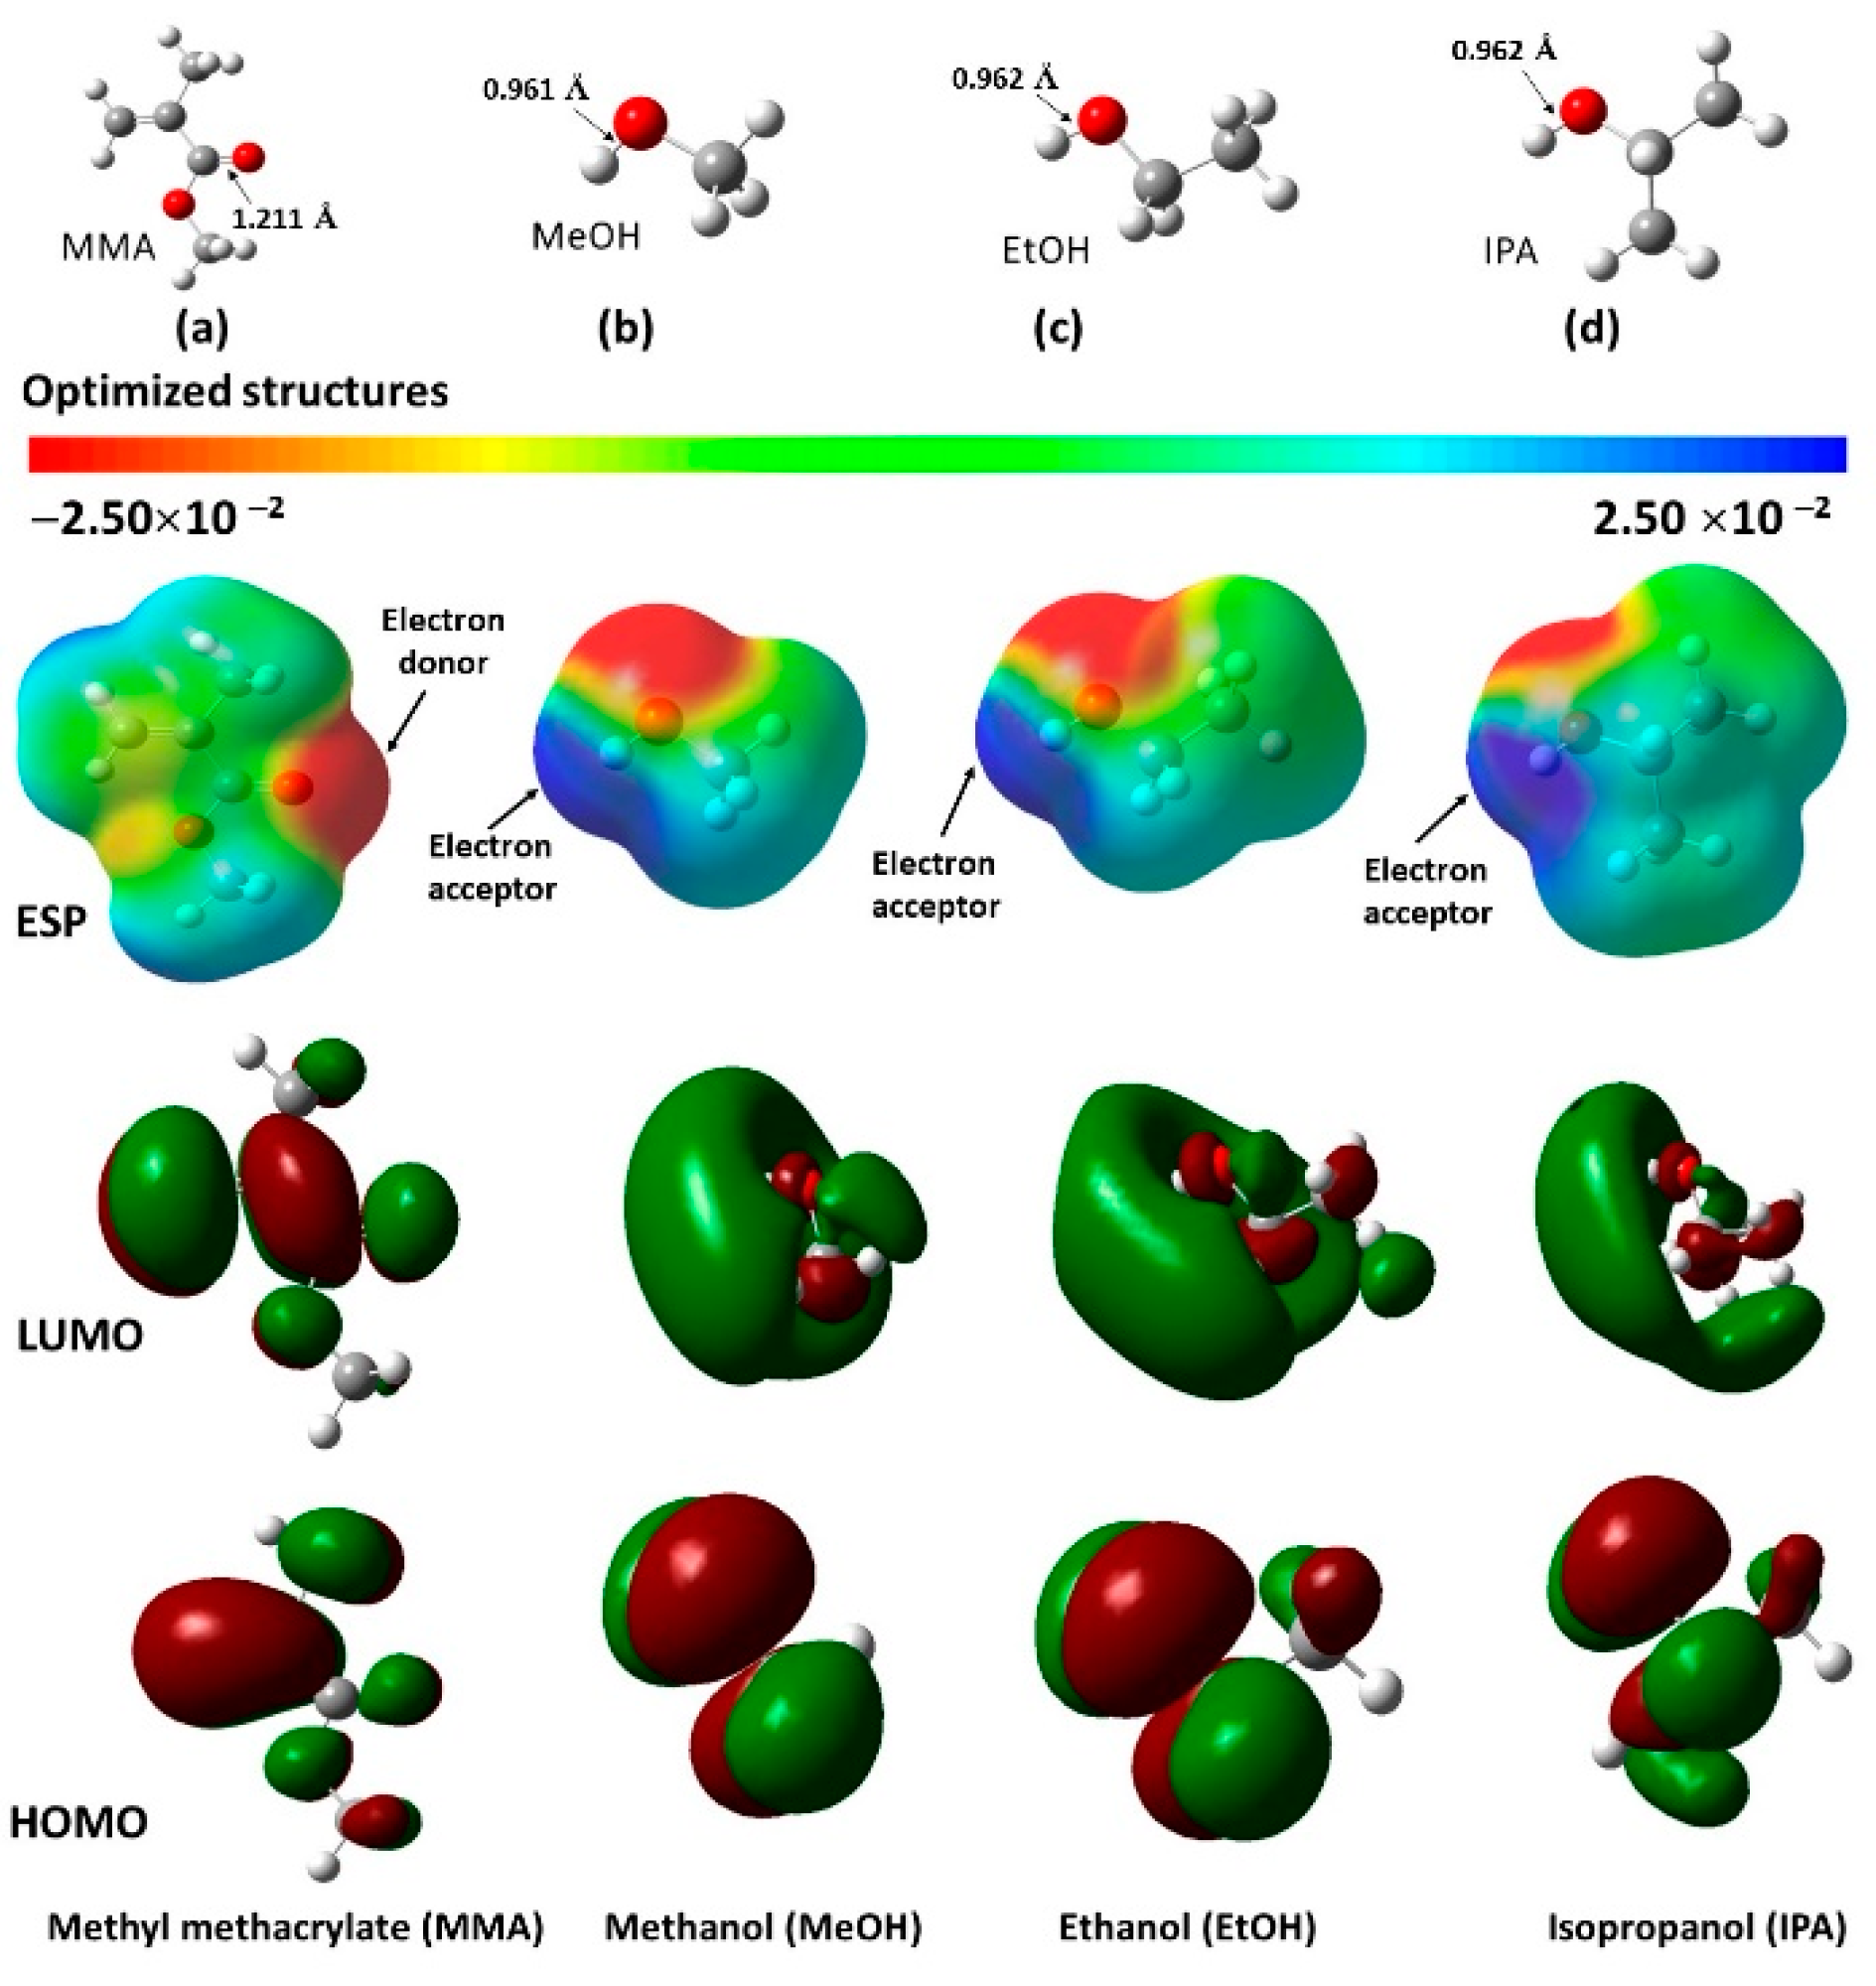
- The reactivity of the MMA was clearly greater than that of the two tetrameric segments (i.e., sTMMA and aTMMA). This was reflected in the larger electronegativity (χ) and electrophilicity Index (ω) of MMA. This is to be expected since MMA is easily polymerized.
- (b)
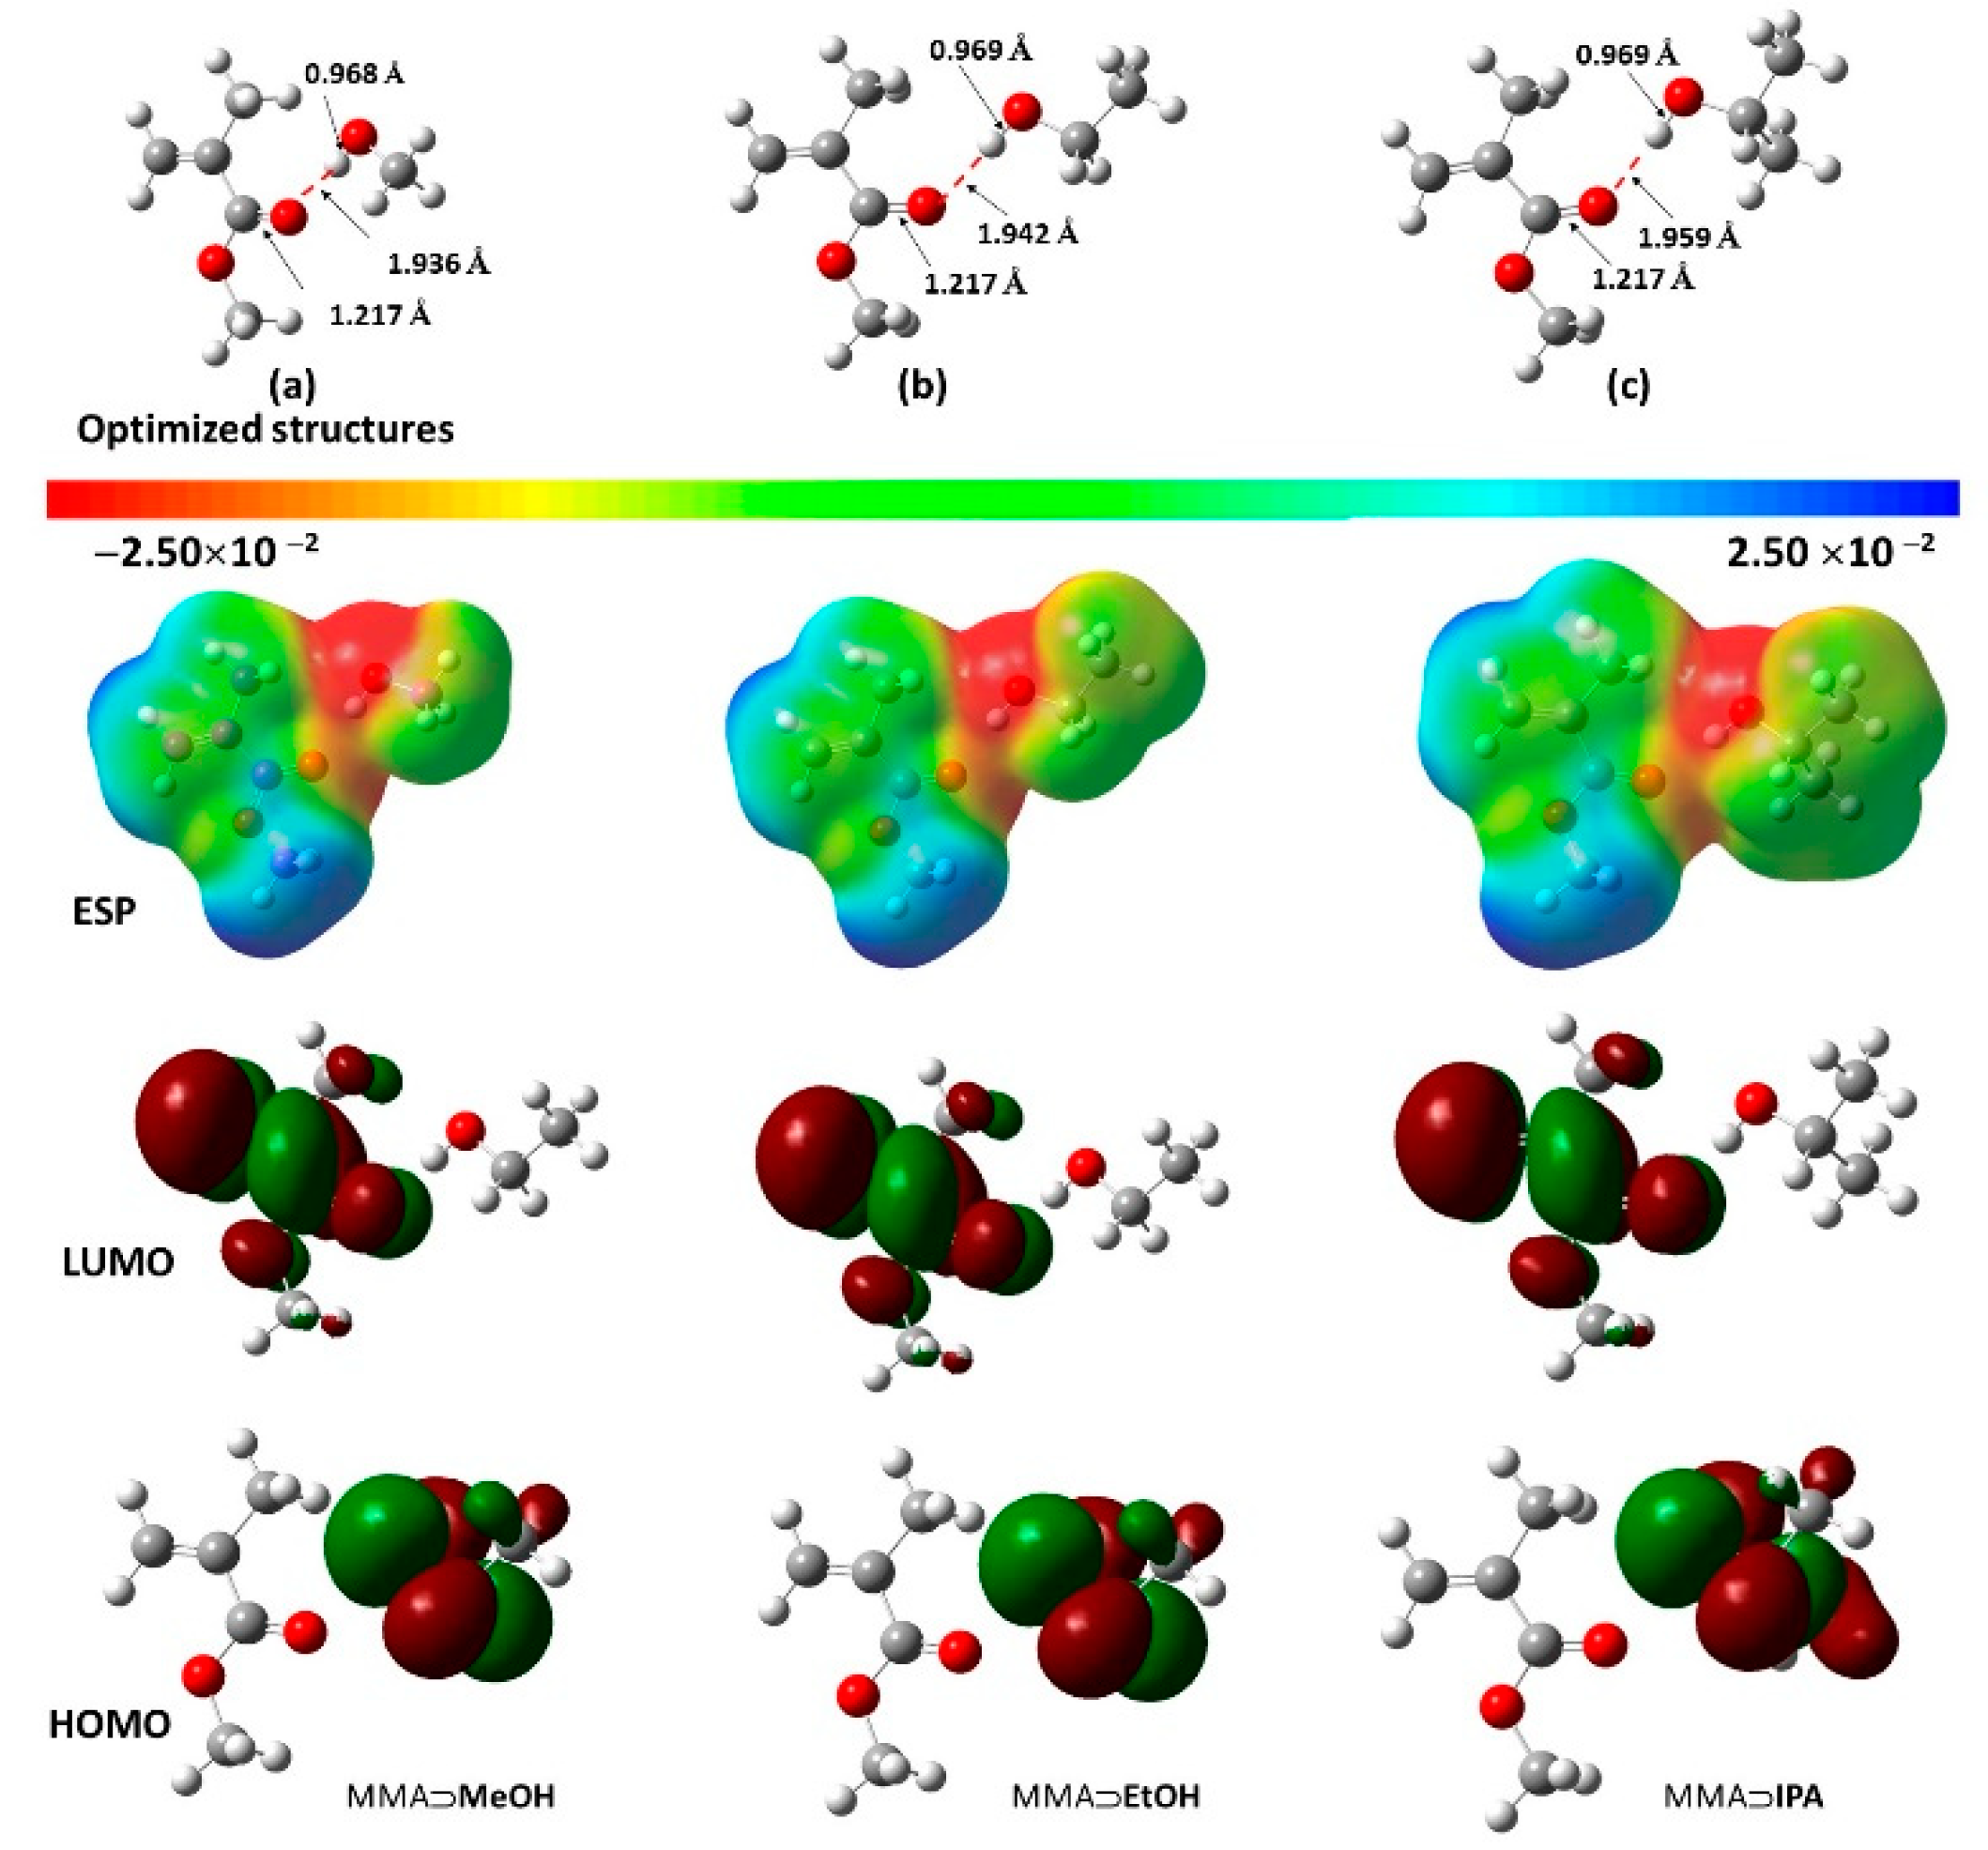
- The data for the 1:1 MMA:alcohol complexes show very few differences in their values.
- (c)
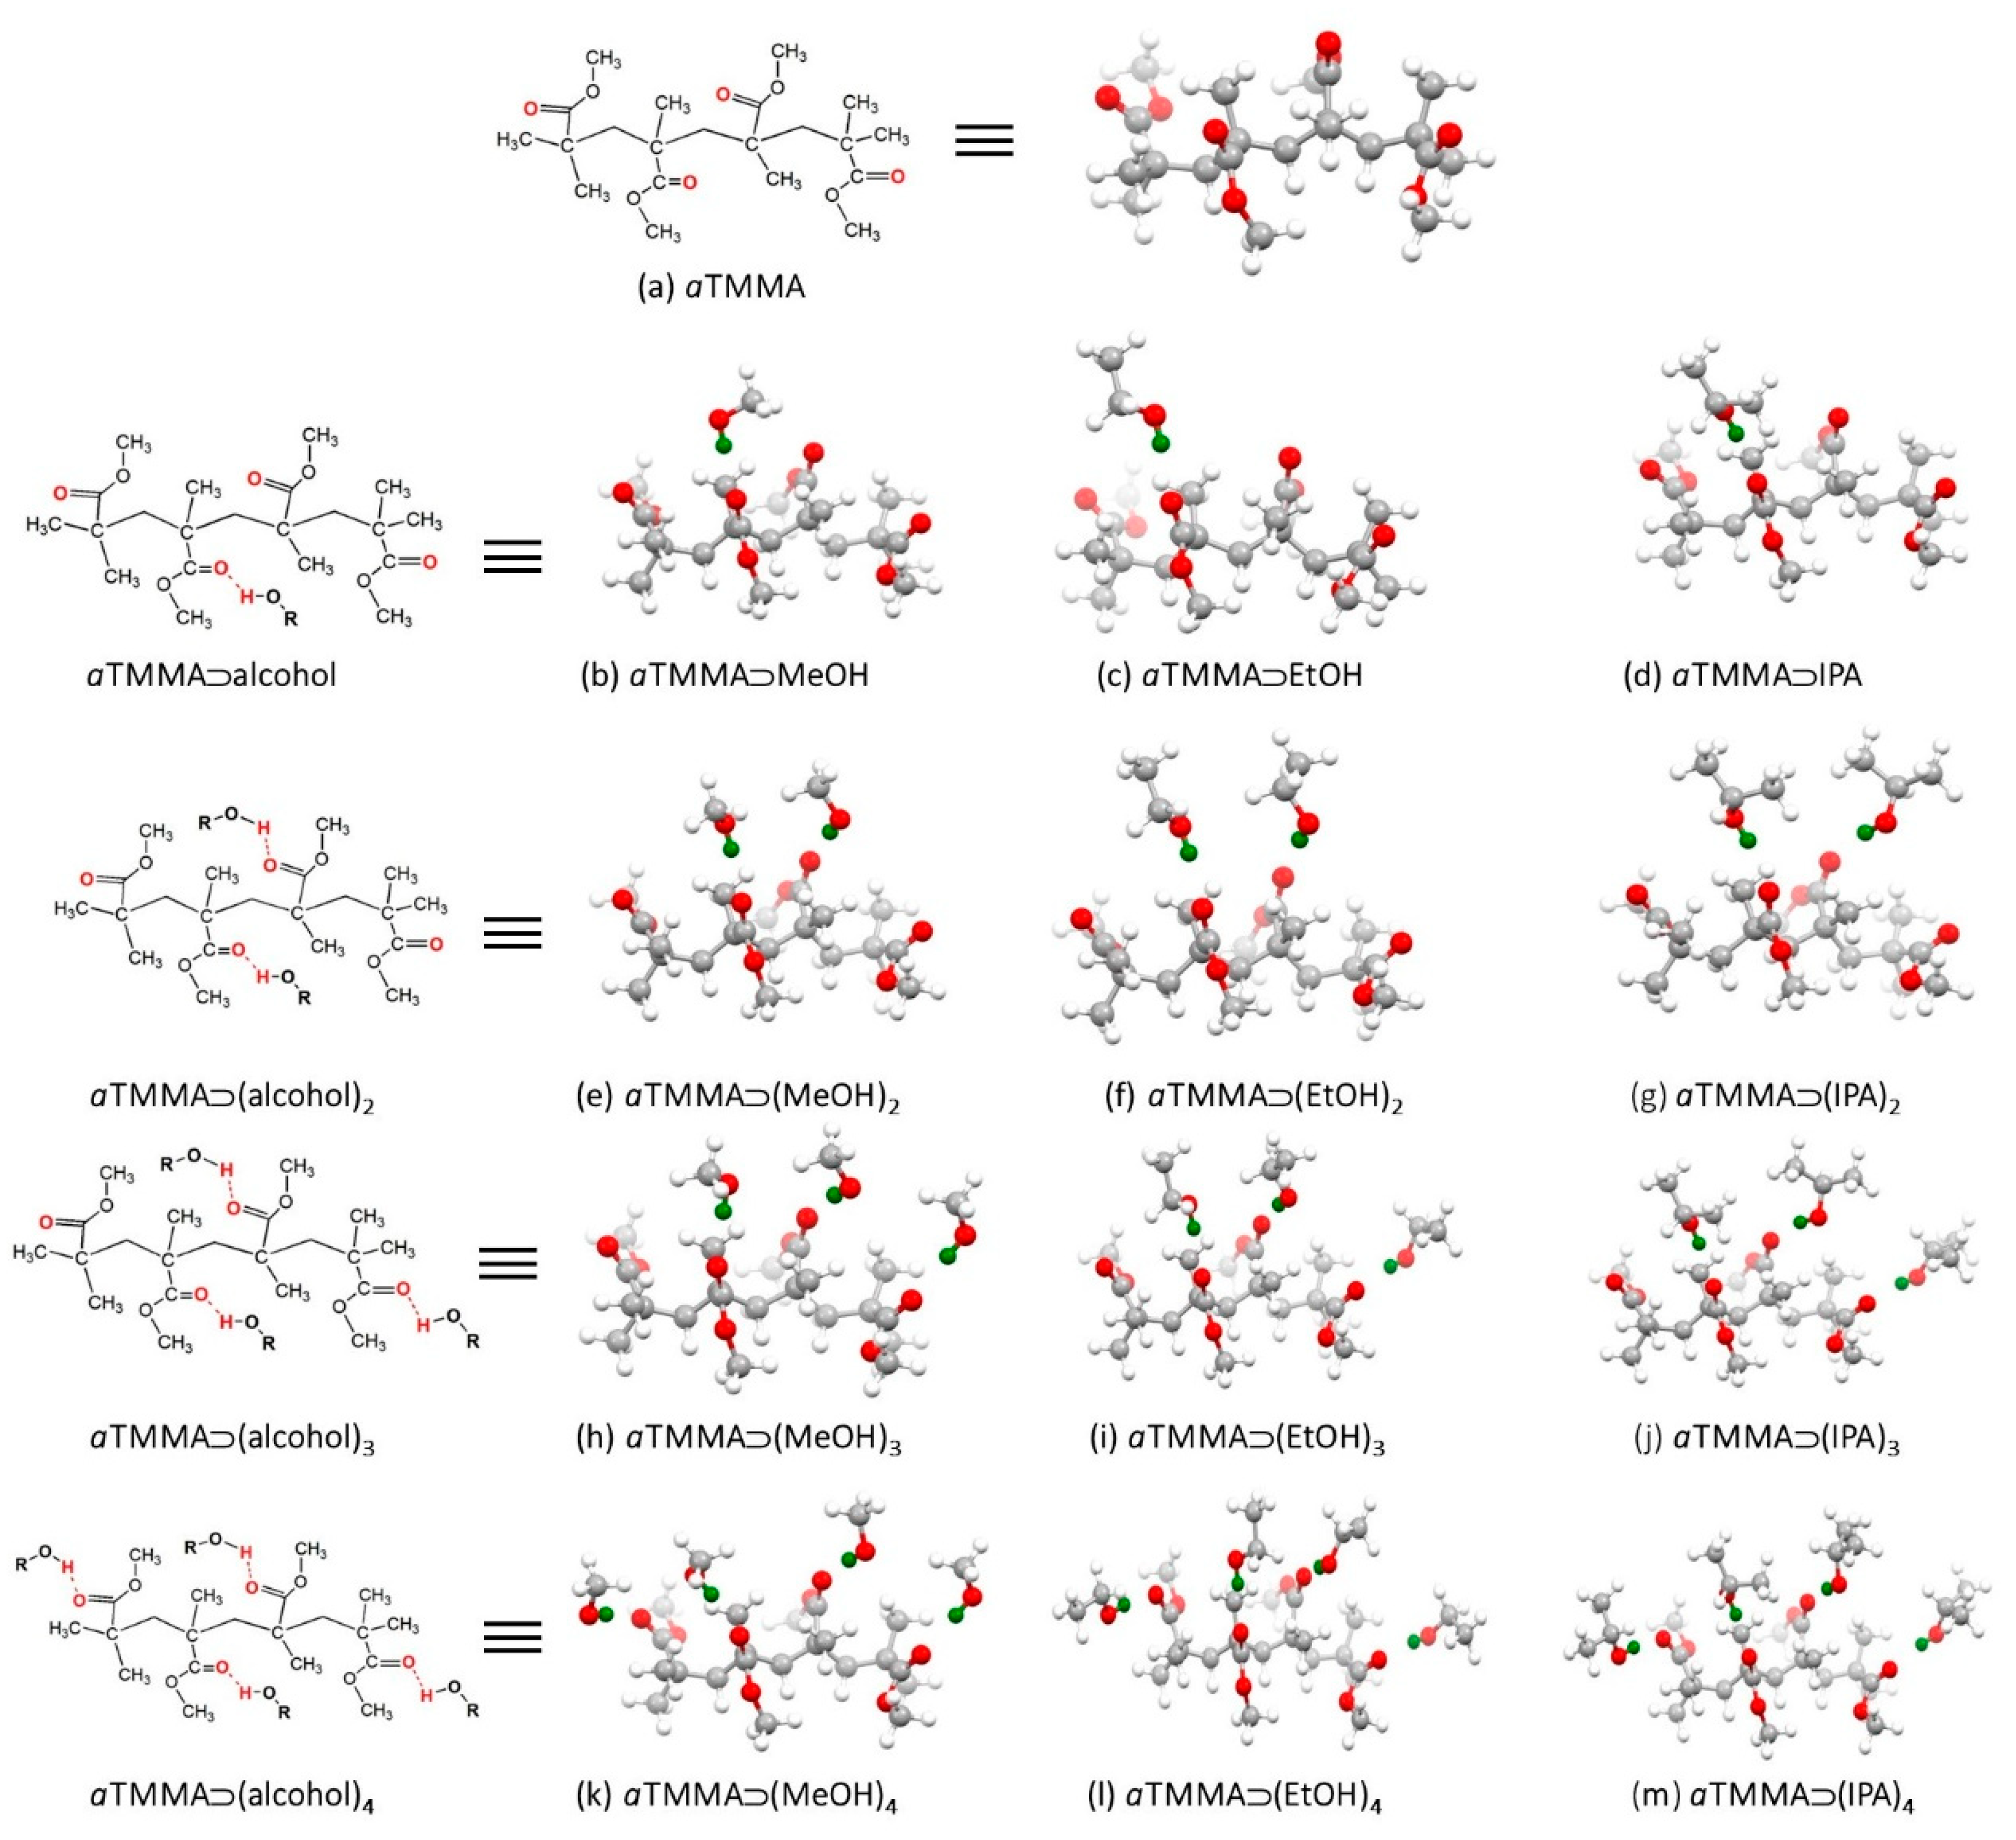
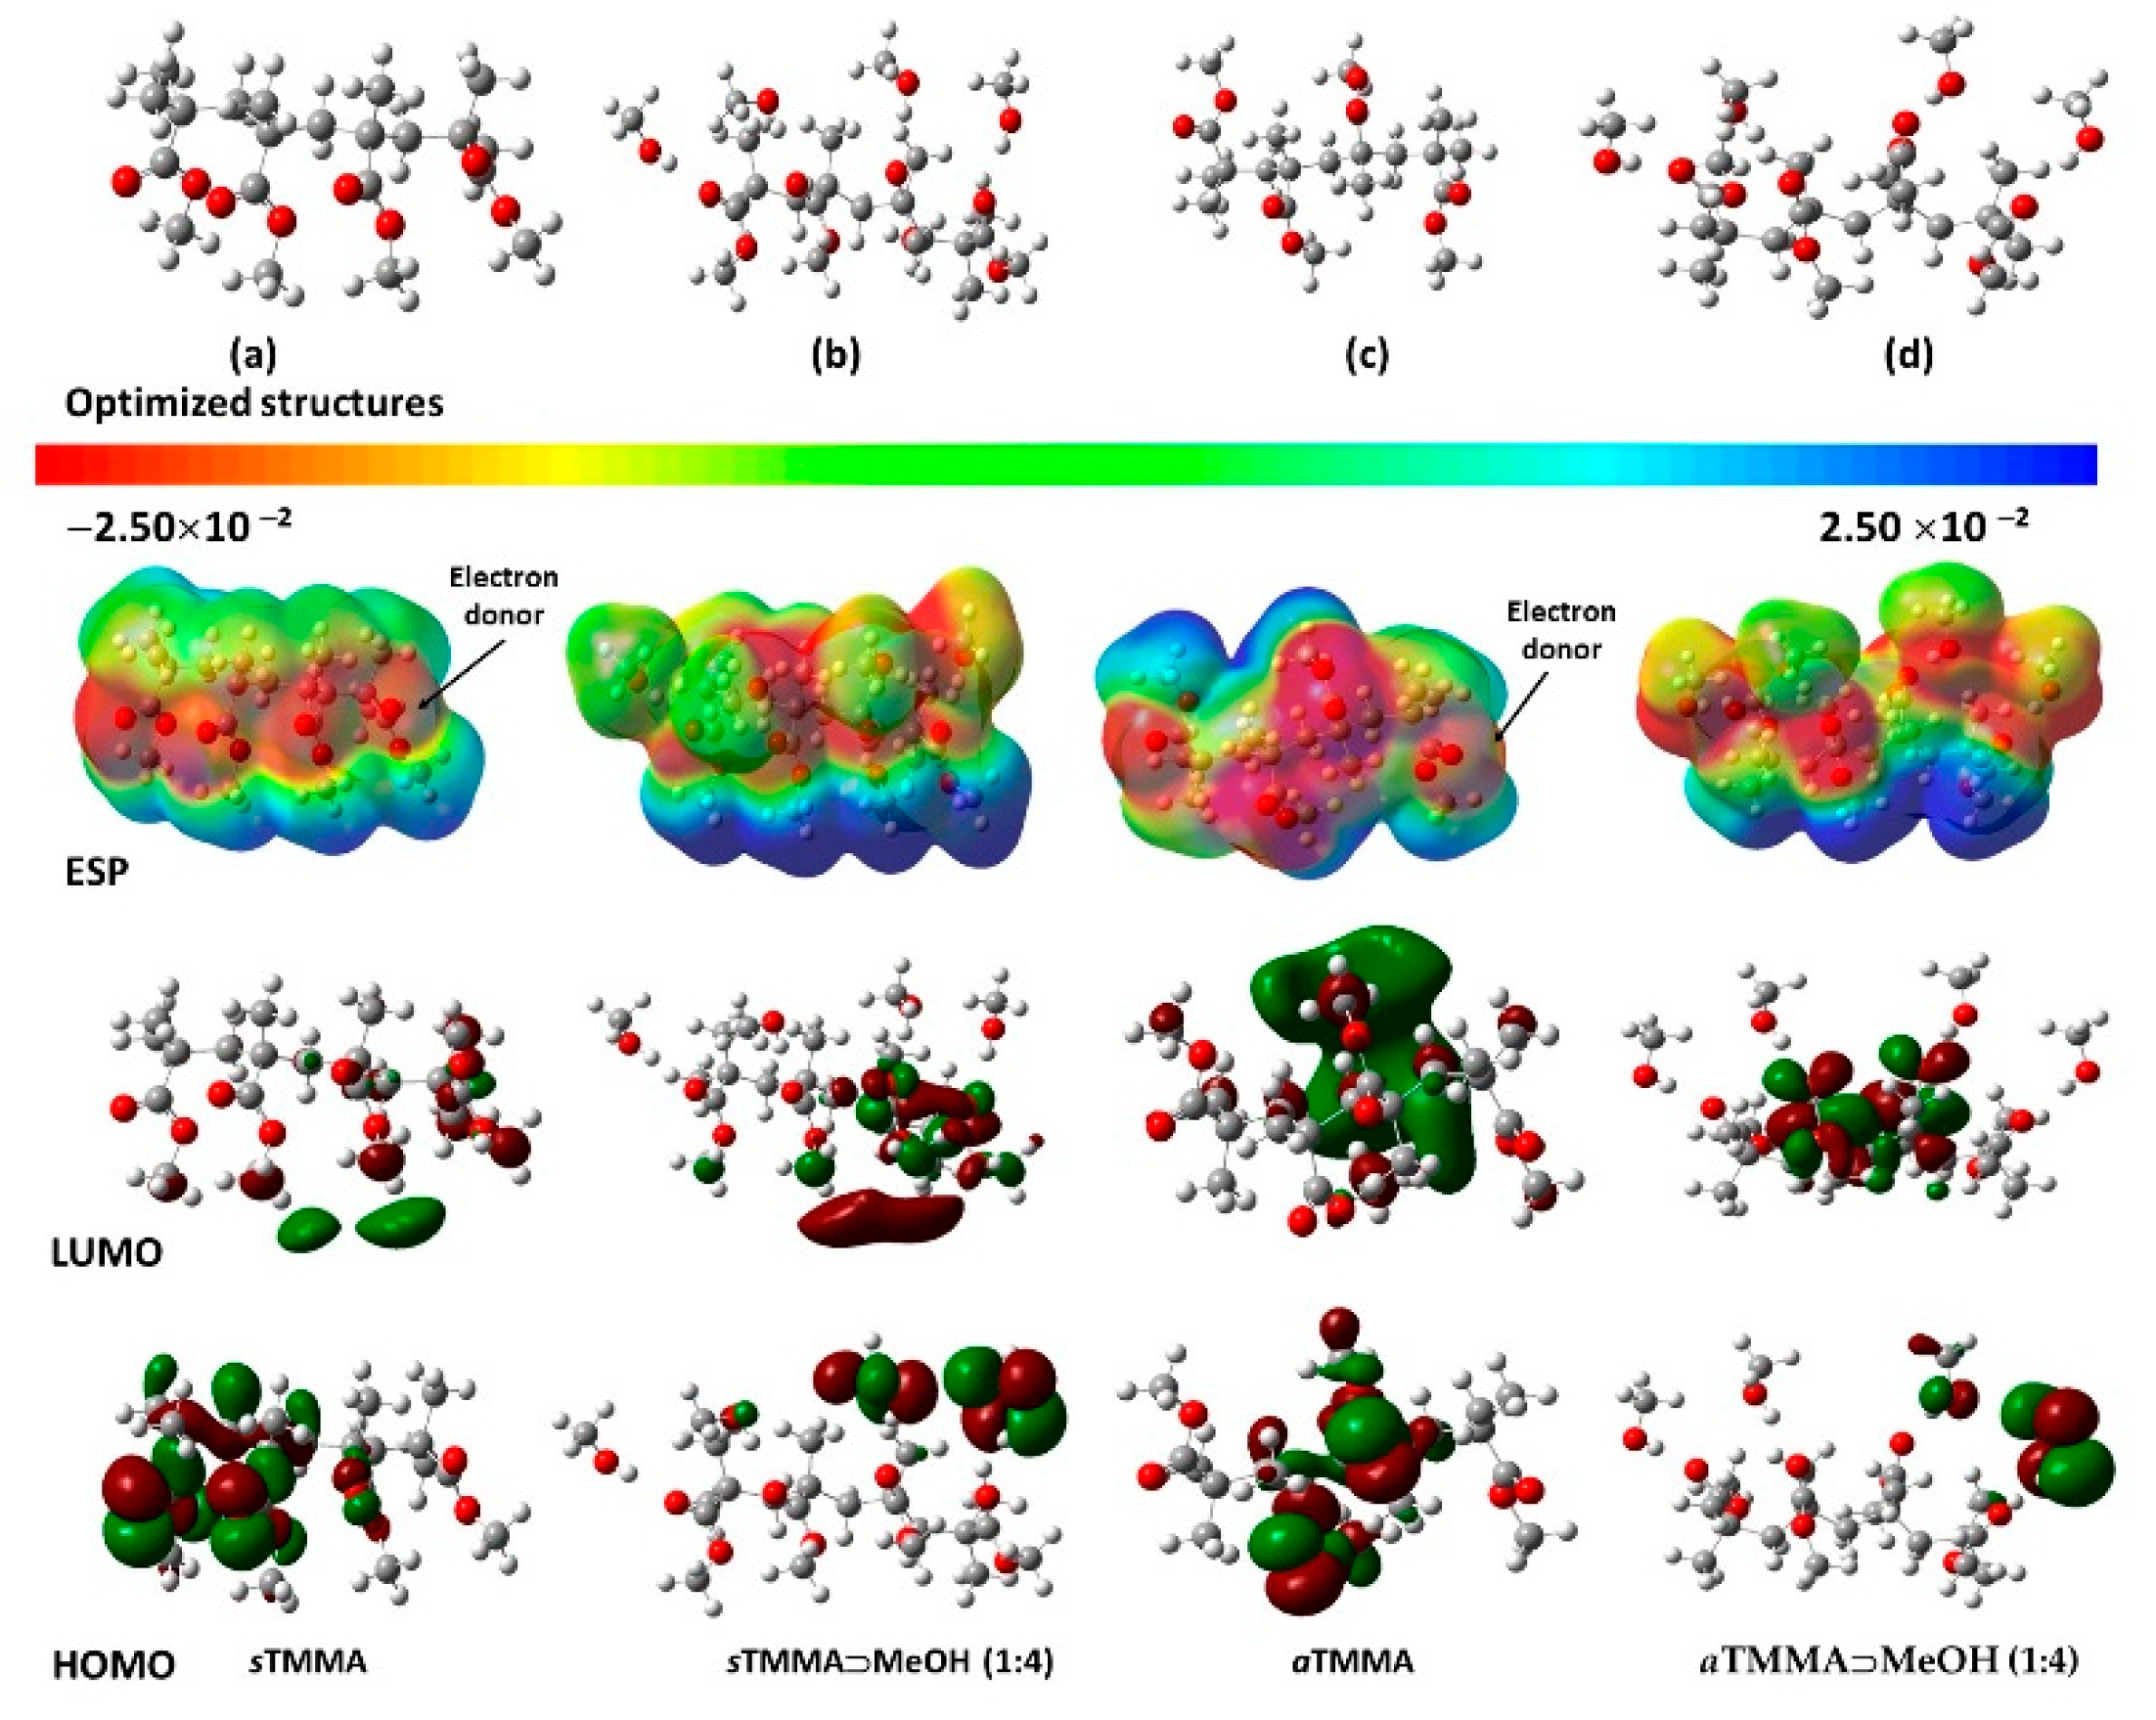
- The difference in stability between the two tetrameric segments (sTMMA and aTMMA) as measured using their HOMO-LUMO gaps (ΔEgap) was relatively small (0.130 eV), whereas there was a much larger relative difference between the EAs (0.268 eV), the ω values (0.284 eV) and the dipole moments (3.774 Debyes), shown for the aTMMA over the sTMMA. The higher dipole moment for the aTMMA could be easily visualized from the ESP map shown in Figure 10c. This could account for the stronger binding of the isotactic polymer (used in this study) to the silicon surface.
- (d)
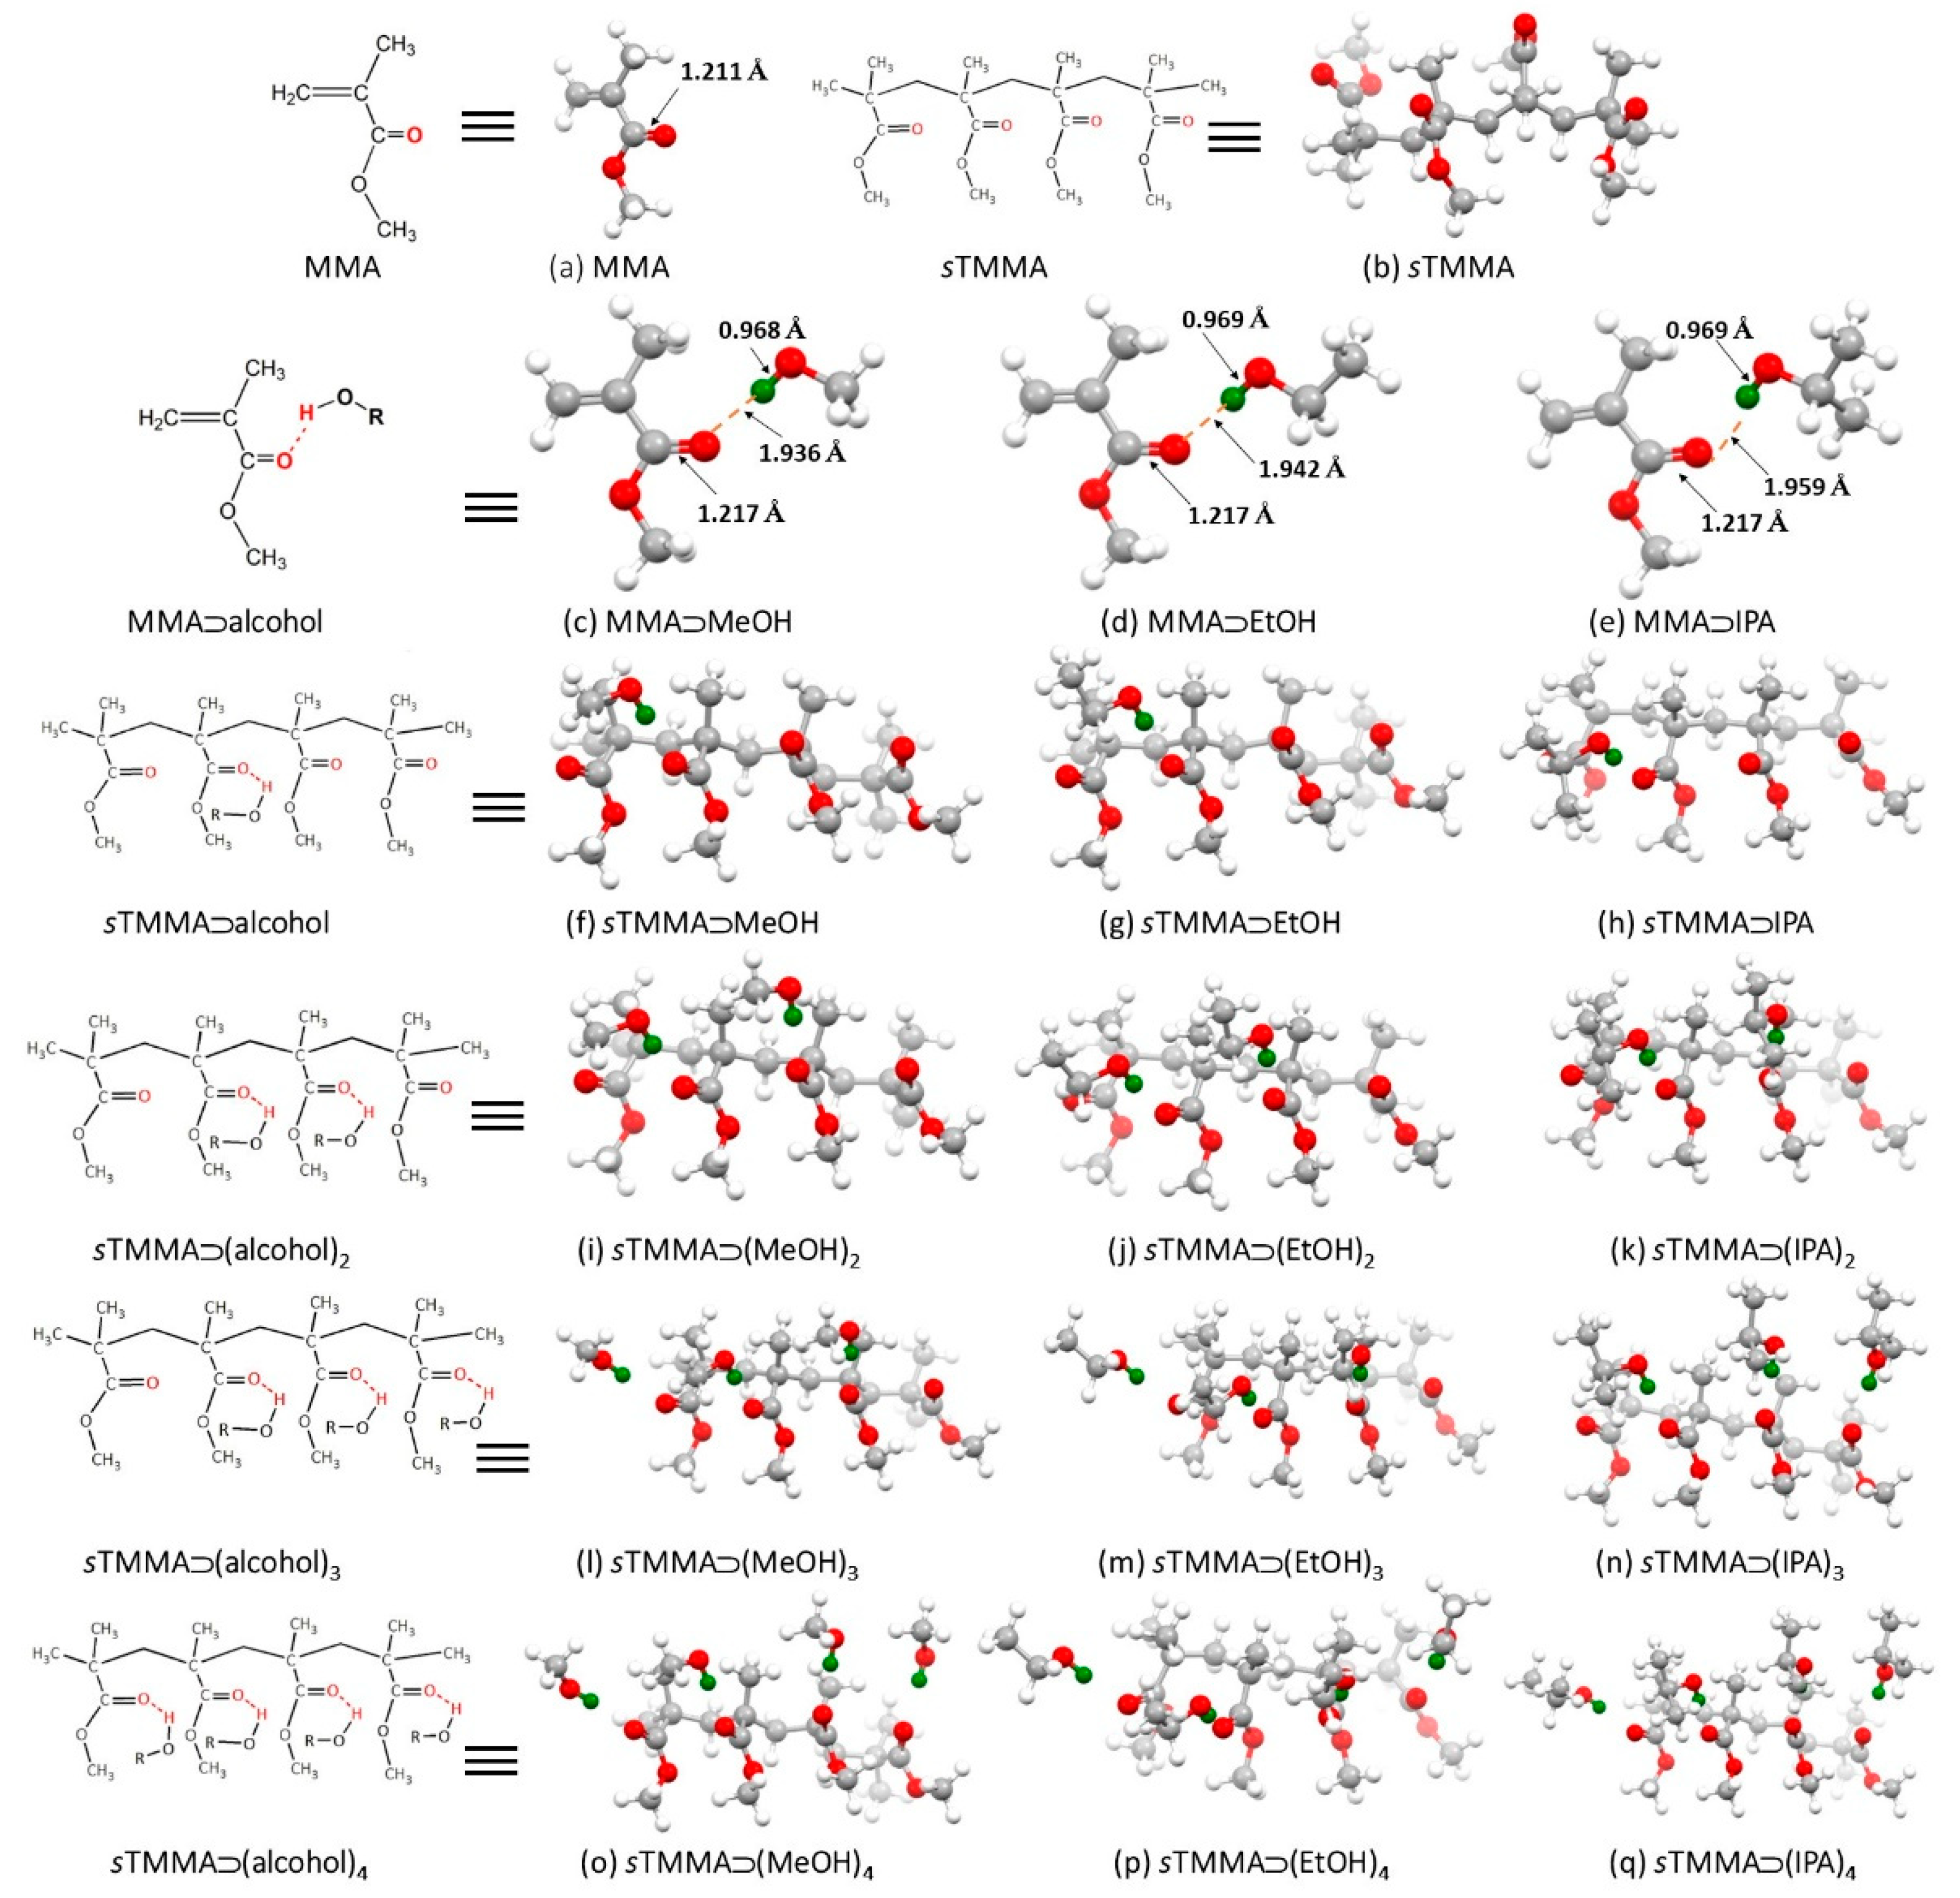
- In contrast, the stability for the model 1:4 complexes of sTMMA vs. aTMMA binding with methanol (and the other alcohols) favors the sTMMA.

| EHOMO (eV) | ELUMO (eV) | ΔEgap (eV) | IP (eV) | EA (eV) | χ (eV) | μ (eV) | η (eV) | S (eV) | ω (eV) | dm (Debye) | |
|---|---|---|---|---|---|---|---|---|---|---|---|
| [MMA] | −7.605 | −1.525 | −6.080 | 7.605 | 1.525 | 4.565 | −4.565 | 3.040 | 0.329 | 3.427 | 1.763 |
| [sTMMA] | −7.467 | −0.477 | −6.990 | 7.467 | 0.477 | 3.972 | −3.972 | 3.495 | 0.286 | 2.257 | 6.031 |
| [aTMMA]) | −7.605 | −0.745 | −6.860 | 7.605 | 0.745 | 4.175 | −4.175 | 3.430 | 0.292 | 2.541 | 9.805 |
| [MeOH] | −7.737 | −0.360 | −7.377 | 7.737 | 0.360 | 4.048 | −4.048 | 3.689 | 0.271 | 2.222 | 1.890 |
| [EtOH] | −7.636 | −1.525 | −6.111 | 7.636 | 1.525 | 4.580 | −4.580 | 3.055 | 0.327 | 3.433 | 1.761 |
| [IPA] | −7.597 | −1.795 | −5.803 | 7.597 | 1.795 | 4.696 | −4.696 | 2.901 | 0.345 | 3.800 | 1.770 |
| [MMA] ⊃ [MeOH] (1:1) | −6.990 | −1.795 | −5.195 | 6.990 | 1.795 | 4.392 | −4.392 | 2.597 | 0.385 | 3.713 | 3.429 |
| [MMA] ⊃ [EtOH] (1:1) | −6.938 | −1.785 | −5.152 | 6.938 | 1.785 | 4.362 | −4.362 | 2.576 | 0.388 | 3.692 | 3.368 |
| [MMA] ⊃ [IPA] (1:1) | −6.961 | −1.773 | −5.188 | 6.961 | 1.773 | 4.367 | −4.367 | 2.594 | 0.386 | 3.677 | 3.289 |
| [sTMMA] ⊃ [MeOH] (1:4) | −6.850 | −0.690 | −6.160 | 6.850 | 0.690 | 3.770 | −3.770 | 3.080 | 0.325 | 2.308 | 10.361 |
| [aTMMA] ⊃ [MeOH] (1:4) | −6.709 | −0.991 | −5.718 | 6.709 | 0.991 | 3.850 | −3.850 | 2.859 | 0.350 | 2.592 | 9.373 |
| [sTMMA] ⊃ [EtOH] (1:4) | −6.777 | −0.680 | −6.097 | 6.777 | 0.680 | 3.729 | −3.729 | 3.048 | 0.328 | 2.280 | 9.410 |
| [aTMMA] ⊃ [EtOH] (1:4) | −6.846 | −0.898 | −5.948 | 6.846 | 0.898 | 3.872 | −3.872 | 2.974 | 0.336 | 2.520 | 8.960 |
| [sTMMA] ⊃ [IPA] (1:4) | −6.778 | −0.682 | −6.095 | 6.778 | 0.682 | 3.730 | −3.730 | 3.048 | 0.328 | 2.283 | 6.372 |
| [aTMMA] ⊃ [IPA] (1:4) | −6.609 | −1.046 | −5.562 | 6.609 | 1.046 | 3.827 | −3.827 | 2.781 | 0.360 | 2.634 | 11.586 |
Supplementary Materials
Author Contributions
Funding
Institutional Review Board Statement
Informed Consent Statement
Data Availability Statement
Acknowledgments
Conflicts of Interest
References
- David, E.; Niculescu, V.C. Volatile organic compounds (VOCs) as environmental pollutants: Occurrence and mitigation using nanomaterials. Int. J. Environ. Res. Public Health 2021, 18, 13147. [Google Scholar] [CrossRef] [PubMed]
- Li, Y.; Yan, B. Human health risk assessment and distribution of VOCs in a chemical site, Weinan, China. Open Chem. 2022, 20, 192–203. [Google Scholar] [CrossRef]
- Taylor, S.M.; Sider, D.; Hampson, C.; Taylor, S.J.; Wilson, K.; Walter, S.D.; Eyles, J.D. Community health effects of a petroleum refinery. Ecosyst. Health 2008, 3, 27–43. [Google Scholar] [CrossRef]
- Fung, A.G.; Rajapakse, M.Y.; McCartney, M.M.; Falcon, A.K.; Fabia, F.M.; Kenyon, N.J.; Davis, C.E. Wearable environmental monitor to quantify personal ambient volatile organic compound exposures. ACS Sens. 2019, 4, 1358–1364. [Google Scholar] [CrossRef] [PubMed]
- Seifert, B.; van de Wiel, H.J.; Dodet, B.; O’Neill, I.K. (Eds.) Volatile Organic Compounds in Environmental Carcinogens. Methods of Analysis and Exposure Measurement. Volume 12—Indoor Air; International Agency for Research on Cancer: Lyon, France, 1993; Volume 109, pp. 245–250, ISBN-13: 978-9283221098. [Google Scholar]
- World Health Organization. WHO Guidelines for Indoor Air Quality: Selected Pollutants; World Health Organization, Regional Office for Europe: Copenhagen, Denmark, 2010. Available online: https://apps.who.int/iris/handle/10665/260127 (accessed on 21 August 2022).
- Volatile Organic Compounds. Available online: https://www.lung.org/clean-air/at-home/indoor-air-pollutants/volatile-organic-compounds. (accessed on 28 July 2022).
- Haick, H.; Broza, Y.; Mochalski, P.; Ruzsanyi, V.; Amann, A. Assessment, origin, and implementation of breath volatile cancer markers. Chem. Soc. Rev. 2014, 43, 1423–1449. [Google Scholar] [CrossRef]
- Török, Z.-M.; Blaser, A.F.; Kavianynejad, K.; de Torrella, C.G.M.G.; Nsubuga, L.; Mishra, Y.K.; Rubahn, H.-G.; de Oliveira Hansen, R. Breath Biomarkers as Disease Indicators: Sensing Techniques. Approach for Detecting Breath Gas and COVID-19. Chemosensors 2022, 10, 167. [Google Scholar] [CrossRef]
- Kraut, J.A.; Mullins, M.E. Toxic Alcohols. N. Engl. J. Med. 2018, 378, 270–280. [Google Scholar] [CrossRef]
- Birková, A.; Hubková, B.; Čižmárová, B.; Bolerázska, B. Current view on the mechanisms of alcohol-mediated toxicity. Int. J. Mol. Sci. 2021, 22, 9686. [Google Scholar] [CrossRef]
- Rezende, G.C.; Le Calvé, S.; Brandner, J.J.; Newport, D. Micro photoionization detectors. Sens. Actuators B Chem. 2019, 287, 86–94. [Google Scholar] [CrossRef]
- Shiokawa, S.; Kondoh, J. Surface acoustic wave sensors. Jpn. J. Appl. Phys. 2004, 43, 2799. [Google Scholar] [CrossRef]
- Constantinoiu, I.; Viespe, C. Detection of volatile organic compounds using surface acoustic wave sensor based on nanoparticles incorporated in polymer. Coatings 2019, 9, 373. [Google Scholar] [CrossRef]
- Bur, C.; Andersson, M.E.; Spetz, A.L.; Schütze, A. Detecting volatile organic compounds in the ppb range with gas sensitive platinum gate SiC-field effect transistors. IEEE Sens. J. 2014, 14, 3221–3228. [Google Scholar] [CrossRef]
- Lerchner, J.; Caspary, D.; Wolf, G. Calorimetric detection of volatile organic compounds. Sens. Actuators B Chem. 2000, 70, 57–66. [Google Scholar] [CrossRef]
- Lourenço, C.; Bergin, S.; Hodgkinson, J.; Francis, D.; Staines, S.E.; Saffell, J.R.; Walton, C.; Tatam, R.P. Instrumentation for quantitative analysis of volatile compounds emission at elevated temperatures. Part 1: Design and implementation. Sci. Rep. 2020, 10, 8700. [Google Scholar] [CrossRef]
- Georghiou, P.E.; Snow, D.; Williams, D.T. Formaldehyde monitoring in urea-formaldehyde foam-insulated houses in St. John’s, Newfoundland, Canada: Correlative field evaluation of a real-time infrared spectrophotometric method. Environ. Int. 1983, 9, 279–287. [Google Scholar] [CrossRef]
- Thundat, T.; Chen, G.Y.; Warmack, R.J.; Allison, D.P.; Wachter, E.A. Vapor detection using resonating microcantilevers. Anal. Chem. 1995, 67, 519–521. [Google Scholar] [CrossRef]
- Maute, M.; Raible, S.; Prins, F.E.; Kern, D.P.; Ulmer, H.; Weimar, U.; Göpel, W. Detection of volatile organic compounds (VOCs) with polymer-coated cantilevers. Sens. Actuators B Chem. 1999, 58, 505–511. [Google Scholar] [CrossRef]
- Fadel, L.; Lochon, F.; Dufour, I.; Français, O. Chemical sensing: Millimeter size resonant microcantilever performance. J. Micromech. Microeng. 2004, 14, S23. [Google Scholar] [CrossRef]
- Dong, Y.; Gao, W.; You, Z. Trace gas sensor based on MEMS cantilever resonator. Adv. Mat. Res. 2011, 383–390, 3115–3120. [Google Scholar] [CrossRef]
- Mamou, D.; Nsubuga, L.; Lisboa Marcondes, T.; Høegh, S.O.; Hvam, J.; Niekiel, F.; Lofink, F.; Rubahn, H.-G.; de Oliveira Hansen, R. Surface modification enabling reproducible cantilever functionalization for industrial gas sensors. Sensors 2021, 21, 6041. [Google Scholar] [CrossRef]
- Risplendi, F.; Ricci, A.; Cicero, G. Functionalization layer effect on the mechanical properties of silicon based micro-cantilever mass sensors: A theoretical study. Sens. Actuators B Chem. 2014, 195, 177–180. [Google Scholar] [CrossRef]
- Battiston, F.M.; Ramseyer, J.-P.; Lang, H.P.; Baller, M.K.; Gerber, C.; Gimzewski, J.K.; Meyer, E.; Güntherodt, H.-J. A chemical sensor based on a microfabricated cantilever array with simultaneous resonance-frequency and bending readout. Sens. Actuators B Chem. 2001, 77, 122–131. [Google Scholar] [CrossRef]
- Misiakos, K.; Raptis, I.; Goustouridis, D.; Kitsara, M.; Contopanagos, H.; Gerardino, A.; Valamontes, E. Ultra-miniaturized monolithically integrated polymer coated Si optoelectronic cantilevers for gas sensing applications. In Proceedings of the SENSORS, 2009 IEEE, Christchurch, New Zealand, 25–28 October 2009; pp. 429–432. [Google Scholar] [CrossRef]
- Shin, S.; Paik, J.K.; Lee, N.E.; Park, J.S.; Park, H.D.; Lee, J. Gas sensor application of piezoelectric cantilever nanobalance; electrical signal read-out. Ferroelectrics 2005, 328, 59–65. [Google Scholar] [CrossRef]
- Steffens, C.; Leite, F.L.; Manzoli, A.; Sandoval, R.D.; Fatibello, O.; Herrmann, P.S.P. Microcantilever sensors coated with a sensitive polyaniline layer for detecting volatile organic compounds. J. Nanosci. Nanotechnol. 2014, 14, 6718–6722. [Google Scholar] [CrossRef]
- Al-Gawati, M.A.; Alhazaa, A.; Albrithen, H.; Alnofiay, J.; Alodhayb, A. Effect of surface patterning using femtosecond laser on micromechanical and structural properties of micromechanical sensors. Mater. Res. Express 2020, 7, 085904. [Google Scholar] [CrossRef]
- Aloraini, D.A.; Almuqrin, A.H.; Alanazi, A.; Ain, Q.T.; Alodhayb, A.N. Rapid and sensitive detection of severe acute respiratory syndrome coronavirus 2 in label-free manner using micromechanical sensors. Sensors 2021, 21, 4439. [Google Scholar] [CrossRef] [PubMed]
- Frisch, M.J.; Trucks, G.W.; Schlegel, H.B.; Scuseria, G.E.; Robb, M.A.; Cheeseman, J.R.; Scalmani, G.; Barone, V.; Petersson, G.A.; Nakatsuji, H.; et al. Gaussian 16, Revision C.01; Gaussian, Inc.: Wallingford, CT, USA, 2019. [Google Scholar]
- Kestner, N.R.; Combariza, J.E. Basis Set Superposition Errors: Theory and Practice. Reviews in Computational Chemistry; Wiley-VCH, John Wiley and Sons, Inc.: New York, NY, USA, 1999; Volume 13, p. 99. [Google Scholar] [CrossRef]
- Fukui, K.; Yonezawa, T.; Shingu, H. A molecular orbital theory of reactivity in aromatic hydrocarbons. J. Chem. Phys. 1952, 20, 722–725. [Google Scholar] [CrossRef]
- Koopmans, T. Ordering of wave functions and eigenvalues to the individual electrons of an atom. Physica 1933, 1, 104–113. [Google Scholar] [CrossRef]
- Luo, J.; Xue, Z.Q.; Liu, W.M.; Wu, J.L.; Yang, Z.Q. Koopmans’ theorem for large molecular systems within density functional theory. J. Phys. Chem. A 2006, 110, 12005–12009. [Google Scholar] [CrossRef]
- Ali, U.; Karim, K.J.B.; Buang, N.A. A Review of the properties and applications of poly (methyl methacrylate) (PMMA). Polym. Rev. 2015, 55, 678–705. [Google Scholar] [CrossRef]
- Henry, A.C.; Tutt, T.J.; Galloway, M.; Davidson, Y.Y.; McWhorter, C.S.; Soper, S.A.; McCarley, R.L. Surface modification of poly(methyl methacrylate) used in the fabrication of microanalytical devices. Anal. Chem. 2000, 72, 5331–5337. [Google Scholar] [CrossRef]
- Shah, E.V.; Patel, C.M.; Roy, D.R. Structure, electronic, optical and thermodynamic behavior on the polymerization of PMMA: A DFT Investigation. Comp. Biol. Chem. 2018, 72, 192–198. [Google Scholar] [CrossRef] [PubMed]
- Murray, J.S.; Politzer, P. The electrostatic potential: An overview. Wiley Interdiscip. Rev. Comput. Mol. Sci. 2011, 1, 153–163. [Google Scholar] [CrossRef]
- Murray, J.S.; Sen, K. Molecular Electrostatic Potentials, Concepts and Applications; Elsevier: Amsterdam, The Netherlands, 1996. [Google Scholar] [CrossRef]
- Politzer, P.; Murray, J. The fundamental nature and role of the electrostatic potential in atoms and molecules. Theor. Chem. Acc. 2002, 108, 134–142. [Google Scholar] [CrossRef]


| Analyte | Vapor Pressure (Vp) (kPa) | mg | Concentration (mg/L = ppm) | Deflection (nm) |
|---|---|---|---|---|
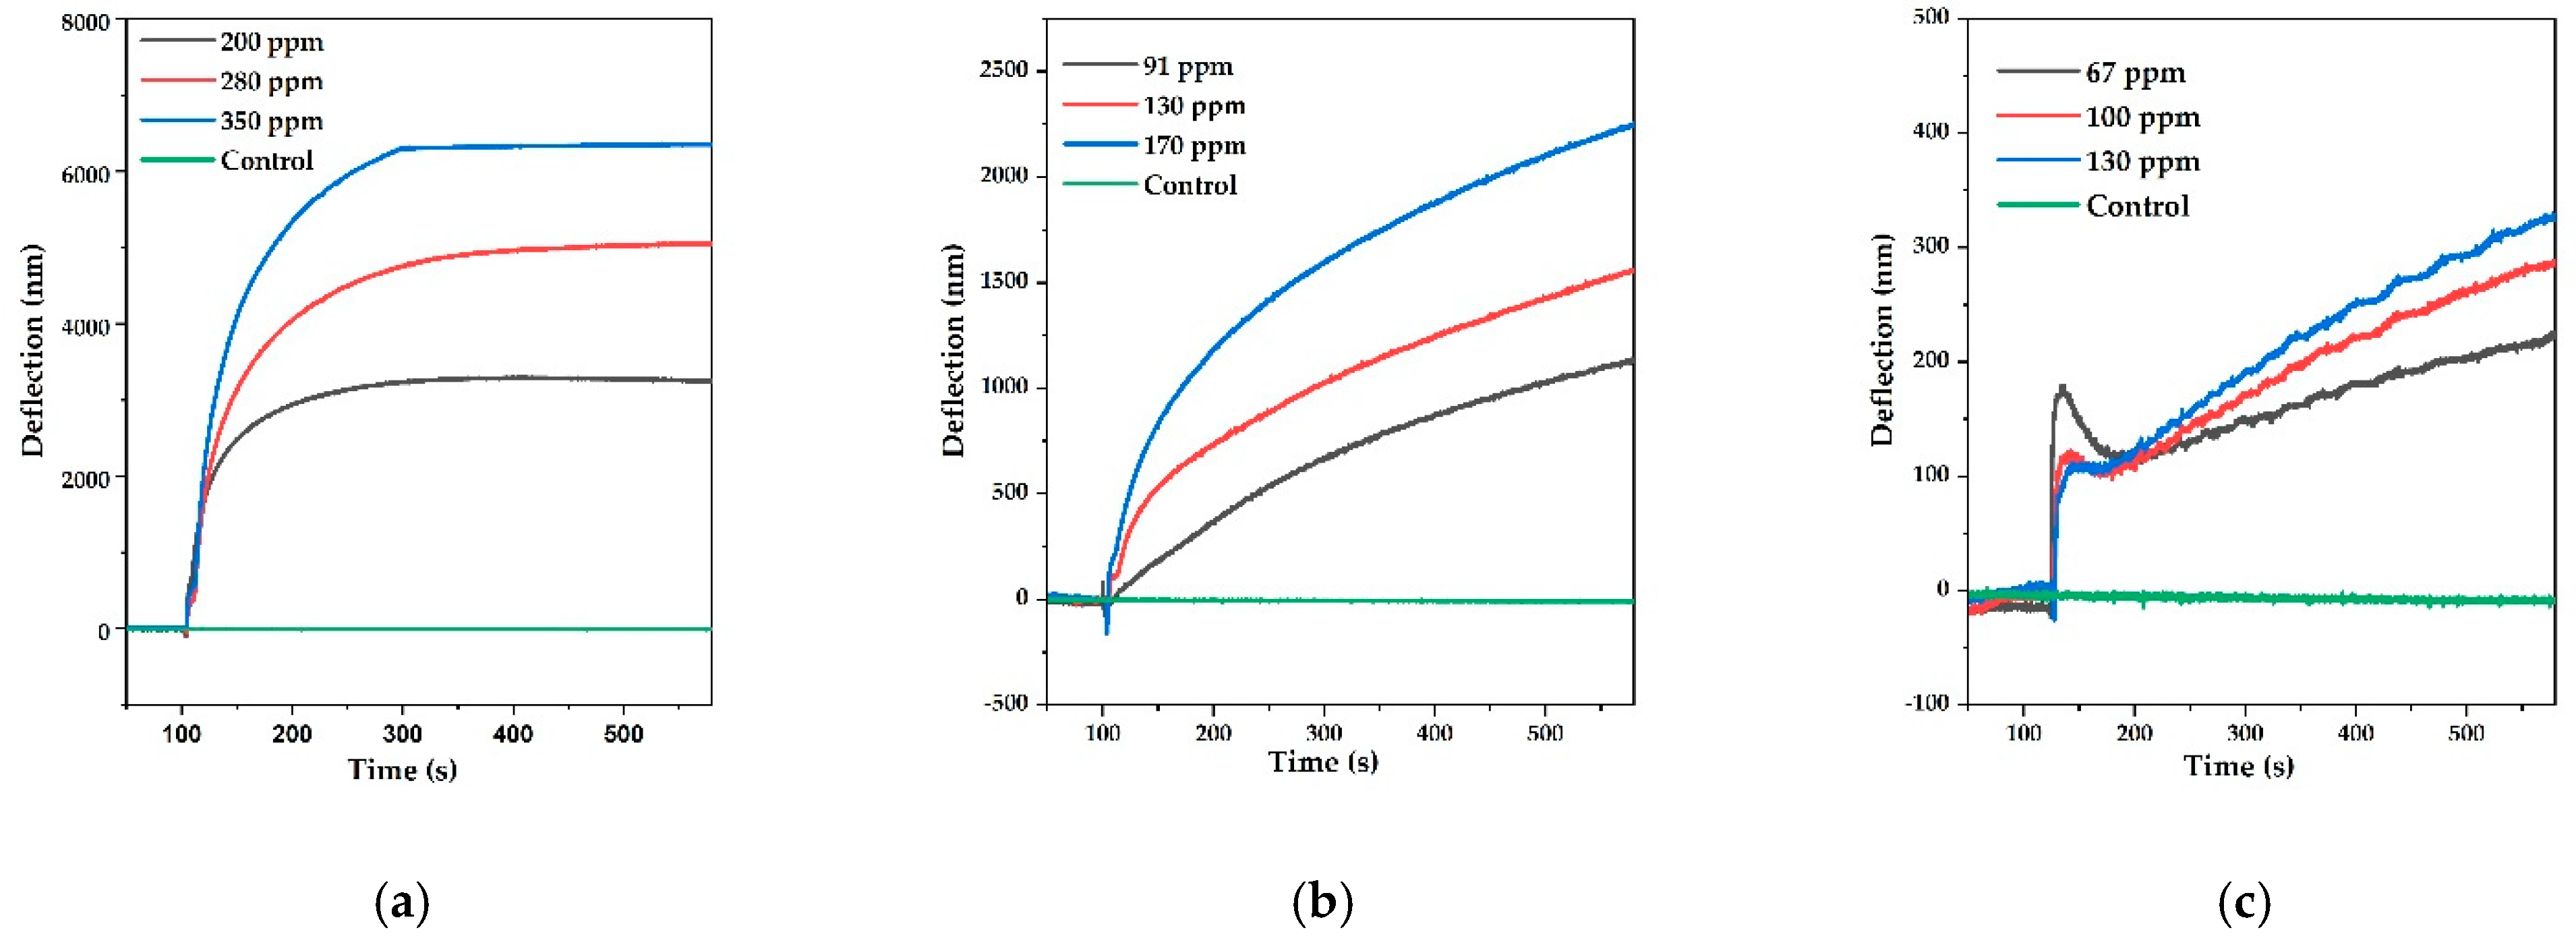
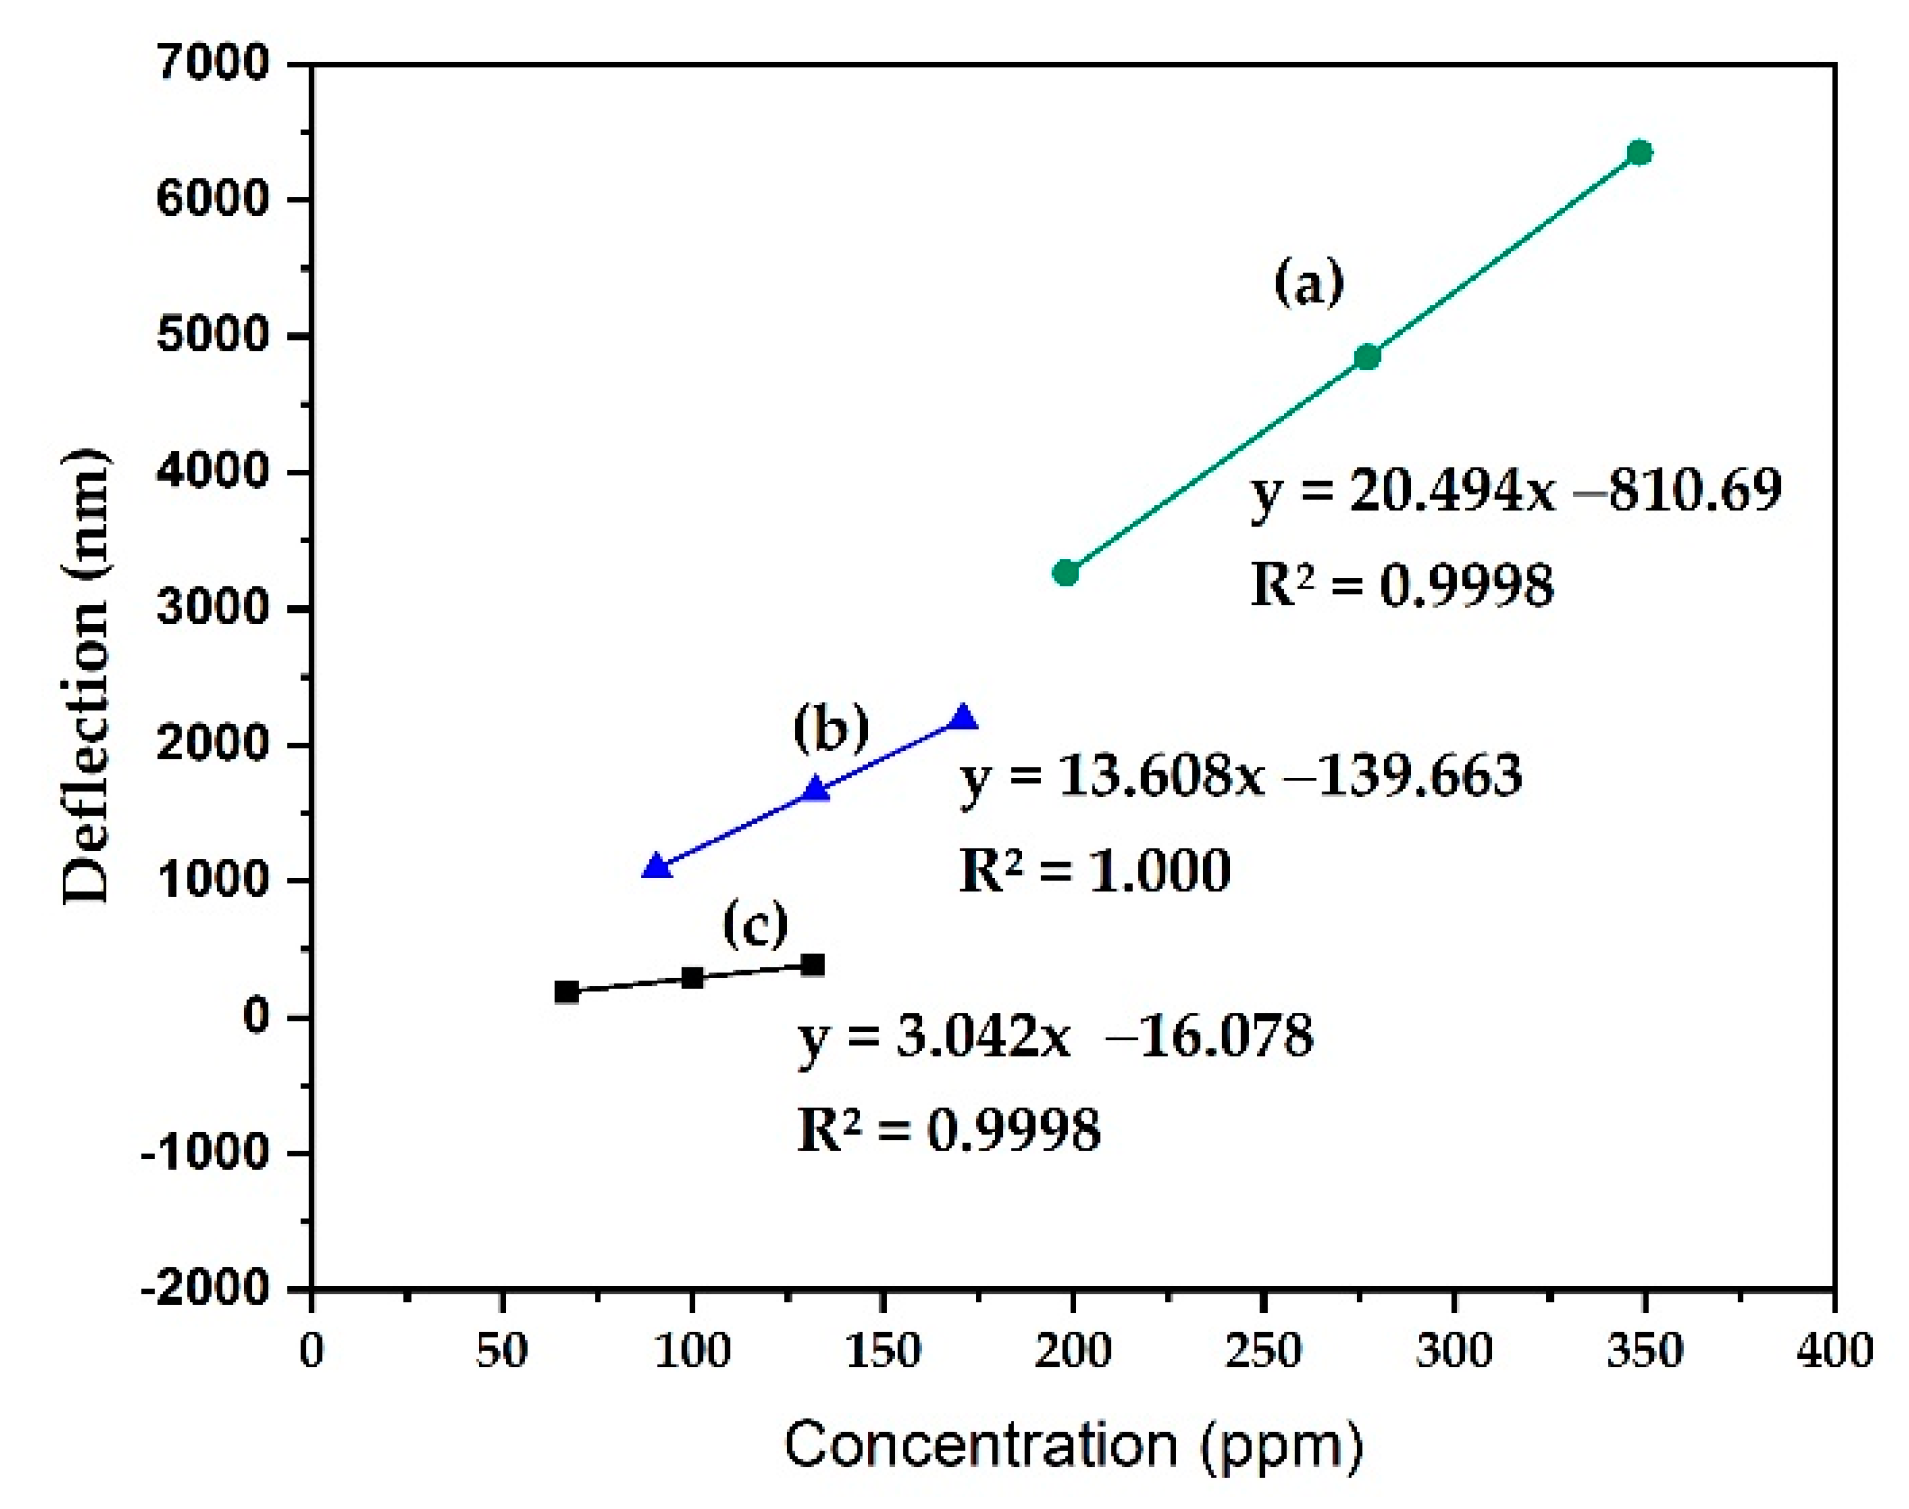
| Methanol | 15.2 | 4.95 | 200 | 3.3 × 10³ ± (4.59%) |
| 21.8 | 6.93 | 280 | 4.8 × 10³ ± (5.16%) | |
| 27.9 | 8.72 | 350 | 6.4 × 10³ ± (5.81%) | |
| Ethanol | 6.97 | 2.26 | 91 | 1.1 × 10³ ± (5.24%) |
| 10.4 | 3.30 | 130 | 1.7 × 10³ ± (6.41%) | |
| 13.7 | 4.28 | 170 | 2.2 × 10³ ± (6.18%) | |
| Isopropanol | 5.14 | 1.67 | 67 | 1.9 × 10² ± (4.87%) |
| 7.88 | 2.50 | 100 | 2.9 × 10² ± (6.28%) | |
| 10.5 | 3.29 | 130 | 3.9 × 10² ± (5.06%) |
| Complex | Electronic Interaction Energies (ΔIE kJ/mole) of the VOC Analytes | |||||
|---|---|---|---|---|---|---|
| Methanol | Ethanol | Isopropanol | ||||
| Uncorrected BSSE | Corrected BSSE | Uncorrected BSSE | Corrected BSSE | Uncorrected BSSE | Corrected BSSE | |
| [MMA] ⊃ [analyte] (1:1) | −22.38 | −20.62 | −21.58 | −19.92 | −20.74 | −19.07 |
| [sTMMA] ⊃ [analyte] (1:1) | −22.35 | −19.03 | −21.02 | −18.10 | −20.07 | −17.23 |
| [aTMMA] ⊃ [analyte] (1:1) | −18.09 | −16.05 | −18.02 | −15.45 | −16.99 | −14.78 |
| [sTMMA] ⊃ [analyte] (1:2) | −42.82 | −36.80 | −40.58 | −34.97 | −38.68 | −33.29 |
| [aTMMA] ⊃ [analyte] (1:2) | −39.99 | −35.23 | −37.66 | −33.15 | −34.52 | −30.31 |
| [sTMMA] ⊃ [analyte] (1:3) | −64.59 | −56.82 | −61.47 | −54.24 | −58.99 | −51.74 |
| [aTMMA] ⊃ [analyte] (1:3) | −62.91 | −56.96 | −59.17 | −52.71 | −56.19 | −49.66 |
| [sTMMA] ⊃ [analyte] (1:4) | −86.63 | −76.31 | −82.50 | −72.81 | −79.10 | −69.43 |
| [aTMMA] ⊃ [analyte] (1:4) | −84.34 | −76.28 | −80.47 | −71.76 | −77.82 | −69.12 |
Publisher’s Note: MDPI stays neutral with regard to jurisdictional claims in published maps and institutional affiliations. |
© 2022 by the authors. Licensee MDPI, Basel, Switzerland. This article is an open access article distributed under the terms and conditions of the Creative Commons Attribution (CC BY) license (https://creativecommons.org/licenses/by/4.0/).
Share and Cite
Alsaigh, R.A.; Rahman, S.; Alfaifi, F.S.; Al-Gawati, M.A.; Shallaa, R.; Alzaid, F.; Alanazi, A.F.; Albrithen, H.; Alzahrani, K.E.; Assaifan, A.K.; et al. Detection of Volatile Alcohol Vapors Using PMMA-Coated Micromechanical Sensors: Experimental and Quantum Chemical DFT Analysis. Chemosensors 2022, 10, 452. https://doi.org/10.3390/chemosensors10110452
Alsaigh RA, Rahman S, Alfaifi FS, Al-Gawati MA, Shallaa R, Alzaid F, Alanazi AF, Albrithen H, Alzahrani KE, Assaifan AK, et al. Detection of Volatile Alcohol Vapors Using PMMA-Coated Micromechanical Sensors: Experimental and Quantum Chemical DFT Analysis. Chemosensors. 2022; 10(11):452. https://doi.org/10.3390/chemosensors10110452
Chicago/Turabian StyleAlsaigh, Reem A., Shofiur Rahman, Fatimah S. Alfaifi, Mahmoud A. Al-Gawati, Raghad Shallaa, Fatimah Alzaid, Amal F. Alanazi, Hamad Albrithen, Khalid E. Alzahrani, Abdulaziz K. Assaifan, and et al. 2022. "Detection of Volatile Alcohol Vapors Using PMMA-Coated Micromechanical Sensors: Experimental and Quantum Chemical DFT Analysis" Chemosensors 10, no. 11: 452. https://doi.org/10.3390/chemosensors10110452
APA StyleAlsaigh, R. A., Rahman, S., Alfaifi, F. S., Al-Gawati, M. A., Shallaa, R., Alzaid, F., Alanazi, A. F., Albrithen, H., Alzahrani, K. E., Assaifan, A. K., Alodhayb, A. N., & Georghiou, P. E. (2022). Detection of Volatile Alcohol Vapors Using PMMA-Coated Micromechanical Sensors: Experimental and Quantum Chemical DFT Analysis. Chemosensors, 10(11), 452. https://doi.org/10.3390/chemosensors10110452