Article

Plasmonic Sensing of Glucose Based on Gold–Silver Core–Shell Nanoparticles

1
Key Laboratory of Flexible Electronics, and School of Flexible Electronics (Future Technologies), Institute of Advanced Materials, Nanjing Tech University, 30 South Puzhu Road, Nanjing 211816, China
2
Frontiers Science Center for Flexible Electronics, Xi’an Institute of Flexible Electronics, and Xi’an Institute of Biomedical Materials & Engineering, Northwestern Polytechnical University, 127 West Youyi Road, Xi’an 710072, China
*
Author to whom correspondence should be addressed.
Chemosensors 2022, 10(10), 404; https://doi.org/10.3390/chemosensors10100404
Submission received: 18 September 2022 / Revised: 2 October 2022 / Accepted: 5 October 2022 / Published: 8 October 2022
(This article belongs to the Special Issue Advanced Bio-Chemical Sensors Based on Plasmonic Nanostructures)

Abstract

:
Developing a simple and convenient approach for glucose sensing is crucially important in disease diagnosis and health monitoring. In this work, a glucose sensor based on plasmonic nanostructures was developed using gold–silver core–shell nanoparticles as the sensing platform. Based on the oxidative etching of the silver shell, the concentration of hydrogen peroxide and glucose could be determined quantitatively via the spectral change. This spectral change could also be observed with the naked eye or with a phone camera, realizing colorimetric sensing. To demonstrate this, glucose solutions at different concentrations were quantitatively detected in a wide concentration range of 0–1.0 mM using this colorimetric sensor. Importantly, shell thickness could significantly affect the sensitivity of our colorimetric sensor. This work provides a deeper understanding of the plasmonic sensing of glucose, which will help to realize its real applications. Based on this strategy, the non-invasive sensing of metabolites may be realized for disease diagnosis and health monitoring.

1. Introduction

Glucose supplies energy for biological cells and is one of the most important metabolic intermediates [1,2,3,4]. The sensing of glucose in biological systems is crucially important in disease diagnosis and health monitoring [5,6,7]. In particular, the convenient and cost-effective sensing of glucose in the body fluids of sweat, saliva, tears, and urine could provide a non-invasive approach to early diagnosis and health monitoring [5,6,8,9]. Therefore, it is of great importance to develop a simple, convenient, and cost-effective way to detect the glucose level in human fluids, particularly in sweat [10,11,12]. Many approaches, including electrochemical detection [13,14], fluorescence detection [15,16,17], and colorimetric detection [18,19,20], have been applied in the sensitive detection of glucose. In electrochemical sensing, electrochemical reactions happen on electrodes, producing an electrical signal that can be collected by an electrochemical station. A high sensitivity can be achieved in electrochemical sensing; however, a bulky instrument is usually needed [21]. Fluorescence sensing is realized using fluorescent molecules as probes, and the fluorescent spectral change in the probes is monitored using a photoluminescence spectrometer [22,23]. This type of fluorescence sensing is widely used and has been applied in various sensing applications. However, a bulky spectrometer is generally needed in this sensing process [24], limiting the application scenarios of this method. In contrast, colorimetric sensing can be realized using the naked eye or a phone camera, which generally every adult has access to. In colorimetric sensing, the color change in the detection units can be clearly observed by the naked eye or a smart phone [25,26]. Thus, the concentration of analytes can be determined. For sensitive colorimetric detection, the color change in the detection units can also be recorded and analyzed with a smart phone. Many systems can be utilized to realize colorimetric sensing systems.
Plasmonic nanostructures possess unique optical properties, and these properties are strongly related to the composition, size, shape, and surrounding environments of the plasmonic nanostructures [27,28,29,30]. Using plasmonic nanostructures, various sensing strategies have been developed. Surface plasmon resonance (SPR) sensing utilizes the spectral change in the total internal reflection beam induced by the surface adsorption of molecules on plasmonic structures [31,32]. The amount of molecular adsorption can be determined by the spectral change, and thus the molecules can be detected quantitatively. Based on plasmonic nanostructures, the intensity of Raman spectra can be largely enhanced, and this process is usually called surface-enhanced Raman scattering (SERS) [33]. Utilizing SERS, the sensitive detection of molecules can also be realized [34,35,36,37]. However, the fabrication of a uniform and high-enhancement SERS-sensing platform is still a great challenge [27]. In the abovementioned plasmon-based sensing system, specific and bulky instruments are usually needed, and the sensing process is generally complicated. Therefore, it is still necessary to develop simple and effective sensing platforms based on plasmonic nanostructures. As is known, plasmonic nanostructures usually have strong light absorption and scattering because of the localized surface plasmon resonance (LSPR). Therefore, they show unique colors, and these colors are strongly dependent on the size, shape, and surrounding environments of the plasmonic nanostructures. Thus, colorimetric sensing can be realized based on plasmonic nanostructures [38]. The sensing process is highly simple, convenient, and effective. How to improve its sensitivity and expand its applications is always a hot topic in this field.
Herein, a colorimetric sensing platform based on plasmonic nanostructures was fabricated. Gold–silver core–shell nanoparticles (Au@Ag NPs) were employed as plasmonic nanostructures, and the shell thickness could be thinned during the sensing of hydrogen peroxide (H2O2) and glucose. Based on the color change during shell thinning, the concentration of H2O2 and glucose could be precisely determined. Moreover, it was revealed that the initial shell thickness is important in optimizing the sensitivity of H2O2 and glucose sensing. Glucose sensing at various concentrations was also demonstrated and might be used for the non-invasive sensing of glucose in sweat in the near future. This work provides a simple, convenient, and effective approach to detect the glucose level in human sweat and may find promising applications in health monitoring and the early diagnosis of disease.

2. Materials and Methods

Preparation of Au NPs and Au@Ag NPs. Au NPs with an average diameter of 11.4 nm were synthesized using a previously reported procedure [39,40]. Au@Ag NPs were synthesized using 20 mL of the as-prepared Au NPs as templates (Scheme 1). Then, 1–1.5 mL of silver nitrate (10 mM) and 1 mL of sodium citrate (1 wt%) were injected in 20 mL of Au NP colloid boiling in an oil bath at 120 °C. After 30 min of reaction, the Au@Ag NPs were obtained and were stored in a fridge at −4 °C before usage.
Characterizations of Au NPs and Au@Ag NPs. The morphology of samples was measured on a transmission electron microscope (TEM, JEM-2010 UHR, JEOL, Tokyo, Japan) at an acceleration voltage of 120 kV, and the extinction spectra were acquired on a UV-Vis spectrometer (UV-1750, Shimadzu, Japan).
Sensing of H2O2 solutions. Different concentrations of H2O2 were prepared in an aqueous solution for sensing. In H2O2 sensing, 200 µL of H2O2 solution was mixed with 20 µL of Au@Ag NPs, and the sample was kept at room temperature for 10 min. The sample change was detected with a UV-Vis spectrometer (UV-1750, Shimadzu, Kyoto, Japan) and a camera. Photographs of the samples were taken with a digital camera (EOS 700D, Canon, Tokyo, Japan). To guarantee the reliability and accurateness of colorimetric detection, the image acquisition was carried out indoors, and curtains were used to minimize the influence of outdoor light. Moreover, a single smartphone camera was used for the whole image acquisition, and the sample–smartphone distance and orientation were kept unchanged during the whole image acquisition to minimize the appearance of artifacts. Then, the R, G, and B channels of the photographs were split up on a computer using ImageJ software, and the values were extracted and plotted for the data analysis of H2O2 concentrations.
Sensing of glucose solutions. Different concentrations of glucose were prepared in an MOPS buffer for sensing. For glucose sensing, 0.5 µL of 20 mg mL−1 of glucose oxidase (GOx) was mixed with 20 µL of Au@Ag NPs and 200 µL of glucose solution, and the mixture was kept at 37 °C for 10 min for incubation. After detection, photographs of the samples were taken and analyzed to determine glucose concentrations using the abovementioned method.

3. Results and Discussion

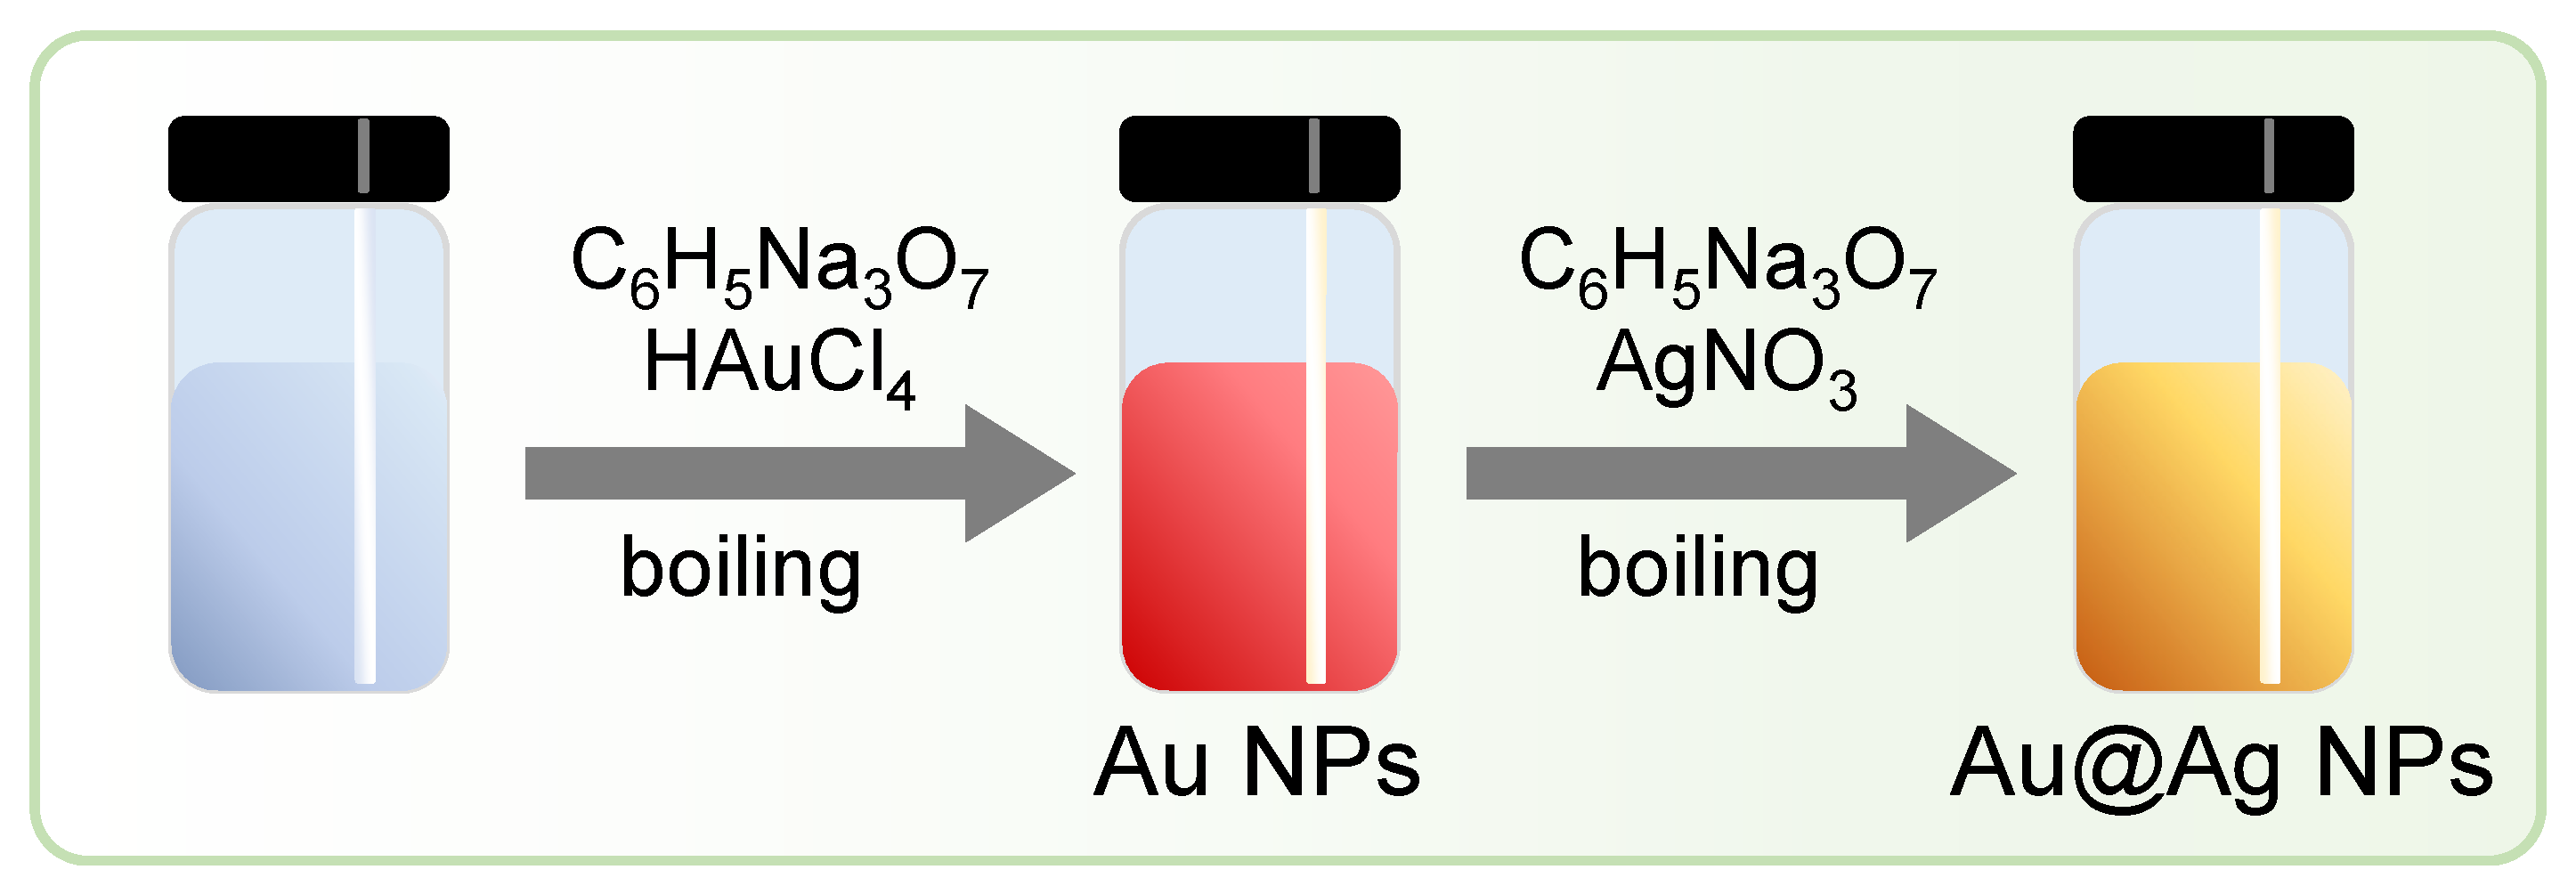
3.1. Design and Preparation of the Au@Ag NPs

Plasmonic nanostructures show unique extinction peaks because of the LSPR. The extinction peaks are usually highly sensitive to the properties of plasmonic nanostructures and their local environments. A slight change in composition, size, or shape could lead to a huge change in extinction spectrum [27,28,29,30], which could even be clearly observed by a UV-Vis spectrometer or the naked eye. For instance, Au-Ag core–shell plasmonic nanoparticles possess the extinction peaks of gold and silver simultaneously. The relative intensity of these two peaks is strongly related to the shell thickness of silver. On the other hand, silver is a readily oxidizable material. After oxidization, the silver shell becomes thinner, and thus the spectroscopic property of the Au@Ag NPs could experience an obvious change, which could easily be detected by a spectrometer or the naked eye.
Based on this principle, H2O2 and glucose could be detected quantitatively (Scheme 2). H2O2 can oxidize the silver shell, which has been reported in the literature [41,42], leading to an obvious change in the spectroscopic property of the Au-Ag core–shell nanoparticles. More importantly, the initial shell thickness can have a huge effect on the sensing process. In theory, the detection sensitivity should be highly dependent on the shell thickness. Therefore, it is necessary to investigate this plasmonic sensing extensively. Besides H2O2, glucose could also be detected with the Au@Ag NPs. The glucose is first oxidized to gluconic acid and H2O2 under the catalysis of GOx (Equation (1)). The H2O2 produced could oxidize and thin the silver shell of Au@Ag NPs. Based on this principle, the glucose could be detected quantitatively.
D glucose     GOx     H 2 O 2 + D glucono 1 , 5 lactone

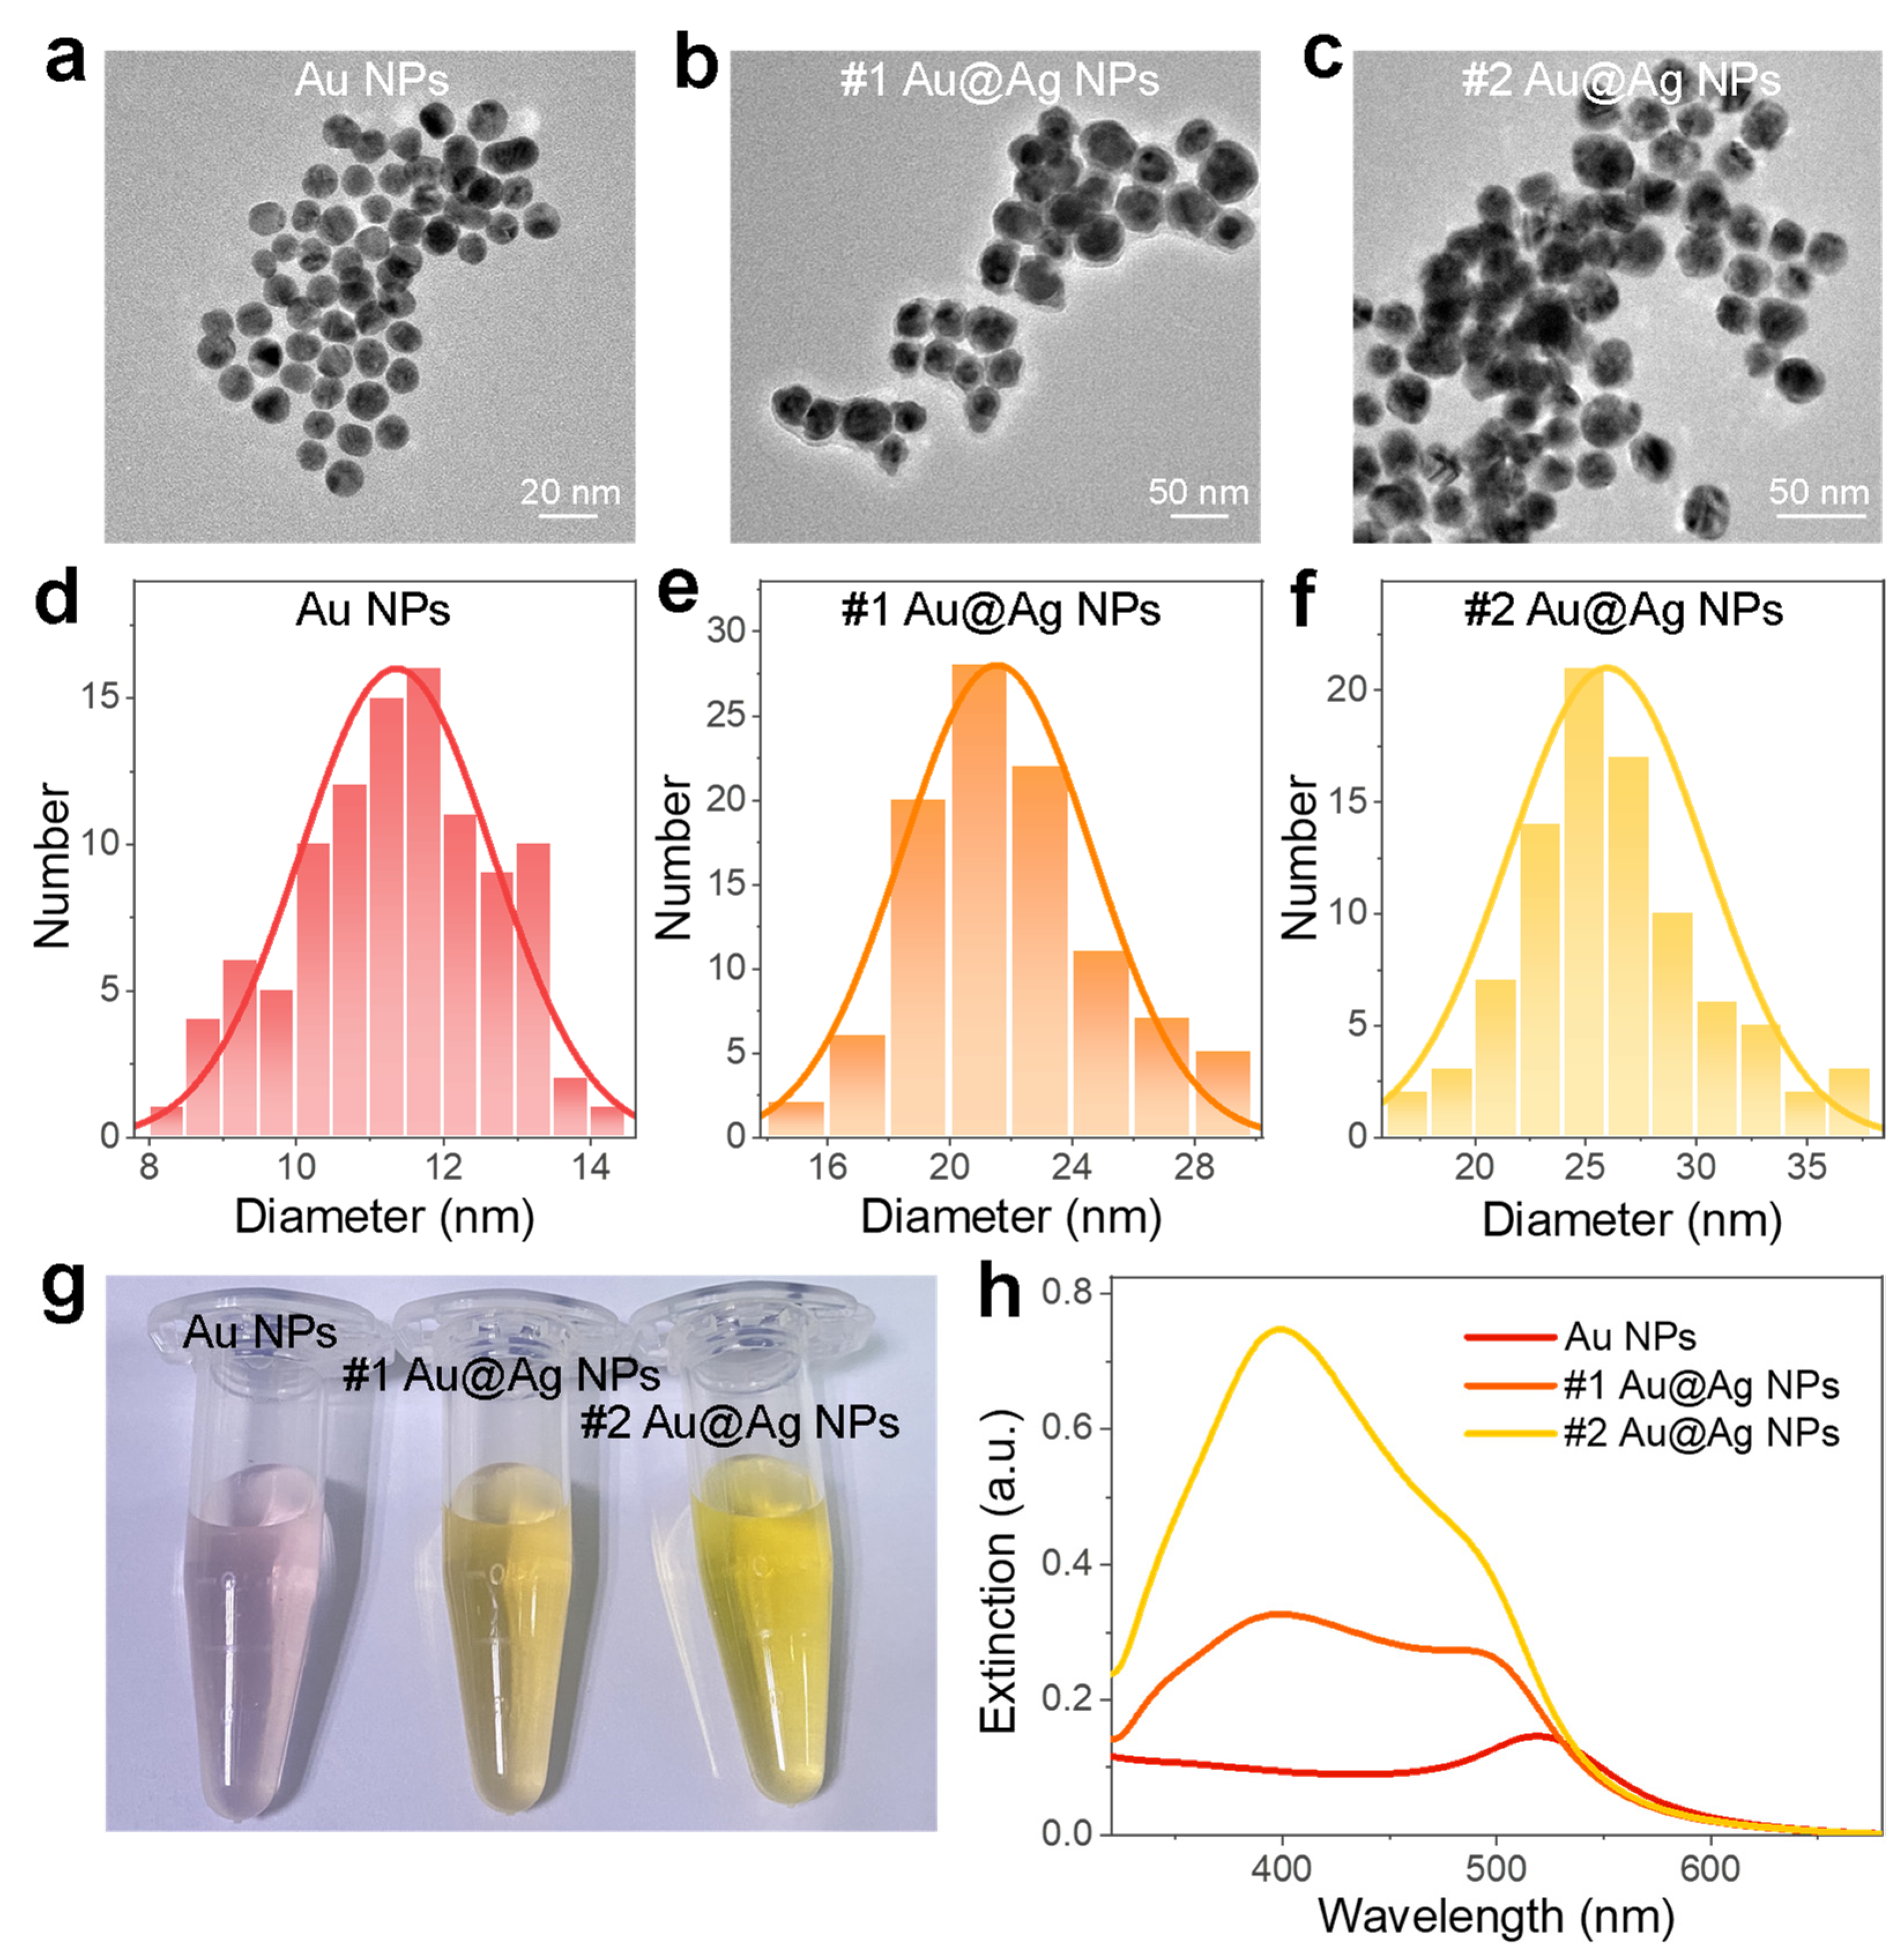
3.2. Characterizations of the Au@Ag NPs

In this work, a simple wet-chemical method was used to synthesize gold nanoparticles (Au NPs), which were then used as templates for the coating of silver shells in a wet-chemical synthesis. The obtained core–shell nanoparticles are referred to as Au@Ag NPs. As is shown in the transmission electron microscopy (TEM) image, the Au NPs used as templates were highly uniform in size and shape (Figure 1a). The average diameter of the Au NPs was ~11.4 nm. Using these Au NPs as templates, silver ions could be reduced to silver to form shells on the Au NPs. The thickness of the silver shells could be controlled by varying the amount of silver ions. Herein, we chose two shell thickness (Figure 1b–f), and the samples are referred to as #1 and #2 Au@Ag NPs, respectively. The average diameter of the #1 Au@Ag NPs was determined as 21.5 nm, suggesting an average shell thickness of 5.1 nm. The average diameter of the #2 Au@Ag NPs was determined as 26.0 nm, suggesting an average shell thickness of 7.3 nm. The optical properties of the Au NPs and the two types of Au@Ag NPs were quite different. As shown in the photographs, the Au NPs showed a red color, while the #1 and #2 Au@Ag NPs showed orange–yellow and yellow color, respectively (Figure 1g). Quantitative results could be clearly observed in ultraviolet–visible (UV-Vis) extinction spectra (Figure 1h). The Au NPs showed an extinction peak at ~520 nm, which is attributed to the plasmonic band of Au NPs. When the AuNPs were coated with a thin layer of silver shell, a new plasmonic band that is attributed to the LSPR of silver appeared at ~400 nm. This ~400 nm peak became stronger when the silver shell was thicker. These two types of Au@Ag NPs could both be used for quantitative analysis of H2O2 and glucose, and the effect of shell thickness in sensing will be discussed.

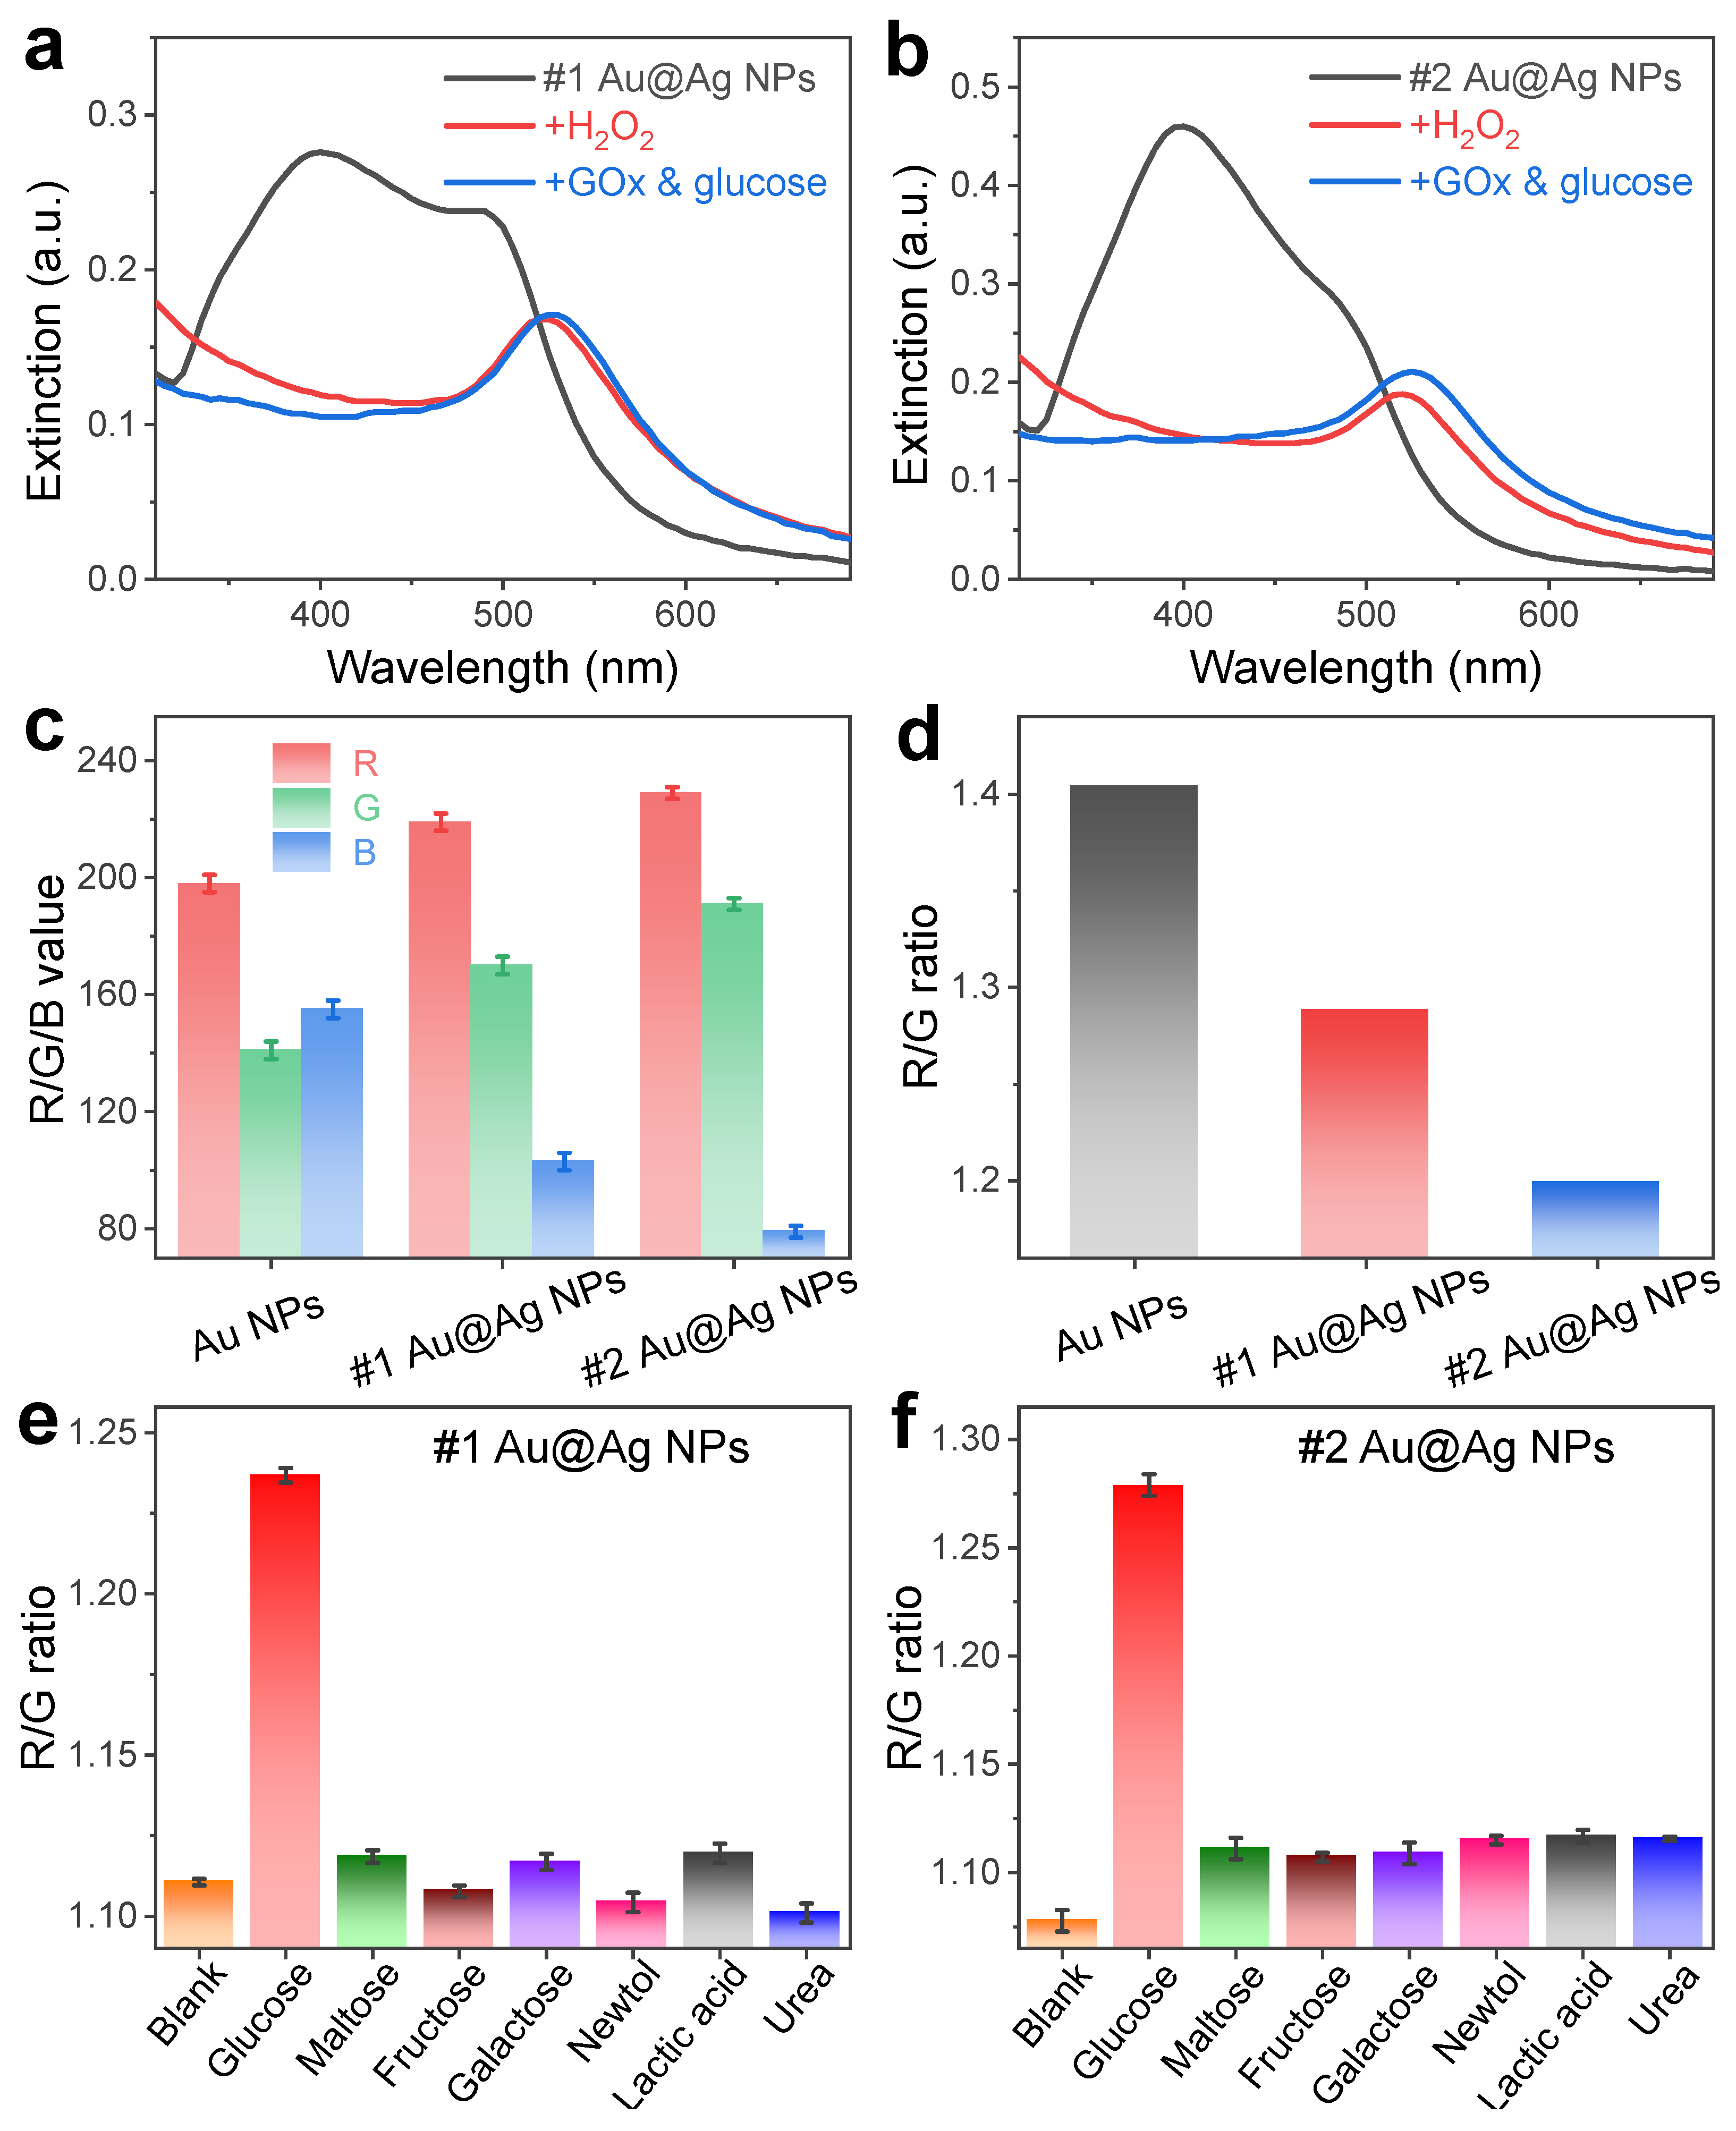
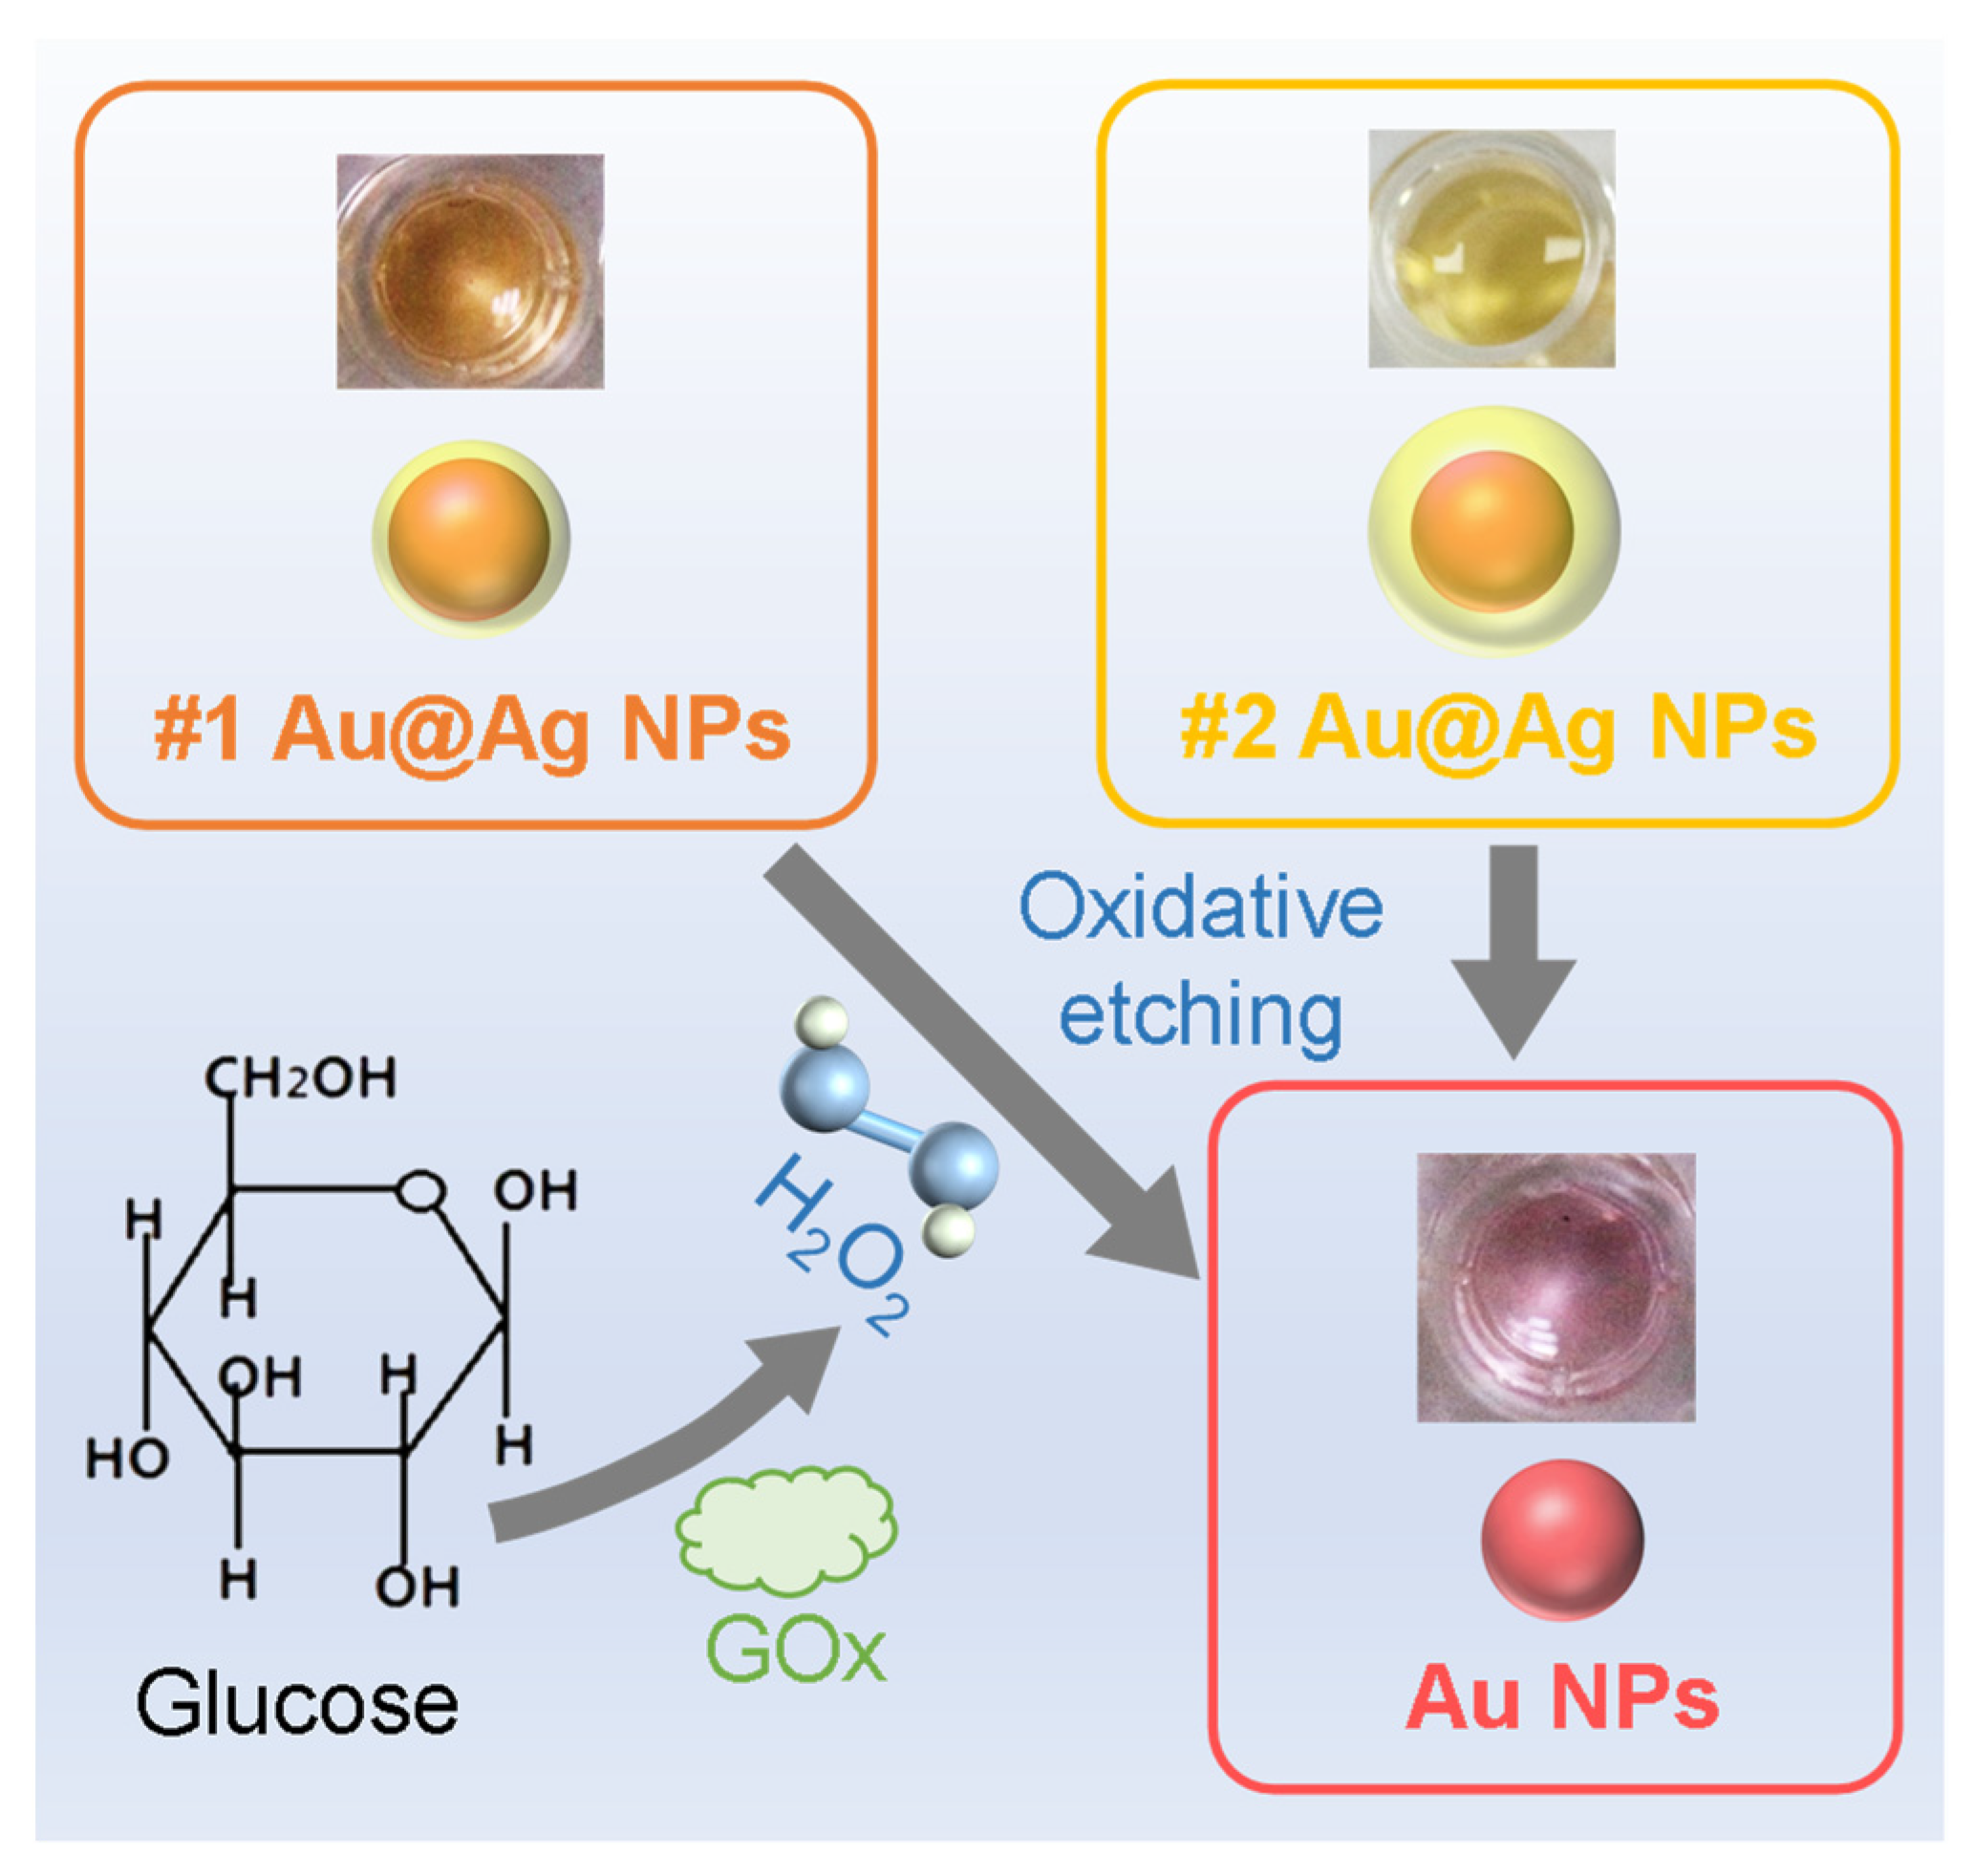
3.3. Colorimetric Changes during the Sensing of H2O2 and Glucose

We then investigated the sensing principle of H2O2 and glucose. When the #1 Au@Ag NPs were used for the sensing of H2O2, the silver shells could be oxidized to form silver ions by the H2O2. As a result, the optical property of the Au@Ag NPs changed obviously. As shown in Figure 2a, the plasmonic band of silver at ~400 nm decreased in intensity when H2O2 was added to the sensing system. Meanwhile, the plasmonic band of Au NPs at ~520 nm became clearer. Thus, H2O2 could be detected based on the spectral change in the #1 Au@Ag NPs. In glucose sensing, glucose is oxidized to gluconic acid and H2O2 under the catalysis of GOx, and H2O2 leads to a thinning of the silver shell, which could be detected via the spectral change. Similarly, the concentrations of H2O2 and glucose could be detected using the #2 Au@Ag NPs, except for the slight differences in extinction spectra (Figure 2b).
In addition to the spectral change, the change in color could also be clearly observed during the sensing of glucose. A phone camera or the naked eye can easily detect this color change, and no specific and/or bulky instrument is needed during this sensing process. Note that this sensing method is highly simple, convenient, and cost-effective. As shown in Figure 2c, the values of the R, G, and B channels of the sample photographs were obviously different. These differences suggest that the convenient and cost-effective detection of various chemicals can be realized via the monitoring of color changes. The R/G ratio and its changes could also be used to quantify the change in sample color during the chemical sensing of H2O2 or glucose (Figure 2d). As a result, the quantitative detection of H2O2 and glucose could be realized.
Then, the change in the R/G ratio was used for the quantitative detection of glucose solutions (Figure 2e,f). In a blank sample, the R/G ratio was 1.11 for the #1 Au@Ag NPs. This R/G ratio obviously increased to 1.24 when a glucose solution at 5 mM was detected (Figure 2e), suggesting a high detection selectivity. In contrast, R/G ratios close to the blank sample were observed during the sensing of other chemicals, such as maltose, fructose, galactose, newtolxylitol, lactic acid, and urea. These chemicals are the main components in human fluid, particularly in sweat. This high selectivity is attributed to the high specificity of GOx for glucose oxidation. Similarly, high selectivity was also achieved in the sample of #2 Au@Ag NPs (Figure 2f), except for the larger change in the R/G ratio.

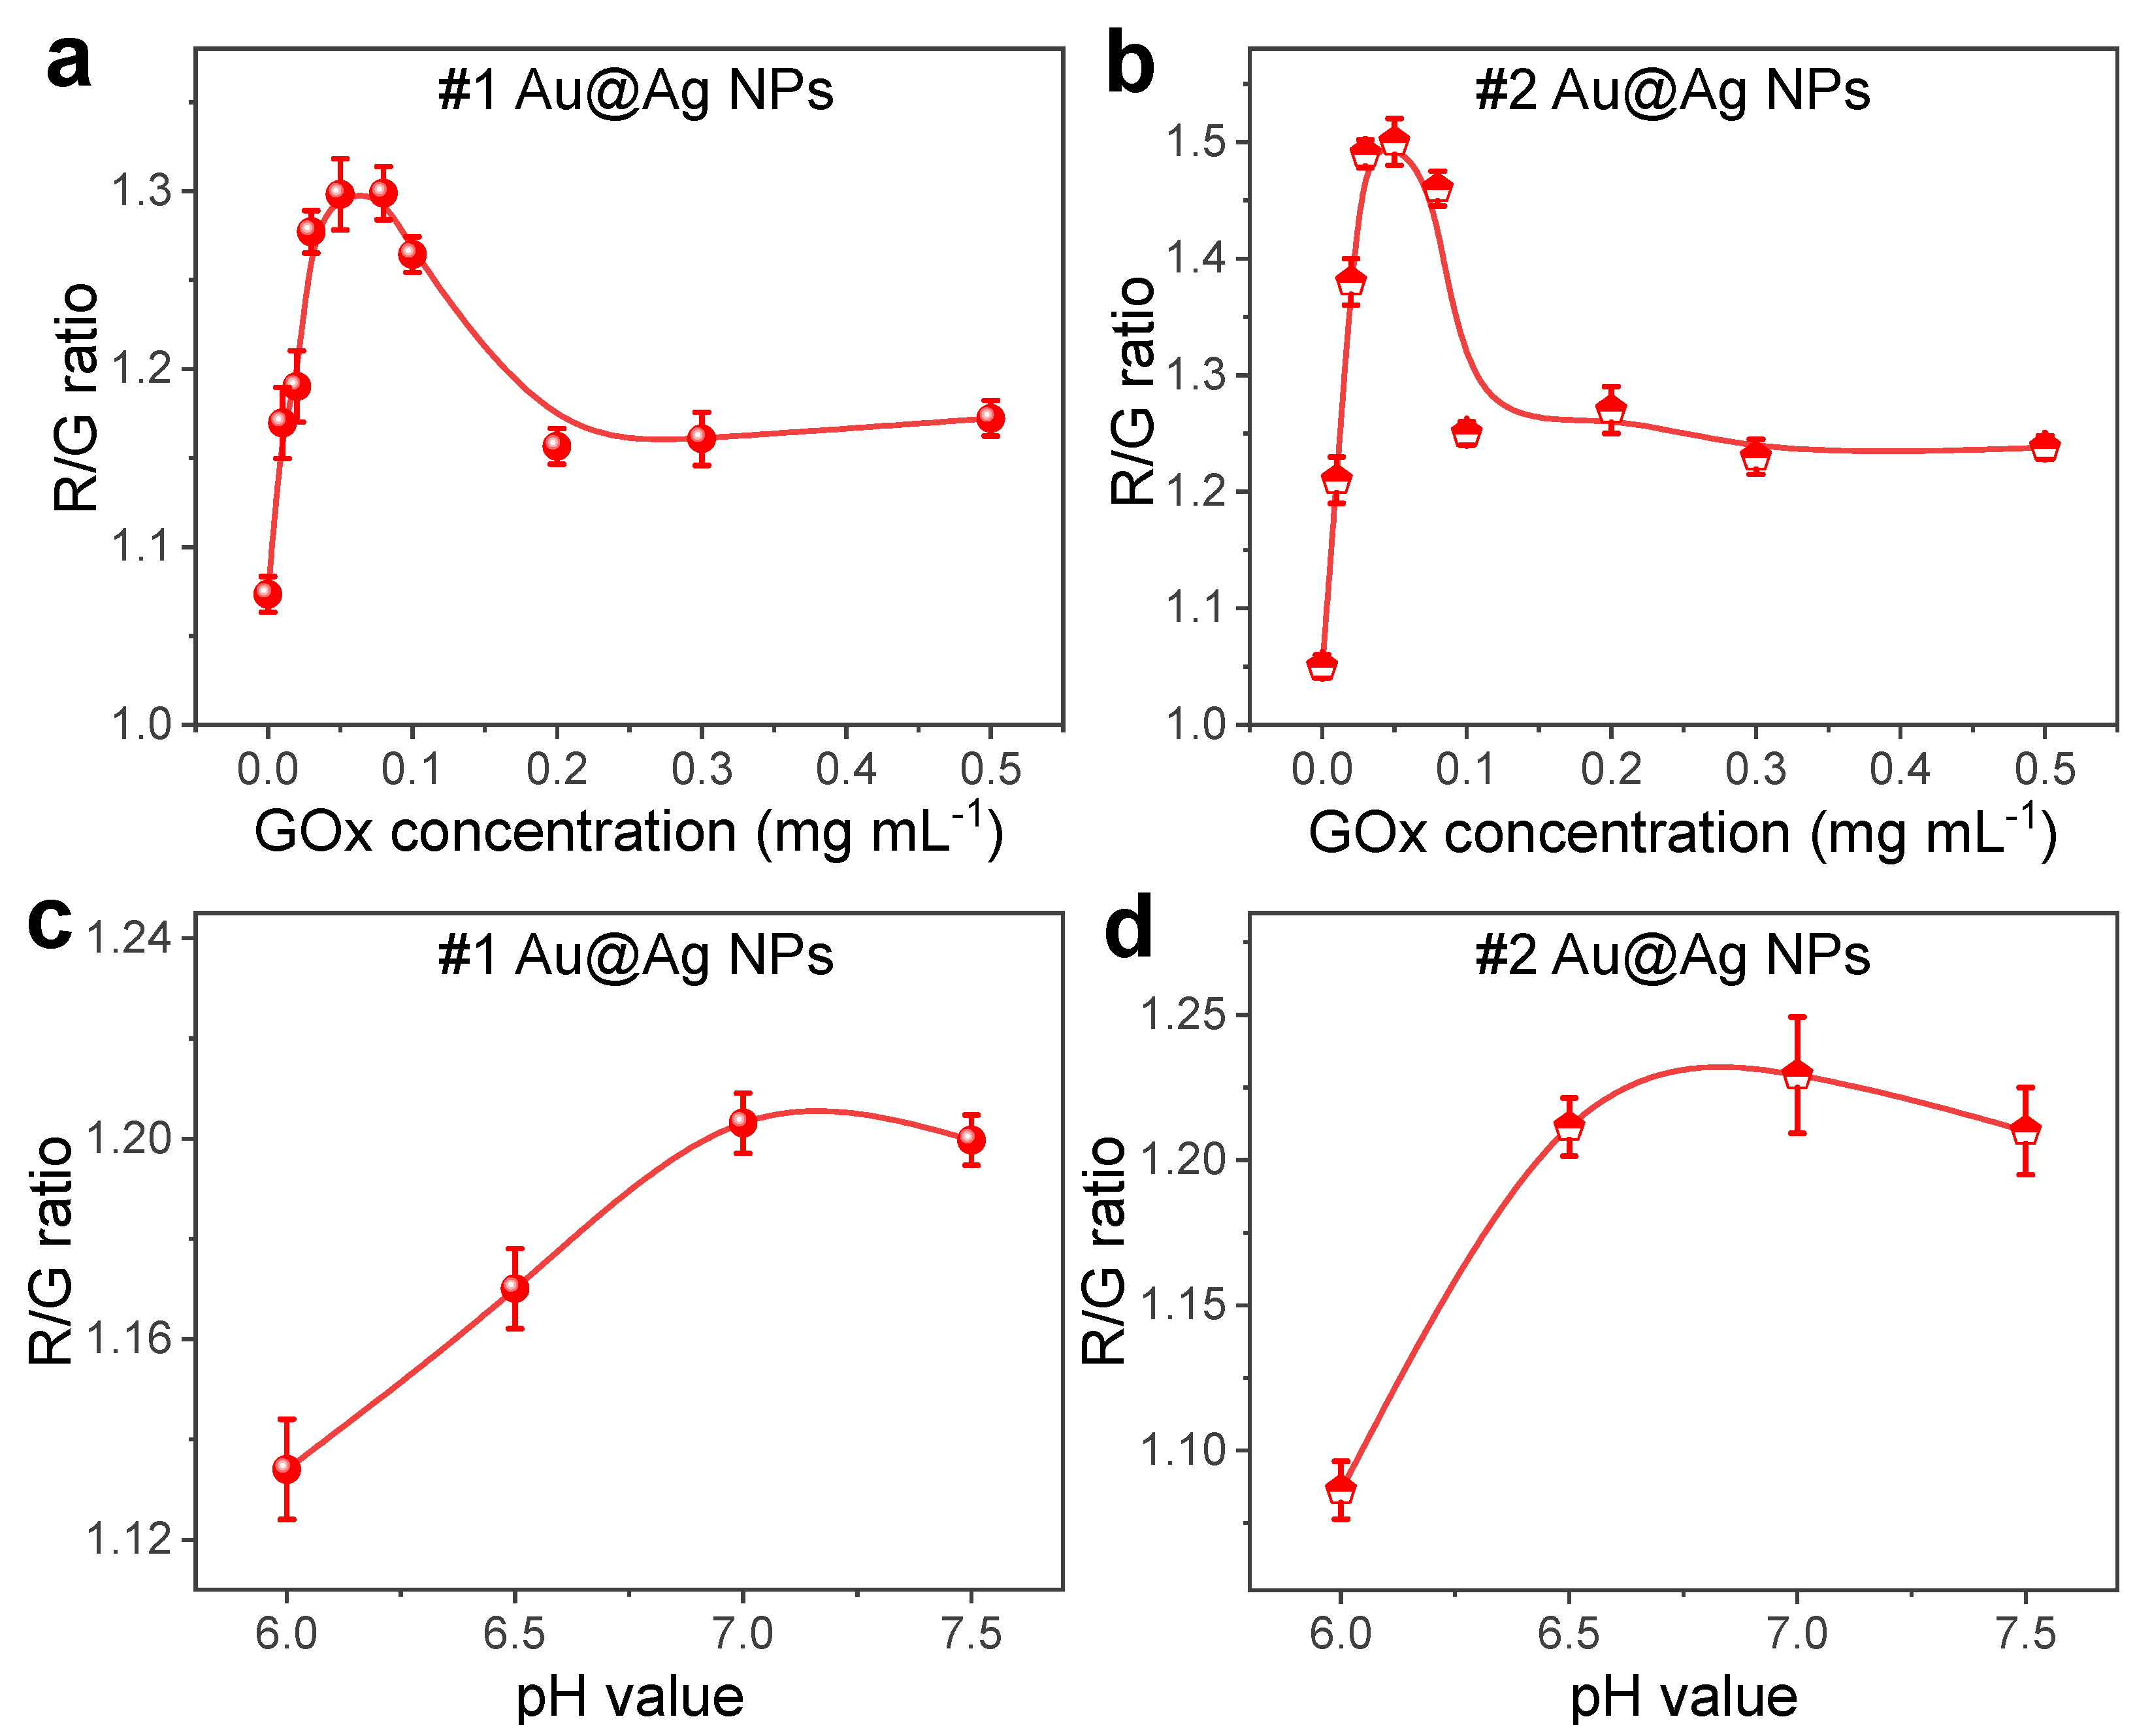
3.4. Optimization of the Sensing Systems

We then optimized the parameters in sensing systems, including the GOx concentration and pH value for both the #1 and #2 Au@Ag NPs. The optimal GOx concentration for the sensing system of the #1 Au@Ag NPs was 0.05–0.08 mg·mL−1 (Figure 3a). A lower GOx concentration cannot effectively catalyze the reaction of glucose oxidation, while a higher GOx concentration may lead to a serious aggregation of GOx on the gate surface, blocking the catalytic active sites. Therefore, an optimal GOx concentration is necessary for the sensing of glucose. Similarly, an optimal GOx concentration of ~0.05 mg·mL−1 was observed in the sensing system of #2 Au@Ag NPs (Figure 3b). The optimal concentration range of GOx in the #2 Au@Ag NPs sensing system was found to be narrower than that of the #1 Au@Ag NPs. The pH value can also significantly affect the sensing process of glucose, since pH value can significantly affect the catalytic activity of GOx. As shown in Figure 3c,d, a bigger change in the R/G ratio was observed, and this change was stable at a pH value around 7.0. The high stability can be attributed to the stable catalytic activity of GOx at this pH value. Moreover, the stable pH range for glucose sensing was slightly wider in the #2 Au@Ag NPs than in the #1 Au@Ag NPs. After optimization, a high sensitivity could be realized in our sensing systems. Consequently, a pH of 7.0 and a GOx concentration of 0.05 mg·mL−1 were used for the sensing of glucose in the rest of the study for the reliable and accurate detection of glucose.

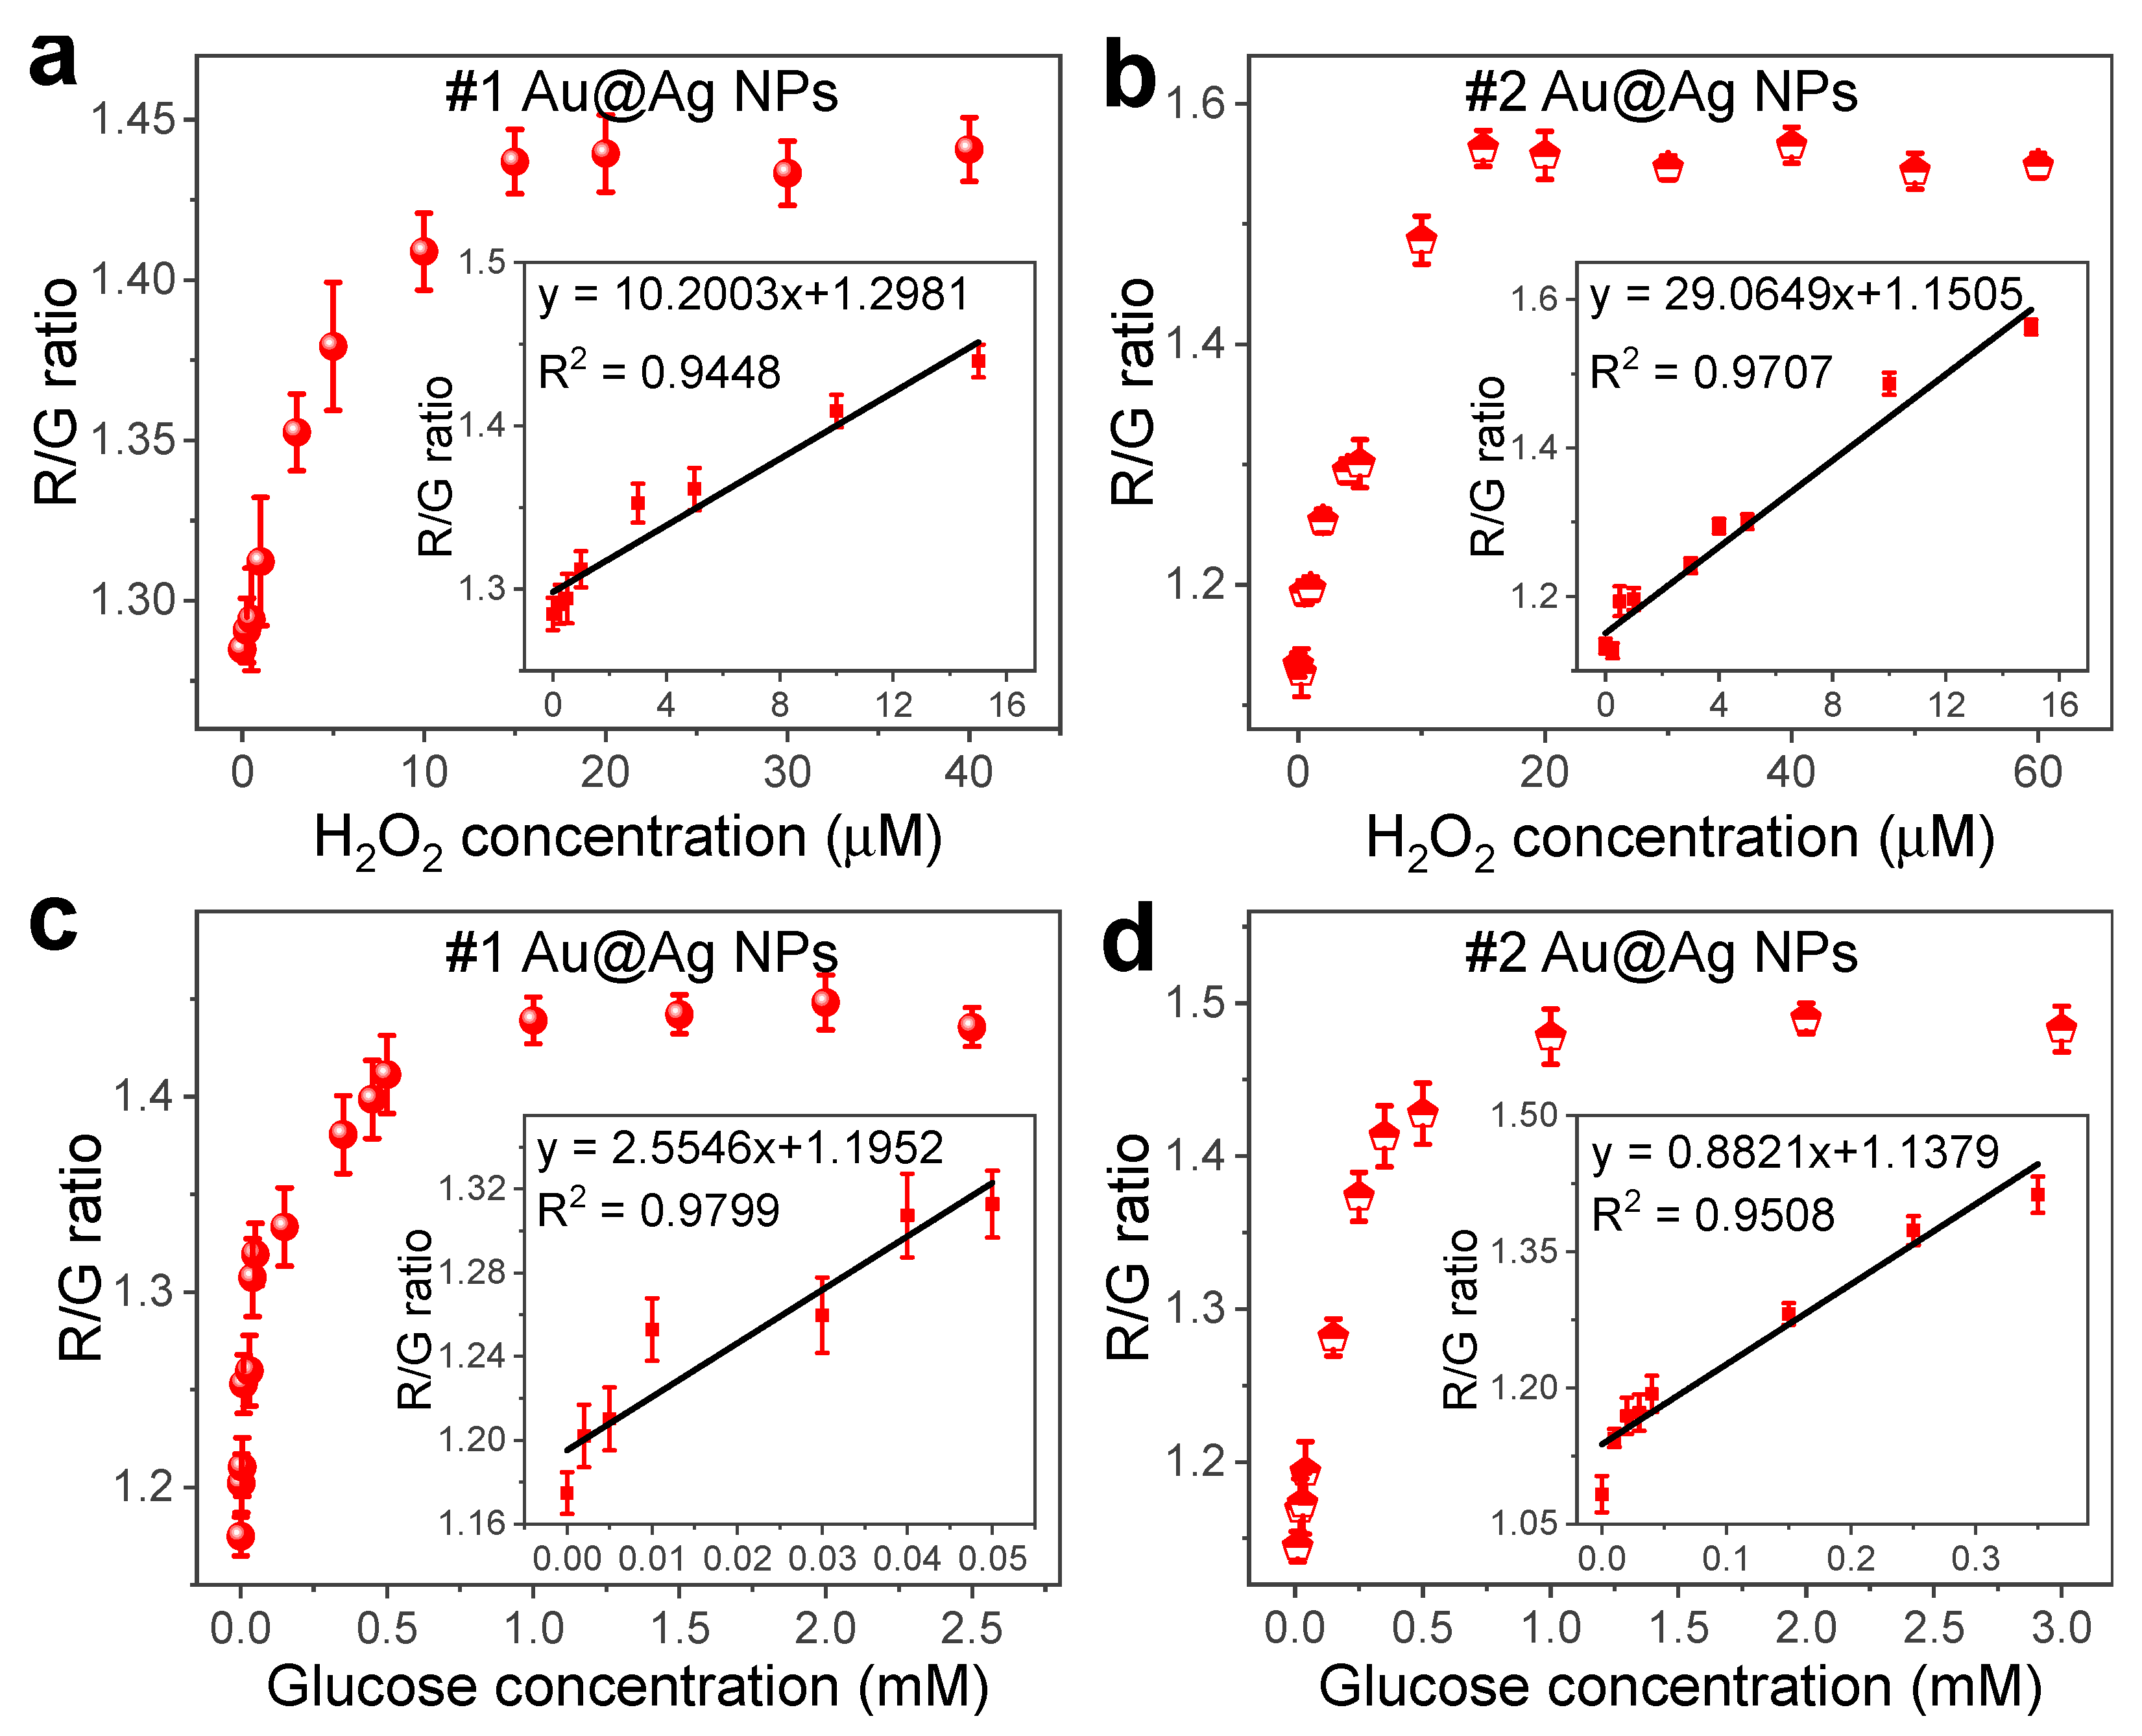
3.5. Sensitive Detection of H2O2 and Glucose

The quantitative detection of the glucose level in human fluid is crucial in the field of disease diagnosis and health monitoring, since the glucose level is an important indicator for states of health [5,6,7]. In some glucose sensing processes, the glucose is first oxidized to produce H2O2, which is then quantitatively detected. However, H2O2 is itself an important intermediate product in metabolites, and its concentration in the body is crucial for human health. Therefore, the sensing of H2O2 also needs to be investigated. Based on Au@Ag NPs, the sensitive detection of H2O2 and glucose can be easily realized. Significantly, shell thickness had a big effect on detection. The #1 and #2 Au@Ag NPs were used for H2O2 and glucose sensing, and their contributions in sensing were compared.
When the #1 Au@Ag NPs were used for H2O2 sensing, quantitative detection could be realized in a wide concentration range of 0–15 µM (Figure 4a). A higher H2O2 concentration would lead to a saturation of the spectral change/color change in the sensing platform. The R/G ratio increased along with the increase in H2O2 concentration, because of the etching away of the silver shell. In addition, the R/G ratio showed a good linear relationship with the H2O2 concentration within the concentration range of 0–15 mM, and a linear correlation coefficient (R2) of 0.9448 was obtained. For comparison, when the #2 Au@Ag NPs were used for H2O2 sensing, a good linear range was also obtained in the concentration range of 0–15 mM, and the linear correlation coefficient (0.9707) was higher than that in the case of the #1 Au@Ag NPs (Figure 4b). Moreover, the slopes of the linear correlation curves showed that the change of R/G ratio in the case of #2 Au@Ag NPs was roughly 3-fold higher than that in the case of #1 Au@Ag NPs, indicating a clearer spectral/color change in the sensing platform. These results demonstrate that the #2 Au@Ag NPs are more sensitive for H2O2 sensing. However, at a very low concentration of 0–1 mM, the linearity of the #1 Au@Ag NPs was obviously better than that of the #2 Au@Ag NPs. Possibly, the silver shells in #2 Au@Ag NPs are very thick, and thus a slight change in the shell thickness will not lead to an obvious change in the LSPR peak.
The #1 and #2 Au@Ag NPs could be used for the sensitive detection of glucose. For both #1 and #2 Au@Ag NPs, the concentrations of glucose at 0–1.0 mM could be precisely detected (Figure 4c,d). Note that the linear concentration range in the #2 Au@Ag NPs was much wider than that in the #1 Au@Ag NPs (insets in Figure 4c,d), possibly due to the thicker shell in the #2 Au@Ag NPs. Therefore, the #2 Au@Ag NPs are more suitable for the sensing of higher concentrations of glucose than the #1 Au@Ag NPs.

4. Conclusions

In summary, plasmonic nanoparticles of Au@Ag NPs have been successfully prepared and then applied in the sensing of H2O2 and glucose. The oxidative etching of the silver shells in the Au@Ag NPs is reasonable for the spectral change in the Au@Ag NPs. This spectral change can be clearly observed by a spectrometer or the naked eye. The color change can be used to determine the concentrations of H2O2 and glucose. The sensing of the glucose at various concentrations was demonstrated in a wide concentration range of 0–1.0 mM. In addition, the thickness of the silver shell in the Au@Ag NPs played a crucial role in the sensing process. This work provides a simple, convenient, and effective strategy for the highly sensitive detection of H2O2 and glucose, and this strategy can be further extended to many other sensing systems.

Author Contributions

Conceptualization, G.L. and H.-D.Y.; methodology, J.W. and X.Y.; validation, J.W. and X.Y.; formal analysis, J.W., X.Y., Y.Z., C.Z. and X.K.; data curation, J.W. and X.Y.; writing—original draft preparation, G.L.; writing—review and editing, J.W., G.L. and H.-D.Y.; funding acquisition, G.L. and H.-D.Y. All authors have read and agreed to the published version of the manuscript.

Funding

This work was financially supported by the National Natural Science Foundation of China (11974180), National Key R&D Program of China (2017YFA0204700), Joint Research Funds of Department of Science & Technology of Shanxi Province and Northwestern Polytechnical University (2020GXLH-Z-021), China–Sweden Joint Mobility Project (51811530018), and Fundamental Research Funds for the Central Universities.

Institutional Review Board Statement

Not applicable.

Informed Consent Statement

Not applicable.

Data Availability Statement

Not applicable.

Conflicts of Interest

The authors declare no conflict of interest.

References

  1. Yue, X.; Xu, F.; Zhang, L.; Ren, G.; Sheng, H.; Wang, J.; Wang, K.; Yu, L.; Wang, J.; Li, G.; et al. Simple, skin-attachable, and multifunctional colorimetric sweat sensor. ACS Sens. 2022, 7, 2198–2208. [Google Scholar] [CrossRef] [PubMed]
  2. Ahn, H.T.; An, H.; Hong, Y.C.; Lee, S.C.; Le, T.N.; Le, X.A.; Kwak, H.S.; Lee, Y.; Jeong, Y.; Park, J.; et al. Ultrarapid, size-controlled, high-crystalline plasma-mediated synthesis of ceria nanoparticles for reagent-free colorimetric glucose test strips. Sens. Actuators B Chem. 2020, 320, 128404. [Google Scholar] [CrossRef]
  3. Liu, X.G.; Huang, D.L.; Lai, C.; Qin, L.; Zeng, G.M.; Xu, P.; Li, B.S.; Yi, H.; Zhang, M.M. Peroxidase-like activity of smart nanomaterials and their advanced application in colorimetric glucose biosensors. Small 2019, 15, e1900133. [Google Scholar] [CrossRef] [PubMed]
  4. Vaquer, A.; Baron, E.; de la Rica, R. Detection of low glucose levels in sweat with colorimetric wearable biosensors. Analyst 2021, 146, 3273–3279. [Google Scholar] [CrossRef]
  5. Choi, J.; Bandodkar, A.J.; Reeder, J.T.; Ray, T.R.; Turnquist, A.; Kim, S.B.; Nyberg, N.; Hourlier-Fargette, A.; Model, J.B.; Aranyosi, A.J.; et al. Soft, skin-integrated multifunctional microfluidic systems for accurate colorimetric analysis of sweat biomarkers and temperature. ACS Sens. 2019, 4, 379–388. [Google Scholar] [CrossRef]
  6. Wang, L.; Yue, X.; Sun, Q.; Zhang, L.; Ren, G.; Lu, G.; Yu, H.; Huang, W. Flexible organic electrochemical transistors for chemical and biological sensing. Nano Res. 2021, 15, 2433–2464. [Google Scholar] [CrossRef]
  7. Ghaffari, R.; Choi, J.; Raj, M.S.; Chen, S.; Lee, S.P.; Reeder, J.T.; Aranyosi, A.J.; Leech, A.; Li, W.; Schon, S.; et al. Soft wearable systems for colorimetric and electrochemical analysis of biofluids. Adv. Funct. Mater. 2020, 30, 1907269. [Google Scholar] [CrossRef]
  8. Khan, M.S.; Misra, S.K.; Wang, Z.; Daza, E.; Schwartz-Duval, A.S.; Kus, J.M.; Pan, D. Paper-based analytical biosensor chip designed from Graphene-Nanoplatelet-Amphiphilic-diblock-co-Polymer composite for cortisol detection in human saliva. Anal. Chem. 2017, 89, 2107–2115. [Google Scholar] [CrossRef]
  9. Kim, S.; Park, S.; Cho, Y.S.; Kim, Y.; Tae, J.H.; No, T.I.; Shim, J.S.; Jeong, Y.; Kang, S.H.; Lee, K.H. Electrical cartridge sensor enables reliable and direct identification of microRNAs in urine of patients. ACS Sens. 2021, 6, 833–841. [Google Scholar] [CrossRef] [PubMed]
  10. Hong, Y.J.; Lee, H.; Kim, J.; Lee, M.; Choi, H.J.; Hyeon, T.; Kim, D. Multifunctional Wearable System that Integrates Sweat-Based Sensing and Vital-Sign Monitoring to Estimate Pre-/Post-Exercise Glucose Levels. Adv. Funct. Mater. 2018, 28, 1805754. [Google Scholar] [CrossRef]
  11. Guo, X.; Zong, L.; Jiao, Y.; Han, Y.; Zhang, X.; Xu, J.; Li, L.; Zhang, C.W.; Liu, Z.; Ju, Q.; et al. Signal-Enhanced Detection of Multiplexed Cardiac Biomarkers by a Paper-Based Fluorogenic Immunodevice Integrated with Zinc Oxide Nanowires. Anal. Chem. 2019, 91, 9300–9307. [Google Scholar] [CrossRef] [PubMed]
  12. Yokus, M.A.; Daniele, M.A. Integrated non-invasive biochemical and biophysical sensing systems for health and performance monitoring: A systems perspective. Biosens. Bioelectron. 2021, 184, 113249. [Google Scholar] [CrossRef] [PubMed]
  13. Bariya, M.; Li, L.; Ghattamaneni, R.; Ahn, C.H.; Nyein, H.Y.Y.; Tai, L.; Javey, A. Glove-based sensors for multimodal monitoring of natural sweat. Sci. Adv. 2020, 6, eabb8308. [Google Scholar] [CrossRef]
  14. Yeung, K.K.; Huang, T.; Hua, Y.; Zhang, K.; Yuen, M.M.F.; Gao, Z. Recent Advances in Electrochemical Sensors for Wearable Sweat Monitoring: A Review. IEEE Sens. J. 2021, 21, 14522–14539. [Google Scholar] [CrossRef]
  15. Sekine, Y.; Kim, S.B.; Zhang, Y.; Bandodkar, A.J.; Xu, S.; Choi, J.; Irie, M.; Ray, T.R.; Kohli, P.; Kozai, N.; et al. A fluorometric skin-interfaced microfluidic device and smartphone imaging module for in situ quantitative analysis of sweat chemistry. Lab Chip 2018, 18, 2178–2186. [Google Scholar] [CrossRef] [PubMed]
  16. Cui, Y.; Duan, W.; Jin, Y.; Wo, F.; Xi, F.; Wu, J. Ratiometric Fluorescent Nanohybrid for Noninvasive and Visual Monitoring of Sweat Glucose. ACS Sens. 2020, 5, 2096–2105. [Google Scholar] [CrossRef]
  17. Jiao, Y.; Du, C.; Zong, L.; Guo, X.; Han, Y.; Zhang, X.; Li, L.; Zhang, C.; Ju, Q.; Liu, J.; et al. 3D vertical-flow paper-based device for simultaneous detection of multiple cancer biomarkers by fluorescent immunoassay. Sens. Actuators B Chem. 2020, 306, 127239. [Google Scholar] [CrossRef]
  18. Bandodkar, A.J.; Gutruf, P.; Choi, J.; Lee, K.; Sekine, Y.; Reeder, J.T.; Jeang, W.J.; Aranyosi, A.J.; Lee, S.P.; Model, J.B.; et al. Battery-free, skin-interfaced microfluidic/electronic systems for simultaneous electrochemical, colorimetric, and volumetric analysis of sweat. Sci. Adv. 2019, 5, eaav3294. [Google Scholar] [CrossRef] [Green Version]
  19. Zhang, K.; Zhang, J.; Wang, F.; Kong, D. Stretchable and superwettable colorimetric sensing patch for epidermal collection and analysis of sweat. ACS Sens. 2021, 6, 2261–2269. [Google Scholar] [CrossRef]
  20. Koh, A.; Kang, D.; Xue, Y.; Lee, S.; Pielak, R.M.; Kim, J.; Hwang, T.; Min, S.; Banks, A.; Bastien, P.; et al. A soft, wearable microfluidic device for the capture, storage, and colorimetric sensing of sweat. Sci. Transl. Med. 2016, 8, 366ra165. [Google Scholar] [CrossRef] [PubMed]
  21. Bakker, E.; Qin, Y. Electrochemical sensors. Anal. Chem. 2006, 78, 3965–3983. [Google Scholar] [CrossRef] [PubMed] [Green Version]
  22. Bau, L.; Tecilla, P.; Mancin, F. Sensing with fluorescent nanoparticles. Nanoscale 2011, 3, 121–133. [Google Scholar] [CrossRef] [PubMed]
  23. Chen, L.; Hwang, E.; Zhang, J. Fluorescent Nanobiosensors for Sensing Glucose. Sensors 2018, 18, 1440. [Google Scholar] [CrossRef] [Green Version]
  24. Chen, Y.; Li, Z.; Huang, X.; Lu, G.; Huang, W. Single-molecule mapping of catalytic reactions on heterostructures. Nano Today 2020, 34, 100957. [Google Scholar] [CrossRef]
  25. Li, X.; Wen, F.; Creran, B.; Jeong, Y.; Zhang, X.; Rotello, V.M. Colorimetric Protein Sensing Using Catalytically Amplified Sensor Arrays. Small 2012, 8, 3589–3592. [Google Scholar] [CrossRef] [PubMed] [Green Version]
  26. Zhong, Z.L.; Anslyn, E.V. A colorimetric sensing ensemble for heparin. J. Am. Chem. Soc. 2002, 124, 9014–9015. [Google Scholar] [CrossRef] [PubMed]
  27. Zhu, Y.; Guan, M.; Wang, J.; Sheng, H.; Chen, Y.; Liang, Y.; Peng, Q.; Lu, G. Plasmon-mediated photochemical transformation of inorganic nanocrystals. Appl. Mater. Today 2021, 24, 101125. [Google Scholar] [CrossRef]
  28. Li, Z.; Huang, X.; Lu, G. Recent developments of flexible and transparent SERS substrates. J. Mater. Chem. C 2020, 8, 3956–3969. [Google Scholar] [CrossRef]
  29. Chen, Y.; Zhu, Y.; Sheng, H.; Wang, J.; Zhang, C.; Chen, Y.; Huang, W.; Lu, G. Molecular coadsorption of p-hydroxythiophenol on silver nanoparticles boosts the plasmon-mediated decarboxylation reaction. ACS Catal. 2022, 12, 2938–2946. [Google Scholar] [CrossRef]
  30. Nocerino, V.; Miranda, B.; Tramontano, C.; Chianese, G.; Dardano, P.; Rea, I.; De Stefano, L. Plasmonic Nanosensors: Design, Fabrication, and Applications in Biomedicine. Chemosensors 2022, 10, 150. [Google Scholar] [CrossRef]
  31. Homola, J.; Yee, S.S.; Gauglitz, G. Surface plasmon resonance sensors: Review. Sens. Actuators B Chem. 1999, 54, 3–15. [Google Scholar] [CrossRef]
  32. Wong, C.L.; Olivo, M. Surface Plasmon Resonance Imaging Sensors: A Review. Plasmonics 2014, 9, 809–824. [Google Scholar] [CrossRef]
  33. Wang, X.; Huang, S.-C.; Hu, S.; Yan, S.; Ren, B. Fundamental understanding and applications of plasmon-enhanced Raman spectroscopy. Nat. Rev. Phys. 2020, 2, 253–271. [Google Scholar] [CrossRef]
  34. Wang, Y.; Liang, Y.; Sheng, H.; Wang, J.; Wang, J.; He, S.; Guan, M.; Chen, Y.; Lu, G. Monitoring the thiol/thiophenol molecule-modulated plasmon-mediated silver oxidation with dark-field optical microscopy. Chem. Eur. J. 2022, 28, e202103709. [Google Scholar] [CrossRef] [PubMed]
  35. Li, Z.; Zhang, C.; Sheng, H.; Wang, J.; Zhu, Y.; Yu, L.; Wang, J.; Peng, Q.; Lu, G. Molecular cocatalyst of p-mercaptophenylboronic acid boosts the plasmon-mediated reduction of p-nitrothiophenol. ACS Appl. Mater. Interfaces 2022, 14, 38302–38310. [Google Scholar] [CrossRef] [PubMed]
  36. Guan, M.; Zhu, Y.; Yue, X.; Liang, Y.; Sheng, H.; Wang, J.; Zhang, C.; Peng, Q.; Lu, G. Molecular cocatalyst-induced enhancement of the plasmon-mediated coupling of p-nitrothiophenols at the silver nanoparticle–graphene oxide interface. ACS Appl. Nano Mater. 2021, 4, 10976–10984. [Google Scholar] [CrossRef]
  37. Zhang, C.; Wang, Y.; Liang, Y.; Zhu, Y.; Li, Z.; Huang, X.; Lu, G. Modulating the plasmon-mediated oxidation of p-aminothiophenol with asymmetrically grafted thiol molecules. J. Phys. Chem. Lett. 2020, 11, 7650–7656. [Google Scholar] [CrossRef]
  38. Zeng, J.; Zhang, Y.; Zeng, T.; Aleisa, R.; Qiu, Z.; Chen, Y.; Huang, J.; Wang, D.; Yan, Z.; Yin, Y. Anisotropic plasmonic nanostructures for colorimetric sensing. Nano Today 2020, 32, 100855. [Google Scholar] [CrossRef]
  39. Lu, G.; Li, H.; Zhang, H. Gold-nanoparticle-embedded polydimethylsiloxane elastomers for highly sensitive Raman detection. Small 2012, 8, 1336–1340. [Google Scholar] [CrossRef] [PubMed]
  40. Lu, G.; Li, H.; Zhang, H. Nanoparticle-coated PDMS elastomers for enhancement of Raman scattering. Chem. Commun. 2011, 47, 8560–8562. [Google Scholar] [CrossRef] [PubMed]
  41. Wang, G.-L.; Zhu, X.-Y.; Jiao, H.-J.; Dong, Y.-M.; Wu, X.-M.; Li, Z.-J. “Oxidative etching-aggregation” of silver nanoparticles by melamine and electron acceptors: An innovative route toward ultrasensitive and versatile functional colorimetric sensors. Anal. Chim. Acta 2012, 747, 92–98. [Google Scholar] [CrossRef]
  42. Zannotti, M.; Vicomandi, V.; Rossi, A.; Minicucci, M.; Ferraro, S.; Petetta, L.; Giovannetti, R. Tuning of hydrogen peroxide etching during the synthesis of silver nanoparticles. An application of triangular nanoplates as plasmon sensors for Hg2+ in aqueous solution. J. Mol. Liq. 2020, 309, 113238. [Google Scholar] [CrossRef]
Scheme 1. Schematic diagram of the procedure for synthesis of Au@Ag NPs.
Chemosensors 10 00404 sch001
Scheme 2. Schematic diagram of glucose sensing based on Au@Ag NPs and the effect of their shell thicknesses on sensing.
Chemosensors 10 00404 sch002
Figure 1. Morphology and optical properties of the Au NPs and Au@Ag NPs. (ac) TEM images of the Au NPs and Au@Ag NPs with thin (#1) and thick (#2) shells. (df) Corresponding histograms of the size of the NPs in (ac). (g) Photograph and (h) UV-Vis extinction spectra of the Au NPs and Au@Ag NPs.
Chemosensors 10 00404 g001
Figure 2. Colorimetric sensing of glucose. (a,b) UV-Vis extinction spectra of the pristine (a) #1 and (b) #2 Au@Ag NPs and the spectra after adding 20 µL of 5 mM H2O2 (red curve) and 5 mM glucose (blue curve) solutions, respectively. In case of glucose sensing, 20 µL of 1 mg mL−1 GOx was also added before adding glucose. (c) The R, G, and B values of the photographs of the Au NPs and the #1 and #2 Au@Ag NPs samples. (d) The R/G ratios of the photographs of the Au NPs and the #1 and #2 Au@Ag NPs. (e,f) The R/G ratios of the photographs of (e) #1 and (f) #2 Au@Ag NPs samples after sensing of various analytes. A high sensing specificity toward glucose was observed.
Chemosensors 10 00404 g002
Figure 3. Optimization of GOx concentration and pH value for glucose sensing. (a,b) The changes in R/G ratio after sensing of glucose on (a) #1 and (b) #2 Au@Ag NPs with the presence of various concentrations of GOx. (c,d) The changes in R/G ratio after sensing of glucose on (c) #1 and (d) #2 Au@Ag NPs in solutions with various pH values.
Chemosensors 10 00404 g003
Figure 4. Sensitive detection of H2O2 and glucose with Au@Ag NPs at different shell thicknesses. (a,b) Response curves of R/G ratio toward various concentrations of H2O2 on (a) #1 and (b) #2 Au@Ag NPs samples. (c,d) Response curves of R/G ratio toward various concentrations of glucose on (c) #1 and (d) #2 Au@Ag NPs samples. A GOx concentration of 0.05 mg·mL−1 and pH of 7.0 were used for the sensing of glucose.
Chemosensors 10 00404 g004
Publisher’s Note: MDPI stays neutral with regard to jurisdictional claims in published maps and institutional affiliations.

