Article

The Functional Fe3O4@SiO2@AuNPs SERS Nanomaterials for Rapid Enrichment and Detection of Mercury Ions in Licorice

1
College of Pharmaceutical Science, Zhejiang University of Technology, No. 18 Chaowang Road, Hangzhou 310014, China
2
Pharmaceutical Informatics Institute, College of Pharmaceutical Sciences, Zhejiang University, Hangzhou 310058, China
*
Author to whom correspondence should be addressed.
Chemosensors 2022, 10(10), 403; https://doi.org/10.3390/chemosensors10100403
Submission received: 31 August 2022 / Revised: 30 September 2022 / Accepted: 4 October 2022 / Published: 8 October 2022

Abstract

:
There has been an increasing demand for rapid and sensitive techniques for the detection of heavy metal ions that are harmful to the human body in traditional Chinese medicine (TCM). However, the complex chemical composition of TCM makes the quantitative detection of heavy metal ions difficult. In this study, the magnetic Fe3O4@SiO2@AuNPs nanoparticles combined with a probe molecule DMcT were used for the specific enrichment and detection of Hg2+ in the complex system of licorice. The core of Fe3O4 was bonded with SiO2 to increase its stability. A layer of AuNPs was deposited to produce a “core–shell” Raman substrate with high surface-enhanced Raman spectroscopy (SERS) activity, which was surface modified by DMcT probe molecules with sulfhydryl groups. In the presence of Hg2+, Hg2+ binds to N on the amino group of DMcT to form N-Hg2+-N complexes, which induces Fe3O4@SiO2@AuNPs-DMcT clustering to enhance SERS signal. The Raman probe molecule DMcT showed an excellent linear relationship (R2 = 0.9709) between the SERS signal at 1416 cm−1 and the Hg2+ concentration (0.5~100 ng/mL). This method achieved a good recovery (89.10~111.00%) for the practical application of detection of Hg2+ in licorice extracts. The results demonstrated that the functional Fe3O4@SiO2@AuNPs-DMcT performed effective enrichment and showed high sensitivity and accurate detection of heavy metal ions from the analytes.

1. Introduction

Traditional Chinese medicine (TCM), which uses medicinal substances derived mainly from plants, minerals, and animal substances, has been used worldwide to treat various diseases, especially during COVID-19 [1,2]. Licorice is one of the most popular TCM, called Gan-Cao in China. It is derived from the dried roots and rhizomes of Glycyrrhiza uralensis, G. glabra, and G. inflata, and is recorded in the pharmacopoeias of China, Japan, US, and Europe.
Due to the increasing demand for TCM worldwide, their safety has become a hot topic of international concern [3]. Most of the hazards associated with TCM come from contamination by toxic heavy metal ions, including lead (Pb2+), arsenic (As3+), cadmium (Cd2+), and mercury (Hg2+) [4]. In particular, mercury ions (Hg2+), as the most toxic liquid heavy metal ions, are bioaccumulative and highly enriched, posing a severe threat to humans and the environment even at low concentrations [5,6,7]. It is estimated that poisoning and neurological symptoms may occur once an adult has 50 μg/g of Hg2+ in hair or 0.4 μg/g of Hg2+ in red blood cells. Currently, Hg2+ poisoning has become one of the most severe contamination problems in TCM.
The traditional techniques for detection of heavy metals include inductively coupled plasma mass spectrometry (ICP-MS) [8], atomic absorption spectrometry (AAS) [9], electrochemical methods [10], fluorescence methods [11], inductively coupled plasma emission spectrometry (ICP-OES) [12], and colorimetric methods [13]. Most of these are stable and accurate, yet bulky instruments and toxic reagents restrict the application in routine analysis. There are generally problems with these techniques, such as cumbersome pre-treatment, long detection cycles, and expensive detection costs. Therefore, it is of great practical importance to construct a simple, rapid, and accurate technique for the detection of heavy metal ions.
Surface-enhanced Raman spectroscopy (SERS) is a fingerprint spectroscopy method with ultra-high sensitivity [14,15,16]. SERS contains a large amount of information about the properties of substances. It provides not only highly sensitive fingerprint spectral characteristics of molecules, but also has many other advantages, such as simple operation, strong anti-interference ability, high selectivity, rapid non-destructive detection, and equipment miniaturization. Currently, it is widely used in food safety, biomedicine, environmental testing, and defense protection [17,18,19]. However, heavy metal ions are a class of inorganic substances that usually exist in the environment in a monoatomic state, which cannot be detected directly using SERS because of their small scattering cross-section [20]. Currently, SERS detection of Hg2+ consists of the SERS signal “turn-on” mode and “turn-down” mode [21]. Since SERS has been used to detect Hg2+, the preparation of SERS substrates has gradually become a hot research topic.
However, the current conventional single precious metal Raman-active substrates, such as AgNPs and AuNPs, are soluble and prone to agglomeration, poor stability, and low sensitivity. To solve these issues, researchers have proposed various methods to construct SERS substrates with high sensitivity, stability, and selectivity. Wang et al. [22] prepared high-performance Fe3O4@SiO2@Ag using the seed-mediated method and verified the performance of the substrate using 4-Aminothiophenol and thiram, with detection limits of 10−11 mol/L and 10−9 mol/L, respectively. Xu et al. [23] prepared Fe3O4@SiO2@Ag magnetic material using the crystal seed method and achieved the separation and enrichment of benzocillin under the action of an applied magnetic field with a detection limit of 10−11 mol/L. Wang et al. [24] reported Fe3O4@PEG@Ag nanoliters were synthesized and performed well in cell imaging and cancer quality detection. Shen et al. [25] reported novel multifunctional Fe3O4@Ag/SiO2/Au core–shell microspheres with a unique nanostructure using rhodamine-b (RdB) as a probe molecule in Raman activity studies. Sun et al. [26] designed a versatile core–satellite Fe3O4@SiO2-Au (FA) hetero-nanostructure and demonstrated its use for active adsorption and selective detection of food dye molecules. In Alexey et al. [27], Cisplatin (cPt) was successfully immobilized on the surface of Fe3O4@SiO2@Au nanoparticles (NPs). The functionalized Fe3O4@SiO2@AuNPs were tested for potential application in photothermal cancer therapy.
The literature review showed that there are few reports on the application of magnetic nanomaterials combined with SERS in the detection of mercury ions in TCM. However, the 2020 version of the Chinese pharmacopoeia has put forward higher requirements for the inspection of heavy metal ions in different kinds of TCM, such as licorice. Therefore, it is necessary to develop a fast and on-site trace detection method for heavy metal ions to improve the quality of traditional Chinese medicines.

2. Materials and Methods

2.1. Materials and Apparatus

Mercury ion, lead ion, cadmium ion, arsenic ion, and copper ion standard solution (No: GBW 1000 μg/mL) were purchased from Zhongke Quality Inspection Biotechnology Co., Ltd. (Beijing, China). Triiron tetroxide (99%) was provided by Enochai Technology (Beijing, China). 48–50% HAuCl4, 2,5-dimercapto-1,3,4-thiadiazole (97%, DMcT), 98% TEOS, and 98% APTES were purchased from Maclean (Shanghai, China). Anhydrous ethanol (99.7%, Yongda Chemical Reagent, Tianjin, China), 25~28% NH₃·H₂O, and 36–38% hydrochloric acid were purchased from Sinopharm Chemical Reagent Co., Ltd. (Shanghai, China). N-butylamine (99%, Titan Technology Co., Ltd., Shanghai, China), nitric acid (99%, Yonghua Chemical Technology Co. Ltd., Jiangsu, China), and other reagents were all analytical grade.
Apparatuses used in the research included: a Scanning Electron Microscope (Hitachi, Japan), a UV-2450 ultraviolet spectrophotometer (Shimadzu, Japan), a XMTD-8222 vacuum drying oven (Jinghong Experiment, Shanghai, China), an intelligent double-controlled constant temperature magnetic stirrer (DF 101S, Hangzhou, China), a constant temperature digital display water bath (HH-4, Shanghai, China), a ProTT-EZRaman-B portable Raman spectrometer (Enwave Optronics, Irvine, CA, USA), an electronic balance (SQP, Sartorius Scientific Instruments, Beijing, China), an ultrasonic cleaner (KQ-250DB, Jiangsu, China), and a Milli-Q ultrapure water machine (Thermo Fisher Scientific, Shanghai, China).

2.2. Synthesis of Fe3O4@SiO2

The synthesis of Fe2O3@SiO2 was implemented using a modified Stöber method [28]. Briefly, 0.5 g Fe3O4 solid nanoparticles were dispersed in HCl (0.01 mol/L 20 mL) and ultrasonically dispersed for 10 min for activation and modification. Next, a magnet was used to separate the Fe3O4 from HCl and washed several times with ultrapure water to achieve neutrality. The modified Fe3O4 was then redispersed in a solution consisting of 80 mL ethanol and 20 mL water and sonicated for 45 min to make the Fe3O4 nanoparticles uniformly dispersed. A total of 4 mL of NH₃·H₂O was added to the system (300–400 r/min) after complete dispersion, followed by 4 mL of TEOS (100 μL/min) slowly added drop by drop while stirring. The Fe3O4@SiO2 nanoparticles were obtained by continuing stirring at room temperature for 6 h under N2 protection. With the help of magnetic separation, the products were washed several times using anhydrous ethanol and ultrapure water, and dried under vacuum at 60 °C for 5 h.

2.3. Amination of Fe3O4@SiO2

A total of 0.5 g of Fe3O4@SiO2 prepared as described above was placed in a three-neck flask containing 40 mL of anhydrous ethanol, sonicated for 30 min, and then transferred to a constant-temperature water bath. Five milliliters of APTES (100 μL/min) was slowly added under mechanical stirring. The amination was carried out by stirring and refluxing at 80 °C for 6 h under the protection of N2. After the reaction was completed, the nanoparticles were washed three times with anhydrous ethanol using ultrasonication with the help of an applied magnetic field. Finally, the aminated Fe3O4@SiO2 was isolated and then dried under vacuum at 60–70 °C for 6 h.

2.4. Synthesis of Fe3O4@SiO2@AuNPs

For the preparation of AuNPs, 5 mg of HAuCl4-H2O was dissolved in 60 mL of ultrapure water and heated to boiling at 120 °C in a water bath at reflux. The reaction lasted for 6 min to see the change of the solution color from colorless to burgundy. AuNPs were then obtained and cooled at room temperature.
Six milligrams of the aminated Fe3O4@SiO2 was dispersed in 10 mL of ultrapure water and sonicated for 10 min to dissolve it thoroughly. A total of 40 mL of the prepared AuNPs was then added and stirred for 40 min. The prepared Fe3O4@SiO2@AuNPs were magnetically separated with an applied magnetic force and washed several times using anhydrous ethanol and ultrapure water. Finally, they were dispersed in 10 mL of ultrapure water and stored at 4 °C for use.

2.5. Preparation of DMcT-Functionalized Fe3O4@SiO2@AuNPs

An amount of 0.5 g Fe3O4@SiO2@AuNPs was uniformly dispersed in 10 mL of ultrapure water with 5 mL of DMcT (10−4 mol/L) and incubated by shaking for 1 h on a digital shaker (25 °C, 140 r/min). The DMcT-functionalized Fe3O4@SiO2@AuNPs were finally dispersed in 10 mL of ultrapure water and stored at 4 °C for use.

2.6. Sample Preparation and Raman Spectroscopy Analytical Parameters

For the preparation of standard Hg2+ solution, the Hg2+ standard solution (1000 μg/mL) was diluted to different concentrations (0.1~100 ng/mL) with ultrapure water. A total of 200 μL Fe3O4@SiO2@AuNPs-DMcT was mixed thoroughly with equal amounts of target samples at room temperature for SERS detection.
To process the licorice samples, licorice herbs were powdered and sieved, and 5 g of powder was added to 50 mL of water for 30 min of sonication, then centrifuged and passed through a 0.22 μm filter membrane to remove insoluble impurities. Next, a series of Hg2+ standard solutions were added, and the sample was tested using SERS.
A portable Raman spectrometer with a laser wavelength of 785 nm and an excitation power of 350 mW was used. The acquisition time for each spectrum was set to 10 s and accumulated three times. The integration time and laser power were the same for all SERS samples unless otherwise stated.

2.7. Data Processing

The SERS spectra were plotted using Origin2019b 64Bit.lnk by comparing the data from five experiments to obtain the mean values. Background correction was performed for all spectra using the selective nonlinear iterative shear (SNIP) algorithm.

3. Results and Discussion

3.1. Synthesis and Characterization of Fe3O4@SiO2@AuNPs

The Fe3O4@SiO2@AuNPs were synthesized through layer-by-layer assembly. The preparation process of Fe3O4@SiO2@AuNPs is shown in Scheme 1. First, the surface of Fe3O4 was covered with a SiO2 protective shell to increase its stability and dispersibility, and then Fe3O4@SiO2 was aminated and connected with AuNPs. The synthesized Fe3O4@SiO2@AuNPs possessed the magnetic properties of Fe3O4 and the Raman-enhanced properties of AuNPs.
The prepared Fe3O4@SiO2 was analyzed by scanning electron microscopy (SEM), and the results are shown in Figure 1A. The SEM image showed that the uncoated Fe3O4 particles were irregular in shape, with particle size around 30 nm and severe agglomeration between particles (Figure 1A(a)). To enhance the stability of the exposed Fe3O4 nanoparticles, SiO2 was used to protect them. Figure 1A(b) showed the shape of Fe3O4@SiO2 after coating, and it was apparent that the surface of Fe3O4 was covered with a gray SiO2 nanolayer. The particle size was slightly regular with the average particle size around 50 nm. SEM images revealed that AuNPs randomly clustered around Fe3O4@SiO2, and dense AuNPs wrapped the surface of Fe3O4@SiO2. As shown in Figure 1B, the black dashed line indicates Fe3O4@SiO2, which performed no significant UV absorption. The blue line indicates the UV absorption spectrum of Fe3O4@SiO2@AuNPs, and the UV absorption peak at 520 nm shows the successful modification of AuNPs on the surface of Fe3O4@SiO2. The red dashed line indicates the UV absorption spectrum of Fe3O4@SiO2@AuNPs after the addition of Hg2+. The SPR absorbance decreased after the addition of Hg2+ to the AuNP solution and further red-shifted to 720 nm by the redox reaction between Hg2+ and AUNPs, leading to the formation of small AuNPs [29].

3.2. Magnetic Adsorption Performance of Fe3O4@SiO2@AuNPs

To confirm the ability of magnetic adsorption of Hg2+ by Fe3O4@SiO2, part of the dried powder was taken and ultrasonically dispersed near the magnetic frame. It could be seen that the solid powder was magnetically adsorbed quickly. Figure 2A shows the synthesis of Fe3O4@SiO2. The remaining liquid was milky white after magnetic separation and clarified after several washes. Figure 2B shows that the aminated Fe3O4@SiO2 retained prominent magnetic properties.

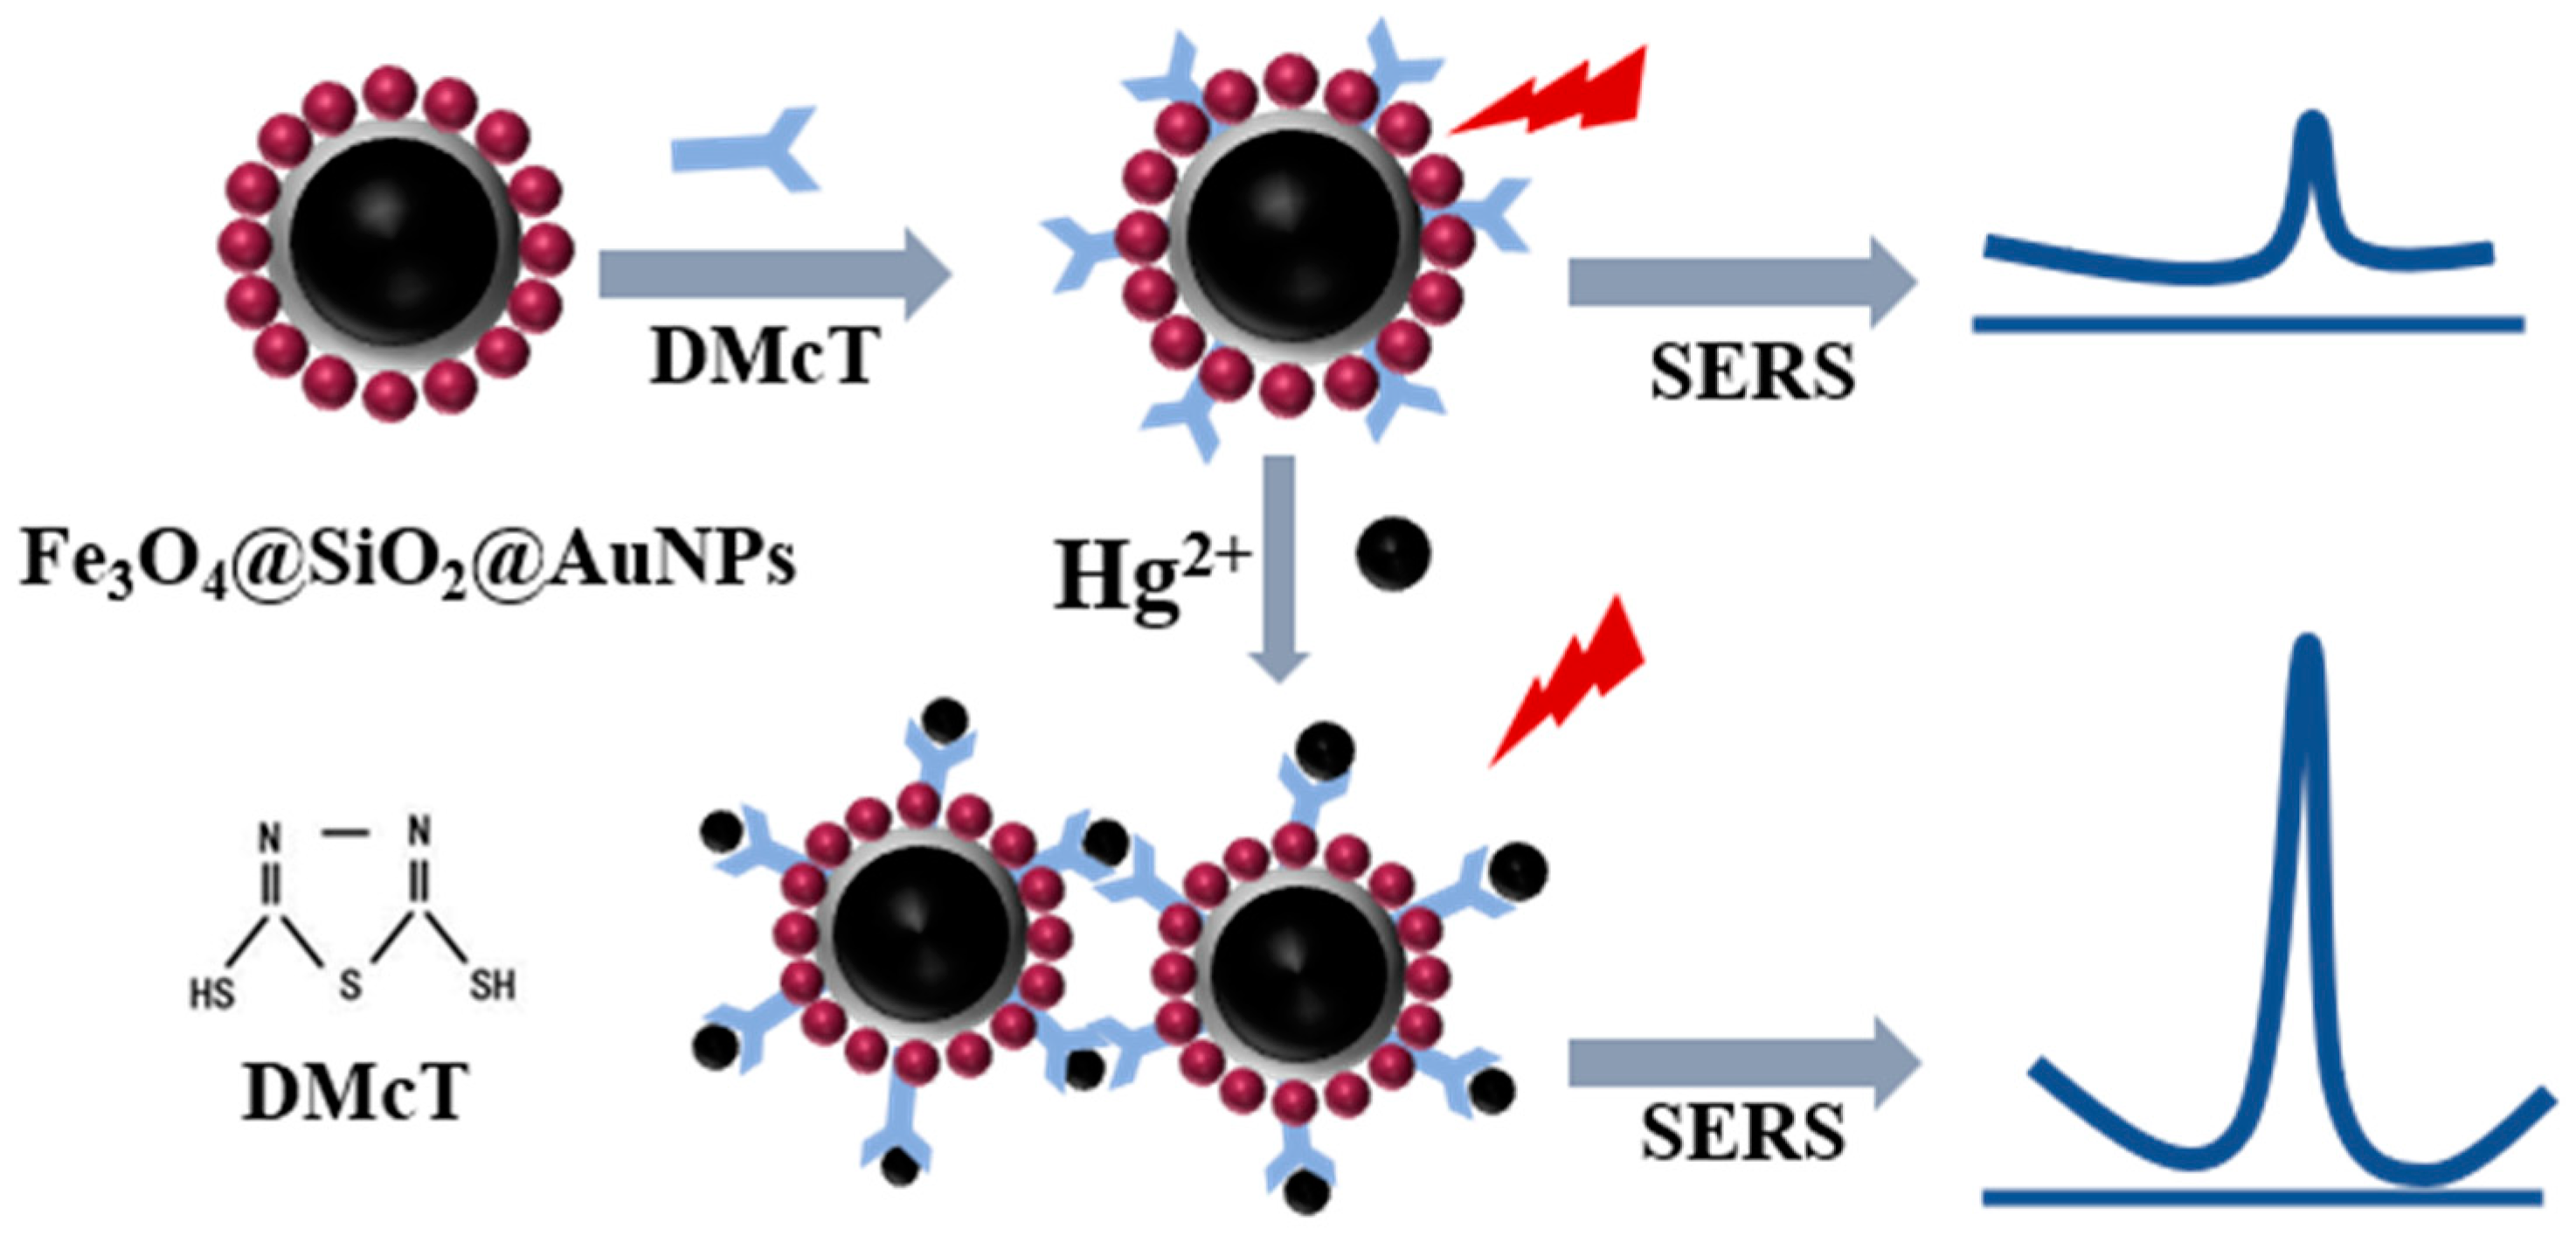
3.3. Principle of Hg2+ Detection Based on Fe3O4@SiO2@AuNPs-DMcT

DMcT (C2H2N2S3) has four main donor sites, two -NH and two -SH. Its structural formula is shown in Figure 3. Previous experiments found that the two -SH groups on DMcT combined with Fe3O4@SiO2@AuNPs. When Hg2+ was present in the system, the strong coordination binding between Hg2+ and the nitrogen atom in DMcT drove the aggregation of the Fe3O4@SiO2@AuNPs-DMcT-Hg2+ sandwich structure, which significantly enhanced the SERS signal of DMcT. The Hg2+ detection solution was achieved by linking the amount of Hg2+ with the “hot spot” effect of NPs, and indirect detection of Hg2+ in samples was achieved by enhancement of Raman information. The detection principle is shown in Figure 3.

3.4. SERS Detection of Hg2+

As shown in Figure 4, there was no SERS signal for both Fe3O4@SiO2 (Figure 4a) and Fe3O4@SiO2@AuNPs (Figure 4b). The Raman spectral curve in Figure 4c shows the Raman signal of Fe3O4@SiO2@AuNPs-DMcT in the absence of a magnetic field. The spectral curve in Figure 4d represents the SERS signals of Fe3O4@SiO2@AuNPs-DMcT in the presence of the magnetic field. Compared with the spectral curve in Figure 4c, the Raman signal of DMcT was significantly enhanced in the magnetic field, which proved the enrichment effect of magnetic nanomaterials.
The SERS spectra of different concentrations of Hg2+ standard solution reacted with Fe3O4@SiO2@AuNPs-DMcT for 10 min are shown in Figure 5A. The detection of Hg2+ was achieved by observing the increase in SERS intensity of DMcT. The Raman intensity at 1418 cm−1 represented the characteristic Raman peak of the C=N vibration in DMcT, which acted as a Hg2+ reporter and was enhanced with increasing Hg2+ concentration. The thiocarbonyl sulfur atom in DMcT was covalently bound to the Ag shell on the NP, and the N atom at the other end was used to recognize Hg2+. The strong synergy between N-Hg guaranteed the functionalized NP aggregation of DMcT in the presence of Hg and enhanced the Raman signal. The Raman spectrum of DMcT showed vibrational peaks at 389, 554, 668, 1061, 1363, and 1418 cm−1. The Raman peak assignments of DMcT are shown in Table 1. The intensity of the characteristic Raman peak of DMcT at 1418 cm−1 gradually increased with Hg2+ concentration, which was mainly due to the magnetic enrichment of Fe3O4. Fe3O4@SiO2@AuNPs not only performed the substantial SERS enhancement of AuNPs but also enriched the Hg2+ adsorbed on its surface. As shown in Figure 5B, the relative Raman intensity of DMcT showed an excellent linear relationship with the concentration of Hg2+ (0.5~80 ng/mL). The horizontal coordinate represents the Hg2+ concentration, and the vertical coordinate R-R0 represents the difference in SERS intensity of DMcT at 1418 cm−1 when Hg2+ was present or absent. A good linear relationship was further obtained: y = 101.19x + 870.6, R2 = 0.9709.

3.5. Enrichment of Hg2+ in Licorice Extract and SERS Detection

In order to verify the feasibility of magnetic nanomaterials for the detection of Hg2+, we performed spiked recovery experiments for the content of Hg2+ in licorice extract. The spiked concentrations and detection results are shown in Table 2. Before the SERS assay, Hg2+ in the samples was adsorbed with an applied magnetic field, and the excess licorice extract was removed and resuspended in an equal volume of solution for testing. The results indicated that the spiked recoveries of Hg2+ in licorice extract by the magnetic nanomaterials combined with DMcT ranged from 89.10% to 111.00%, which met the methodological requirements and had practical application value.

3.6. Reproducibility and Specificity Examination

The reproducibility of the spectra was an essential factor in showing the practicality of the method. SERS was performed on Fe3O4@SiO2@AuNPs-DMcT prepared from the same batch and the same concentration. The spectral reproducibility under eight parallel experiments is shown in Figure 6A. The RSD of DMcT at 1418 cm−1 was 7.46%, which indicated that the reproducibility of this method was strong. Next, Fe3O4@SiO2@AuNPs stored in a refrigerator at 4 °C for 15 days were examined for stability, and it was found that their SERS signals were relatively stable. Fe3O4@SiO2@AuNPs-DMcT had both high stability and the magnetic properties of AuNPs.
To verify the selectivity of Hg2+ detection based on DMcT-functionalized Fe3O4@SiO2@AuNPs, four other more toxic heavy metal ions were selected as interfering ions for the detection. The concentrations of Pb2+, Cd2+, As3+ and Cu2+ were all 1000 ng/mL, except for Hg2+ which was 100 ng/mL. These concentrations were set to highlight the specificity of the material for adsorption of Hg2+. The Raman detection results of these five heavy metal ions were analyzed, as shown in Figure 6C. The green bar graph represents the SERS signal before adding heavy metal ions, and the red bar graph represents the SERS signal after adding heavy metal ions. The change in the SERS signal indicated that the probe DMcT was highly selective to Hg2+. This was most likely due to the fact that all N- atoms on DMcT form coordination structures with Hg2+, and the known stability of coordination covalent bonds formed by nitrogen atoms. Hg2+ is higher than that of other heavy metal ions. Therefore, it showed superior specificity in Hg2+ detection.

3.7. Comparison with Other Substrate Materials

In order to highlight the superiority of the method in this paper, we compared the detection limits of Hg2+ based on SERS materials reported in the literature, as shown in Table 3. Compared with other SERS substrates, the magnetic nanomaterials used in this study have higher sensitivity, better separation, and stronger enrichment effects for the detection of Hg2+.

4. Conclusions

In this study, novel Fe3O4@SiO2@AuNPs magnetic nanomaterials were prepared and combined with DMcT probe to enrich and detect heavy metals in TCM. The magnetic nanomaterials were synthesized through self-assembly, and their morphology and UV absorption were characterized. Using DMcT as the probe molecule, Hg2+ could bind to the nitrogen atoms in DMcT and induce the agglomeration of Fe3O4@SiO2@AuNPs-DMcT, leading to the enhancement of SERS signal. Through the methodological investigation, the detection of Hg2+ in the licorice extracts by SERS proved that the material had the advantages of high sensitivity, low detection limit, and effective separation and enrichment. The method showed good linearity between 0.5 and 80 ng/mL (R2 = 0.9709). It also achieved high recoveries (89.10~111.00%) in the detection of licorice extracts, indicating potential value in applying SERS to detect heavy metal ions in complex matrices. The method has shown strong application prospects in the rapid on-site trace detection of heavy metal ions in traditional Chinese medicine.

Author Contributions

J.Z.: formal analysis, conceptualization, and methodology. B.W.: investigation, data curation, and writing—original draft preparation. J.L. and P.Y.: supervision and validation. G.X. and J.Y. (Jiangyu Yao): data curation. X.G.: software and formal analysis, J.Y. (Jizhong Yan): project administration and supervision. H.Z.: funding acquisition, reviewing, and editing All authors have read and agreed to the published version of the manuscript.

Funding

This research was supported by Zhejiang Provincial Natural Science Foundation of China (Grant No. LY20H280014), the Basic Public Welfare Research Project of Zhejiang Province (Grant No. LBY22H280003), and Zhejiang Provincial Department of Science and Technology Project (Grant No. 2022C03062).

Institutional Review Board Statement

Not applicable.

Informed Consent Statement

Not applicable.

Data Availability Statement

Not applicable.

Conflicts of Interest

The authors declare that they have no known competing financial interests or personal relationships that could have appeared to influence the work reported in this paper.

References

  1. Li, L.; Wu, Y.; Wang, J.; Yan, H.; Lu, J.; Wang, Y.; Zhang, B.; Zhang, J.; Yang, J.; Wang, X.; et al. Potential treatment of COVID-19 with traditional chinese medicine: What herbs can help win the battle with SARS-CoV-2? Engineering 2021, in press. [Google Scholar] [CrossRef]
  2. Zhu, Y.Z.; He, Z.P.; Zhang, M. Effects of traditional Chinese medicine in the prevention and treatment of pulmonary fibrosis in recovery from novel coronavirus pneumonia (COVID-19). Chin. Tradit. Pat. Med. 2021, 43, 2224–2229. [Google Scholar]
  3. Meng, C.; Wang, P.; Hao, Z. Ecological and health risk assessment of heavy metals in soil and Chinese herbal medicines. Environ. Geochem. Health 2021, 44, 817–828. [Google Scholar] [CrossRef] [PubMed]
  4. Liang, X.; Yan, L.; Xu, X. Study on the excessive heavy metal in teaditional Chinese medicine. Guangxi J. Tradit. Chin. Med. 2021, 44, 75–77. [Google Scholar]
  5. Li, M.T.; Li, P.C.; Lin, D.J. Detection Research progress of Hg (II) by Surface-enhanced Raman Spectroscopy. Technol. Dev. Chem. Ind. 2020, 49, 43–45+72. [Google Scholar]
  6. Jiang, Z.G.; Xu, N.; Liu, B.X. Metal concentrations and risk assessment in water, sediment and economic fish species with various habitat preferences and trophic guilds from Lake Caizi, Southeast China. Ecotoxicol. Environ. Saf. 2018, 157, 1–8. [Google Scholar] [CrossRef]
  7. Wu, D.H. Determination of Mercury Content in Rhizome Traditional Chinese Medicine Pieces by Mercury Analyzer. J. Insp. Quar. 2019, 29, 38–39. [Google Scholar]
  8. Hassan, S.; Mazhar, W.; Farooq, S.; Ali, A.; Musharraf, S.G. Assessment of heavy metals in calcium carbide treated mangoes by inductively coupled plasmamass spectrometry (ICP-MS). Food Addit. Contam. Part A 2019, 36, 1769–1776. [Google Scholar] [CrossRef] [PubMed]
  9. Li, K.; Yang, H.; Yuan, X.; Zhang, M. Recent developments of heavy metals detection in traditional Chinese medicine by atomic spectrometry. Microchem. J. 2021, 160, 105726. [Google Scholar] [CrossRef]
  10. Ding, Q.; Li, C.; Wang, H.; Xu, C.; Kuang, H. Electrochemical detection of heavy metal ions in water. Chem. Commun. 2021, 57, 7215–7231. [Google Scholar] [CrossRef] [PubMed]
  11. Wang, Q.; Wei, K.N.; Huang, S.Z.; Tang, Q.; Tao, Z.; Huang, Y. “Turn-Off” Supramolecular Fluorescence Array Sensor for Heavy Metal Ion Identification. ACS Omega 2021, 6, 31229–31235. [Google Scholar] [CrossRef] [PubMed]
  12. Kamar, V.; Dağalp, R.; Taştekin, M. Determination of Heavy Metals in Almonds and Mistletoe as a Parasite Growing on the Almond Tree Using ICP-OES or ICP-MS. Biol. Trace Elem. Res. 2018, 185, 226–235. [Google Scholar] [CrossRef] [PubMed]
  13. Yu, L.; Pang, Y.; Mo, Z.; Huang, Y.; Shen, X. Coordination array for accurate colorimetric sensing of multiple heavy metal ions. Talanta 2021, 231, 122357–122364. [Google Scholar] [CrossRef]
  14. Fan, M.; Andrade, G.F.; Brolo, A.G. A review on the fabrication of substrates for surface enhanced Raman spectroscopy and their applications in analytical chemistry. Anal. Chim. Acta 2011, 693, 7–25. [Google Scholar] [CrossRef] [PubMed]
  15. Jiang, Y.; Sun, D.W.; Pu, H.; Wei, Q. Surface enhanced Raman spectroscopy (SERS): A novel reliable technique for rapid detection of common harmful chemical residues. Trends Food Sci. Technol. 2018, 75, 10–22. [Google Scholar] [CrossRef]
  16. Jamieson, L.E.; Asiala, S.M.; Gracie, K.; Faulds, K.; Graham, D. Bioanalytical Measurements Enabled by Surface-Enhanced Raman Scattering (SERS) Probes. Annu. Rev. Anal. Chem. 2017, 10, 415–437. [Google Scholar] [CrossRef] [PubMed] [Green Version]
  17. Zhang, D.; Liang, P.; Chen, W.; Tang, Z.; Li, C.; Xiao, K.; Jin, S.; Ni, D.; Yu, Z. Rapid field trace detection of pesticide residue in food based on surface-enhanced Raman spectroscopy. Microchim. Acta 2021, 188, 370–389. [Google Scholar] [CrossRef] [PubMed]
  18. Wang, T.; Wang, S.P.; Cheng, Z.H. Emerging core–shell nanostructures for surface-enhanced Raman scattering (SERS) detection of pesticide residues. Chem. Eng. J. 2021, 424, 130323–130328. [Google Scholar] [CrossRef]
  19. Wang, T.; Wei, J.C.; Wang, Y.T.; Li, P. Recent advances in surface-enhanced Raman scattering technique for pollutant detection in Chinese medicinal material. China J. Chin. Mater. Med. 2021, 46, 62–71. [Google Scholar]
  20. Zuo, F.T.; Xu, W.; Zhao, A.W. A SERS Approach for Rapid Detection of Hg2+ Based on Functionalized Fe3O4@Ag Nanoparticles. Acta Chim. Sin. 2019, 77, 379–386. [Google Scholar] [CrossRef] [Green Version]
  21. Song, C.Y.; Yang, B.Y.; Yang, Y.J. SERS-based mercury ion detections: Principles, strategies and recent advances. Sci. China Chem. 2016, 59, 16–29. [Google Scholar] [CrossRef]
  22. Wang, C.W.; Rong, Z.; Wang, J. Seed-mediated synthesis of high-performance silver-coated magnetic nanoparticles and their use as effective SERS substrates. Colloids Surf. A Physicochem. Eng. Asp. 2016, 506, 393–401. [Google Scholar] [CrossRef]
  23. Xu, Y.J.; Haung, S.; Li, L.J.; Cheng, H.; Huang, W.Y.; Feng, J. Preparation of Fe3O4@SiO2@Ag Nanocomposites and Detection of Oxacillin by Surface-enhanced Raman Spectroscopy. J. Anal. Sci. 2020, 36, 7–12. [Google Scholar]
  24. Wang, H.; Shen, J.; Cao, G.X. Multifunctional PEG encapsulated Fe3O4@silver hybrid nanoparticles: Antibacterial activity, cell imaging and combined photothermo/chemo-therapy. J. Mater. Chem. B 2013, 1, 6225–6234. [Google Scholar] [CrossRef]
  25. Shen, J.H.; Zhu, Y.H.; Yang, X.L. Multifunctional Fe3O4@Ag/SiO2/Au Core-Shell Microspheres as a Novel SERS-Activity Label via Long-Range Plasmon Coupling. Langmuir 2013, 29, 690–695. [Google Scholar] [CrossRef] [PubMed]
  26. Sun, Z.L.; Du, J.J.; Yan, L. Multifunctional Fe3O4@SiO2-Au Satellite Structured SERS Probe for Charge Selective Detection of Food Dyes. ACS Appl. Mater. Interfaces 2016, 8, 3056–3062. [Google Scholar] [CrossRef] [PubMed]
  27. Maximenko, A.; Depciuch, J.; Łopuszyńska, N.; Stec, M. Fe3O4@SiO2@Au nanoparticles for MRI-guided chemo/NIR photothermal therapy of cancer cells. RSC Adv. 2020, 10, 26508–26520. [Google Scholar] [CrossRef] [PubMed]
  28. Stöber, W.; Fink, A.; Bohn, E. Controlled growth of monodisperse silica spheres in the micron size range. J. Colloid Interface Sci. 1968, 26, 62–69. [Google Scholar] [CrossRef]
  29. Chen, J.L.; Yang, P.C.; Wu, T. Determination of mercury (II) ions based on silver-nanoparticles-assisted growth of gold nanostructures: UV–Vis and surface enhanced Raman scattering approaches. Spectrochim. Acta Part A Mol. Biomol. Spectrosc. 2018, 199, 301–307. [Google Scholar] [CrossRef]
  30. Senapati, T.; Senapati, D.; Singh, A.K. Highly selective SERS probe for Hg(ii) detection using tryptophan-protected popcorn shaped gold nanoparticles. Chem. Commun. 2011, 47, 10326. [Google Scholar] [CrossRef]
  31. Han, D.; Lim, S.Y.; Kim, B.J. Mercury(ii) detection by SERS based on a single gold microshell. Chem. Commun. 2010, 46, 5587. [Google Scholar] [CrossRef] [PubMed]
  32. Zhao, Y.; Yamaguchi, Y.; Ni, Y.; Li, M.; Dou, X. A SERS-based capillary sensor for the detection ofmercury ions in environmental water. Spectrochim. Acta Part A Mol. Biomol. Spectrosc. 2020, 233, 118193. [Google Scholar] [CrossRef]
  33. Tan, X.; Liu, X.B.; Bai, H.J. Quantitative detection of several heavy metals by modified surface-enhanced Raman substrates. J. Sichuan Univ. (Nat. Sci. Ed.) 2021, 58, 148–154. [Google Scholar]
  34. Chen, Z.Y.; Gupta, A.; Chattopadhyay, S. Detection of mercury in spiked cosmetics by surface enhanced Raman spectroscopy using silver shelled iron oxide nanoparticles. Sens. Actuators B Chem. 2021, 337, 129788. [Google Scholar] [CrossRef]
Scheme 1. Schematic diagram illustrating the synthesis of Fe3O4@SiO2@AuNPs.
Chemosensors 10 00403 sch001
Figure 1. Characterization of Fe3O4@SiO2. (A) Scanning electron microscopy (SEM), the shape of uncoated Fe3O4 particles (a), the shape of Fe3O4@SiO2 after coating (b); (B) ultraviolet–visible spectroscopy (UV-Vis).
Chemosensors 10 00403 g001
Figure 2. Photographs of magnetic nanomaterials before and after magnetic separation. (A) the mixing state (left) and the magnetic suction state (right) of Fe3O4@SiO2; (B) the mixing state (left) and the magnetic suction state (right) of Aminated Fe3O4@SiO2.
Chemosensors 10 00403 g002
Figure 3. Schematic diagram of Hg2+ detection based on DMcT-functionalized Fe3O4@SiO2@AuNPs.
Chemosensors 10 00403 g003
Figure 4. Raman spectra for different substrate states. (a): Fe3O4@SiO2, (b): Fe3O4@SiO2@AuNPs, (c): Fe3O4@SiO2@AuNPs-DMcT without magnetic field, and (d): Fe3O4@SiO2@AuNPs-DMcT with the magnetic field.
Chemosensors 10 00403 g004
Figure 5. The Raman spectrum and standard curve for the detection of Hg2+ based on Fe3O4@SiO2@AuNPs-DMcT SERS probes. (A) Raman spectra of the reaction between different concentrations of Hg2+ and Fe3O4@SiO2@AuNPs-DMcT SERS probes; (B) linear relationship between Hg2+ concentration and SERS peak intensity at 1418 cm−1 for DMcT. (R-R0, R, and R0 represented the SERS intensity of DMcT at 1418 cm−1 when Hg2+ was present or absent).
Chemosensors 10 00403 g005
Figure 6. Reproducibility and stability experiments. (A) SERS spectra in eight parallel experiments; (B) SERS spectra of DMcT (10−5 mol/L) at different storage times for Fe3O4@SiO2@AuNPs. (C) Selectivity of DMcT-functionalized Fe3O4@SiO2@AuNPs for the detection of Hg2+.
Chemosensors 10 00403 g006
Table 1. Spectral data and vibrational assignment of DMcT.
Raman DMcT PowerRaman Shift of DMcTAssignment
1514 m——v (C=N) asym
1456 vs1418 vsv (C=N) asym
1363 m
1287 m————
1120 w——Ring stretch
1089 m1061 mRing stretch
1048 m——Ring stretch
725 m668 sv (C–S) asym
666 s554 mo.p. dist.
545 m——
499 m389 mδ (CSC) + δ (CSH)
379 s——
322 o.p. dist.
s, strong; m, medium; w, weak; vs, very strong.
Table 2. Detection of Hg2+ in licorice extract based on Fe3O4@SiO2@AuNPs-DMcT.
SamplesAddedDetectedRecovery (%)RSD (%) n = 5
Licorice extract10 ng/mL8.9 ng/mL89.104.75
Licorice extract30 ng/mL33.3 ng/mL111.005.39
Licorice extract50 ng/mL48.6 ng/mL97.204.88
Licorice extract80 ng/mL77.1 ng/mL96.376.97
Table 3. Comparison of different SERS substrate and Raman probes.
SERS SubstrateRaman ProbesObjectLOD (ng/mL)Reference
AuNPsTryptophanHg2+5 ng/mL [30]
Ag@AuNPsTAMRAHg2+50 nmol/L [31]
AgNPsDpyHg2+1 ng/mL [32]
AuNPs4-MBAHg2+50 ng/mL [33]
Fe3O4@AgDMcTHg2+2 ng/mL [34]
Fe3O4@SiO2@AuNPsDMcTHg2+0.5 ng/mLThis work
Publisher’s Note: MDPI stays neutral with regard to jurisdictional claims in published maps and institutional affiliations.

