Article

Simultaneous Analysis of MLH1, MSH2, MSH6, PMS2 and KRAS in Patients with Gastric and Colon Cancer Using Stochastic Sensors

1
Laboratory of Electrochemistry and PATLAB, National Institute of Research for Electrochemistry and Condensed Matter, 202 Splaiul Independentei Street, 060021 Bucharest, Romania
2
Faculty of Chemical Engineering and Biotechnologies, Politehnica University of Bucharest, 1-7 Gheorghe Polizu Street, 011061 Bucharest, Romania
3
National Institute for Research and Development of Isotopic and Molecular Technologies, 67-103 Donat Street, 400293 Cluj-Napoca, Romania
*
Authors to whom correspondence should be addressed.
Chemosensors 2022, 10(10), 380; https://doi.org/10.3390/chemosensors10100380
Submission received: 31 August 2022 / Revised: 18 September 2022 / Accepted: 19 September 2022 / Published: 21 September 2022
(This article belongs to the Collection Women Special Issue in Chemosensors and Analytical Chemistry)

Abstract

:
Two stochastic sensors were characterized and validated for the molecular identification and quantification of MLH1, MSH2, MSH6, PMS2 and KRAS in biological samples using two types of doped-graphene modified with maltodextrin. When a potential of 125 mV vs. Ag/AgCl was applied, the two stochastic sensors recorded extremely low limits of determination (fg mL−1 magnitude order) and wide linear concentration ranges, which enabled the molecular identification and quantification of MLH1, MSH2, MSH6, PMS2 and KRAS in healthy individuals and patients with gastric or colon cancer. The recoveries of MLH1, MSH2, MSH6, PMS2 and KRAS in whole blood, saliva, urine and tumoral tissue samples exceeded 98.00% with a relative standard deviation of less than 1.00%.

1. Introduction

Microsatellites (MS) are short tandem repeats (one to six nucleotides) dispersed across the entire genome that are prone to mutation. Thus, microsatellite instability (MSI) is described as a hyper-mutable condition that develops at genomic MS in the context of a poor DNA mismatch repair (dMMR) apparatus [1]. MSI occurs in 15 to 20 percent of colorectal adenocarcinomas due to impairments in mismatch repair complex function [2,3]. MSI-associated carcinomas are characterized by right-sided localization, age less than 50 years, tumor-infiltrating lymphocytes, the absence of “dirty necrosis”, the presence of a Crohn-like reaction, mucinous differentiation, medullary characteristics and/or well-differentiated [2].
The mismatch repair mechanism is a highly conserved biological process that identifies and repairs mismatched bases, most likely as a result of DNA replication, genetic recombination or chemical/physical damage [4]. The MMR machinery is comprised of a series of DNA mismatch repair enzymes: MutL homolog 1 (MLH1), MutS homolog 2 (MSH2), MutS homolog 6 (MSH6) and post meiotic segregation increased 2 (PMS2). During normal DNA replication, the heterodimeric complex MSH2/MSH6 detects and binds minor DNA mismatch mistakes, whereas the heterodimeric complex MLH1/PMS2 is responsible for the excision and resynthesis of the repaired DNA bases at the mismatch sites.
The loss of expression or deficiencies in one or more MMR machinery elements define the inadequacy of the complex and, hence, the failure of DNA repair. A growing body of evidence indicates that the MSI status in gastric cancer (GC) is positively associated with longer survival compared with the MSS counterpart [5]. Furthermore, due to their intrinsic mutational burden, increased inflammation and the expression of immune checkpoints, such as the programmed death-ligand 1 (PD-L1), MSI tumors exhibit promising molecular hallmarks of potential sensitivity to cancer immunotherapy [6].
In spontaneous, nonhereditary adenocarcinomas, hypermethylation of the MLH1 mismatch repair promoter gene causes deficits in MLH1 protein expression, leading to the loss of nuclear protein expression in the tumor cells. In hereditary adenocarcinomas (Lynch syndrome), germline mutations most frequently affect the MSH2 gene, although they can also affect the MLH1, MSH6 and PMS2 genes, resulting in a lack of nuclear staining of the specific protein [3,7,8,9]. These screening approaches can identify patients who require genetic testing and counseling.
The Kirsten rat sarcoma virus (KRAS) gene belongs to the gene category known as oncogenes. If oncogenes are changed, they have the power to turn normal cells into cancerous cells. It is responsible for the encoding of its homologous protein, which participates in cell division, cell differentiation and cell death (apoptosis) [10].
The ability of stochastic sensors to provide precise qualitative and quantitative evaluations is widely established [11,12]. Since they can be used for screening tests for any biological fluid, including saliva, urine, whole blood and serum samples, they have previously been used for biomedical analysis [13,14,15]. The study’s findings can be used in screening tests to identify molecular patterns with clinical relevance because they are unaffected by the matrix’s composition from which the biomarker is derived.
Due to their advantages over conventional methods of analysis, such as their ease of use (no sample treatment is needed), high sensitivity, low cost, capacity to detect multiple analytes, excellent selectivity and low detection limits, electrochemical methods were frequently used in biomedical analysis [16,17].
However, to our knowledge, to date, there are no electrochemical methods/sensors proposed for either simultaneously or individually assay of MSH1, MLH2, MLH6 and PMS2, while for KRAS determination, there were previously proposed single-molecule bioelectronic label-free assay [18] as well as stochastic sensors [19]. Immunohistochemistry methods [20] as well as ELISA kits (which are available from many pharmaceutical companies) were the only methods proposed to date for the clinical studied involving the assay of MLH1, MSH1, MSH6, PMS2 and KRAS, although their assay has an immediate implication in microsatellite instability [21,22,23,24,25,26].
In order to determine the five biomarkers from biological samples, including whole blood, urine, saliva and tumoral tissue, two stochastic sensors based on sulfur-doped exfoliated graphene and further modified with maltodextrin are designed and validated in this study. By doping of graphene with sulfur an enhanced conductivity was achieved, favorizing also an increased sensitivity of the stochastic method used for the simultaneous assay of MLH1, MSH2, MSH6, PMS2 and KRAS.

2. Materials and Methods

2.1. Chemicals

Analytical grade chemicals were used throughout this work. MLH1, MSH2, MSH6, PMS2, KRAS and maltodextrin (MD) were purchased from Sigma Aldrich (Milwaukee, USA). Paraffin oil was purchased from Fluka (Buchs, Switzerland). Ammonium sulphate, boric acid and sodium chloride were purchased from Reactivul Bucuresti (Bucharest, Romania).
All solutions were made using distilled water that was given by a Millipore Direct Q-3 System with different concentrations (for MLH1: 32.00 μg mL−1 to 3.20 × 10⁻¹⁰ μg mL−1, for MSH2: 10.00 μg mL−1 to 1.00 × 10⁻⁹ μg mL−1, for MSH6: 23.00 μg mL−1 to 2.30 × 10⁻⁹ μg mL−1, for PMS2: 27.00 μg mL−1 to 2.70 × 10⁻⁹ μg mL−1 and for KRAS: 22.00 μg mL−1 to 2.20 × 10⁻⁹ μg mL−1). Phosphate buffer saline (pH 7.40) was used for the preparation of the analyte solutions. When not in use, all solutions were kept in a freezer at −20 °C.

2.2. Electrochemical Exfoliation of Graphite Rods

The first graphene sample (EGR-1) was obtained by the exfoliation of graphite rods in solution containing 0.05 M ammonium sulphate + 0.05 M boric acid + 0.05 M sodium chloride. The second graphene sample (EGR-2) was obtained by the exfoliation of graphite rods in solution containing 0.05 M ammonium sulphate + 0.1 M boric acid + 0.05 M sodium chloride. Typically, the exfoliation cell contained two high-purity graphite rods (anode and cathode) connected to the exfoliation system (a home-made system that generated pulses of currents).
The cell was filled with 100 mL solution of each electrolyte, and a constant voltage of 12 V was applied between anode and cathode, for about 4 h. A black powder was deposited at the bottom of the cell after exfoliation. The powder was collected, washed with 8 L of distilled water and finally dispersed in 125 mL water by ultrasound (30 min). In order to remove the larger particles, the black suspension was filtered on white-ribbon paper and dried by lyophilization. According to XPS analysis, each sample contains doping heteroatoms: nitrogen, sulfur and boron. Hence, EGR-1 contains 0.7 at% nitrogen, 1 at% sulfur and 2 at% boron while EGR-2 contains 1.7 at% nitrogen, 2.5 at% sulfur and 3 at% boron.

2.3. Instruments

GPES software was installed on a personal computer, which was connected to a potentiostat/galvanostat AUTOLAB/PGSTAT 302 (Methrom, Utrecht, The Netherlands) to assay the solutions and biological samples. Furthermore, a three-electrode electrochemical cell was used. The suggested stochastic sensors serve as the working electrodes for the three-electrode system. The reference electrode, also known as the Ag/AgCl electrode, and the counter electrode, which is a platinum wire, serve as the reference and counter electrodes, respectively.
The morphology and structure of the synthesized samples were investigated using Scanning Electron Microscopy SEM (SU-8230 STEM system, Hitachi, Japan) and X-ray Powder Diffraction XRD (Bruker D8 Advance Diffractometer). The background-corrected patterns were plotted and used for the calculation of the graphene structural parameters.

2.4. The Stochastic Sensors’ Design

To construct the two stochastic sensors, two different types of doped-graphene were employed, EGR-1 and EGR-2, respectively. In order to create a homogeneous paste for the first sensor, 0.01 g of each graphene was combined with paraffin oil. We used 50 μL of MD to establish the required channels needed to obtain the specific signals for the stochastic sensors given the fact that there was no stochastic signal when the doped-graphene powders were not modified.
A silver wire acted as the contact between the pastes and the external circuit of the electrochemical cell. Each modified paste was placed into non-conducting plastic tubes (inner diameter: 150 μm, length: 5 mm). The stochastic microsensors were cleaned with deionized water and dried after each measurement, whether it be of solutions or biological samples. When not in use, these sensors were kept in a dry place. No cross-contamination of the sensors’ surfaces was observed during the measurements of solutions and biological samples.

2.5. Procedure of Analysis: The Stochastic Method

With a constant potential (125 mV vs. Ag/AgCl) applied, a chronoamperometric approach was chosen for the stochastic method. This method was utilized to analyze MLH1, MSH6, MSH2, PMS2 and KRAS from saliva, urine, tumoral tissue and whole blood samples from confirmed patients with gastric or colon cancer in both a qualitative and quantitative manner. The stochastic diagrams were used to identify two parameters of interest, toff and ton, respectively (Figure 1, Figure 2, Figure 3 and Figure 4).
toff is regarded as the analytes’ signatures and its values are employed for qualitative analysis; using its value, KRAS, MLH1, MSH2, MSH6 and PMS2 were found in the diagrams produced for the examination of biological samples (Figure 1, Figure 2, Figure 3 and Figure 4). The ton values were then read; it reflects the quantitative parameter (1/ton = a + b × CPMS2/MSH2/MLH1/MSH6/KRAS) and is known as the time of equilibrium required for the interaction of the analytes with the wall channels and the redox processes that take place inside those channels. The linear regression method was used to obtain the calibration equations.

2.6. Biological Samples

Blood, tumoral tissue, saliva and urine samples that were taken from patients who had been diagnosed with gastric and colon cancer were examined. Prior to the samples being collected, none of the patients were receiving therapy for colon or gastric cancer. These samples were collected from the Hospital of Targu-Mures (Ethics committee approval number: 75/2015). The biological samples that were being assayed did not require any processing prior to measurement. The stochastic method mentioned above was used to determine the unknown MSH2, KRAS, PMS2, MSH6 and MLH1 concentrations in the biological samples.

3. Results and Discussion

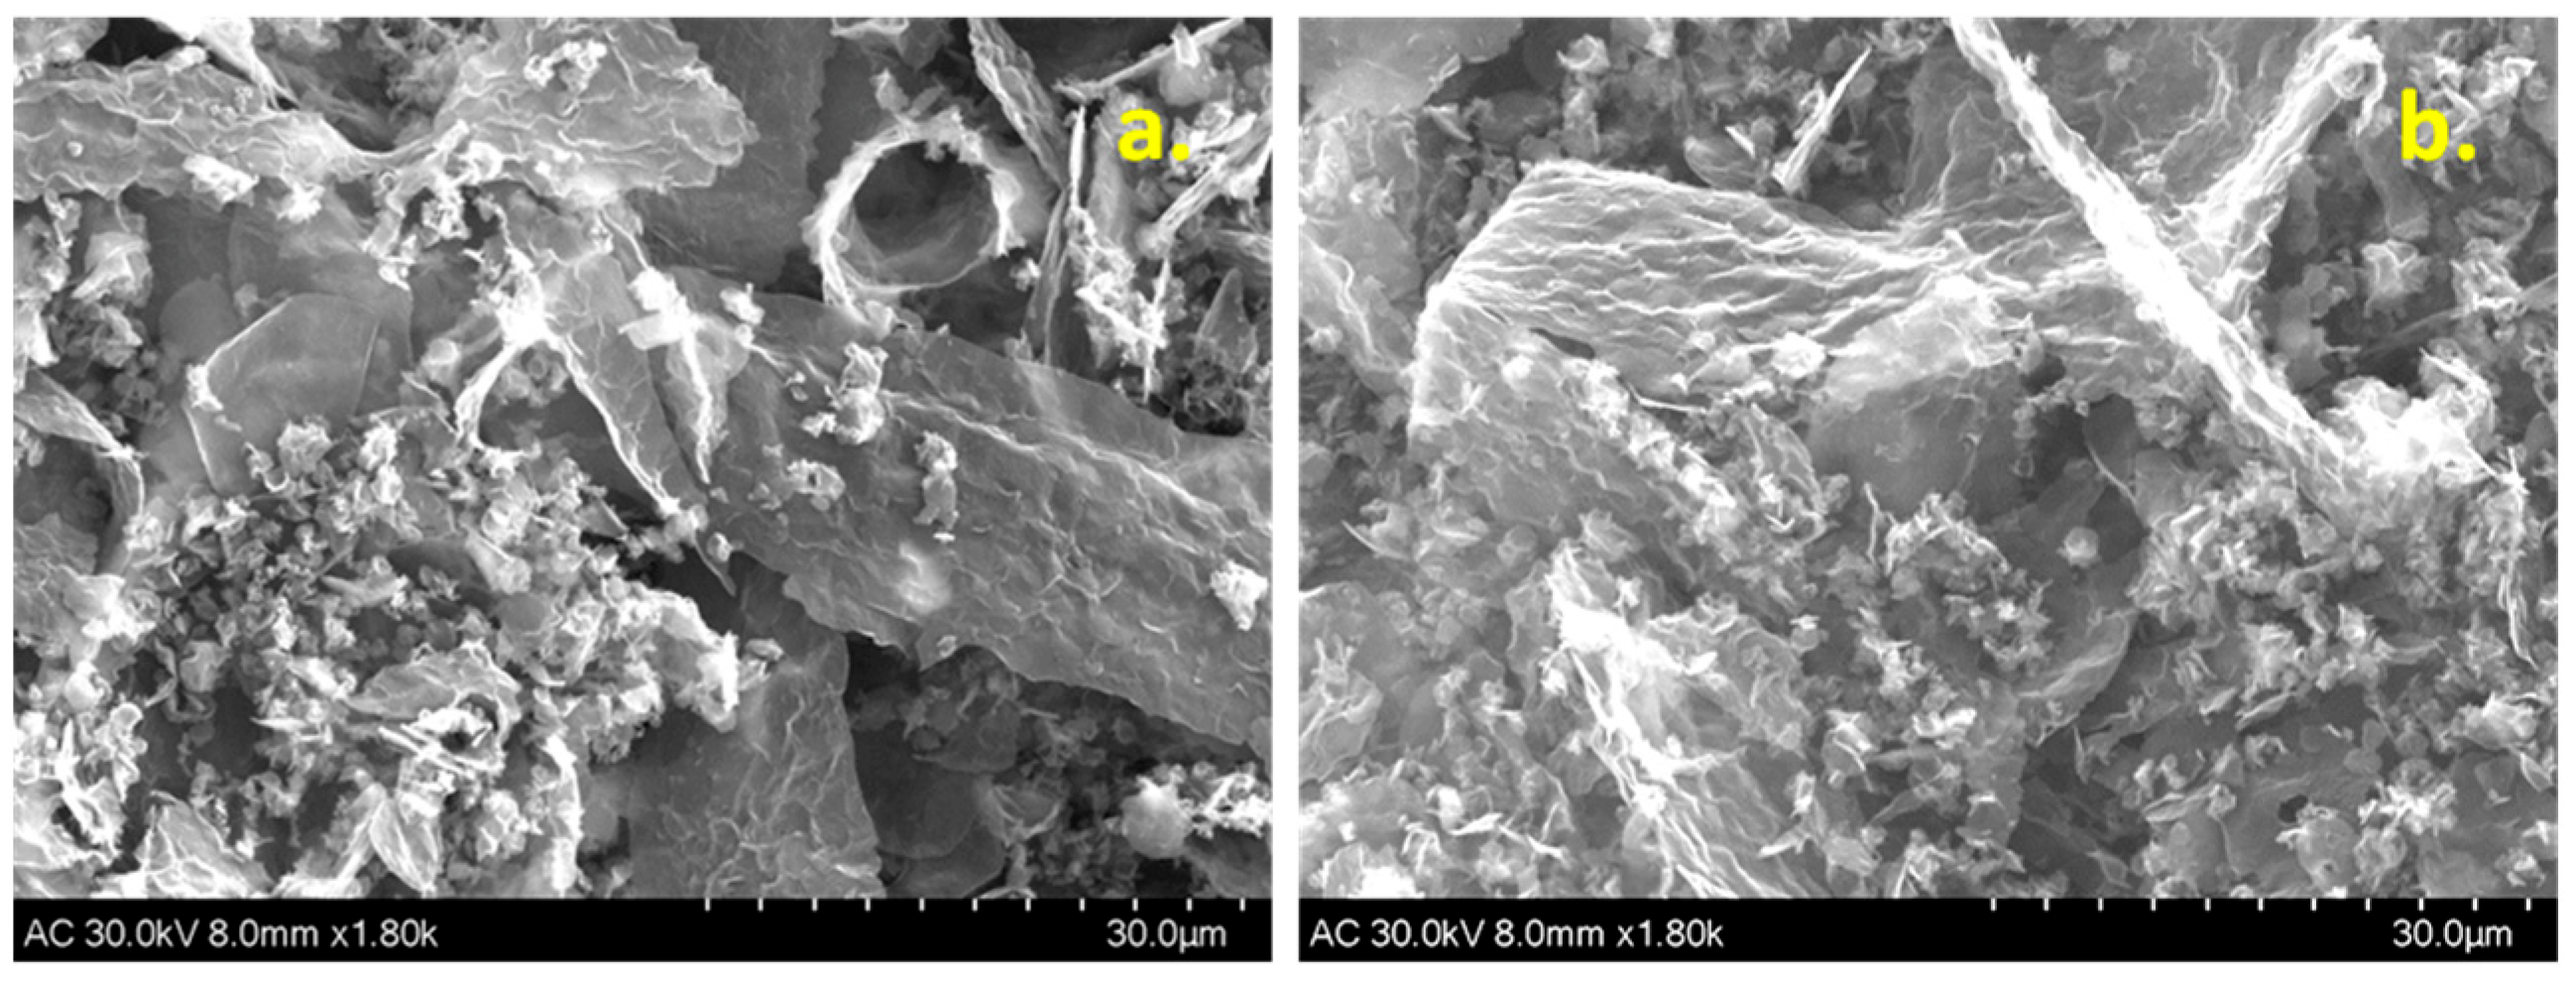
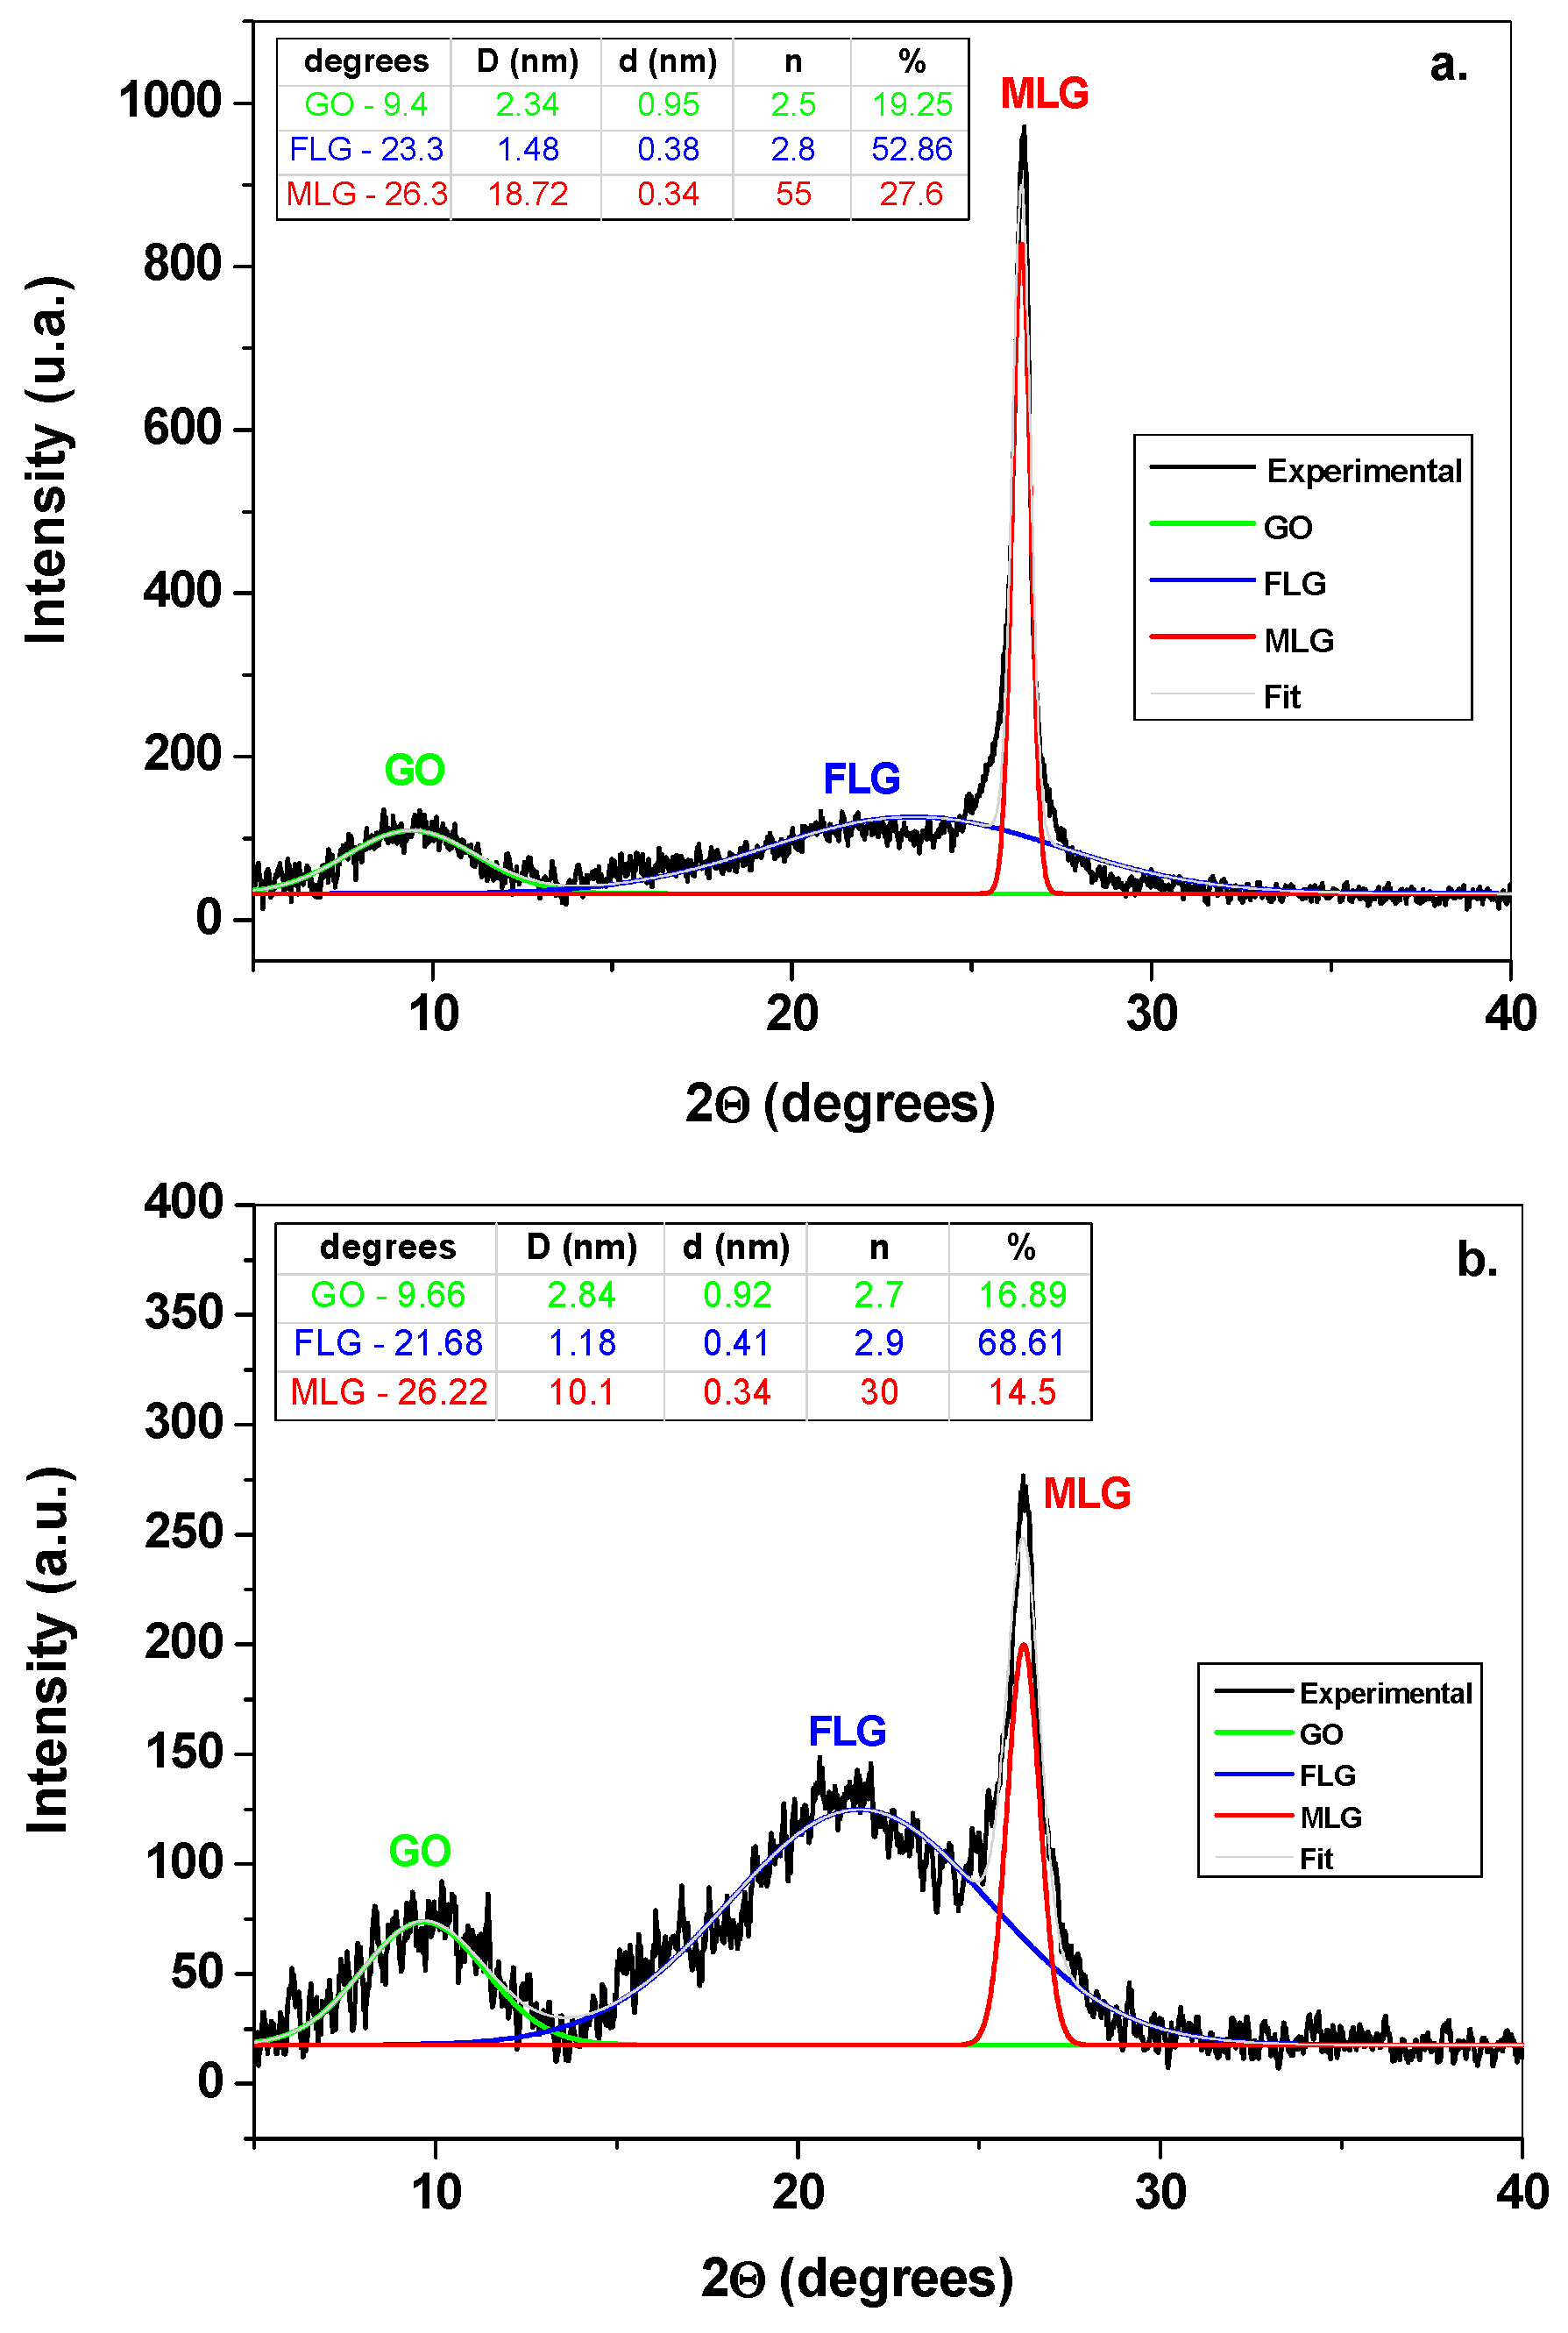
3.1. Morphological and Structural Characterization of Graphene Samples

The morphology of the two samples was investigated by SEM technique. Representative SEM micrographs are shown in Figure 5a,b. In both cases, one can see large planar graphene sheets with the size of the order of micrometers (10–30 µm) along with smaller flakes (<1 µm).
The planar sheets generally have a wavy appearance with the edges as bright lines. Overall, the morphology is highly porous due to the random orientation of the graphene sheets and flakes. The repulsive electrostatic forces between the charges present at the edges or basal planes of the sheets may prevent the regeneration of graphite crystallites. Such forces overcome the π–π stacking interaction that normally occurs between the graphene layers.
Next, the crystallinity of the synthesized materials was investigated by X-ray powder diffraction. The XRD pattern of EGR-1 sample was recorded in the 2θ range of 5–80° and shows the sharp (002) diffraction peak of graphene, at 2θ~26° (multi-layer graphene, MLG) as well as other two broad peaks at 2θ~9° and 2θ~23°, due to graphene oxide (GO) and few-layer graphene (FLG), respectively (Figure 6a).
Scherrer’s equation was employed for estimating the average crystallite size, D, within GO, FLG and MLG (see the inset table). Its value varied from 1.48 nm in FLG to 18.72 nm in MLG, while in GO its value was 2.34 nm. In addition, using the Bragg’s equation we determined the distance, d, between two adjacent graphene layers. By knowing D and d values, the number of graphene layers (n) within the crystallites was easily determined, as being D/d ratio (see the inset table).
As expected, the largest d value (0.95 nm) was found in GO, due to the abundance of oxygen-containing groups and/or network defects. Such defects may be induced by the doping heteroatoms (S, N, and B), which may either replace the carbon atoms in the network or interact electrostatically with the charges associate with carboxyl/carbonyl functional groups. In FLG and MLG, the interlayer distance is smaller (0.38 and 0.34 nm, respectively) indicating that the crystallites have a lower number of oxygen-containing groups and/or network defects. An interesting fact to report is that FLG is predominant within the sample (52.86%), followed by MLG (27.60%) and finally GO (19.25%).
The crystallinity of the second sample, EGR-2, was also investigated and the results are shown in Figure 6b. The first peak (2θ~9°) appears due to the reflections of GO layers, which overlap at an interlayer spacing (d) of about 0.92 nm within the crystallites (D = 2.84 nm) (see the inset table). The second peak (2θ~21°) appears due to the reflections of few-layer graphene, being characterized by an interlayer spacing of 0.41 and 1.18 nm crystallites size. The third peak at 2θ~26° has lower intensity and is characteristic to multi-layer graphene, with d = 0.34 nm and D = 10.1 nm. According to the above results, the EGR-2 sample consists of 68.61% few-layer graphene, 16.89% graphene oxide and 14.5% multi-layer graphene.

3.2. Performance Characteristics

The limits of determination for MSH6, PMS2 and KRAS were lower when the sensor based on MD/EGR-2 was utilized, with the exception of the assay of MLH1 and MSH2 (Table 1). While the limits of determination for the assay of MSH2 were unaffected by the kind of matrix utilized in the construction of the two sensors, a lower limit of determination was obtained for the assay of MLH1 using the sensor based on MD/EGR-1. The highest sensitivity was reported when the sensor based on MD/EGR-2 was used for all other biomarkers, with the exception of the MLH1 assay, for which the sensor based on MD/EGR-1 was employed.
The working concentration ranges were broad enough to accommodate both healthy individuals and people with various stages of colon or stomach cancer. Different values for the biomarkers suggest that they can be found in biological samples simultaneously. The sensors that would be used to measure MSH6, MLH1, MSH2, PMS2 and KRAS in biological samples (whole blood, saliva, urine and tumoral tissue) were calibrated, and the results showed no significant differences in the signatures of the biomarkers, working concentration ranges, limits of determination or the sensitivity of the a and b parameters from the equation of calibration. This demonstrated once more that the complexity of the matrix used to identify these analytes has no bearing on the values when stochastic sensors are calibrated.
Comparing with ELISA commercial kits used for the assay of MLH1 (working concentration range 0.16–10 ng mL−1), MSH2 (working concentration range 78–5000 pg mL−1), MSH6 (working concentration range 0.16–10 ng mL−1), PMS2 (working concentration range 0.16–10 ng mL−1) and KRAS (working concentration range 0.31–20 ng mL−1), for the assay of MLH1, MSH2, MSH6 and PMS2 wider linear concentration ranges as well as lower limits of determination were achieved when the stochastic sensors were used.
For the assay of KRAS, the stochastic sensors were used in wider linear concentration ranges placed on higher concentrations but with immediate application for whole blood samples, because all values determined were in the working concentration range of the stochastic sensors. Further, the ELISA kits were able to determine only one specific biomarker, while the stochastic sensors were able to determine simultaneously all five biomarkers. Lower limits of determination were also reported for the assay of KRAS using stochastic sensors (of fg mL−1 magnitude order) [19] and for the method developed by Macchia et al. [18] (1.3 × 10⁻²⁰ mol L−1).

3.3. Reproducibility and Stability of the Stochastic Sensors

Studies on reproducibility were performed for each sensor. In this regard, 10 of each type of sensor were produced using the process described in the sensor design paragraph. Each sensor was assessed in the same way, and the sensitivities were determined and compared when submerged in solutions of pH 7.40 for KRAS, MLH1, MSH2, PMS2 and MSH6. The RSD (%) values for the sensitivities were 0.12% for KRAS, 0.20% for MLH1, 0.15% for MSH2, 0.11% for PMS2 and 0.10% for MSH6. The sensitivities’ RSD (%) values provided evidence of the sensors’ design’s reproducibility.
The stability of each sensor was evaluated as follows: as outlined in the section on stochastic sensor design, 20 sensors of each type were stored. Every day, a new sensor was taken from storage and immersed in solutions containing PMS2, MSH2, MSH6, KRAS and MLH1 at varied concentrations at pH 7.40; the sensitivities of each measurement were recorded for comparison after 30 days, when the entire lot of sensors has been used. The end-of-period results indicated a high stability of the electrodes over time, as the change of the sensitivities over time was as follows: 0.07% for MD/EGR-1 and 0.05% for MD/EGR-2.

3.4. Selectivity

The recorded toff values for various potential interferents provide an indication of the selectivity of the two proposed stochastic sensors. As potential interferents, CA19-9, p53, glutamine and CA72-4 were examined. Given that the chosen chemicals’ signatures differ from those of the relevant biomarkers, Table 2 demonstrates that none of them interfere with the identification of MLH1, MSH2, MSH6, PMS2 and KRAS.

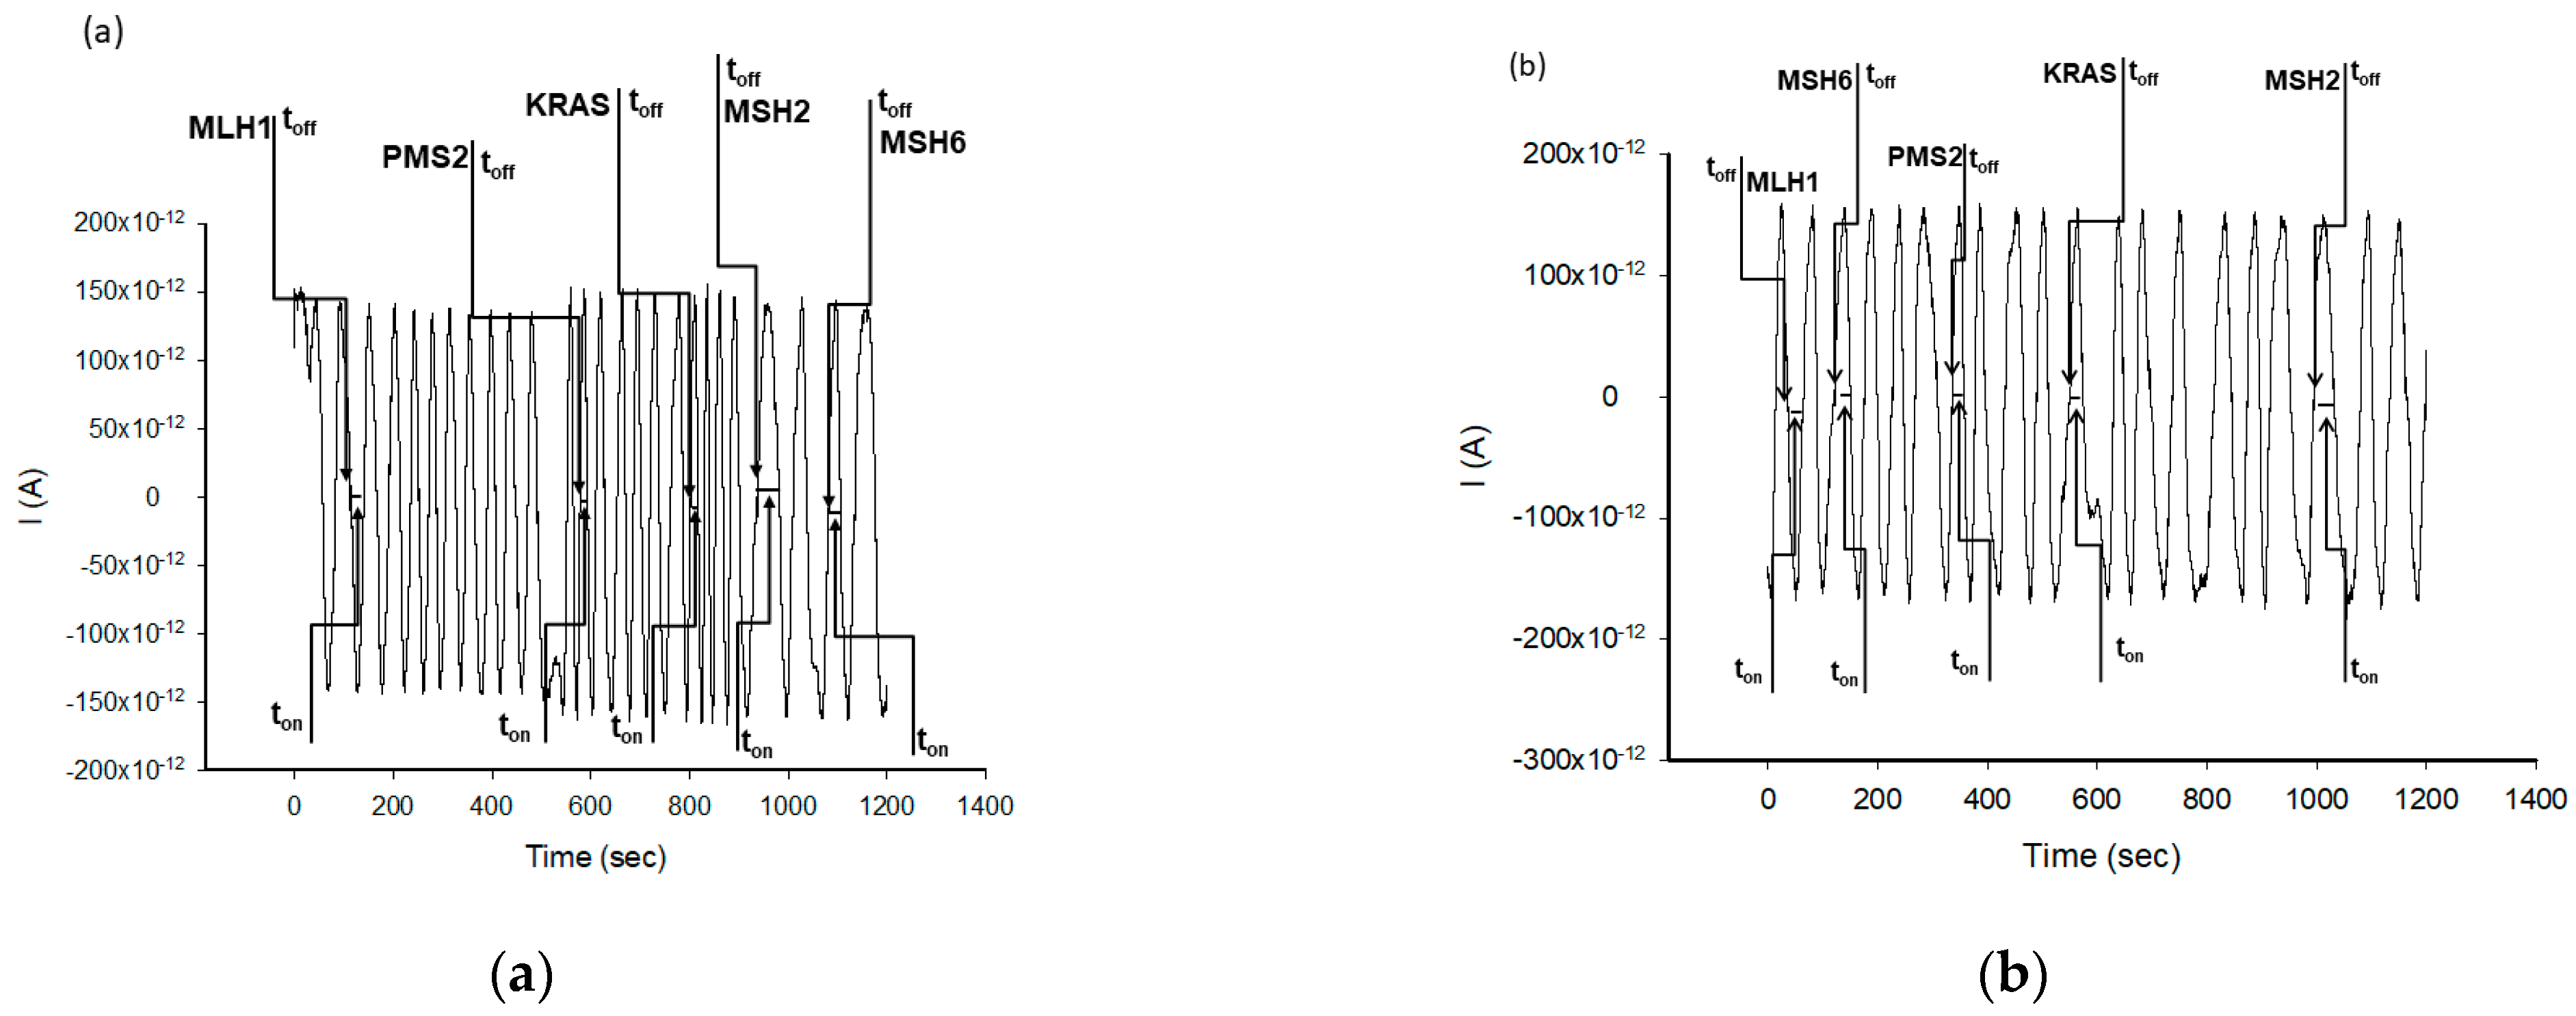
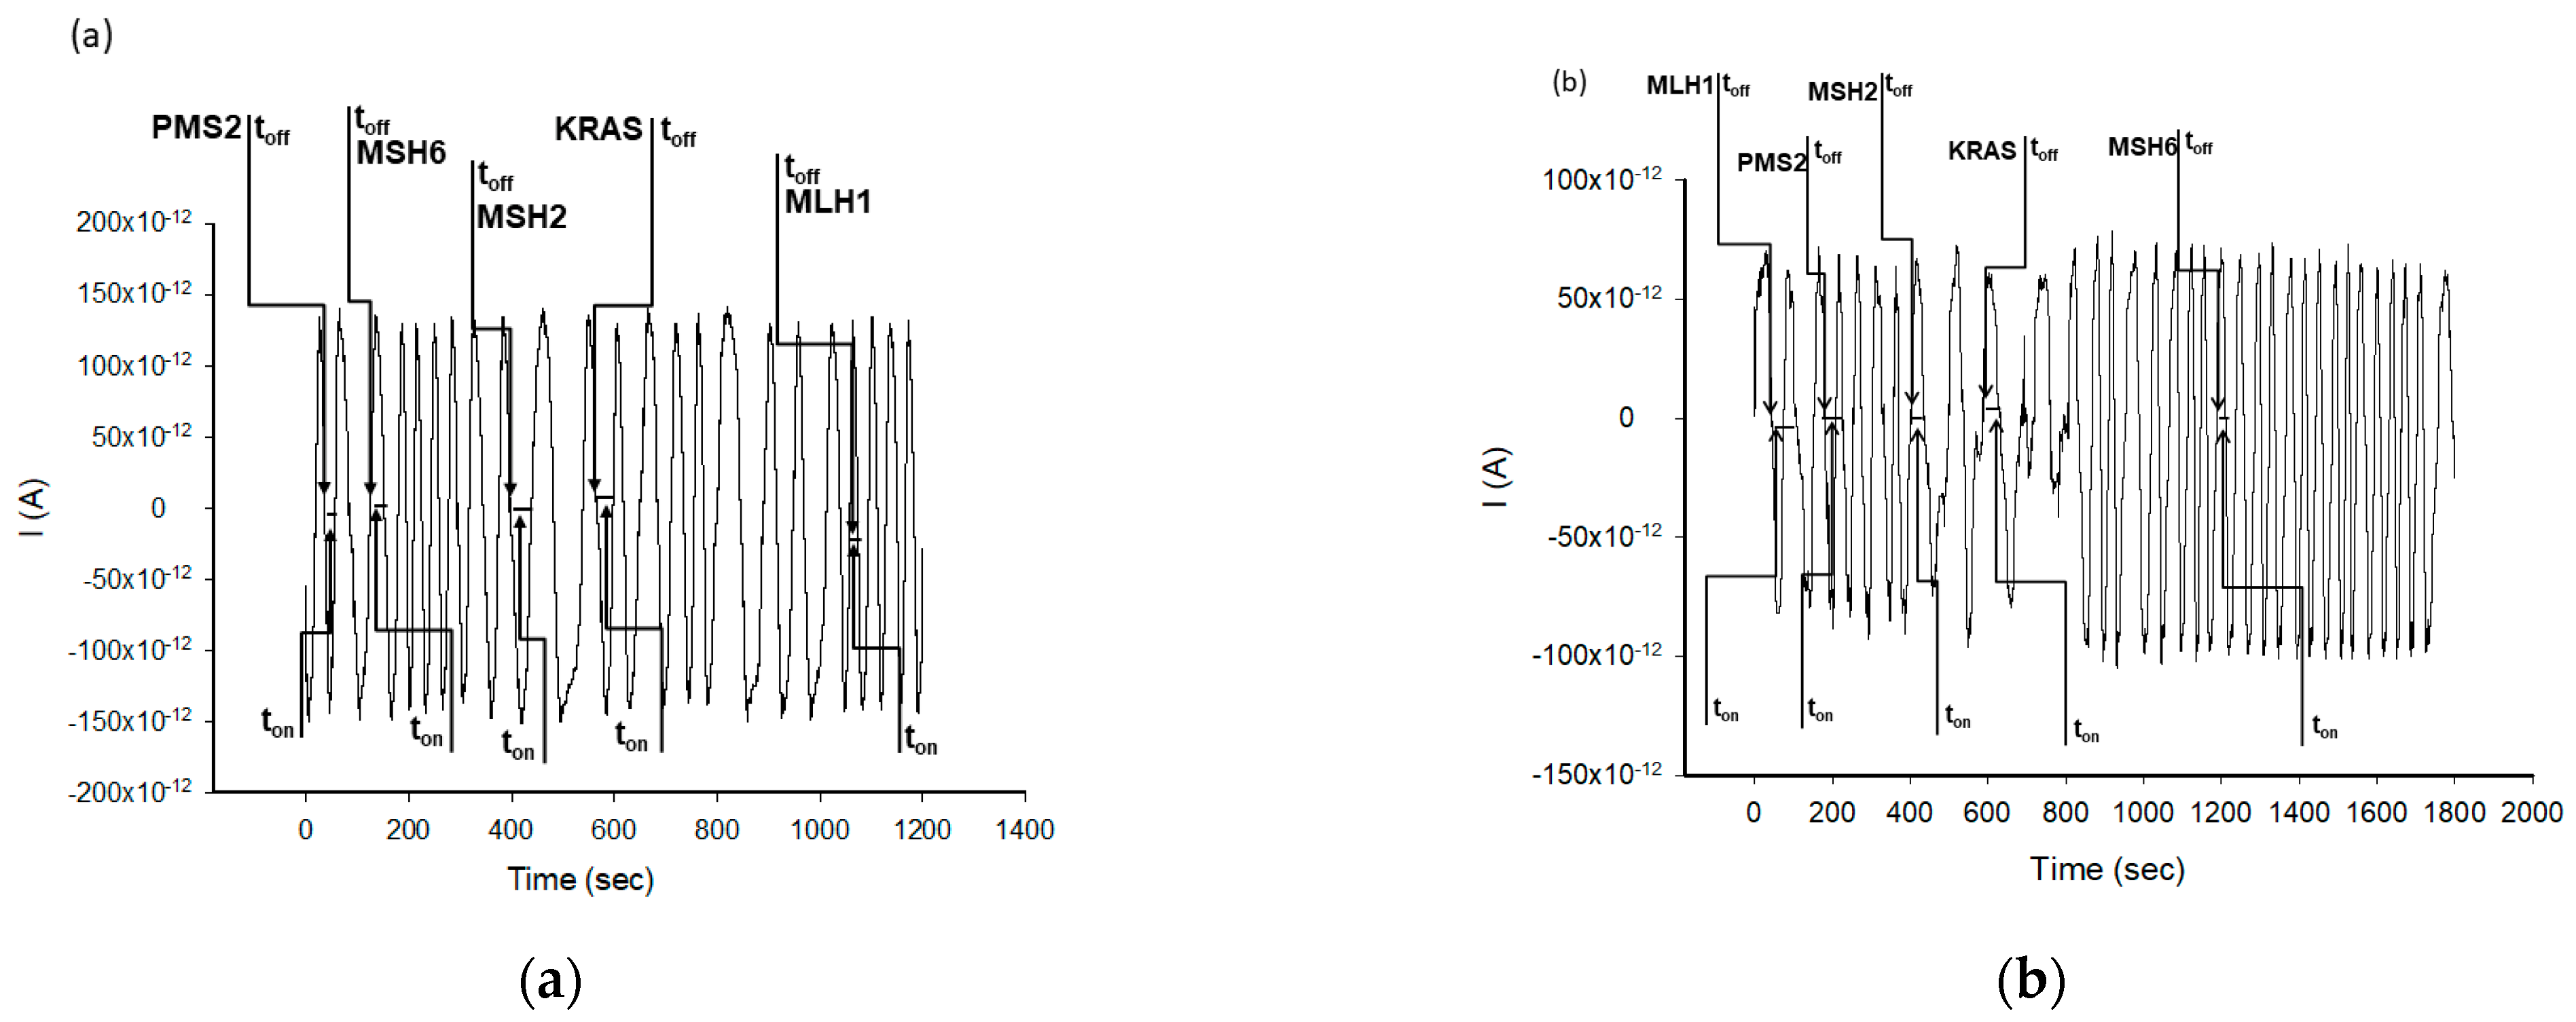
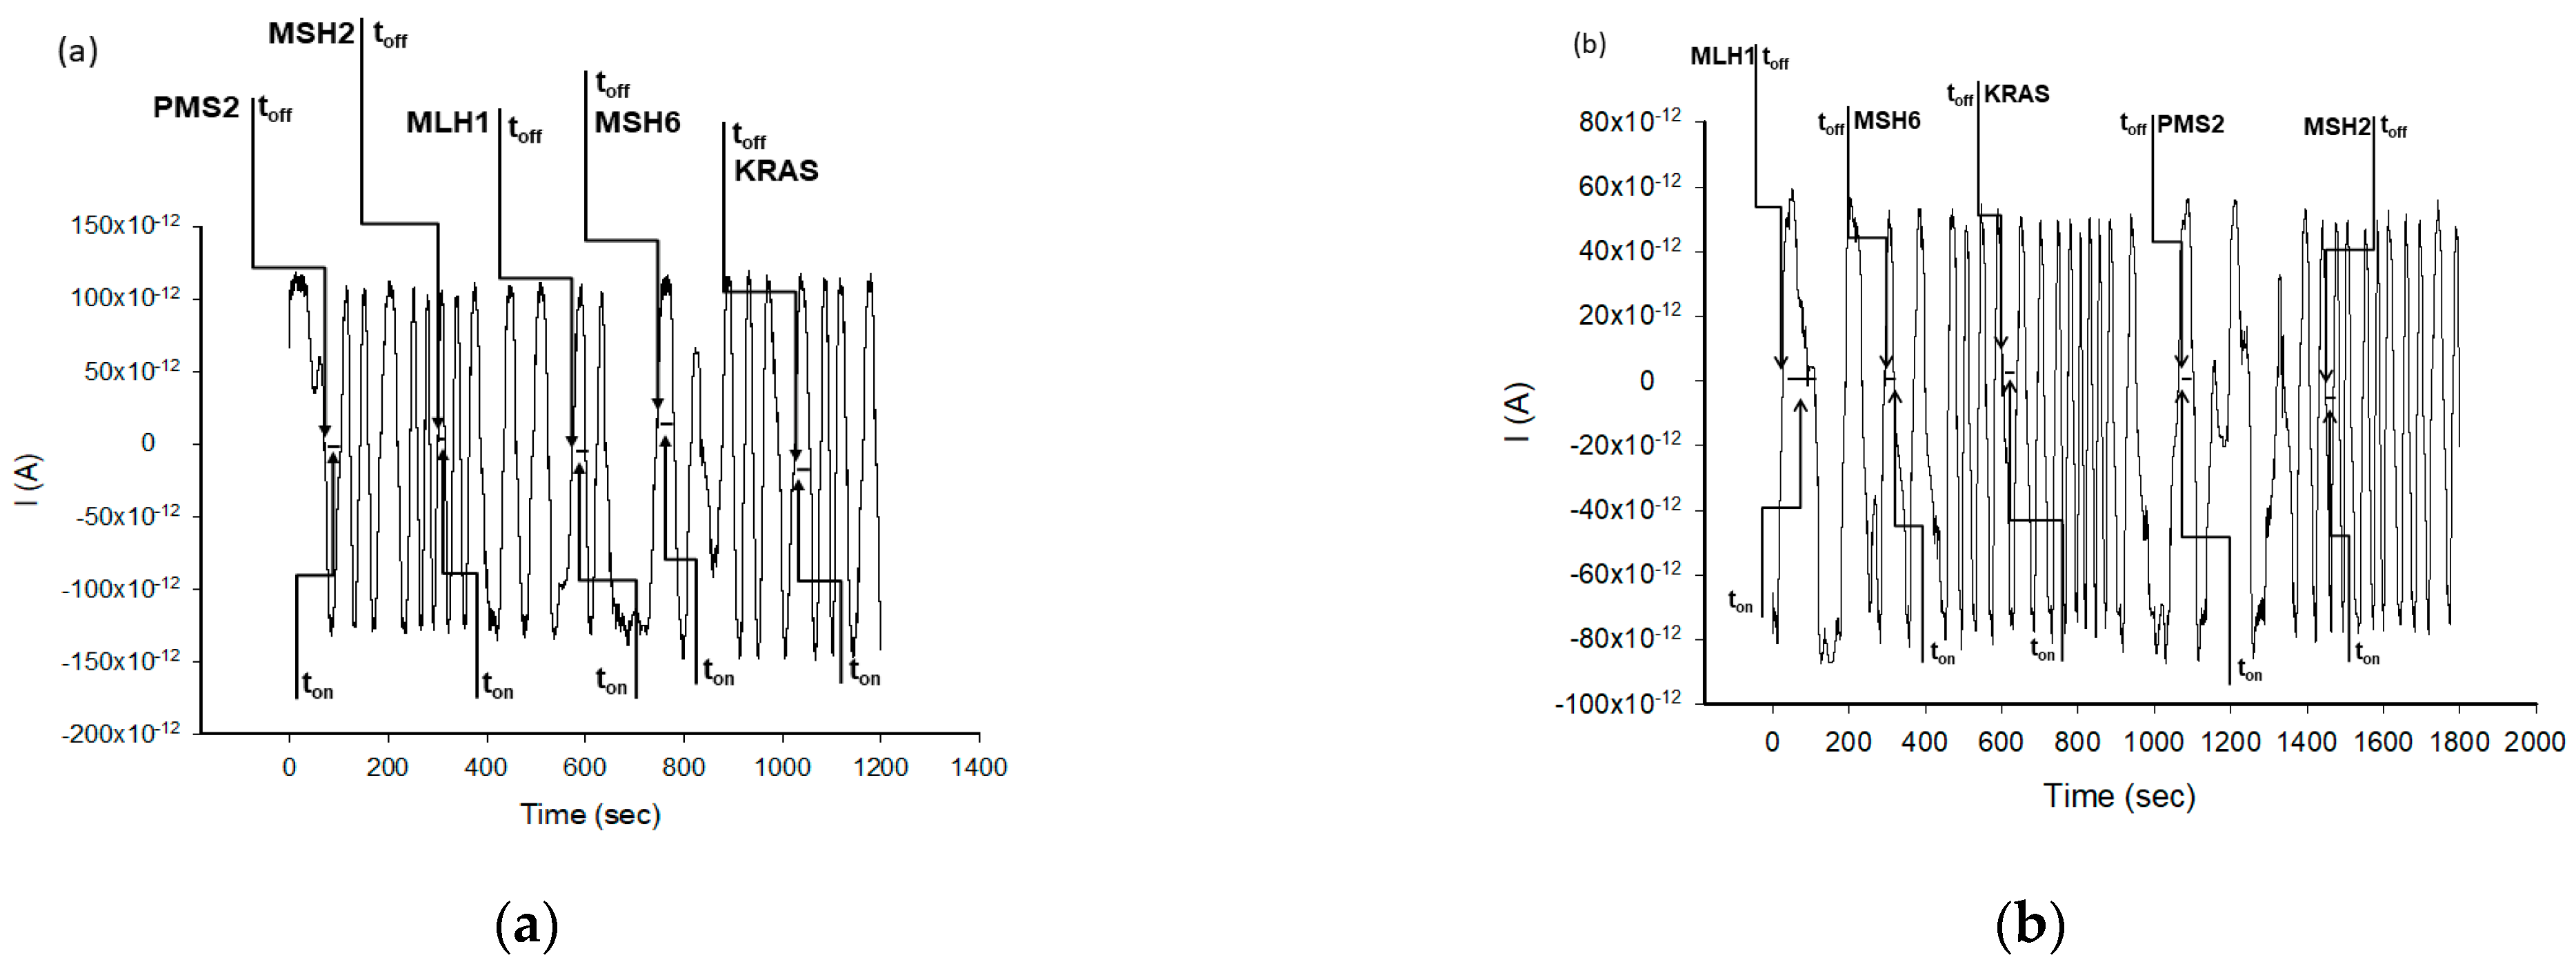
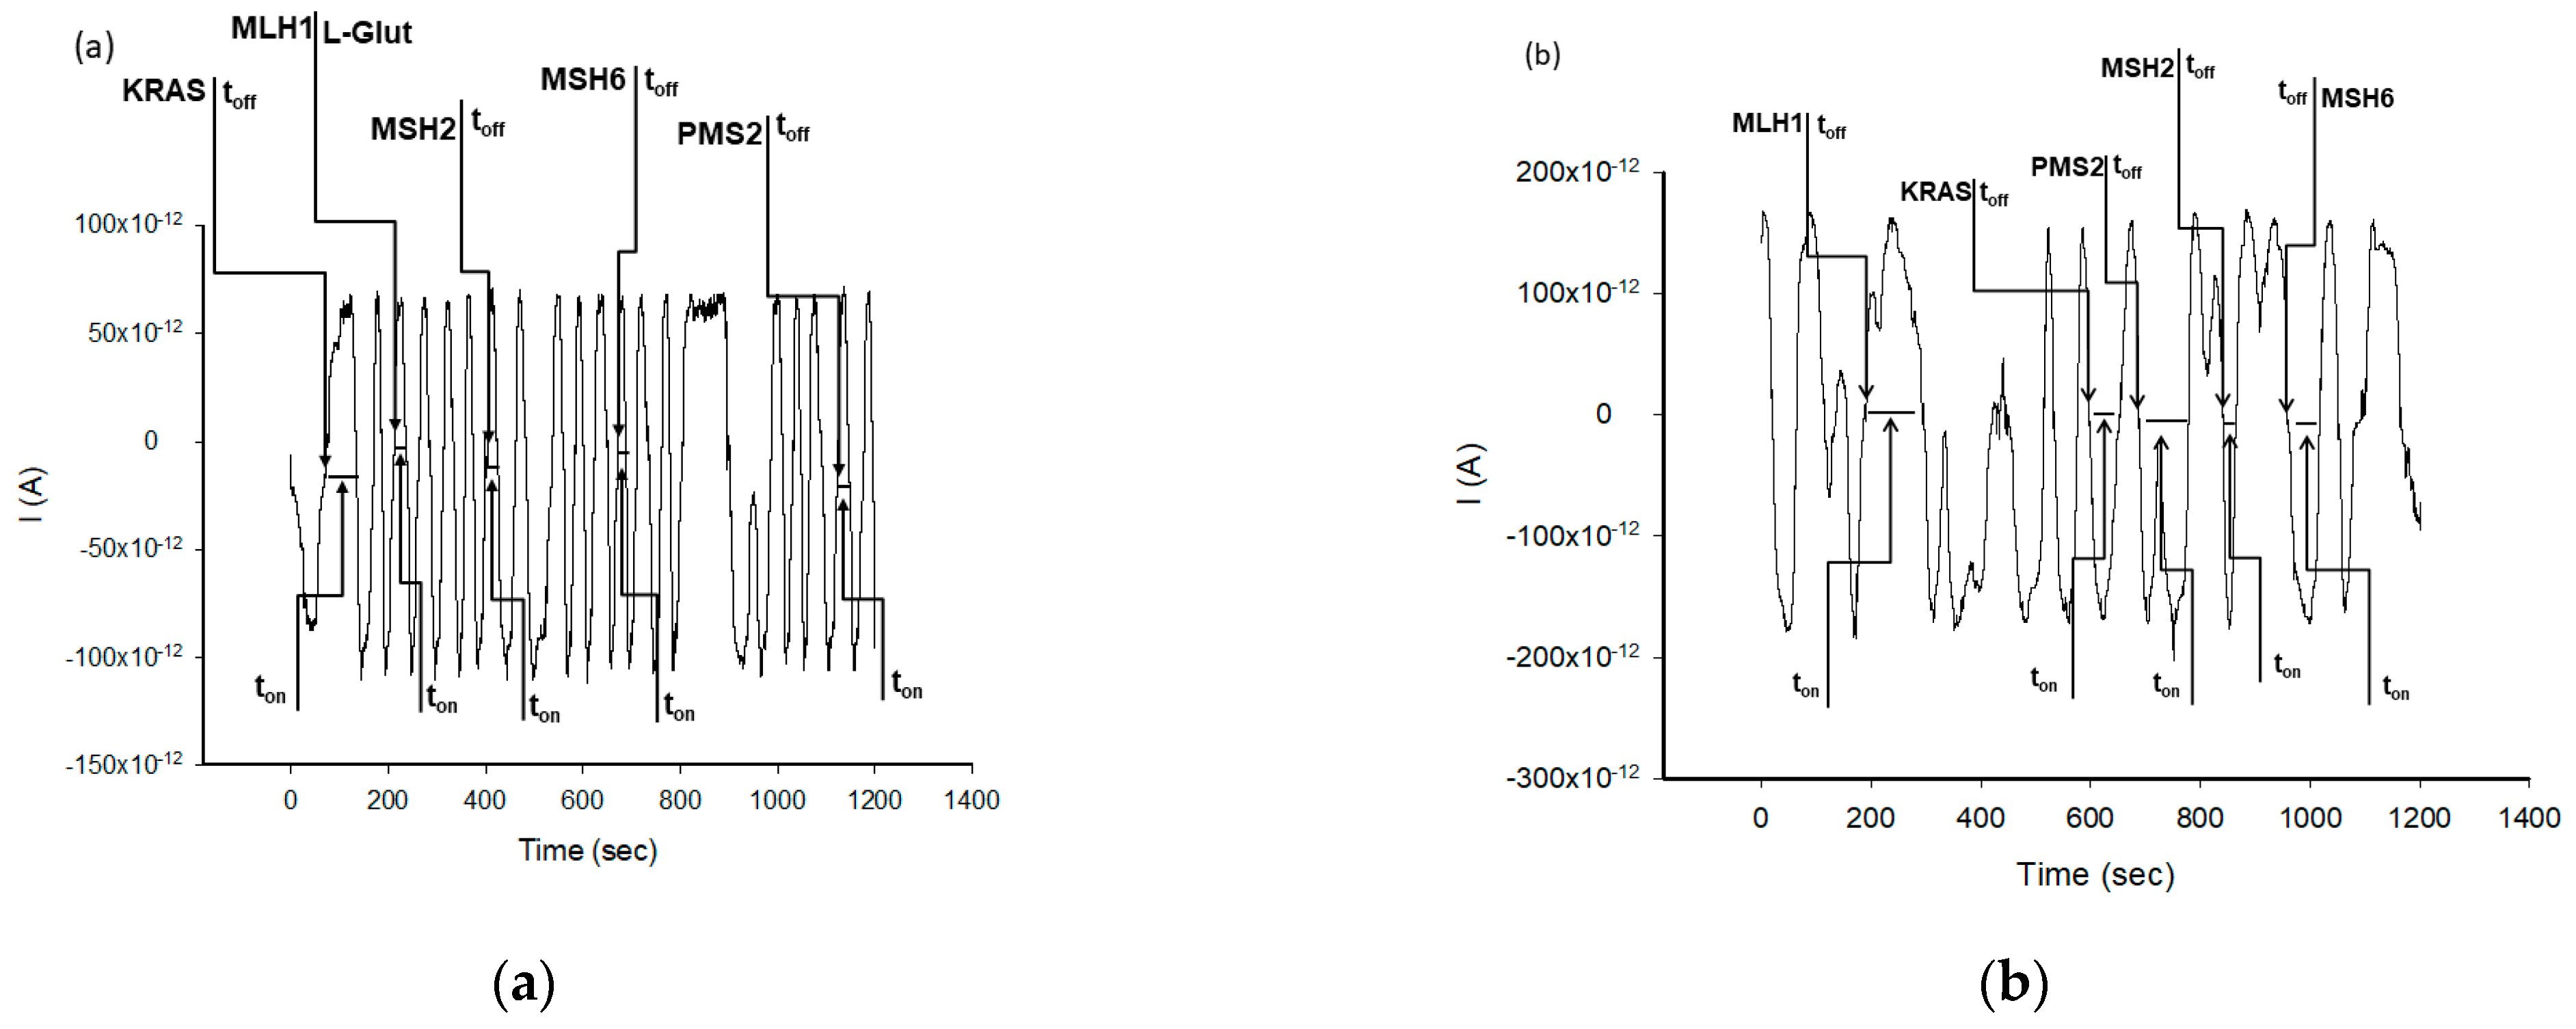
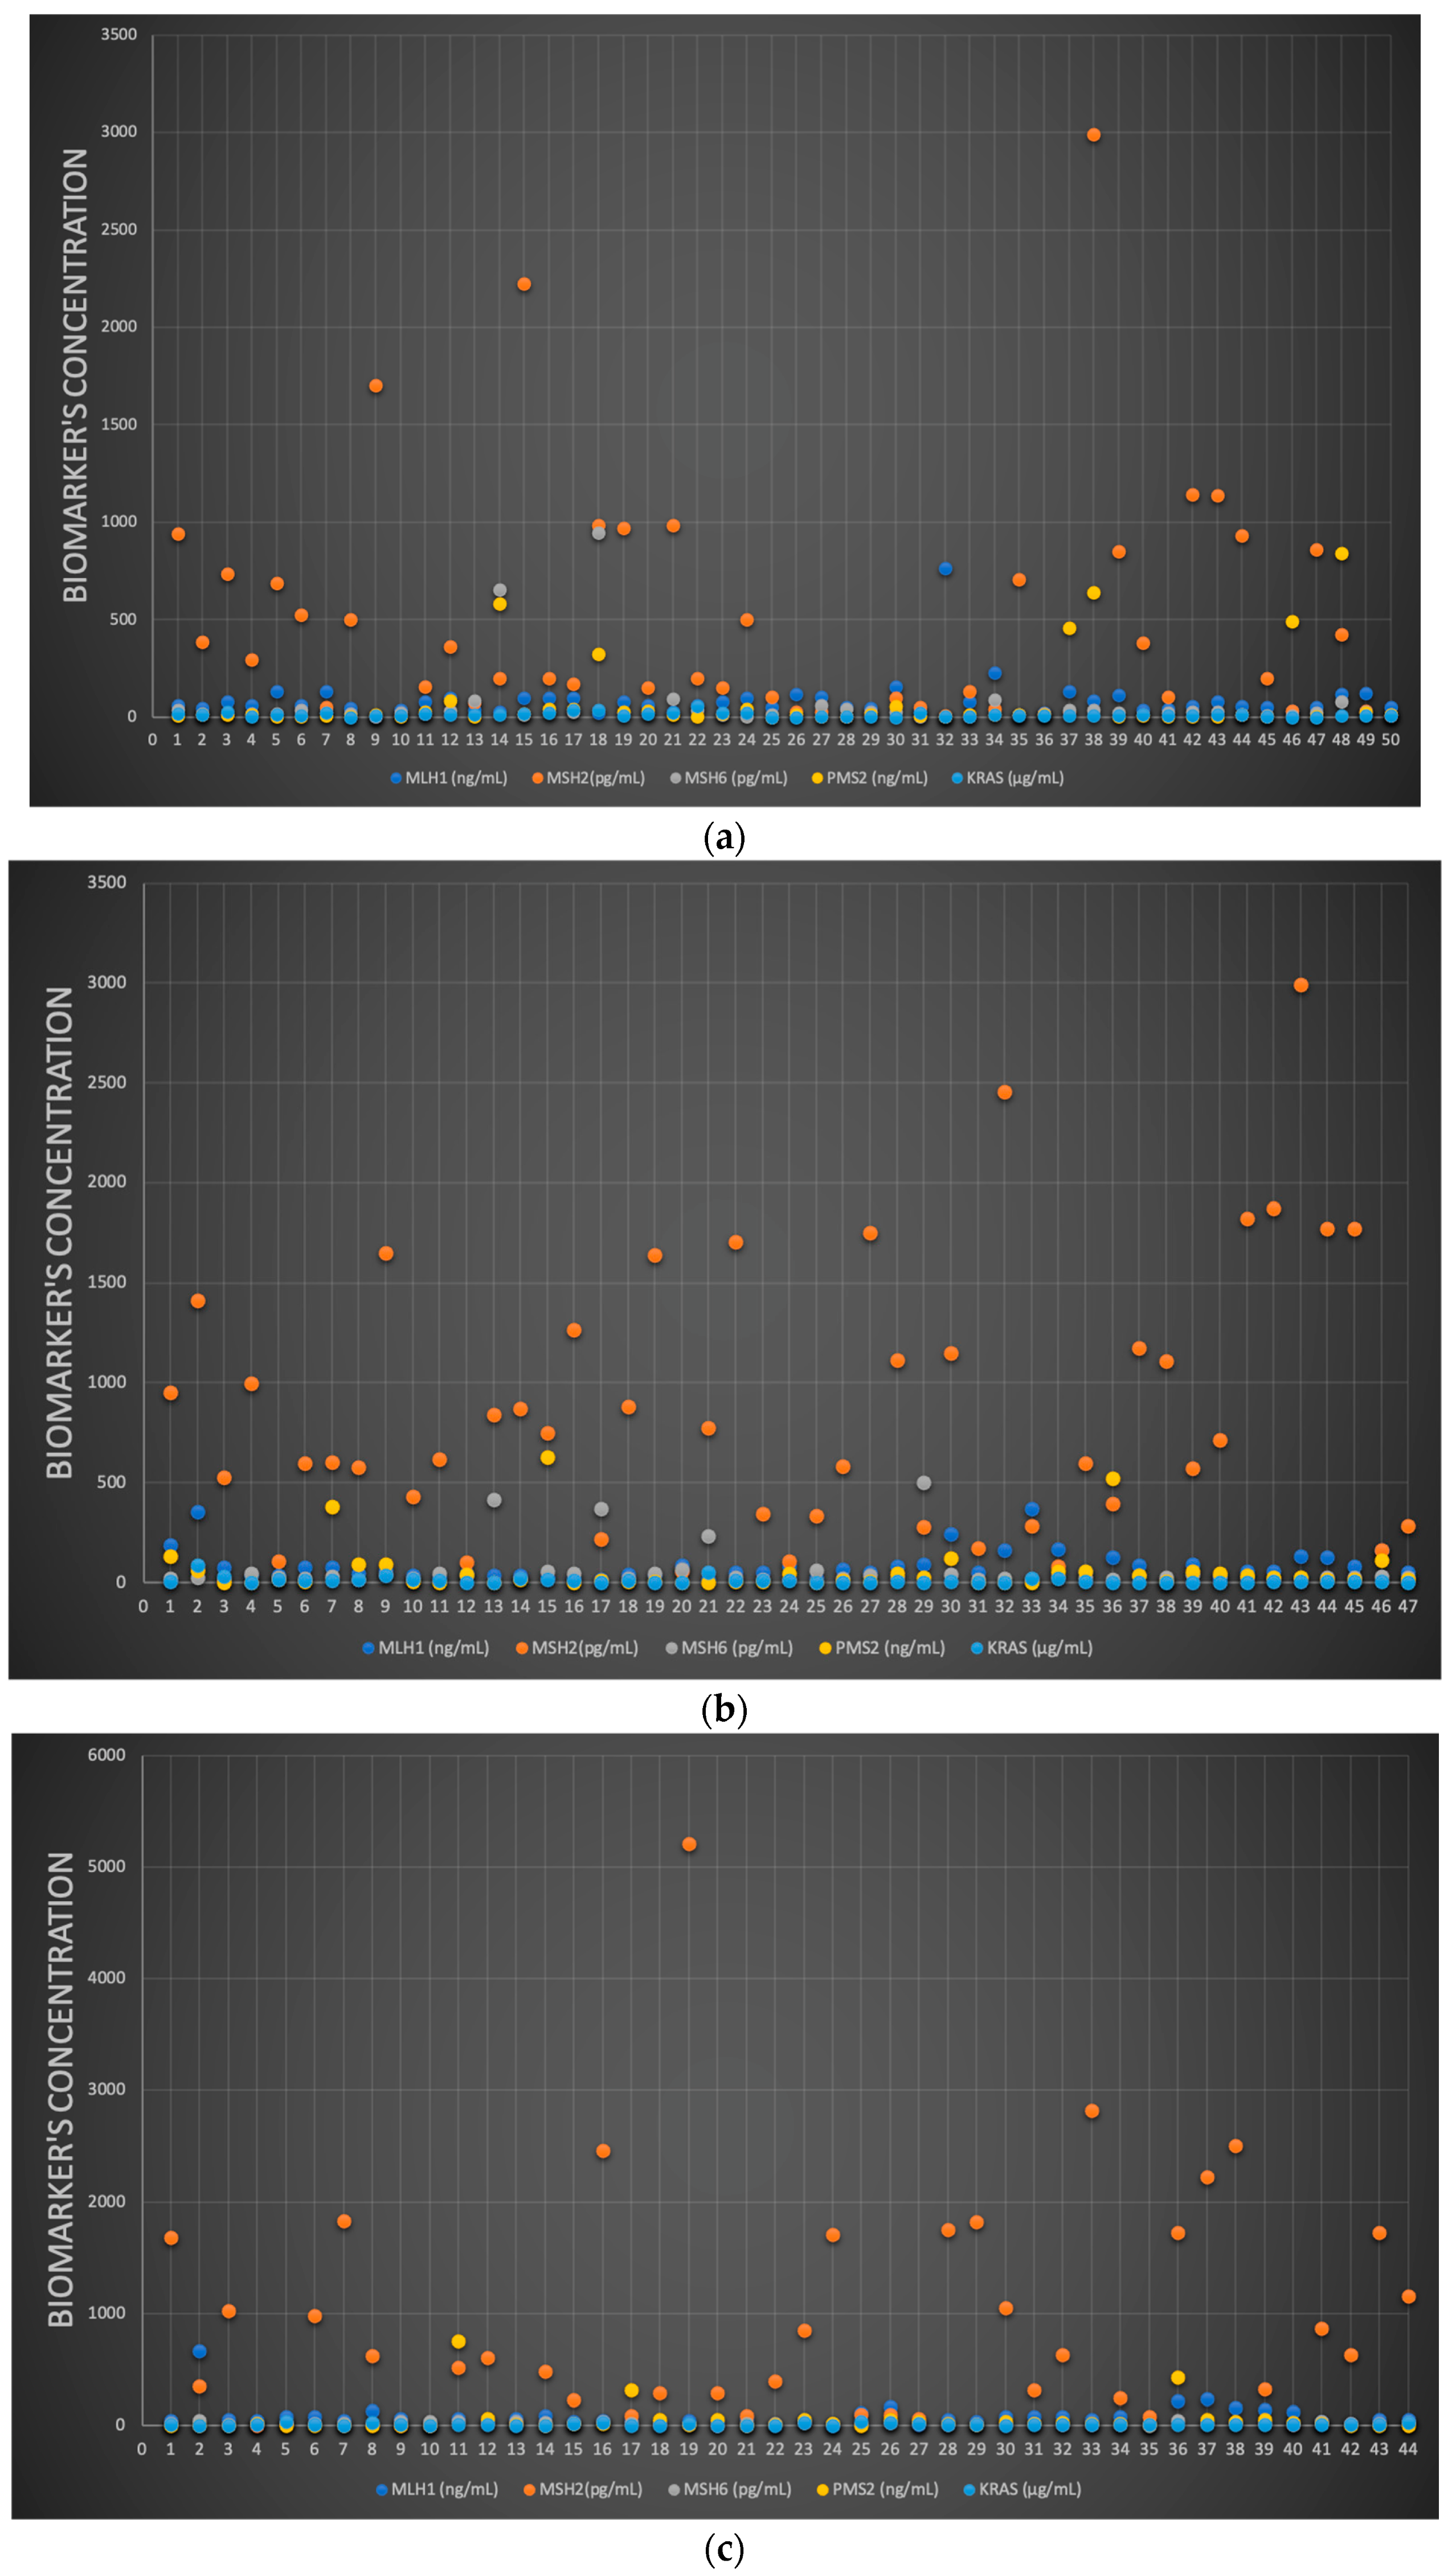
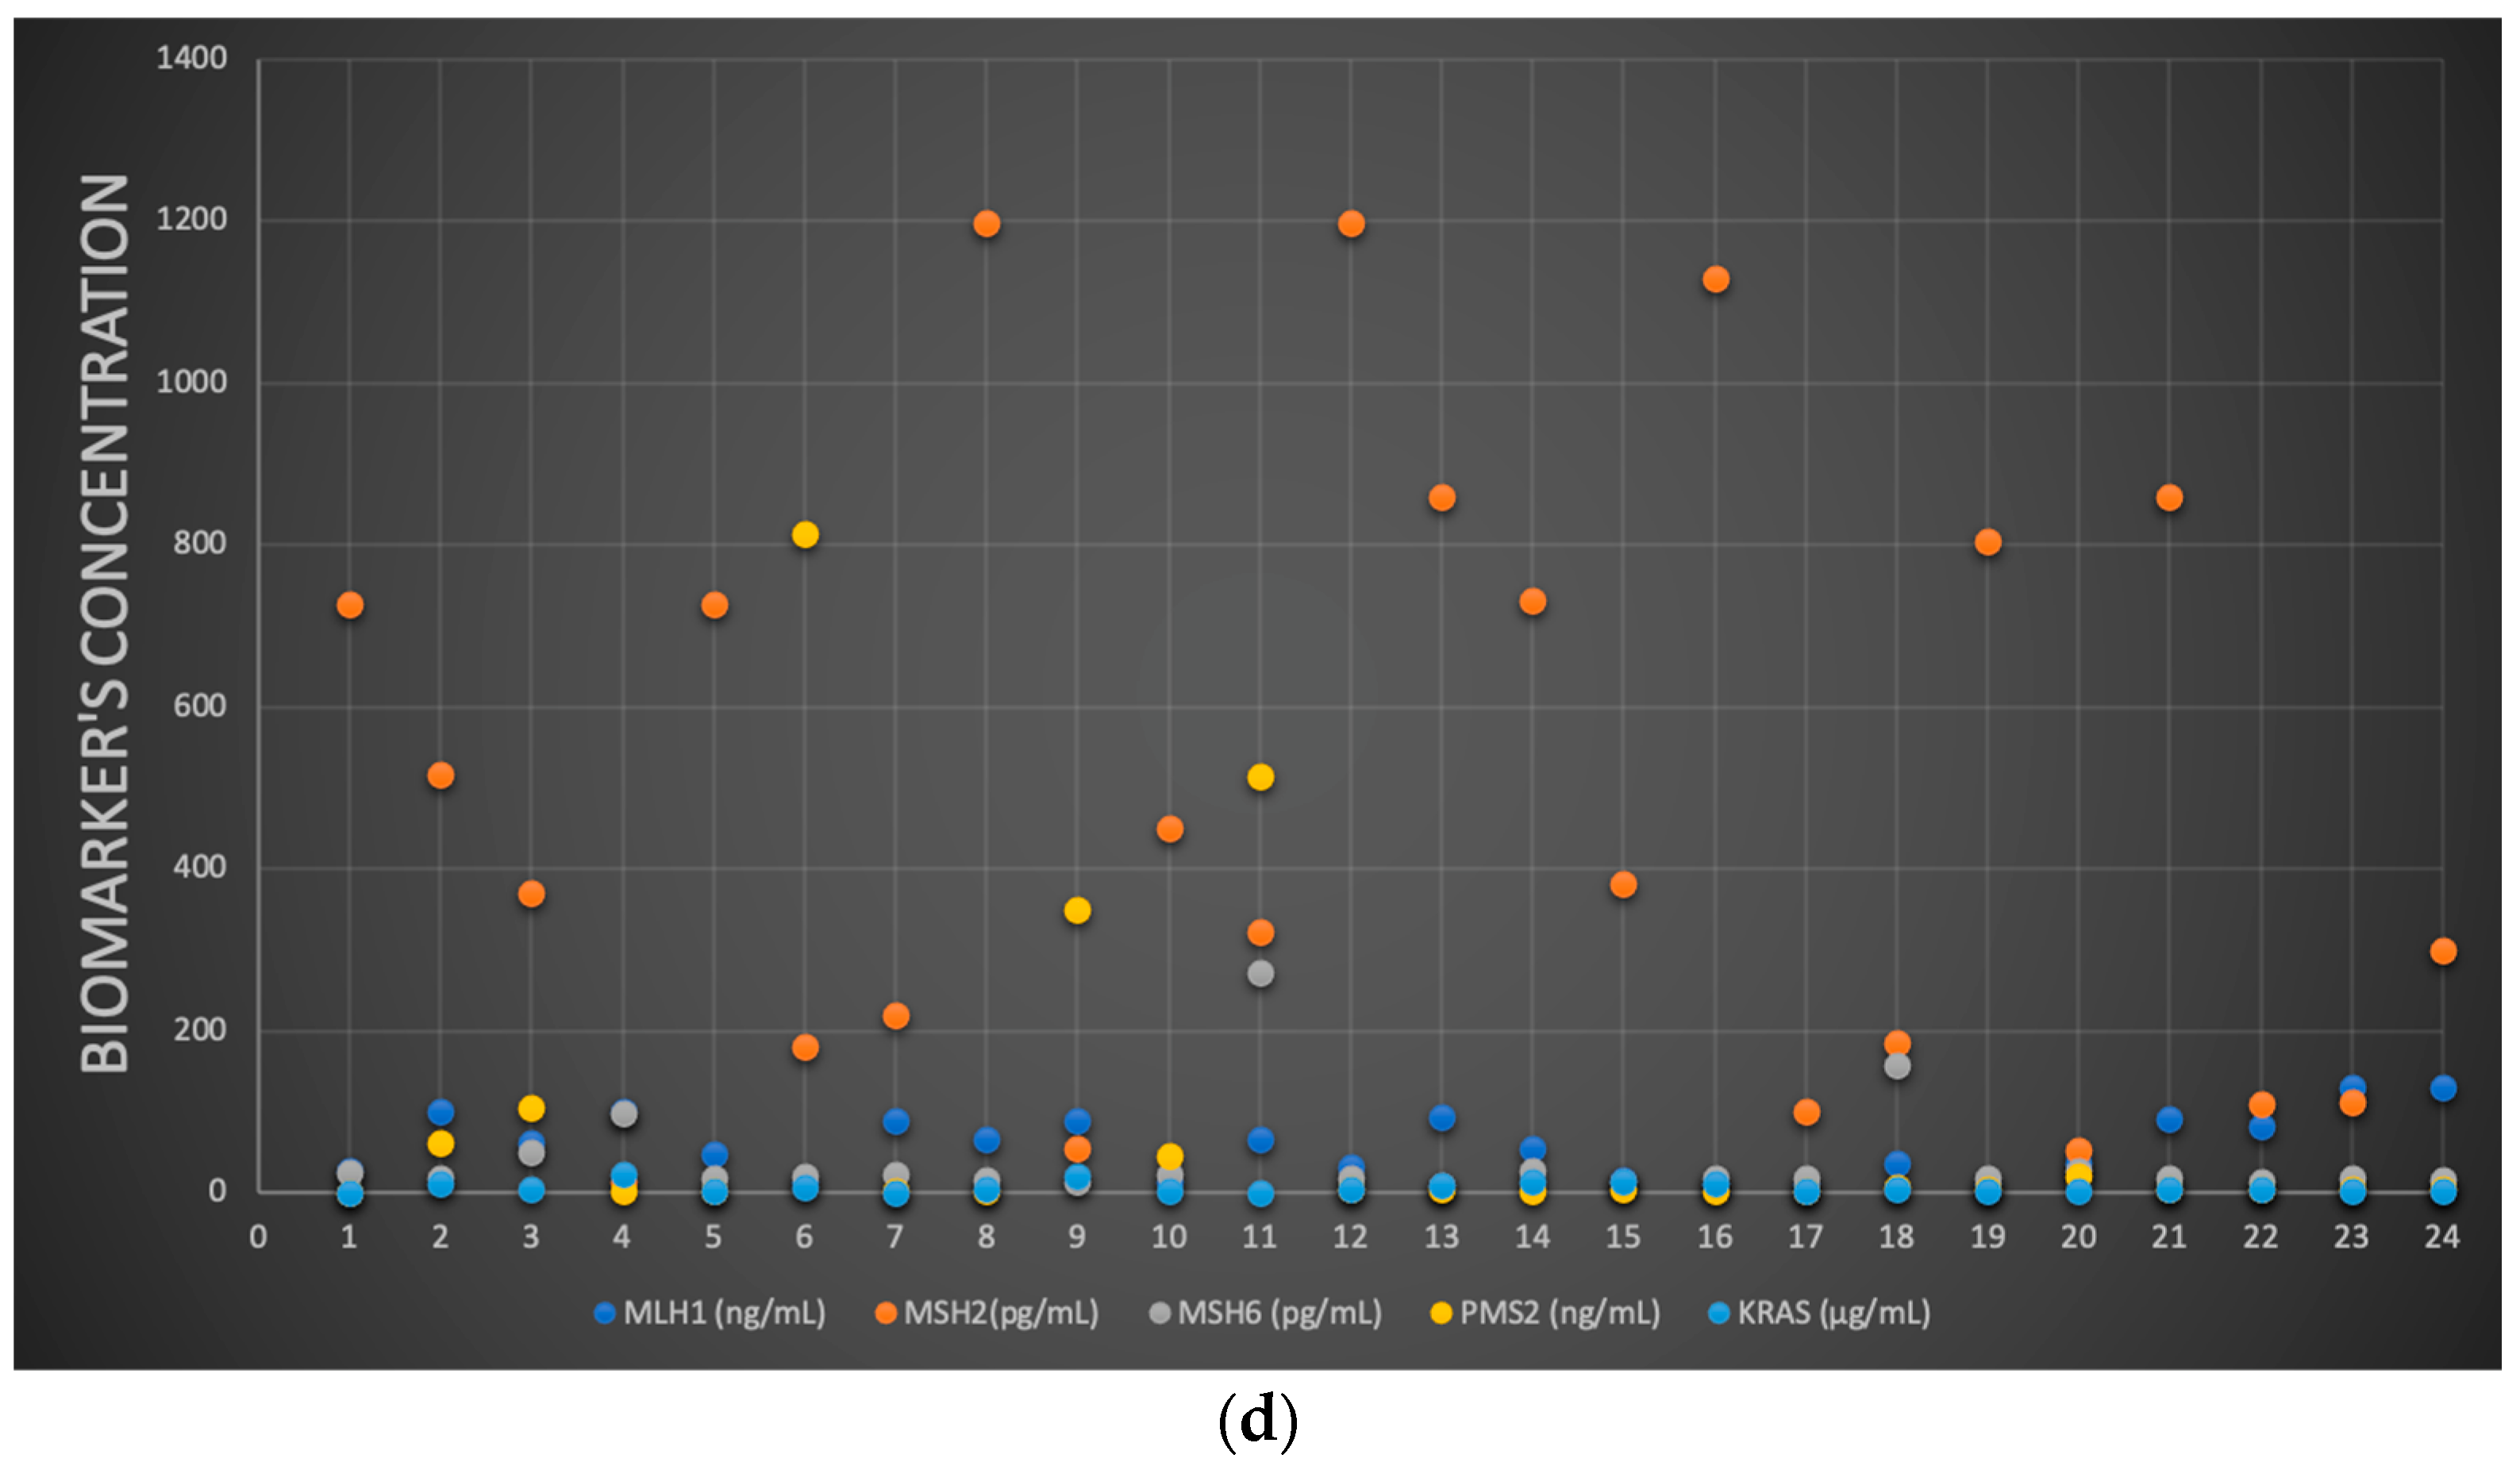
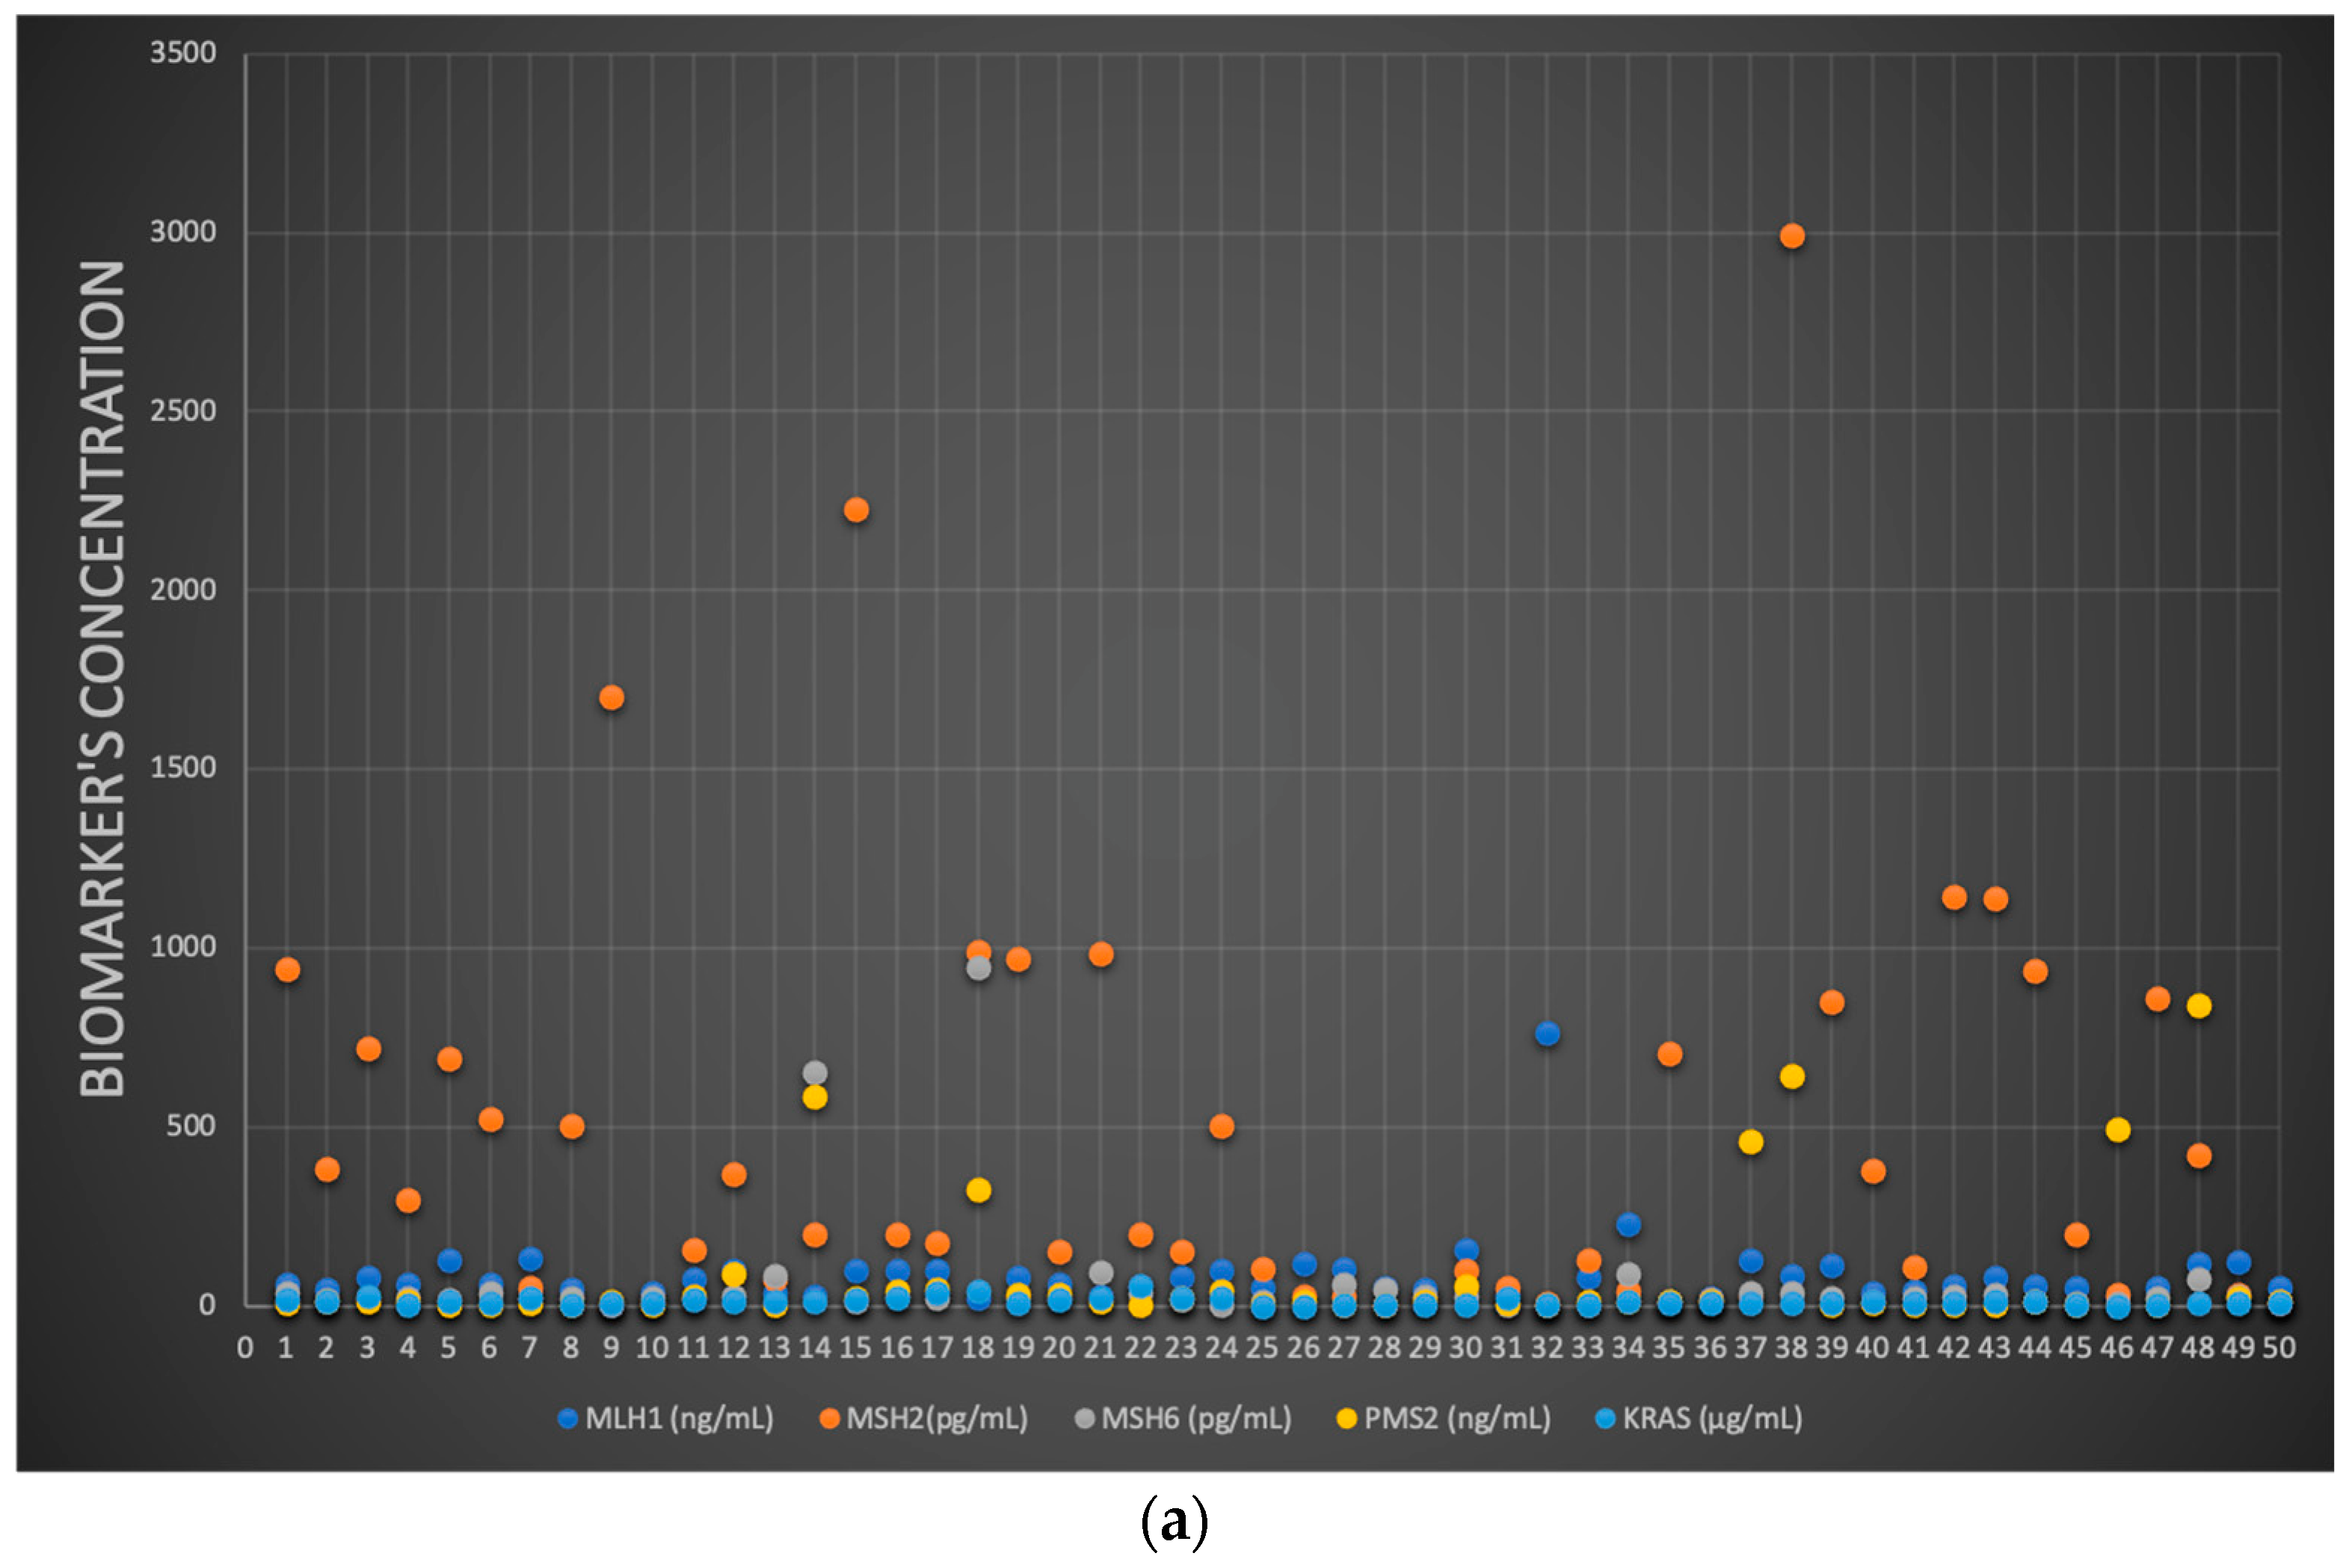
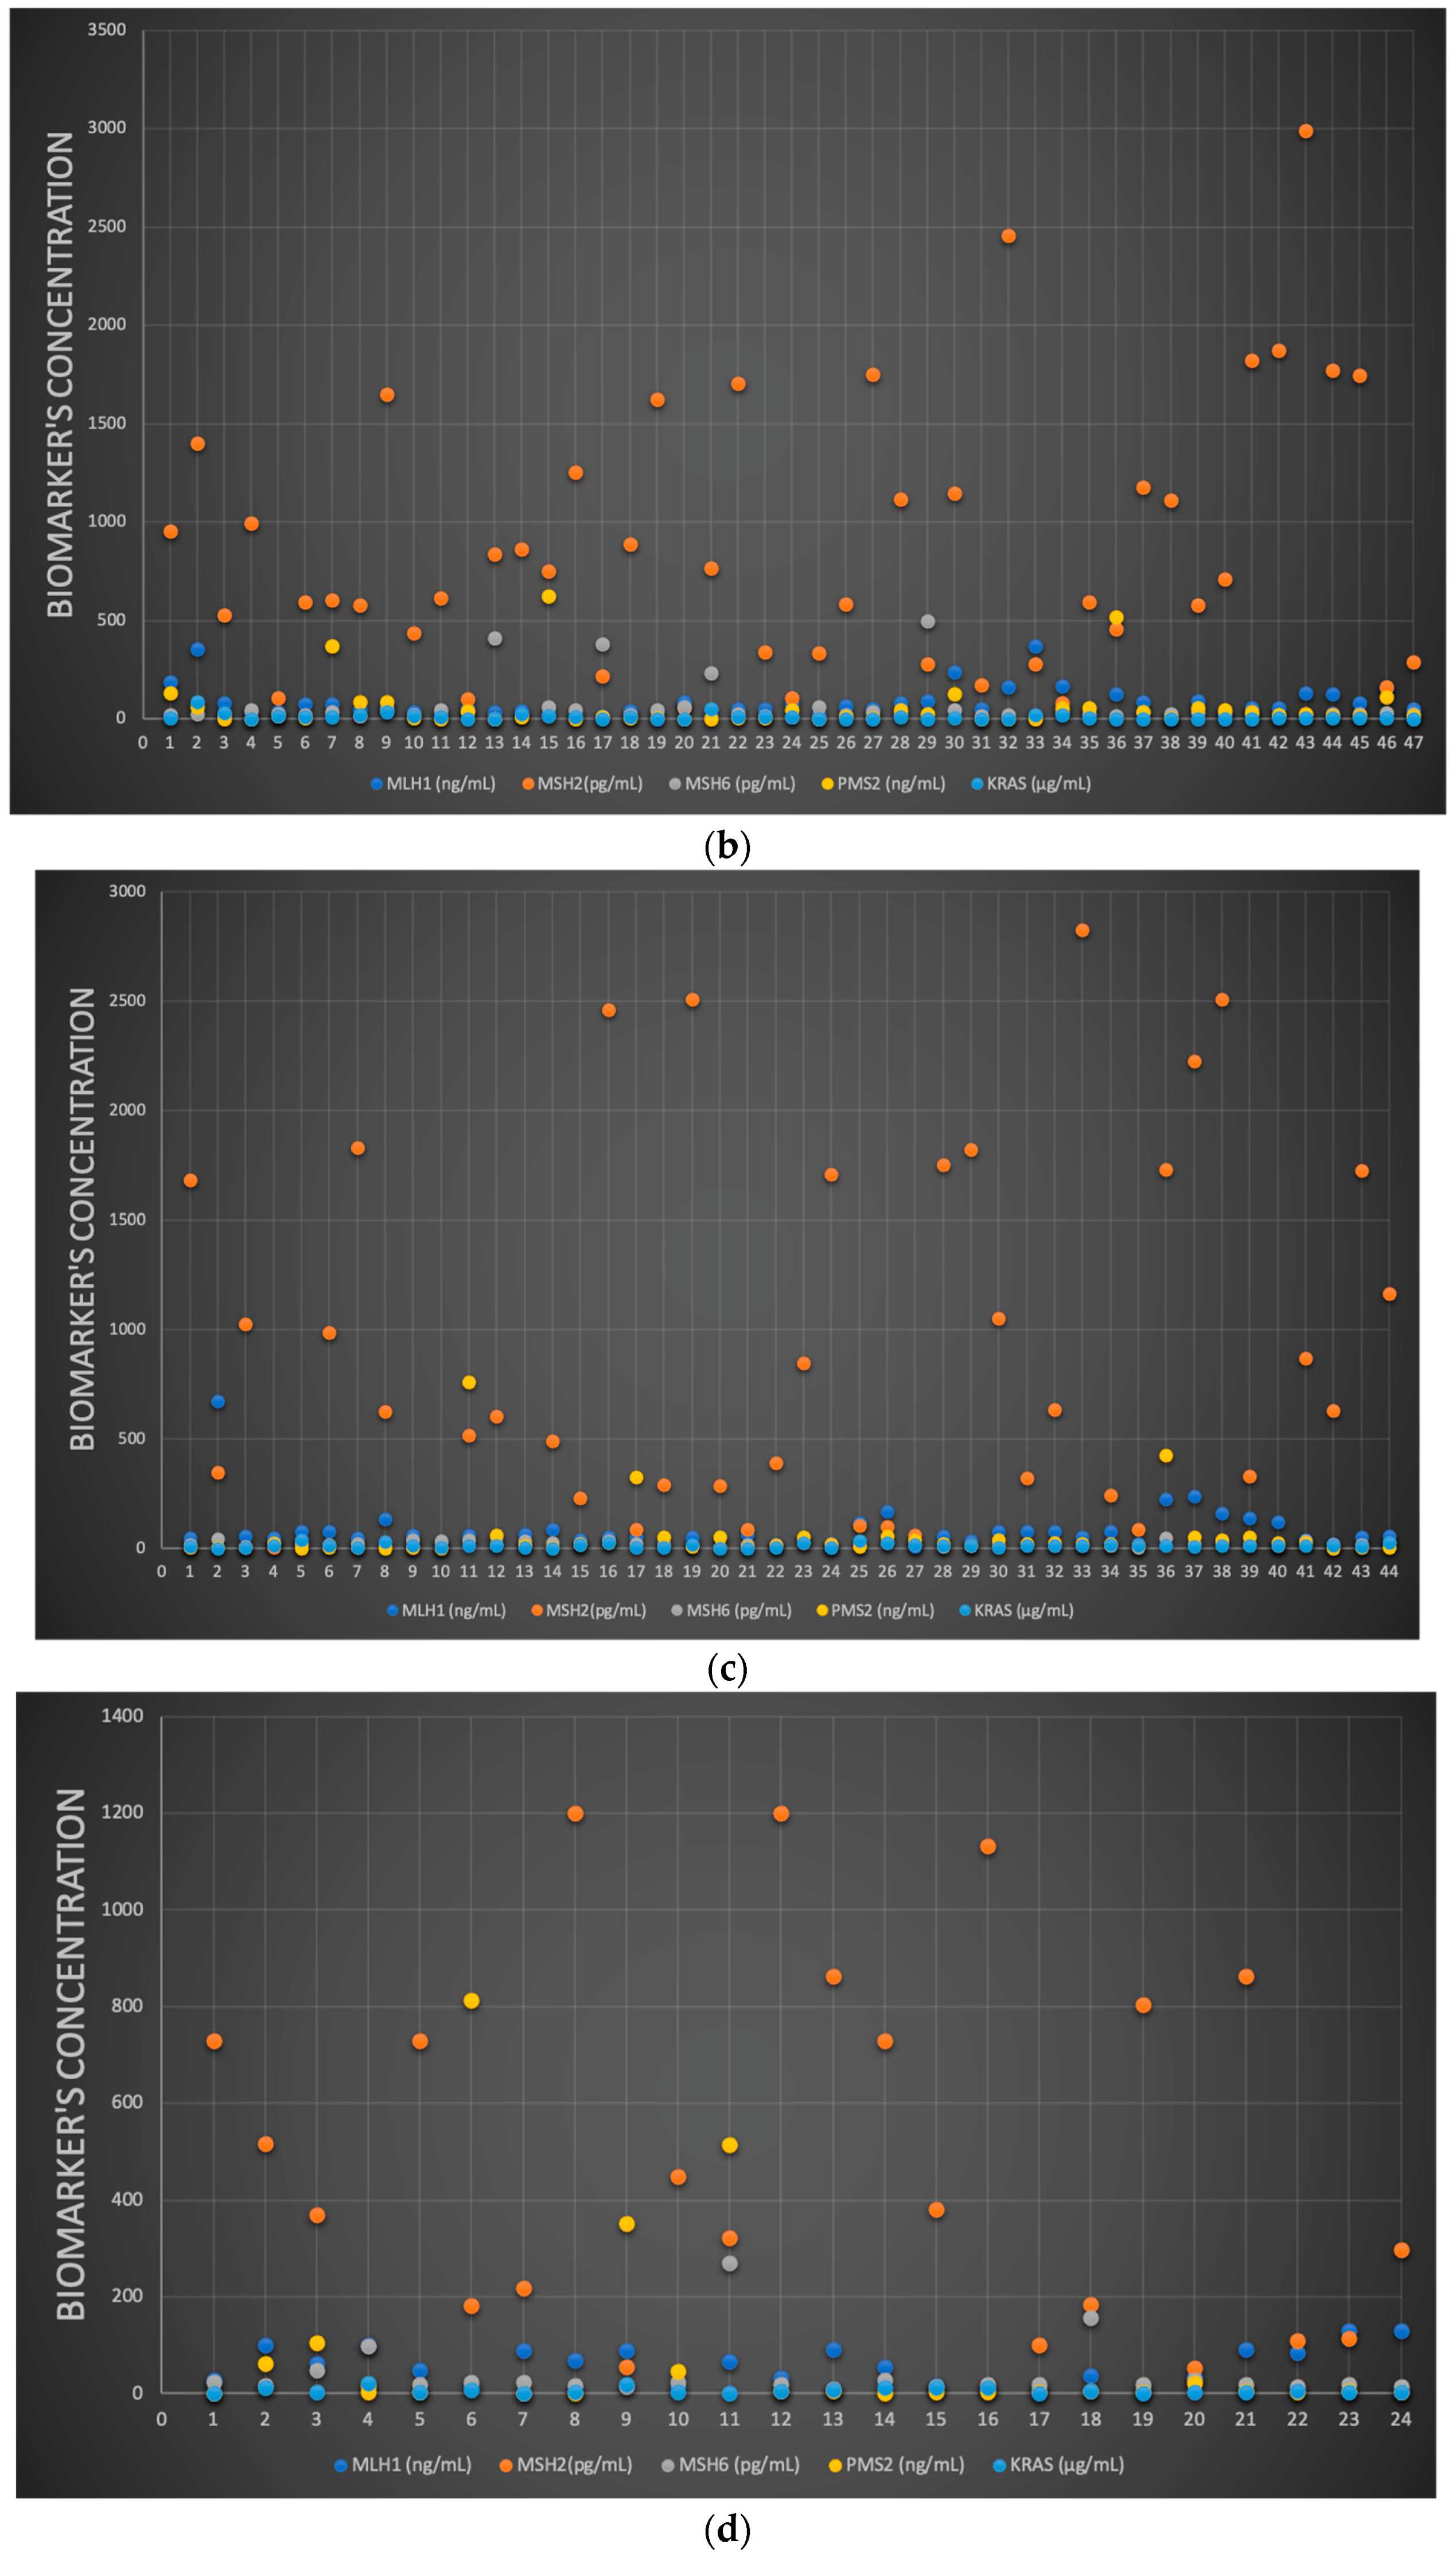
3.5. MLH1, MSH2, MSH6, PMS2 and KRAS: Molecular Identification and Quantification

The two stochastic sensors were used for the fast screening of biological samples, including tumoral tissue, whole blood, saliva and urine from individuals with colon or gastric cancer. Based on their signatures, KRAS, PMS2, MLH1, MSH2 and MSH6 were first recognized in the diagrams (Figure 1, Figure 2, Figure 3 and Figure 4) before the matching ton was read and employed as stated in the stochastic mode [18] to determine the concentration of KRAS, PMS2, MLH1, MSH2 and MSH6. The results obtained for the assay of the biological samples (over 150 biological samples: whole blood, urine, saliva and tumoral tissue) can be found in Figure 7 and Figure 8 and in the Supplementary Materials (Tables S1–S4).
A paired Student’s t-test was conducted at a confidence level of 99.90%. The calculated t-values for each sample type were less than 2.50, indicating that there is no statistically significant difference between the results obtained using the proposed stochastic sensors (Tables S1–S4) and that stochastic sensors can be relied upon for the molecular identification and quantification of KRAS, PMS2, MLH1, MSH2 and MSH6 in the selected biological samples.
In addition, the validation was performed using the conventional addition procedure, which entailed the addition of known quantities of KRAS, PMS2, MLH1, MSH2 and MSH6 to each type of biological sample: whole blood, tumoral tissue, urine and saliva. The recovery tests for the known quantities are shown in Table 3. When KRAS, PMS2, MLH1, MSH2 and MSH6 were identified from four different types of biological materials, extremely high recovery values were obtained. These data demonstrated that the suggested stochastic sensors may be utilized to reliably identify and quantify KRAS, PMS2, MLH1, MSH2 and MSH6 in biological samples.
The results of the recovery tests (Table 3) shown that the proposed stochastic sensors can be reliable used for the assay of MLH-1, MSH-2, MSH-6, PMS-2 and KRAS in whole blood, saliva, urine and tumoral tissue, because all recoveries were higher than 98.00%, with % RSD values lower than 1.00%.

4. Conclusions

Two doped-graphene based sensors were suggested for the fast detection of five biomarkers, MLH1, MSH2, MSH6, PMS2 and KRAS, in four different types of biological samples (blood, urine, saliva and tumoral tissue). When the sensor based on MD/EGR-2 was used, low limits of determination were obtained for MSH6, PMS2 and KRAS, while, for MLH1 and MSH2, low limits of determination were obtained when the sensor based on MD/EGR-1 was used.
The detection of these analytes in gastric and colon cancers was made achievable by the linear concentration range and the sensitivity of the stochastic sensors. When utilized for screening tests on urine, saliva, blood and tumoral tissue, the sensors are excellent tools and are cost effective, with the analysis at a price of less than two EUR for all five biomarkers. The primary benefit of these sensors is the simultaneous detection of five separate biomarkers, which enables the assay of a panel of biomarkers in biological samples. Their feature is the utilization of a screening test for the fast and early detection of colon and gastric cancers.

Supplementary Materials

The following supporting information can be downloaded at: www.mdpi.com/article/10.3390/chemosensors10100380/s1, Table S1: Determination of MLH1, MSH2, MSH6, PMS2 and KRAS in tissue samples (N = 10); Table S2: Determination of MLH1, MSH2, MSH6, PMS2 and KRAS in saliva samples (N = 10); Table S3: Determination of MLH1, MSH2, MSH6, PMS2 and KRAS in urine samples (N = 10); Table S4: Determination of MLH1, MSH2, MSH6, PMS2 and KRAS in whole blood samples (N = 10).

Author Contributions

Conceptualization, R.-I.S.-v.S. and S.P.; methodology, R.-I.S.-v.S. and D.-C.G.; validation, D.-C.G. and R.-I.S.-v.S.; formal analysis, R.-I.S.-v.S.; investigation, D.-C.G.; writing—original draft preparation, D.-C.G., R.-I.S.-v.S., F.P. and S.P.; writing—review and editing, R.-I.S.-v.S. and D.-C.G.; supervision, R.-I.S.-v.S.; funding acquisition, R.-I.S.-v.S. All authors have read and agreed to the published version of the manuscript.

Funding

This work was supported by a grant of the Ministry of Research, Innovation and Digitization, CNCS/CCCDI–UEFISCDI, project number PN-III-P4-ID-PCCF-2016–0006 within PNCDI III.

Institutional Review Board Statement

The samples were collected from the Hospital of Targu-Mures accordingly with the Ethics committee approval number: 75/2015 obtained from the same hospital.

Informed Consent Statement

Informed consent was obtained from all subjects involved in the study.

Data Availability Statement

Not applicable.

Acknowledgments

The authors are grateful to Alexandra Ciorîţă and Alexandru Turza for the SEM and XRD investigations of the graphene samples.

Conflicts of Interest

The authors declare no conflict of interest.

References

  1. Baretti, M.; Le, D.T. DNA mismatch repair in cancer. Pharmacol. Ther. 2018, 189, 45–62. [Google Scholar] [CrossRef]
  2. Greenson, J.K.; Huang, S.C.; Herron, C.; Moreno, V.; Bonner, J.D.; Tomsho, L.P.; Ben-Izhak, O.; Cohen, H.I.; Trougouboff, P.; Bejhar, J.; et al. Pathologic predictors of microsatellite instability in colorectal cancer. Am. J. Surg. Pathol. 2009, 33, 126–133. [Google Scholar] [CrossRef] [PubMed]
  3. Hampel, H.; Frankel, W.L.; Martin, E.; Arnold, M.; Khanduja, K.; Kuebler, P.; Clendenning, M.; Sotamaa, K.; Prior, T.; Westman, J.A.; et al. Feasibility of screening for lynch syndrome among patients with colorectal cancer. J. Clin. Oncol. 2008, 26, 5783–5788. [Google Scholar] [CrossRef] [PubMed]
  4. Liu, D.; Keijzers, G.; Rasmussen, L.J. DNA mismatch repair and its many roles in eukaryotic cells. Mutat. Res. 2017, 773, 174–187. [Google Scholar] [CrossRef] [PubMed]
  5. Miceli, R.; An, J.; Di Bartolomeo, M.; Morano, F.; Kim, S.T.; Park, S.H.; Choi, M.G.; Lee, J.H.; Raimondi, A.; Fucá, G.; et al. Prognostic Impact of Microsatellite Instability in Asian Gastric Cancer Patients Enrolled in the ARTIST. Trial. Oncol. 2019, 97, 38–43. [Google Scholar] [CrossRef] [PubMed]
  6. Di Bartolomeo, M.; Morano, F.; Raimondi, A.; Miceli, R.; Corallo, S.; Tamborini, E.; Perrone, F.; Antista, M.; Niger, M.; Pellegrinelli, A.; et al. Prognostic and Predictive Value of Microsatellite Instability, Inflammatory Reaction and PD-L1 in Gastric Cancer Patients Treated with Either Adjuvant 5-FU/LV or Sequential FOLFIRI Followed by Cisplatin and Docetaxel: A Translational Analysis from the ITA. Oncologist 2020, 25, e460–e468. [Google Scholar] [CrossRef]
  7. Wright, C.L.; Stewart, I.D. Histopathology and mismatch repair status of 458 consecutive colorectal carcinomas. Am. J. Surg. Pathol. 2003, 27, 1393–1406. [Google Scholar] [CrossRef] [PubMed]
  8. Jover, R.; Paya, A.; Alenda, C.; Poveda, M.J.; Peiró, G.; Aranda, F.I.; Pérez-Mateo, M. Defective mismatch-repair colorectal cancer: Clinicopathologic characteristics and usefulness of immunohistochemical analysis for diagnosis. Am. J. Clin. Pathol. 2004, 122, 389–394. [Google Scholar] [CrossRef]
  9. Shia, J. Immunohistochemistry versus microsatellite instability testing for screening colorectal cancer patients at risk for hereditary nonpolyposis colorectal cancer syndrome. Part, I. The utility of immunohistochemistry. J. Mol. Diagn. 2008, 10, 293–300. [Google Scholar] [CrossRef]
  10. Gremer, L.; Merbitz-Zahradnik, T.; Dvorsky, R.; Cirstea, I.C.; Kratz, C.P.; Zenker, M.; Wittinghofer, A.; Ahmadian, M.R. Germline KRAS mutations cause aberrant biochemical and physical properties leading to developmental disorders. Hum. Mutat. 2011, 32, 33–43. [Google Scholar] [CrossRef] [Green Version]
  11. Iyer, R.R.; Pluciennik, A.; Burdett, V.; Modrich, P.L. DNA mismatch repair: Functions and mechanisms. Chem. Rev. 2006, 106, 302–323. [Google Scholar] [CrossRef] [PubMed]
  12. Larrea, A.A.; Lujan, S.A.; Kunkel, T.A. SnapShot: DNA mismatch repair. Cell 2010, 141, 730.e1. [Google Scholar] [CrossRef] [PubMed]
  13. Stefan-van Staden, R.I.; Popa-Tudor, I. Molecular Recognition of C-Reactive Protein, Adiponectin and Zn2+ in Serum Samples. J. Electrochem. Soc. 2019, 166, B3051. [Google Scholar] [CrossRef]
  14. Stefan-van Staden, R.I.; Bogea, M.I.; Ilie-Mihai, R.M.; Gheorghe, D.C.; Aboul-Enein, H.Y.; Coros, M.; Pruneanu, S.M. N,S-Decorated graphenes modified with 2,3,7,8,12,13,17,18-octaethyl-21H,23H-porphine manganese(III) chloride-based 3D needle stochastic sensors for enantioanalysis of arginine: A key factor in the metabolomics and early detection of gastric cancer. Anal. Bioanal. Chem. 2022, 414, 6521–6530. [Google Scholar] [CrossRef] [PubMed]
  15. Stefan-van Staden, R.-I.S.; Comnea-Stancu, I.R.; Yanık, H.; Göksel, M.; Alexandru, A.; Durmuş, M. Phthalocyanine-BODIPY Dye: Synthesis, Characterization, and Utilization for Pattern Recognition of CYFRA 21-1 in Whole Blood Samples. Anal. Bioanal. Chem. 2017, 409, 6195–6203. [Google Scholar] [CrossRef] [PubMed]
  16. Stefan-van Staden, R.I.; Ilie-Mihai, R.M.; Pogacean, F.; Pruneanu, S.M. Needle stochastic sensors for on-site fast recognition and quantification of biomarkers for gastric cancer in biological samples. New J. Chem. 2020, 44, 20203–20211. [Google Scholar] [CrossRef]
  17. Ilie-Mihai, R.M.; Stefan-van Staden, R.I.; Magerusan, L.; Coros, M.; Pruneanu, S. Enantioanalysis of Tryptophan in Whole Blood Samples Using Stochastic Sensors-A Screening Test for Gastric Cancer. Chirality 2020, 32, 215–222. [Google Scholar] [CrossRef]
  18. Macchia, E.; Sarcina, L.; Driescher, C.; Gounani, Z.; Tewari, A.; Osterbacka, R.; Palazzo, G.; Tricase, A.; Kovacs Vajna, Z.M.; Viola, F.; et al. Single-molecule bioelectronic label-free assay of both protein and genomic markers of pancreatic mucinous cysts in whole blood serum. Adv. Electron. Mater. 2021, 7, 2100304. [Google Scholar] [CrossRef]
  19. Stefan-van Staden, R.I.; Ilie-Mihai, R.M.; Gugoasa, L.A.; Stanciu-Gavan, C. Pattern recognition of p53 and KRAS in whole blood samples. J. Electrochem. Soc. 2019, 166, B183–B186. [Google Scholar] [CrossRef]
  20. Sciammarella, C.; Beneivenga, M.; Mafficini, A.; Piredda, M.; Tsvetkova, V.; Paolino, G.; Mastrosimini, M.; Hetoja, S.; de Manzoni, G.; Mattiolo, P.; et al. Molecular analysis of an intestinal neuroendocrine/non-neuroendocrine neoplasm (MiNEN) reveals MLH1 methylation-driven microsatellite instability and a monoclonal origin: Diagnostic and clinical implications. Appl. Immunohistochem. Molec. Morphol. 2022, 30, 145–152. [Google Scholar] [CrossRef]
  21. Saliani, M.; Mirzaiebadizi, A.; Javadmanesh, A.; Siavoshi, A.; Ahmadian, M.R. KRAS-related long noncoding RNAs in human cancers. Cancer Gene Ther. 2022, 29, 418–427. [Google Scholar] [CrossRef] [PubMed]
  22. Ulreich, K.; Firnau, M.B.; Tagscherer, N.; Beyer, S.; Ackermann, A.; Plotz, G.; Brieger, A. High expression of casein kinase2 alpha is responsible for enhanced phosphorylation of DNA mismatch repair protein MLH1 and increased tumor mutation rates in colorectal cancer. Cancers 2022, 14, 1553. [Google Scholar] [CrossRef] [PubMed]
  23. Padin-Iruegas, E.; Chamorro-Petromacci, C.M.; Sines-Cajade, I.; Lorezo-Pouso, A.I.; Blanco-Carrion, A.; Perez-Jardon, A.; Gaudara-Vila, P.; Perez-Sayans, M. DNA methylation by bisulfite next-generation sequencing for MLH1 and MGMT in oral squamos cell carcinomas and potentially malignant disorders: An integrative analysis towards field cancerization. Medicina 2022, 58, 878. [Google Scholar] [CrossRef] [PubMed]
  24. Ijsselsteijn, R.; van Hees, S.; Drost, M.; Jansen, J.G.; de Wind, N. Induction of mismatch repair deficiency, compromised DNA damage signaling and compound hypermutagenesis by a dietary mutagen in a cell-based model for Lynch syndrome. Carcinogenesis 2022, 43, 160–169. [Google Scholar] [CrossRef] [PubMed]
  25. Salari, S.; Ghadyani, M.; Karimi, M.; Mortezazadeh, M.; Vahedifard, F. Immunohistochemical expression pattern of MLH1, MSH2, MSH6, and PMS2 in tumor specimen of Iranian gastric carcinoma patients. J. Gastroint. Cancer 2022, 53, 192–196. [Google Scholar] [CrossRef]
  26. Herz, A.L.; Wisser, S.; Kohlruss, M.; Slotta-Huspenina, J.; Jesinghaus, M.; Grosser, B.; Steiger, K.; Novotni, A.; Hapfelmeier, A.; Schmidt, T.; et al. Elevated microsatellite instability at selected tetranucleotide (EMAST) repeats in gastric cancer: A distinct microsatellite instability type with potential clinical impact? J. Pathol. Clin. Res. 2022, 8, 233–244. [Google Scholar] [CrossRef]
Figure 1. Examples of diagrams obtained for the screening tests of whole blood using the stochastic sensors based on: (a) MD/EGR-1 and (b) MD/EGR-2.
Chemosensors 10 00380 g001
Figure 2. Examples of diagrams obtained for the screening tests of urine using the stochastic sensors based on: (a) MD/EGR-1 and (b) MD/EGR-2.
Chemosensors 10 00380 g002
Figure 3. Examples of diagrams obtained for the screening tests of saliva using the stochastic sensors based on: (a) MD/EGR-1 and (b) MD/EGR-2.
Chemosensors 10 00380 g003
Figure 4. Examples of diagrams obtained for the screening tests of tumoral tissue using the stochastic sensors based on: (a) MD/EGR-1 and (b) MD/EGR-2.
Chemosensors 10 00380 g004
Figure 5. Representative SEM micrographs of: EGR-1 sample (a) and EGR-2 sample (b).
Chemosensors 10 00380 g005
Figure 6. The XRD pattern of EGR-1 sample and the corresponding structural parameters (a); the XRD pattern of EGR-2 sample and the corresponding structural parameters (b).
Chemosensors 10 00380 g006
Figure 7. The results of the screening tests of (a) whole blood, (b) urine, (c) saliva and (d) tumoral tissue samples using the stochastic sensors based on MD/EGR-1.
Chemosensors 10 00380 g007aChemosensors 10 00380 g007b
Figure 8. The results of the screening tests of (a) whole blood, (b) urine, (c) saliva and (d) tumoral tissue samples using the stochastic sensors based on MD/EGR-2.
Chemosensors 10 00380 g008aChemosensors 10 00380 g008b
Table 1. Performance characteristics of the stochastic sensors for the assay of MLH1, MSH2, MSH6, PMS2 and KRAS.
Stochastic SensorsWorking Concentration Range (g mL−1)Calibration Equation and r 1Signature,
toff (s)
Sensitivity (s−1/μg mL−1)Limit of Determination (g mL−1)
MLH1
MD/EGR-13.2 × 10−16−3.2 × 10−81/ton = 0.03 + 5.31 × 10⁵ C
r = 0.9999
4.25.31 × 1053.2 × 10−16
MD/EGR-23.2 × 10−12−3.2 × 10−91/ton = 0.03 + 1.21 × 10² C
r = 0.9994
1.01.21 × 1023.2 × 10−12
MSH2
MD/EGR-11.0 × 10−12−1.0 × 10−81/ton = 0.03 + 2.11 × 10 C
r = 0.9998
3.32.11 × 101.0 × 10−12
MD/EGR-21.0 × 10−12−1.0 × 10−81/ton = 0.04 + 4.57 × 10 C
r = 0.9999
1.24.57 × 101.0 × 10−12
MSH6
MD/EGR-12.3−10−13−2.3 × 10−51/ton = 0.01 + 743.16 C
r = 0.9999
2.6743.162.3 × 10−13
MD/EGR-22.3−10−15−2.3 × 10−91/ton = 0.02 + 2.19 × 10⁵ C
r = 0.9999
4.62.19 × 1052.3 × 10−15
PMS2
MD/EGR-12.7−10−10−2.7 × 10−81/ton = 0.04 + 8.85 × 10⁻¹ C
r = 0.9999
1.38.85 × 10−12.7 × 10⁻¹⁰
MD/EGR-22.7−10−12−2.7 × 10−51/ton = 0.02 + 1.35 × 10² C
r = 0.9991
2.01.35 × 1022.7 × 10−12
KRAS
MD/EGR-12.2 × 10−8−2.2 × 10−51/ton = 0.03 + 2.46 × 10⁻³ C
r = 0.9999
2.02.46 × 10−32.2 × 10⁻⁸
MD/EGR-22.2 × 10−9−2.2 × 10−61/ton = 0.04 + 2.39 × 10⁻² C
r = 0.9992
1.42.39 × 10−22.2 × 10⁻⁹
1 <1/ton> = s−1; <C>—concentration = μg mL−1; <r>—correlation coefficient.
Table 2. Selectivity of the proposed stochastic sensors used for the assay of MLH1, MSH2, MSH6, PMS2 and KRAS.
Stochastic Sensors Modified with MD and Based onMLH1
Signature (s)
MSH2
Signature (s)
MSH6
Signature (s)
PMS2
Signature (s)
KRAS
Signature (s)
CA19-9
Signature (s)
p53
Signature (s)
Glutamine
Signature (s)
CA72-4
Signature (s)
EGR-14.23.32.61.32.00.53.01.72.8
EGR-21.01.24.62.01.40.72.60.73.3
Table 3. Recovery tests for the assay of MLH1, MSH2, MSH6, PMS2 and KRAS from biological samples (N = 10).
Stochastic Sensors Modified with MD and Based onRecovery %
MLH-1MSH-2MSH-6PMS-2KRAS
Whole blood
EGR-199.21 ± 0.0299.15 ± 0.0399.73 ± 0.0199.77 ± 0.0598.99 ± 0.02
EGR-299.13 ± 0.0199.98 ± 0.0299.03 ± 0.0299.10 ± 0.0299.87 ± 0.03
Saliva
EGR-199.15 ± 0.0199.24 ± 0.0299.12 ± 0.0199.20 ± 0.0299.03 ± 0.05
EGR-299.43 ± 0.0399.57 ± 0.0299.70 ± 0.0898.59 ± 0.0798.98 ± 0.02
Urine
EGR-198.21 ± 0.0399.01 ± 0.0298.42 ± 0.0398.21 ± 0.0298.32 ± 0.03
EGR-298.18 ± 0.0598.55 ± 0.0399.00 ± 0.0298.11 ± 0.0298.14 ± 0.02
Tumoral tissue
EGR-199.99 ± 0.0299.95 ± 0.0399.51 ± 0.0299.87 ± 0.0199.90 ± 0.02
EGR-299.91 ± 0.0299.00 ± 0.0199.44 ± 0.0399.00 ± 0.0299.69 ± 0.07
Publisher’s Note: MDPI stays neutral with regard to jurisdictional claims in published maps and institutional affiliations.

