Article

An AIEE Active Anthracene-Based Nanoprobe for Zn2+ and Tyrosine Detection Validated by Bioimaging Studies

1
Department of Applied Chemistry, National Yang Ming Chiao Tung University, Hsinchu 300, Taiwan
2
Center for Emergent Functional Matter Science, National Yang Ming Chiao Tung University, Hsinchu 300, Taiwan
*
Author to whom correspondence should be addressed.
Chemosensors 2022, 10(10), 381; https://doi.org/10.3390/chemosensors10100381
Submission received: 25 August 2022 / Revised: 13 September 2022 / Accepted: 18 September 2022 / Published: 22 September 2022
(This article belongs to the Section Applied Chemical Sensors)

Abstract

:
Novel anthracene-based Schiff base derivative (4-(anthracen-9-ylmethylene) amino)-5-phenyl-4H-1,2,4-triazole-3-thiol; AT2) is synthesized and utilized as an aggregation-induced emission-enhancement (AIEE) active probe to detect Zn2+ and Tyrosine. Ultraviolet-visible absorption/photoluminescence (UV-vis/PL) spectroscopy studies on the AIEE property of AT2 (in ethanol) with increasing water fractions (fw: 0–97.5%) confirm the J-type aggregation. Excellent sensor selectivity of AT2 to Zn2+ and its reversibility with Tyrosine are demonstrated with PL interrogations. 2:1 and 1:1 stoichiometry and binding sites of AT2-Zn2+ and Tyrosine-Zn2+ complexes are elucidated from Job plots, HR-mass, and 1H-NMR results. Nanomolar-level detection limits (LODs) of Zn2+ (179 nM) and Tyrosine (667 nM) and association constants (Kas) of 2.28 × 10⁻⁶ M−2 (for AT2-Zn2+) and 1.39 × 10⁻⁷ M−1 (for Tyrosine-Zn2+) are determined from standard deviation and linear fittings. Nanofiber formation in AIEE and aggregated/dispersed nanoparticles in the presence of the Zn2+/Tyrosine are supported by scanning-electron microscope (SEM), transmission-electron microscope (TEM), atomic-force microscope (AFM), and dynamic-light scattering (DLS) investigations. Density-functional theory (DFT) studies confirm an “On-Off” twisted intramolecular charge transfer/photo-induced electron transfer (TICT/PET) and “On-Off-On” PET mechanisms for AIEE and sensors, respectively. B16-F10 cellular and zebrafish imaging are conducted to support the applications of AIEE and sensors.

1. Introduction

One-pot synthesis of organic nanoprobes with aggregation-induced emission-enhancement (AIEE) features, along with their specific analyte-sensing capability, can be noted as trend-setting achievement in modern chemosensory research [1,2,3,4,5,6,7]. Schiff base derivatives are becoming attractive because of easy synthesis, analyte specificity, as well as AIEE properties [8,9,10,11,12]. Moreover, Schiff base derivatives, which exhibit high AIEE and specific analyte sensing via fluorescent response, can be effectively used in bioimaging and organic thin-film transistor (OTFT)-based sensors [13,14,15]. However, to achieve such highly fluorescent nanoprobes, it is essential to include the effective fluorophore units, such as naphthalene, anthracene, pyrene, other polyaromatic systems, etc. [16,17,18,19]. Similarly, if the probe is designed to detect specific metal ions, the receptor must have certain coordinative units like imines (-C=N), hydroxyl (-OH), thiol (-SH), etc. [20,21]. Recently, our group reported a pyrene-based Schiff base with “4-Amino-5-phenyl-4H-1,2,4-triazole-3-thiol” receptor, which has free thiol and imine groups (formed during the Schiff base reaction) to provide effective coordination with Zn2+ and to show reversibility with Tyrosine [15]. To further improve the above receptor, the Schiff base design can be modified by replacing the fluorophore that allows “turn-on” detection of Zn2+ and possesses AIEE property. To this track, the anthracene, which has the aforementioned optoelectronic properties, can be adopted to replace the pyrene unit in Schiff base synthesis [22,23,24]. Moreover, anthracene-based Schiff base probe may hold the nanostructural morphologies in AIEE and Zn2+ selectivity due to the π-π stacking and self-assembly nature, which has been demonstrated in in-vivo/in-vitro applications [25,26]. Thereby, anthracene-9-carboxaldehyde is refluxed with “4-Amino-5-phenyl-4H-1,2,4-triazole-3-thiol” to afford the Schiff base probe “(4-(anthracen-9-ylmethylene) amino)-5-phenyl-4H-1,2,4-triazole-3-thiol); AT2”, which has the AIEE property and also displays an “Off-On-Off” response to Zn2+ and Tyrosine.
Among transition metal ions, Zn2+ is essential for neural signal transmission and apoptosis and acts as a catalyst in enzymatic gene transcription and DNA synthesis [15,27,28,29]. Disorder of Zn2+ in human body may cause Alzheimer’s disease, metabolic disorder, infantile diarrhea, cerebral ischemia, epilepsy, etc. [30,31]. Therefore, many tactics have been proposed to detect Zn2+, such as inductively coupled plasma mass spectroscopy (ICP-MS), inductively coupled plasma-atomic emission spectrometry (ICP-AES), flame-atomic absorption spectrometry (FAAS), electrochemical methods, ion-selective membrane, and fluorescent assay tactics [32,33,34,35,36,37]. Among them, fluorescent detection of Zn2+ is well noted because of its applications in bioimaging studies [15,37,38], which allows us to utilize the Schiff base AT2 as the fluorescent probe for Zn2+ detection. In the same manner, Tyrosine plays a crucial role in neurochemicals (epinephrine, norepinephrine, and dopamine) production [39]. Disorders, such as viral infection, atherosclerosis, Parkinson’s disease, autoimmune disorders, tumors, and cancers, can also be attributed to the high concentration of Tyrosine [40]. Hence, reports on electrochemical, fluorescent, colorimetric, and light scattering tactics for Tyrosine detection are readily available [41,42,43,44] but further designs are still in demand. According to an earlier report [15], fluorescent detection of Zn2+ by AT2 Schiff base probe may lead to AT2-Zn2+-AT2* complex formation. If the complex can be reversible in the presence of Tyrosine, the probe can be regarded as an excellent one in terms of the multiple analyte sensing utility. To control the protein-Tyrosine phosphatase-β-activity, involvement of Zn2+ is crucial [45,46,47]. Thus, the Schiff base-Zn2+ complex may disintegrate in the presence of Tyrosine due to highly feasible Tyrosine-Zn2+ complex formation to restore the probe’s original signal, which may become useful in quantifying Tyrosine as well.
Herein, one-pot synthesized anthracene-based Schiff base AT2 probe is firstly reported as Zn2+ sensors in ethanol via AT2-Zn2+-AT2* complex (Zn2+-induced excimer) formation with sensory reversibility in the presence of Tyrosine via “Off-On-Off” responses. The probe AT2 reveals a J-type head-to-tail aggregation via AT2-AT2* (excimer induced by H2O) in AIEE with increasing water ratios (at fw: 0–97.5%). Linear regression and nanomolar detection limits (LODs) of Zn2+ and Tyrosine sensors by AT2 are estimated from standard deviation and linear fittings of related PL studies. Decay profiles, binding mode, and stoichiometry are supplemented by time-resolved photoluminescence (TRPL), HR-Mass, and 1H-NMR titrations. Nano-structural changes in the presence of Zn2+ and Tyrosine (AT2 nanoparticles aggregation and disaggregation) and AIEE (nanofibers formation at fw: 0–97.5%) are exploited by SEM, TEM, AFM, and DLS inquiries. Existence of “On-Off” PET/TICT, RIR mechanism in AIEE of AT2, PET “On-Off-On” mechanism in the presence of Zn2+ and Tyrosine, HOMOs, LUMOs, and bandgaps of the sensory complexes are justified from DFT interrogations. Finally, AIEE and sensory responses of AT2 are authenticated via in-vitro/in-vivo (B16-F10 cellular and zebrafish) imaging studies. Figure 1 displays the table of content (TOC) schematic of AT2-based AIEE (at 0–97.5% fw), Zn2+ and Tyrosine sensors, PET involvement, nanostructural changes, and their bioimaging applications described in this article.

2. Materials and Methods

General information on instruments, stock solutions, AIEE/sensory procedure, sample preparations, 1H and 13C-NMR (nuclear magnetic resonance spectra) of AT2, high resolution (HR)-Mass of AT2, UV-Vis/PL-based sensory data, TRPL data, 1H-NMR-titration, pH effect on sensors, DFT, SEM, TEM, AFM, MTT assay, and AIEE/time-dependent cellular images can be found in supporting information.

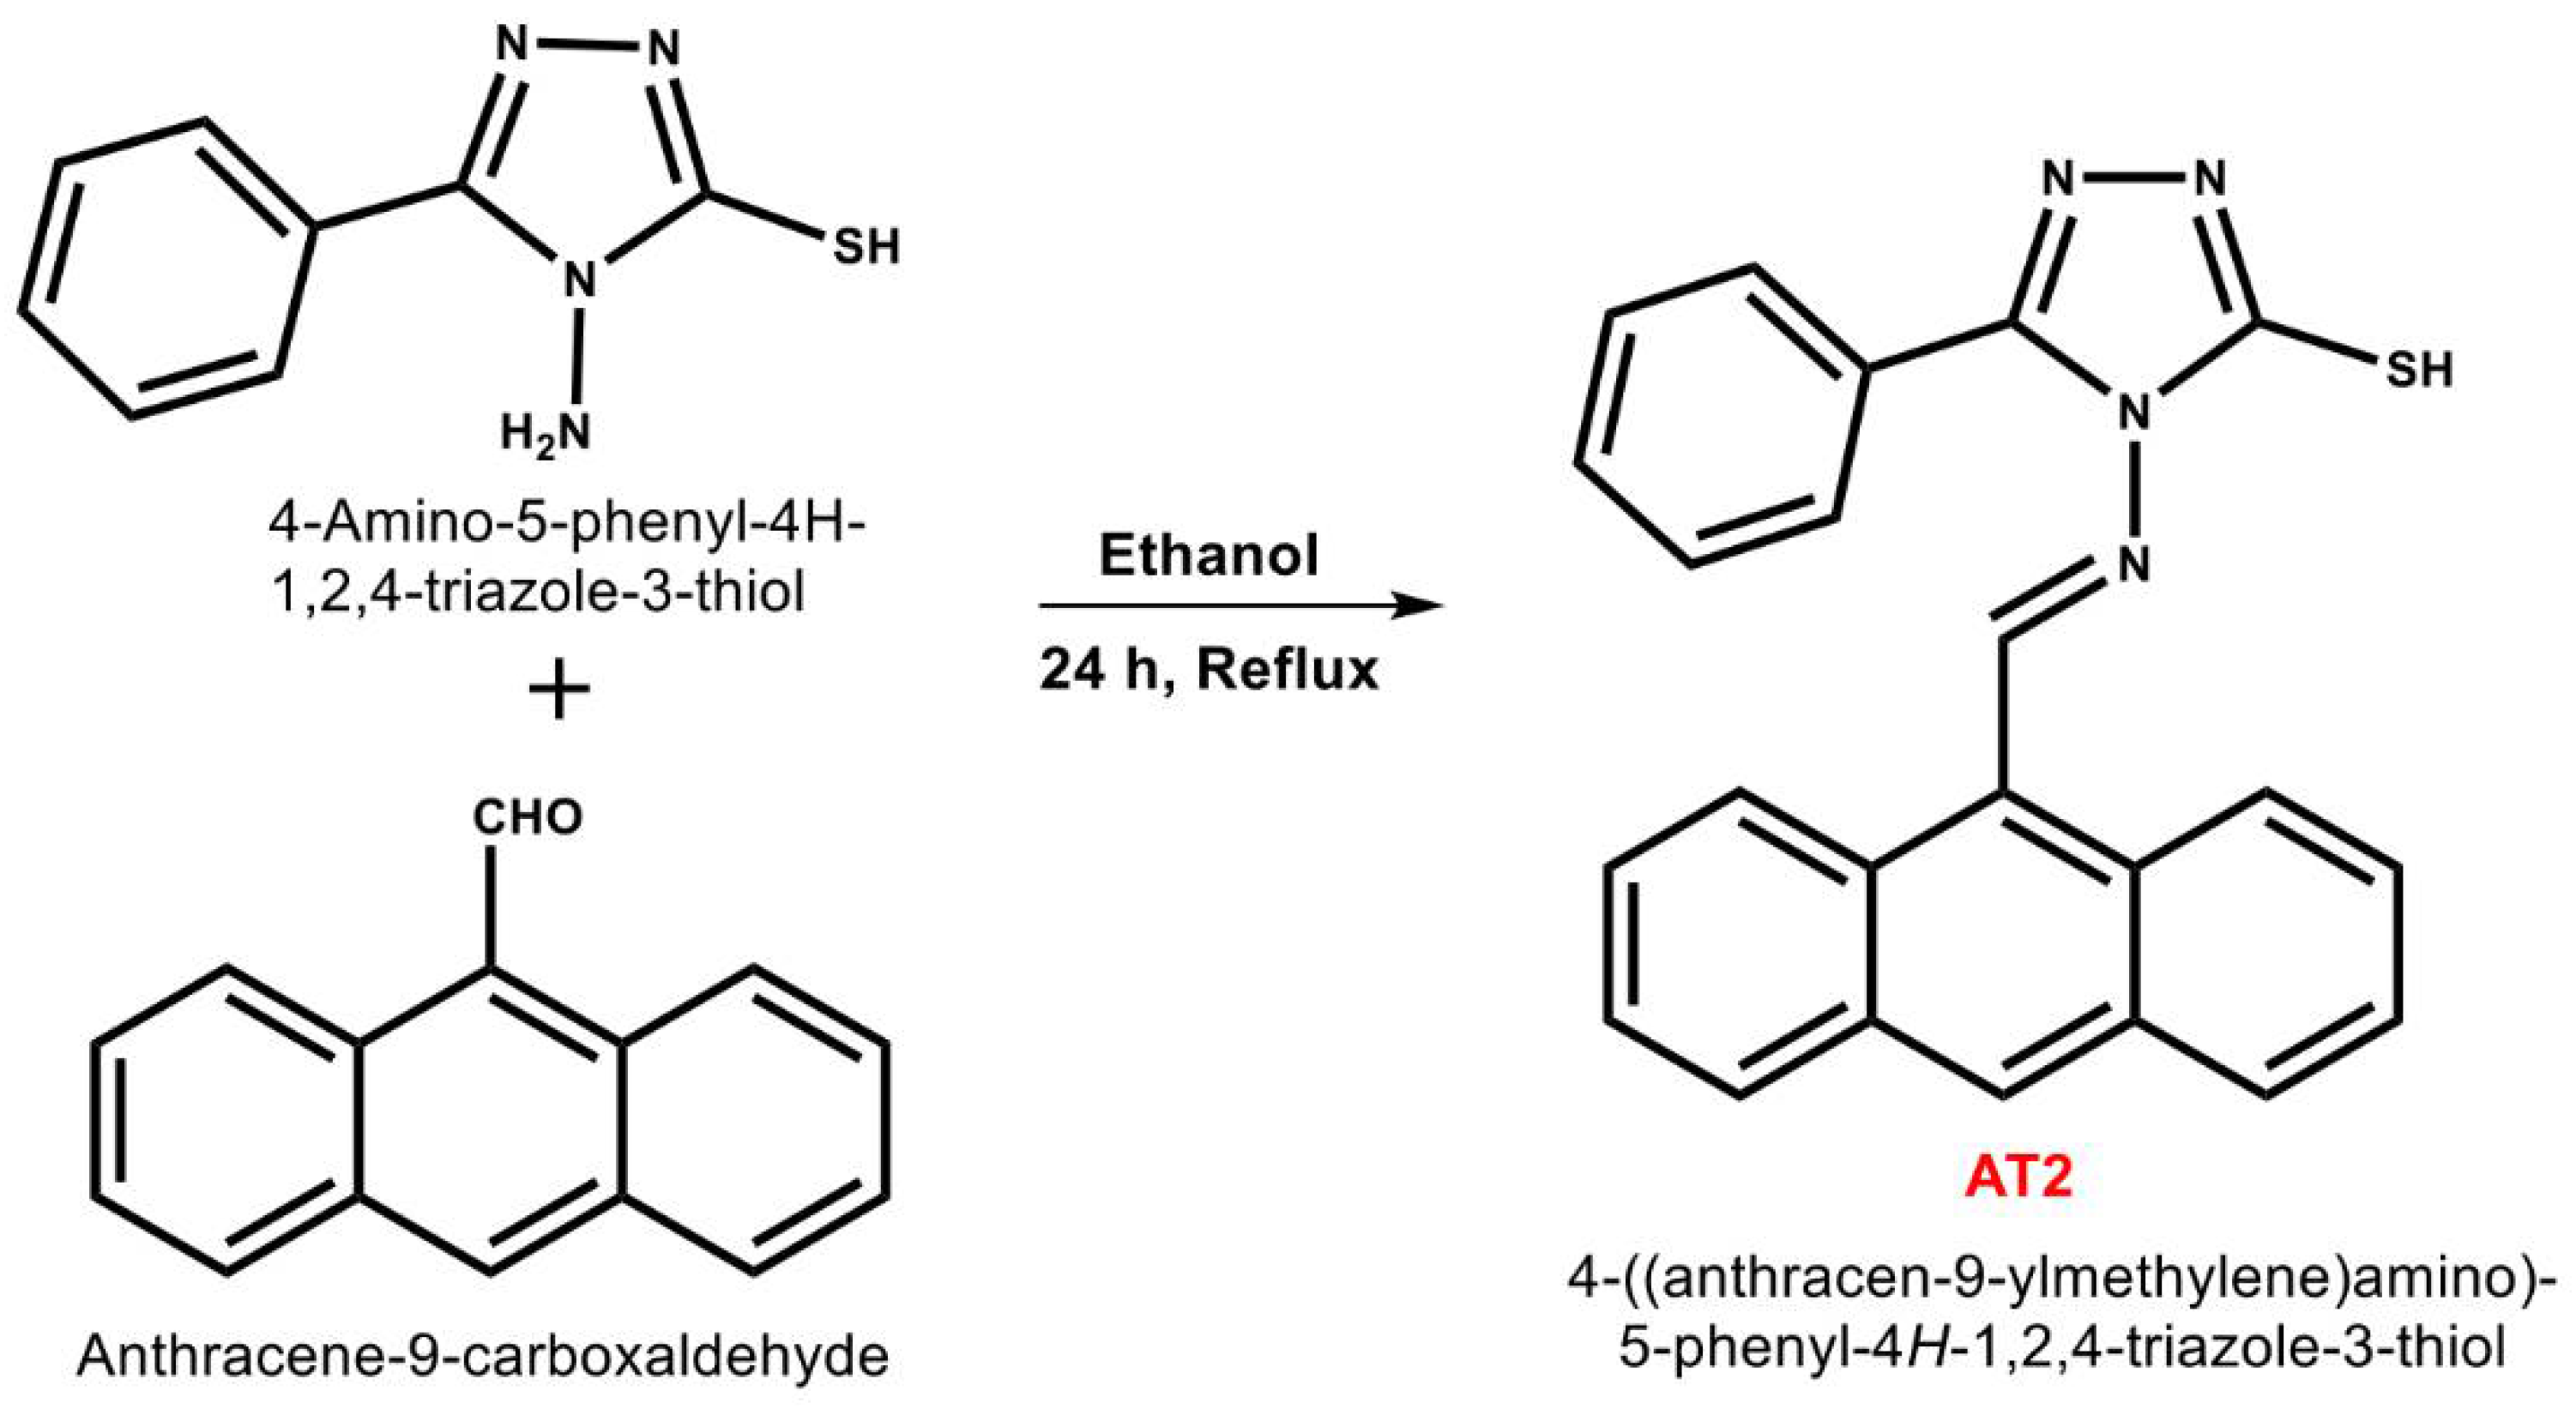
2.1. Synthesis of AT2 [3,15]

0.5 g (1 equivalent) of anthracene-9-carboxaldehyde and 466 mg (1 equivalent) of 4-Amino-5-phenyl-4H-1,2,4-triazole-3-thiol were mixed thoroughly in a well-cleaned round bottom flask with 100 mL of ethanol and refluxed for 24 h. The reaction was monitored through thin-layer chromatography (TLC) for final product (4-(anthracen-9-ylmethylene) amino)-5-phenyl-4H-1,2,4-triazole-3-thiol; noted as AT2) formation. The obtained crude AT2 was filtrated and kept in a hot vacuum oven to afford dried product. Recrystallization (twice) of the crude AT2 in absolute ethanol produced pure compound in the form of a greenish-yellow semi-fluffy solid. Yield: 0.857 g (93%). 1H NMR (DMSO-d6) δ/ppm: 14.40 (s, 1H (-SH)), 10.81(s, 1H (CH=N)), 8.89 (s, 1H-aromatic; Anthracene), 8.61 (dd, 2H-aromatic, J = 6.6 Hz), 8.19–8.22 (dd, 2H-aromatic; J = 6.4 Hz), 7.9–7.94 (dd, 2H- aromatic, J = 6.2 Hz), 7.53–7.64 (m, 7H-aromatic; Anthracene and phenyl); 13C NMR (DMSO-d6) δ/ppm:167.62, 162.62, 149.52, 132.74, 131.28, 131.22, 130.77, 129.59, 129.31, 129.17, 128.45, 126.28, 126.11, 125.48, 123.39; m/z: calculated for C25H16N4S: 380.11; found: 381.11 (M + H)+.

2.2. Computational Methods

Electronic structures of AT2 probe and AT2-Zn2+-AT2* complex were optimized (at ground states) via density functional theory (DFT) implemented in Gaussian16 program [48]. A well-established GGA hybrid functional B3LYP [49,50] in-line with effective core potential (ECP) including 6-31 + G(d,p) for carbon (C), hydrogen(H), nitrogen (N), oxygen (O), and sulphur (S) atoms and the LANL2DZ (Los Alamos National Laboratory 2 Double-Zeta) basis set for metal atom (Zn) were applied for all electronic structural calculations. By means of the solvent reaction field (SCRF) method with polarizable continuum model (PCM), optimization was performed in both gas and solvent phase (acetonitrile, DMSO, and ethanol). The presence of the PET mechanism in sensors and electronic cloud localization were recognized from molecular orbital analysis (HOMO-LUMO) and molecular electrostatic potential map (ESP), respectively. The optimized data for Tyrosine-Zn2+ complex were adopted from our earlier publication [15].

2.3. MTT Assay

The cytotoxicity and bio-compatibility of AT2 were authenticated by the methyl thiazolyl tetrazolium (MTT) test [51,52]. In a 96-well cell culture plates, B16F10 cell lines were grown and various concentrations (0, 20, 40, 60, 80, 100 μM) of AT2 were added to the wells. Those cells were incubated at 37 °C under 5% CO2 for 24 h. Thereafter, each well was further incubated with 10 mL MTT (5 mg mL−1) at 37 °C under 5% CO2 for 4 h. After removal of the MTT solution, yellow precipitate (formazan) formation was revealed. The yellow precipitate was dissolved in 200 μL DMSO and 25 µL Sorensen’s glycine buffer (0.1 M glycine and 0.1 M NaCl). Each well’s absorbance at 570 nm was recorded by a Multiskan GO microplate reader. Finally, the viability of the cells was evaluated by the following equation:
Cell viability (%) = (Mean of absorbance value of treatment group)/(Mean of absorbance value of control group).
In a similar fashion, the half-maximal cell-inhibitory concentration (IC50) value of AT2 was determined by plotting cell viability as a function of AT2 concentration (n = 3).

2.4. Procedure for Live Cell and Zebra Fish Imaging of AT2 [15]

2.4.1. Cellular Imaging of AIEE

The plated B16F10 cells (on 14 mm glass coverslips) were incubated with 10 % FBS at 37 °C and 5 % CO2 for 24 h. The grown cells in DMEM were treated with DMSO-sterilized PBS (pH 7.4) dissolved by 20 μM of AT2 followed by incubation for 6 h at 37 °C. Next, the culture medium was removed and the cells were washed with PBS buffer (2 mL) before observation. Propidium iodide (PI; 5 μM; λexem 493/636 nm) was added and incubated in pre-washed cells and kept at 37 °C for 15 min to achieve nuclear staining. Fluorescence images were recorded using a confocal microscope (Leica, Wetzlar, Germany, TCS-SP5-X AOBS). Emission of laser-excited cells was recorded between 430 and 480 nm at λex = 425 nm.

2.4.2. Cellular Imaging of Zn2+ and Tyrosine

The well-grown B16F10 cells in DMEM media with 10% (v/v) FBS (fetal bovine serum) and penicillin/streptomycin (100 μg/mL) were incubated in 5% CO2 incubator at 37 °C. The cells were then washed twice with cell culture medium followed by incubation with 20 μM of AT2 at 37 °C for 20 min. The exogenous pathway identification was carried out in a suspended culture medium via incubation of Zn2+ (50 μM) and Tyrosine (100 μM), respectively. Before examination, treated cells were washed with 0.1 M PBS (2 mL × 3). Propidium iodide (PI; 5 μM; λexem 493/636 nm) was added and incubated in pre-washed cells and kept at 37 °C for 15 min to achieve nuclear staining. Confocal fluorescence images of cells were recorded using a Leica TCS SP5 X AOBS Confocal Fluorescence Microscope (Wetzlar, Germany) with a 63 oil-immersion objective lens. Blue and green emissive cells were witnessed at 460 nm and 520 nm, correspondingly.

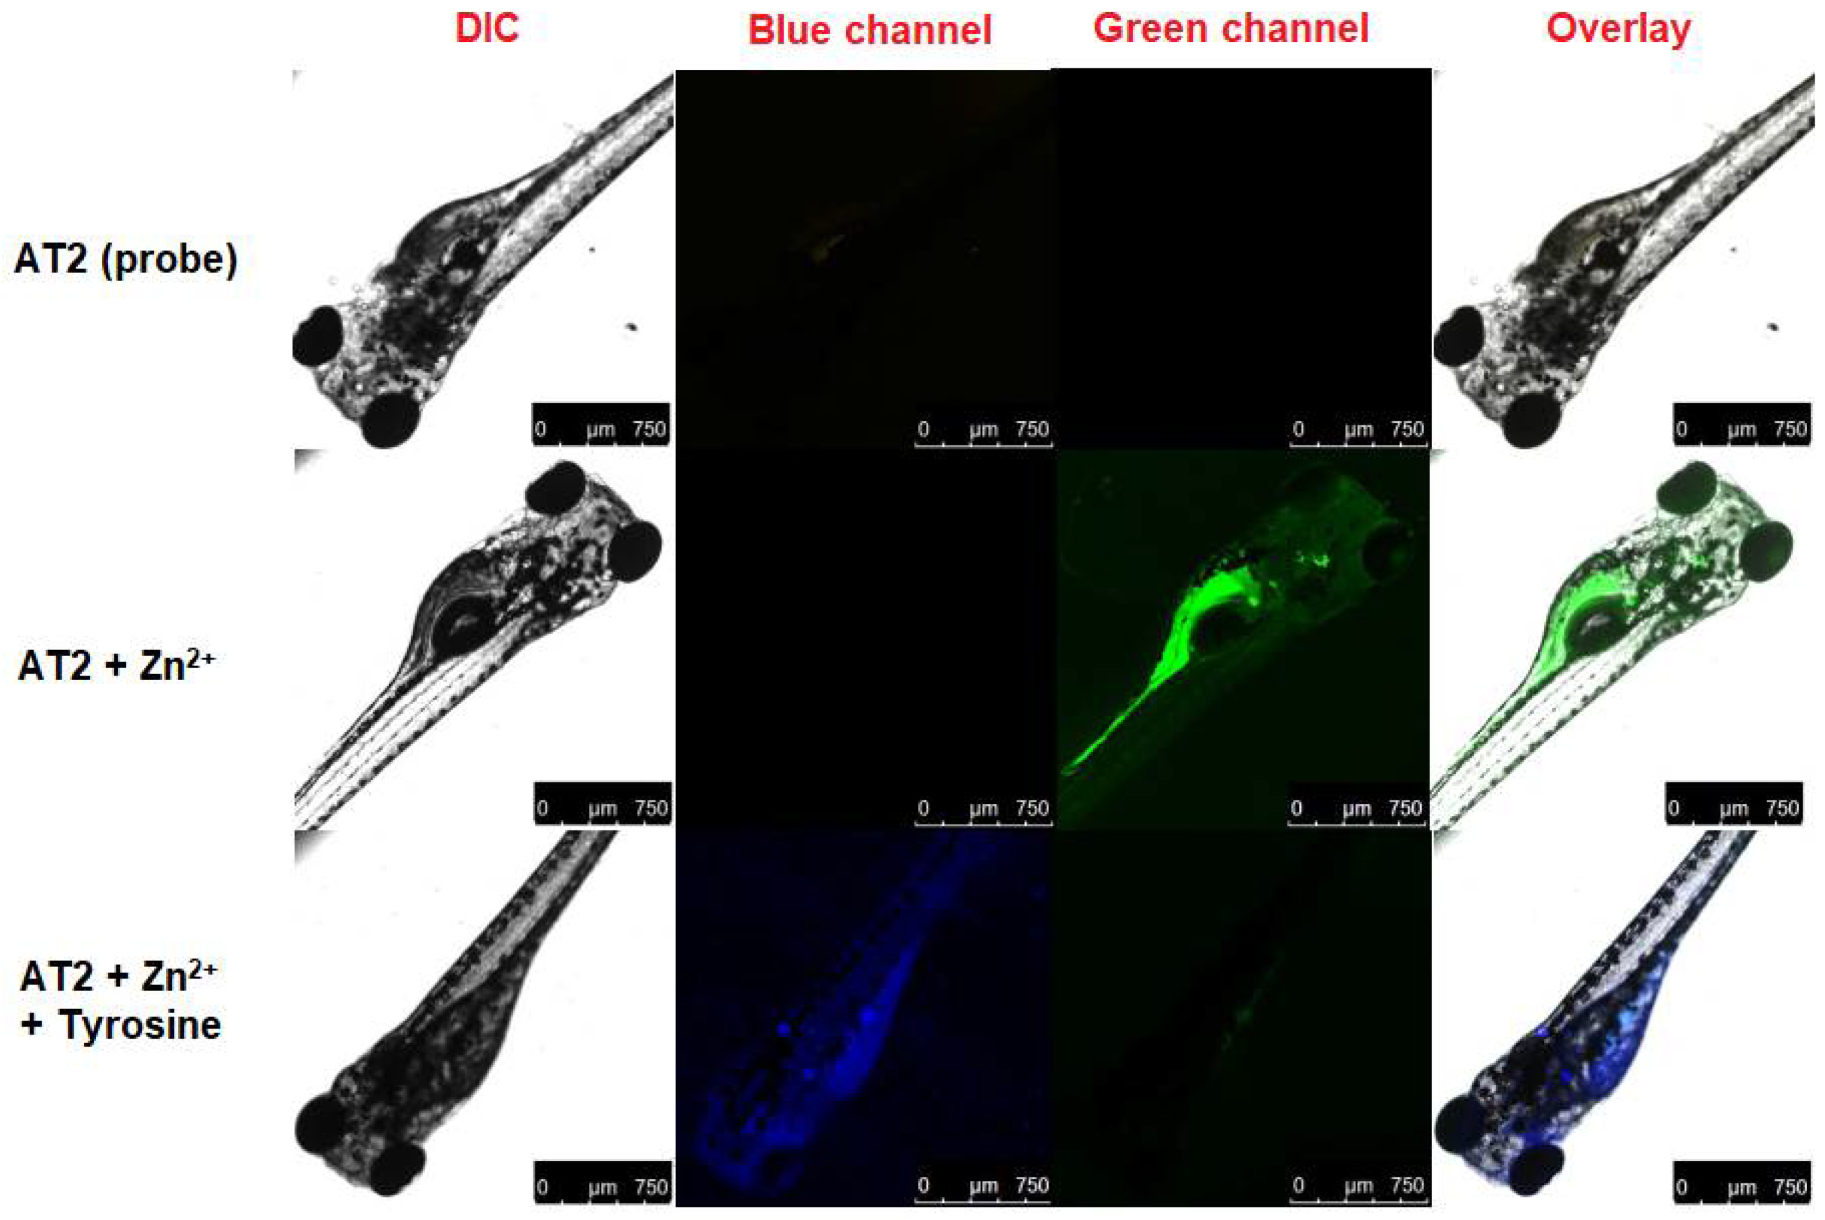
2.4.3. Zebrafish Imaging Studies

According to the guidelines of Animal Care and Use Committee of the National Yang Ming Chiao Tung University, the Zebrafish was treated first and kept under optimum breeding conditions at 28 °C. For mating, male and female zebrafish were housed in one tank at 28 °C for 14 h light/10 h dark period and laying of eggs was activated by light stimulation in the morning. Nearly all the eggs were fertilized. In 6-well plates, the zebrafish were grown in 5 mL of embryo medium added with 1-phenyl-2-thiourea (PTU) for 24 h at 30 °C. Anaesthetized (50 mg/L tricaine) 3-day old embryos of zebrafish were incubated with Zn2+ (50 μM) for 30 min at 28 °C in E3 media. Thereafter, the zebrafish were incubated with AT2 (20 μM) for 20 min at 28 °C and Tyrosine (100 μM) for 30 min at 28 °C, respectively. The excess Tyrosine and Zn2+ were removed by PBS. After washing with PBS to remove the remaining probes, the zebrafish was observed by a Leica TCS SP5 X AOBS Confocal Fluorescence Microscope.

3. Results and Discussion

3.1. Synthesis and Characterization of AT2

As seen in Scheme 1, by refluxing Anthracene-9-carboxaldehyde and 4-Amino-5-phenyl-4H-1,2,4-triazole-3-thiol in ethanol for 24 h, the probe “[(4-(anthracen-9-ylmethylene) amino)-5-phenyl-4H-1,2,4-triazole-3-thiol); noted as AT2]” was obtained at a yield of 93%. The purity of the AT2 probe was attested using 1H, 13C-NMR, and HR-Mass data, as displayed in Figures S1–S3 (Supporting Information; SI).

3.2. AIEE of AT2

Considering the solvent biocompatibility and effectiveness of Zn2+ sensory response as described in latter sections (Section 3.3 and Section 3.4), AT2 probe was firstly dissolved in ethanol solvent at 50 µM concentration followed by subjection to AIEE investigations via increasing the water fractions (fw) from 0–97.5%. A weak fluorescence emission peak of AT2 (50 µM in ethanol; 0% fw) was located at 456 nm (at λex = 418 nm) with a quantum yield (Фf) value of 0.008. As shown in Figure 2A, enhanced emission was observed due to the AIEE effect with increased fw from 0–60%. Moreover, the emission peak was also red-shifted from 456 nm to 470 nm. Due to solvent and precipitation effect, the AIEE of AT2 between 70–97.5% fw was considerably affected by decreases in emission intensity. In related to the emission enhancement in AIEE, absorbance studies also showed red-shifted in absorbance from 396 nm to 407 nm, as seen in Figure S4A (SI). The red-shift in PL and absorbance peaks could be attributed to feasible J-type aggregation as illustrated in TOC (Figure 1) [3,15]. Similar to PL and absorption data, the Фf at 60% fw reached a value of 0.142 (17-fold enhancement) as depicted in Figure 2B. Time-dependent Фf measurements on AIEE of AT2 confirmed that the aggregated state’s emission could be stable up to 6 h as shown in Figure S4B (SI). Figure 2C shows the emission enhancement of AT2 as a function of water fraction (0–97.5% fw).

3.3. Optimum Conditions for AT2-Based Sensors

Before moving on to detailed sensory investigations, optimum conditions for investigations were determined as following: (1). To avoid the AIEE effect on sensors, metal ions and pH buffers were obtained from 10 mM stock solution and fw was maintained below 10%; (2). Maximum concentration of metal ions and aminoacids was fixed as 25 µM as per earlier report [15]; (3). From the magnitude of PL enhancement and Фf interrogations on AT2 sensor response to Zn2+ in diverse solvents (see Figure S5A,B; SI; detailed in Section 3.4), the suitable solvent for all sensory studies was determined as ethanol.

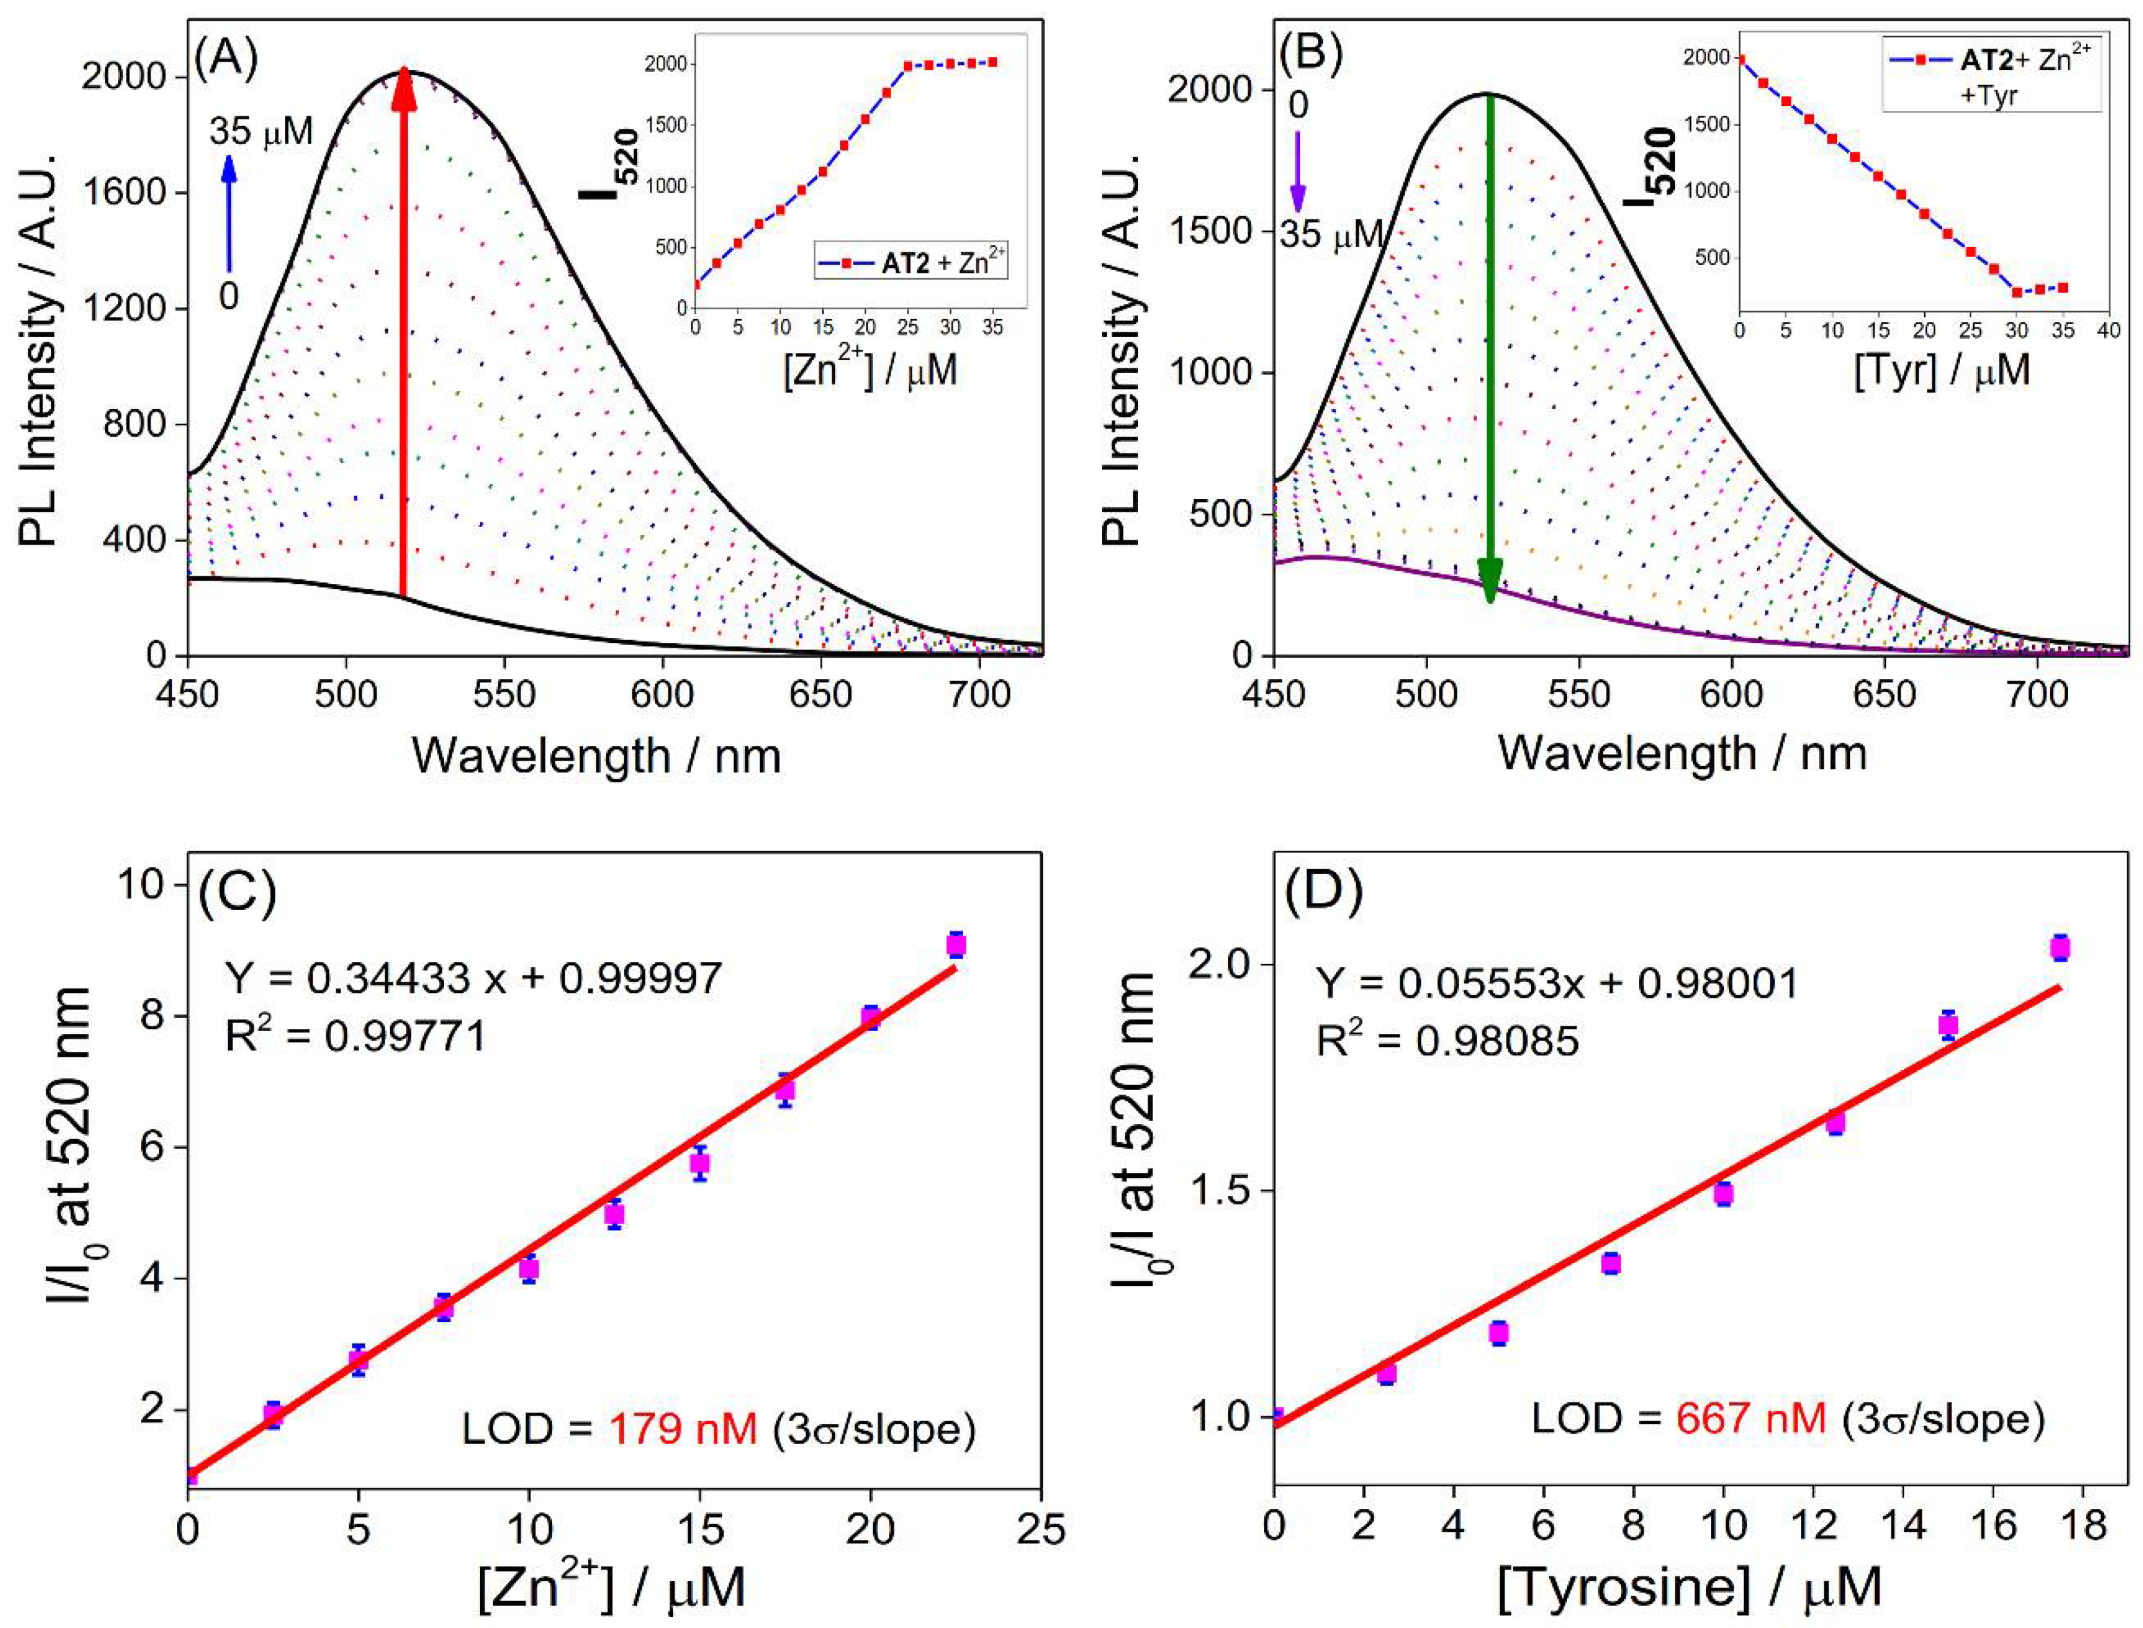
3.4. Primary Sensory Results of AT2

Upon adding different metal ions (Mg2+, Mn2+, Ni2+, Co2+, Pb2+, Al3+, Cs+, Na+, K+, Cd2+, Ca2+, Zn2+, Hg2+, Cu2+, Ba2+, Sn2+, Fe2+, Cr3+, Cr6+, Y3+, Ga3+, Pd2+, and Fe3+) to AT2 (50 µM in ethanol), a red-shifted “turn-on’ PL emission at 520 nm (λex = 418 nm) was visualized in the presence of Zn2+ as seen in Figure 3A. In fact, AT2 displayed a more moderate (10.2-fold) “turn-on” response enhancement than that of pyrene derivative (PT2; 196-folds) [15], which was attributed to the replacement of pyrene with anthracene moiety. However, in terms of fluorophore novelty and importance of Zn2+ detection in bio samples, this probe could still be an excellent alternative. During the initial investigations, metal ions, such as Cd2+, Hg2+, and Cu2+, showed negligible response (2–3 folds only; see Figure 3A), thereby attesting selectivity of Zn2+ by AT2. Towards reversibility investigations, 25 µM of amino acids [Ala: Alanine; Cys: Cysteine; H-Cys: Homo-Cysteine; Met: Methionine; Glu-acid: Glutamic acid; His: Histidine; Tyr: Tyrosine; Glu: Glucose; Thr: Threonine; AA: Ascorbic acid; Lys: Lysine; Phe-Ala: Phenyl Alanine; Orn: Ornithine; Gly: Glycine; Arg: Arginine; GSH: Glutathione; Ser: Serine; DA: Dopamine; Pro: Proline; Try: Tryptophan; Leu: Leucine; GA: Glutamine] from 10 mM stock solution were added to the above AT2 + Zn2+ sensory system in separate vials. Among the amino acids tested, only Tyrosine displayed reversibility as shown in Figure 3B, which was similar to the pyrene-based report [15].
During Zn2+ sensing, the initial Фf value of AT2 is increased from 0.008 to 0.103 (>12-fold), and the Фf value of AT2 + Zn2+ system was calculated as 0.011 in the presence of Tyrosine, thereby further supporting the reversibility. As shown in Figure S5A,B (SI), the magnitude of enhancement and Фf values of AT2 + Zn2+ in solvents, such as acetonitrile (ACN), dimethyl formamide (DMF), dimethyl sulfoxide (DMSO), tetrahydrofuran (THF), and DI-water are estimated as 8.1-, 9.2-, 4.7-, 1.2-, and 0.7-fold and 0.095, 0.098, 0.054, 0.011, and 0.01, respectively, which assure the use of ethanol as a solvent for sensory and AIEE investigations. Figure 4A,B show the selectivity photographs of AT2 and AT2 + Zn2+ sensory system under UV-lamp (λex = 365 nm) in the presence of metal ions and amino acids.
It was noted that the original weak blue-emissive AT2 displayed a “turn-on” green emission in the presence of Zn2+ (see Figure 4A), which was then restored by adding Tyrosine (see Figure 4B). The above results were encouraging for detailed chemosensory investigations.

3.5. Interference Studies and Detection Limits

To study the selectivity of AT2 to Zn2+ and its reversibility with Tyrosine, single and dual interference experiments were conducted. For the single analyte studies, AT2 (50 µM in ethanol) + 25 µM of all metal ions were used and, for the dual interference interrogations, AT2 (50 µM in ethanol) + 25 µM of Zn2+ + 75 µM of other metal ions were consumed in PL measurements. As seen in Figure S6A, none of the metal ions showed emission enhancement at 520 nm except Zn2+, which indicated that the probe was highly selective in single analyte studies. In the results of dual interference studies, Cu2+, Hg2+, Cd2+, and Cr6+ showed mild but still evident (>5-fold enhancement) effects. Thus, the selective sensing of Zn2+ by AT2 was well demonstrated. For testing the single analyte reversibility, AT2 (50 µM in ethanol) + Zn2+ (25 µM from 10 mM stock in DI-water) system was mixed with 25 µM of aminoacids (from 10 mM stock in DI-water) and, for the dual studies on reversibility, interfering aminoacids were mixed with a ratio of 1:3 before PL investigations. Wherein, none of the aminoacids disrupted the reversibility of AT2 + Zn2+ in both single and dual interference studies as exploited in Figure S6B (SI).
To identify detection limits (LODs) of Zn2+ and Tyrosine, individual PL titrations were performed as follows. Upon the addition of 0–35 µM Zn2+ (from 10 mM stock in DI-water) to AT2 (50 µM in ethanol), a red-shifted peak was observed at 520 nm as displayed in Figure 5A. The intensity of “turn-on” emission peak at 520 nm began to saturate after 25 µM of Zn2+ (see inset of Figure 5A), which suggested feasible 2:1 stoichiometry of AT2 to Zn2+. After adding 0–35 µM of Tyrosine in AT2 + Zn2+ system, quenching of fluorescence and restoration of AT2′s origin PL emission are observed, as shown in Figure 5B. At 30 µM concentration (see inset of Figure 5B), PL emission of AT2 has completely recovered, thereby suggesting feasible 1:1 stoichiometry of Tyrosine-Zn2+ coordination. From the above titrations (Figure 5A,B), linear regression and standard deviation plots of [Zn2+] as a function of I/I0 and [Tyr] as a function of I0/I at 520 nm are displayed in Figure 5C,D. From both plots, the LODs (3σ/slope) of Zn2+ and Tyrosine are estimated as 179 nM (Y = 0.34433x + 0.99997; R2 = 0.99771; n = 3) and 667 nM (Y = 0.05553x + 0.98001; R2 = 0.98085; n = 3), respectively. These nanomolar LODs attest the effectiveness of the AT2 probe in selective discrimination of Zn2+ and Tyrosine. Subsequently, UV-Vis investigations on AT2 to Zn2+ and its reversibility with Tyrosine revealed red-/blue-shifted quenched/restored peaks around 401 nm and 396 nm, correspondingly, as seen in Figure S7A (SI). Separate titrations of AT2 and AT2 + Zn2+ with Zn2+ and Tyrosine (0–35 µM for both) (see Figure S7B,C; SI), demonstrated similar results to the PL-based sensory responses.

3.6. TRPL, pH Effect and Stoichiometry

To further support PL-mediated sensing of Zn2+ and Tyrosine, TRPL investigations were conducted as follows. In contrast to the pyrene-based report [15,53], decay profiles and average decay constants of AT2, AIEE, and its sensory responses consisted of four decay constants, namely τ1 (fastest), τ2 (second fastest), τ3 (slowest), and τ4 (second slowest) with weighted factors A1, A2, A3, and A4, respectively. For AT2 (in ethanol at 0% fw), the major contribution was from τ1 (97.9%) and the average decay constant (τav) is 0.1001 ns. On the other hand, τav with a value of 0.2021 ns was attained for AT2@60% fw, which was contributed from all four components (τ1 (93.3%), τ2 (5.8%), τ3 (0.6%), and τ4 (0.3%)). It indicated the distinct AIEE nature rather than that of the pyrene-based report. TRPL-fitting plots of AT2@0% fw and AT2@60% fw are depicted in Figure S8A (SI). In the presence of Zn2+, a τav value of AT2 (in ethanol) was estimated as 0.2329 ns, which was contributed largely from τ1 (80%), τ2 (17.9%), and τ3 (2%) due to AT2 + Zn2+ complex formation. The above complex formation was restored in the presence of Tyrosine and displayed a τav value of 0.1003 ns, which had similar contributions as in the case of AT2@0% fw. TRPL fitting plots of AT2 + Zn2+ and AT2 + Zn2+ + Tyrosine were shown in Figure S8B (SI) with all the fitting parameters of AIEE and sensors delivered in Table S1 (SI). To validate the effectiveness of Zn2+ and Tyrosine response, pH effects were attested by using freshly prepared “1–14” pH buffers [54,55]. As shown in Figure S9 (SI), both sensors displayed high selectivity between pHs 5–10, which suggested the feasible sensing utility of AT2 in mild acidic, neutral, and mild basic conditions.
Stoichiometry of sensory complexes must be evaluated to justify the exact binding mode as well as the mechanism. For AT2 + Zn2+ and AT2 + Zn2+ + Tyrosine sensory systems, mole fractions (X= {[AT2]/[AT2] + [Zn2+]} and X= {[Zn2+ in AT2 + Zn2+ complex]/[Tyrosine] + [Zn2+ in AT2 + Zn2+ complex]}) were plotted as a function of X*(I − I0) and X*(I0 − I), correspondingly. As shown in Job plots (Figure S10A,B; SI), AT2 to Zn2+ (in AT2 + Zn2+) and Tyrosine to Zn2+ (in AT2 + Zn2+ + Tyrosine) passed through Ca. 0.67 and Ca. 0.51, which suggest 2:1 and 1:1 stoichiometry, respectively. The 2:1 stoichiometry of AT2 to Zn2+ could be attributed to Zn2+-induced excimer (AT2-Zn2+-AT2*) formation and the 1:1 stoichiometry corresponded to Tyrosine-Zn2+ complex (here Zn2+ were derived from mentioned excimer to restore AT2 as well). To support the estimated stoichiometry, HR-Mass interrogations were performed. As seen in Figure S11 (SI), mass peak at m/z = 838.8378 corresponded to [AT2-Zn2+-AT2*]+ + H2O − 2, thereby confirming the 2:1 stoichiometry of AT2 to Zn2+. Upon adding Tyrosine to AT2 + Zn2+, two mass peaks at m/z = 381.1161 and m/z = 226.9513 were assigned to AT2 (M + H)+ and [Tyr + Zn2+]-H2O (M + 2H)+ configurations (see Figure S12; SI), thereby attesting the 1:1 stoichiometry of Tyrosine to Zn2+ and reversibility of AT2 probe.

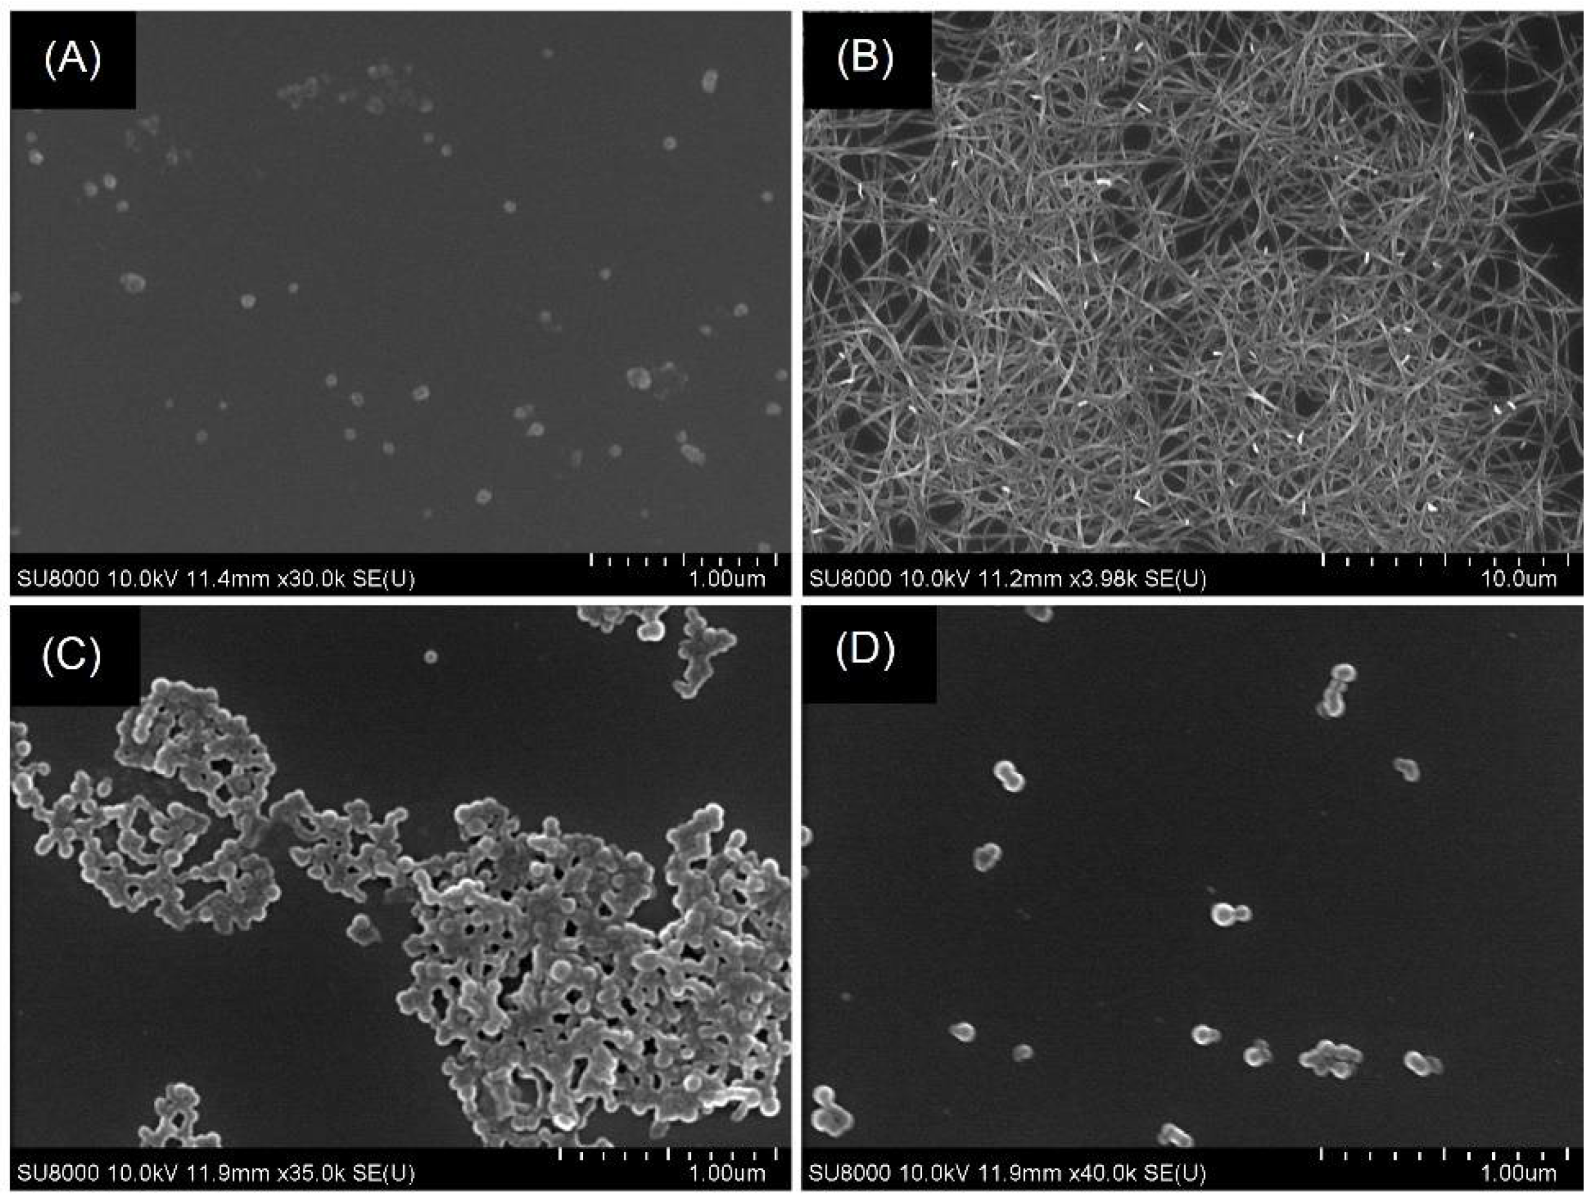
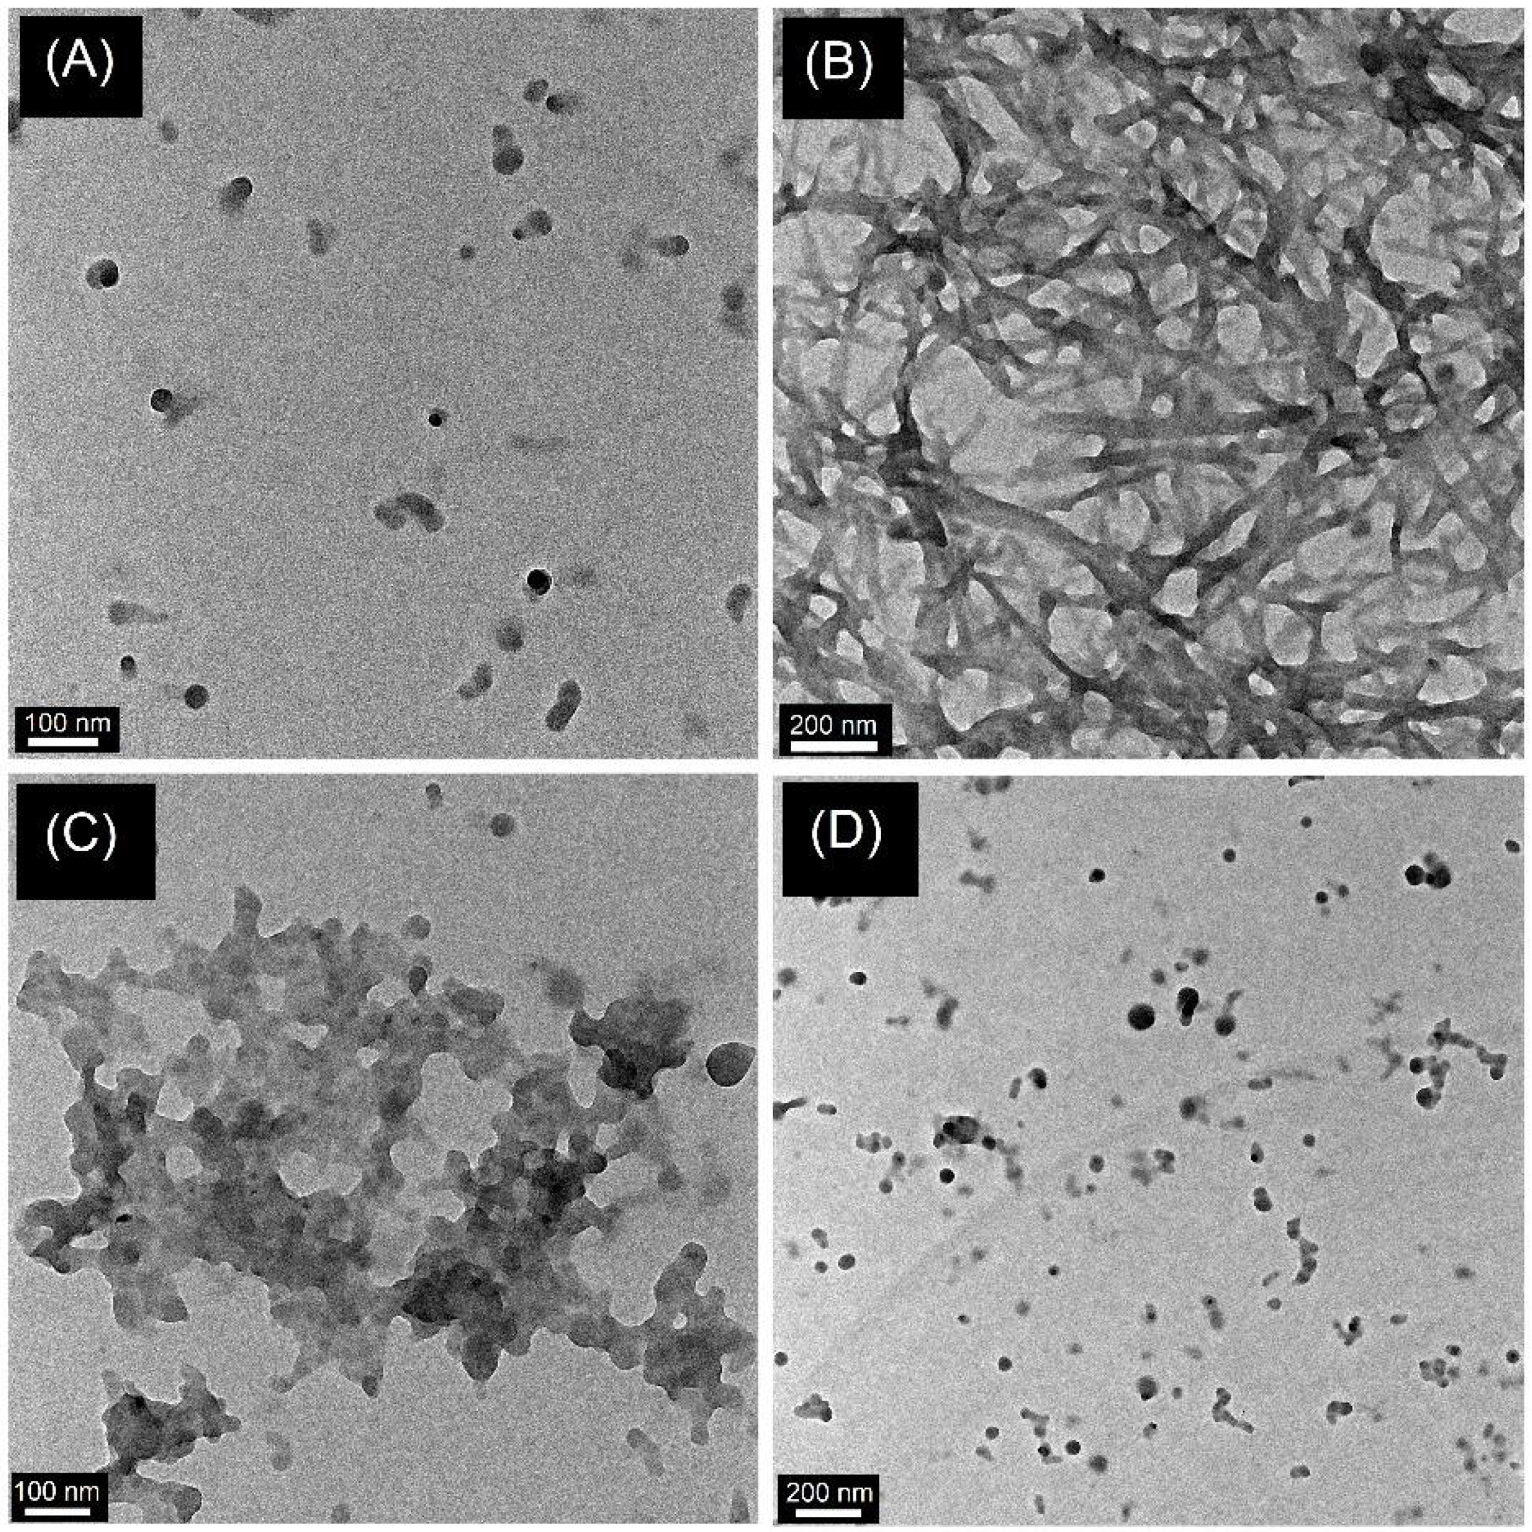
3.7. Association Constants and Nano-Morphological Interrogations

After confirming the 2:1 and 1:1 stoichiometry of AT2 to Zn2+ and Tyrosine-Zn2+ complexes, association constants (Kas) were derived as follows [3,15]. By using the following equation (Equation (1)), Ka of AT2 + Zn2+ complex can be estimated.
α2/(1 − α) = 1/2KaCF [Zn2+]
where CF = total concentration of AT2 exist in the complex, α = free AT2: total concentration of AT2 (ratio) which is determined from the following Equation (Equation (2)).
α = I − I0/I1 − I0
At any given Zn2+ concentration, PL intensity at 520 nm is assigned as I. In the absence and presence of Zn2+, the PL maxima intensity at 520 nm is noted as I1 and I0, correspondingly. As shown in Figure S13A (SI), Ka of AT2 to Zn2+ is estimated as 2.28 × 10⁻⁶ M−2 by linearly fitting the plot of α2/(1 − α) as a function of 1/[Zn2+] (slope of the linear plot). On the other hand, linear fitting of 1/I − I0 as a function of 1/[Tyrosine] (see Figure S13B; SI) via Benesi-Hildebrand plot (suitable for 1:1 complexes) reveals a Ka value of Tyrosine to Zn2+ as 1.39 × 10⁻⁷ M−1 (slope of the linear plot) [56]. The higher association constant value of Tyrosine to Zn2+ than that of AT2 to Zn2+ well supports reversibility studies.
In the following, nano-morphological changes were studied to justify AT2 as a nanoprobe. As visualized in SEM images (Figure 6A,B), AT2@0% fw and AT2@60% fw form dispersed nanoparticles and nanofibers, which suggests that aggregation/assembly of AT2 nanoparticles leads to nanofibers formation in the presence of H2O.
SEM images in Figure S14A–L (SI) show the aggregation of AT2 nanoparticles at 0–100% fw. Up to 80% AIEE-mediated growth of nanofibers can be seen in Figure S14A–I of SI. Thereafter, precipitation of AT2 in a less fibric environment began to take place (see Figure S14J–L; SI). However, for AT2 + Zn2+ complexation, Zn2+ induced nanoparticles aggregation, but was restored to its original configuration in the presence of Tyrosine as displayed in Figure 6C,D. To support the above-observed nano-morphological changes, TEM experiments were conducted. Results from TEM investigations also demonstrated similar nanostructural features for AT2@0% fw (dispersed nanoparticles), AT2@60% fw (nanofibers), AT2 +Zn2+ (Zn2+ induced nanoparticles’ aggregation), and AT2 +Zn2+ + Tyrosine (nanoparticles dispersion due to AT2 reversibility provided by Tyrosine) as explored in Figure 7A–D.
Moreover, nanofiber growth via AT2 nanoparticles aggregation at 0–97.5% fw (see Figure S15A–H; SI) also showed a similar trend as in SEM studies. Therefore, AFM studies on AT2 at 0, 30, 60, and 90% fw also displayed growth of nanofibers from dispersed AT2 nanoparticles at 0% fw and solidification at 90% fw as shown in Figure S16A–D (SI). Similarly, for AT2 + Zn2+ and AT2 + Zn2+ + Tyrosine, AFM scanning results reveal Zn2+-induced particles’ aggregation and Tyrosine-induced nanoparticles’ dispersion (reversibility) as seen in Figure S16E,F (SI).
To further clarify the nanostructural changes, DLS studies were carried out. For AT2@0% fw, AT2@60% fw, AT2 +Zn2+, and AT2 +Zn2+ + Tyrosine, their particle sizes were estimated as 66.8 ± 42.7 nm (nanoparticles), 17,662.8 ± 12,080.6 nm (nanofibers in AIEE), 253.7 ± 63.2 nm (Zn2+ induced AT2 aggregation), and 90.1 ± 70.2 nm (Tyrosine-induced reversibility of AT2), respectively, as depicted in Figures S17–S20 (SI). Based on SEM, TEM, AFM, and DLS interrogations, the nano-level changes during AIEE and sensory studies of AT2 were well-justified, thereby confirming AT2 as a nanoprobe. However, compared to the earlier pyrene-based report [15], there was no gelation formation (up to 30 min) during AIEE even though nanofibers were formed. This might be due to the presence of diverse fluorophores, which justified the use of anthracene towards distinct nanoprobe development parallel to existing nanomaterials [57,58].

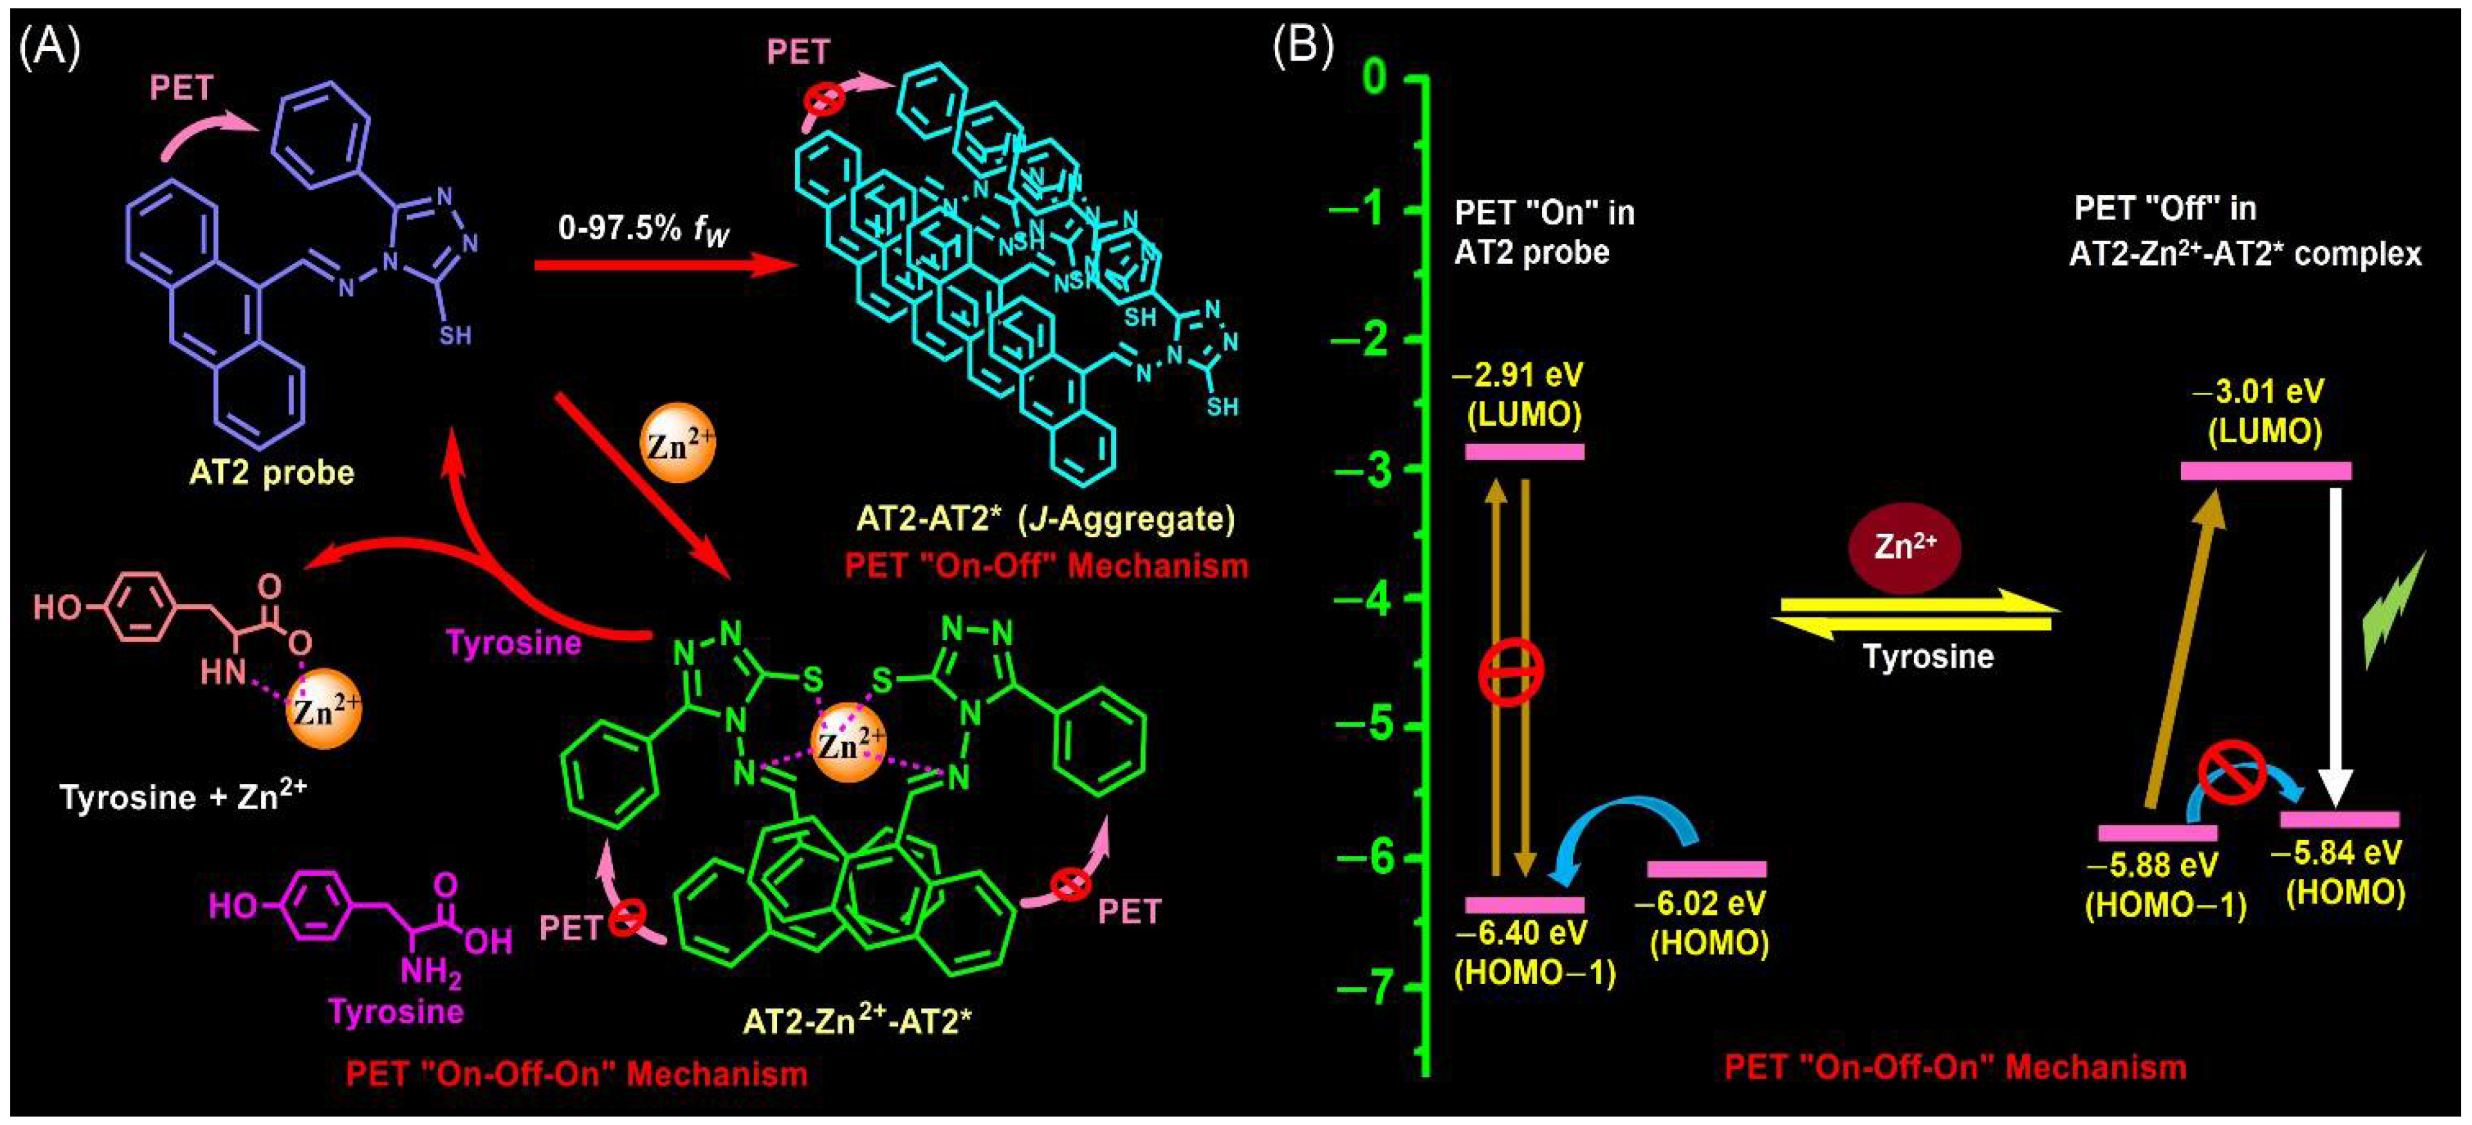
3.8. 1H-NMR Titrations and DFT Optimizations on Sensors

To verify the exact binding mode of AT2 to Zn2+, 1H-NMR titrations were conducted. The AT2 (20 mM; 1 equiv., in d6-DMSO) was titrated with increasing Zn2+ concentrations (0–12 mM; 0–0.6 equiv. in deuterated ethanol), which revealed changes in the original 1H-NMR peaks, described as follows. With increasing Zn2+ concentrations, the free thiol (-SH) peak of AT2 at 14.38 ppm slowly vanished accompanied with upfield-shifting of the -CH peak (-CH=N) from 10.79 to 10.69 ppm, as explored in Figure S21A–D (SI). The upfield-shifted -CH=N proton also validated participation of the N atom in -CH=N rather than N atom in triazole unit. In relation to the above changes, a majority of the aromatic proton peaks between 8.89 to 7.53 ppm were also mildly upfield-shifted and broadened due to excimer formation and involvement of anthracene and phenyl rings in the complex structure. Moreover, the complete disappearance of the -SH proton at 14.38 ppm and the broadening of spectra at 0.6 equiv. confirmed the 2:1 stoichiometry between AT2 to Zn2+. These observations on the mode were supported by the DFT optimizations described below.
DFT optimizations (by B3LYP/6 – 31 + G(d,p) in gas phase) were carried out to resolve the exact binding mode and mechanism. Two possible structures for AT2-Zn2+-AT2* were proposed as depicted in Figure 8A and Figure S22A (SI).
Between them, the preferred complex model (Figure 8A) possessed a larger overlapping percentile of anthracene (>60%) than that of excimer and the unconventional complex model (Figure S22A; SI) (displays < 30% overlapping of anthracene). DFT-optimized structures of both preferred and unconventional models are shown in Figure 7B and Figure S22B (SI), correspondingly. As seen in Figure 8C,D, electrostatic potential (ESP) of the AT2-probe showed the electron cloud located over anthracene moiety, which was delocalized over the complex center in the preferred complex model of AT2-Zn2+-AT2*. The HOMO, LUMO, and band gap (Eg) of the AT2-probe were calculated as −6.02 eV, −2.91 eV, and 3.11 eV, respectively, as depicted in Figure 8E. Likewise, HOMO, LUMO, and Eg for the formed preferred excimer complex were established as −5.84 eV, −3.01 eV, and 2.83 eV, individually, as shown in Figure 8F. All the HOMOs (at 0, −1, and −2 levels) and LUMOs (at 0, +1, and +2 levels) of AT2-probe and the preferred complex model of AT2-Zn2+-AT2* were displayed in Figures S23 and S24 (SI). Compared to the preferred model, the unconventional complex model had HOMO, LUMO, and Eg of −5.69 eV, −2.64 eV, and 3.05 eV, correspondingly, as seen in Figure S25 and Table S2 (SI). Since Eg of above model did not show any significant change, therefore, it was named as the unconventional one. HOMO, HOMO-1, HOMO-2, LUMO, LUMO+1, and LUMO+2 of the unconventional complex model are shown in Figure S25 (SI). As shown in Figure S26 (SI), Zn2+---S and Zn2+---N bond lengths were found to be 2.36 Å and 2.20 Å for the preferred complex and 2.50 Å and 2.09 Å for the unconventional model, respectively. The above observations on bond-lengths are consistent with the earlier pyrene-based report [15], which also clarified the preferred complex model. For Tyrosine-based reversibility, HOMOs and LUMOs of Tyrosine-Zn2+ optimized model were adopted from the earlier report [15]. DFT-based optimizations of AT2 and AT2-Zn2+-AT2* (preferred and conventional models) are also conducted in ACN, DMSO, and ethanol phases, which revealed similar results and support gas phase investigations as summarized in Table S2 (SI). From the DFT studies, it was noted that, during the initial phase, AT2-probe triggered the photo-induced electron transfer (PET) between anthracene to phenyl ring attached in the triazole unit, however, this process was inhibited during the Zn2+ coordination. After adding Tyrosine, PET was reactivated due to the effective coordination of Tyrosine to Zn2+. Thereby, PET “On-Off-On” mechanism was proposed for the AT2-based sensors. In other words, electron transfer was initially allowed between HOMO and HOMO-1 of AT2 but was prohibited between HOMO-1 and LUMO due to larger Eg of AT2 (3.11 eV). On the contrary, electron transfer was allowed between HOMO-1 and LUMO and prohibited between HOMO and HOMO-1 levels in the AT2 + Zn2+ complex. Due to lower Eg of AT2-Zn2+-AT2* (2.83 eV), these transferred/excited electrons quickly decayed to HOMO level, thereby enhancing photoluminescence intensity. AT2-probe was restored by adding Tyrosine to extract Zn2+ from AT2-Zn2+-AT2* complex via the PET “On-Off-On” mechanism. In the AIEE studies, increasing fw induced AT2-AT2* formation and prohibited the PET/TICT of the AT2-probe supported by RIR. Thus, the PET “On-Off” mechanism is responsible for the AIEE of AT2. Based on the results in earlier reports [3,15] and UV-Vis and PL measurements in this study, the formation of J-type aggregation in AIEE is well-attested.
Thereby, based on UV-Vis/PL and DFT interrogations, the PET “On-Off-On” and the PET “On-Off” mechanisms are proposed for the AT2-based sensors and AIEE, respectively, as displayed in Figure 9A,B. The optical properties, HOMOs, LUMOs, Eg, Фf values, and TRPL constants for the AT2-based sensors and AIEE are delivered in Table 1.

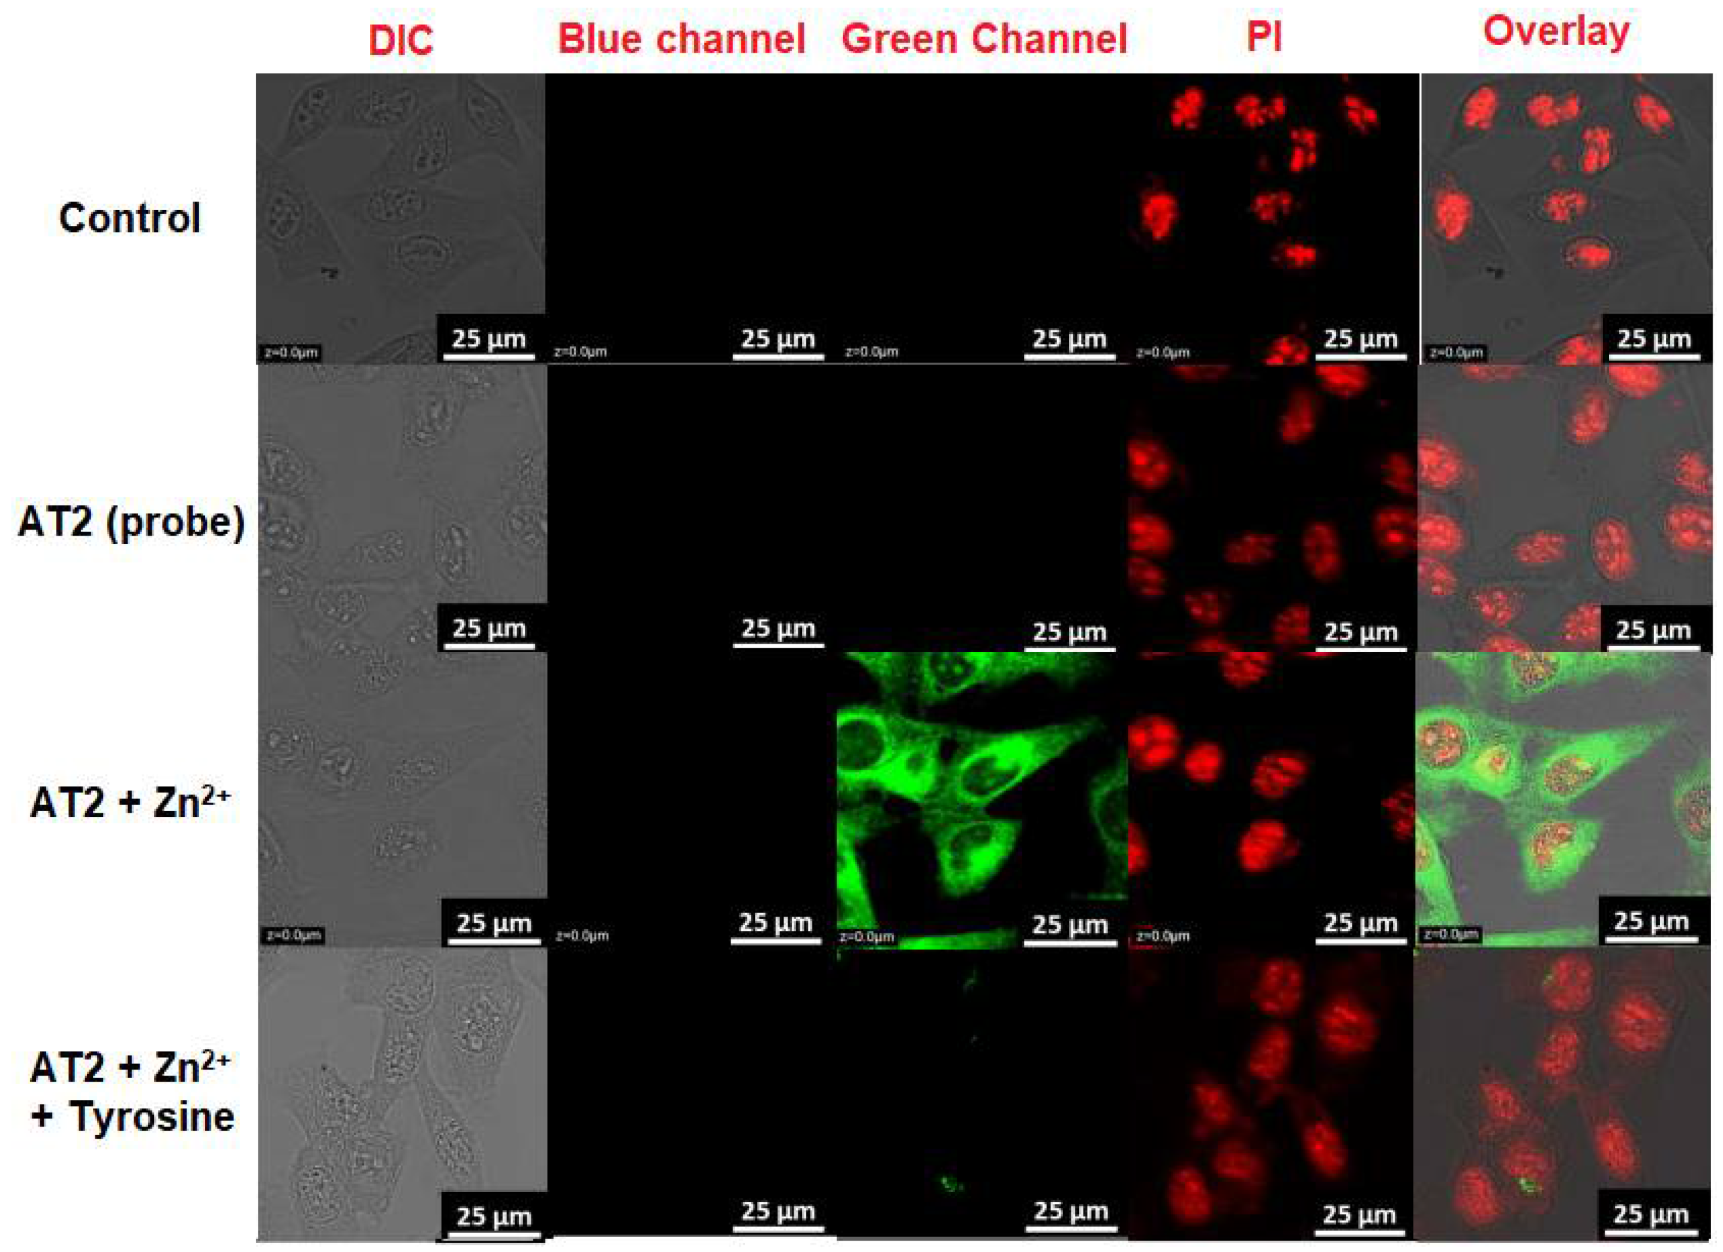
3.9. MTT Assay and Bioimaging

Bioimaging capability of AT2 towards AIEE and sensory studies (Zn2+ and Tyrosine detection) were established from in-vitro/in-vivo (live cell/zebra fish) imaging interrogations. Methyl thiazolyl tetrazolium (MTT) assay was carried out to examine cytotoxicity and 50% cell survival (IC50) of AT2. Upon incubation at diverse concentrations of AT2 (0, 20, 40, 60, 80 and 100 µM, respectively), exceptional viability (>75%) was demonstrated even at 80 µM concentration, as seen in Figure S27A (SI). Likewise, IC50 value was determined as 149 µM (Figure S27B; SI) based on cytotoxic measurements, which confirmed the biocompatibility of AT2. After six hours’ incubation of AT2 in the B16-F10 cell line, blue emissive cell lines with a PI-dye overlay were observed as seen in Figure S28 (SI). In fact, the existing water content inside cell lines induced AIEE of AT2, therefore, blue emissive images were visualized. Due to a weaker AIEE effect than that of the pyrene-based probe (PT2) [15], cellular incubation after one hour did not display any emission, which was also supported by sensory-cellular imaging studies. However, these observations well-demonstrated the AIEE-based in-vitro imaging studies of AT2.
In the presence of Zn2+ with AT2, the incubated B16-F10 cell lines displayed a strong green channel image, however, the green color disappeared via incubating with Tyrosine as depicted in Figure 10. The complete disappearance of the green channel image in the presence of Tyrosine suggested the reversibility of the AT2 probe. Due to the weak AIEE effect of AT2, no blue emission could be observed. According to the earlier reports [59,60], it was noted that B16-F10 cell lines could release the Tyrosine via a time-dependent incubation. During the time-dependent incubation of AT2 + Zn2+, the green channel images were observed to vanish gradually by means of intercellular Tyrosine release (see Figure S29; SI). These observations also suggested feasible Tyrosine-Zn2+ complex formation via trapping Zn2+ from AT2 + Zn2+ complex and recovering back to the AT2 probe subsequently. From time-dependent cellular imaging studies, it can be concluded that the B16-F10 cell lines released Tyrosine slowly so that AT2 was able to display green emission in the beginning. However, cells with excess Tyrosine may hinder the AT2 to Zn2+ complex via strong affinity of Tyrosine to Zn2+. Thus, cellular imaging studies of AT2 to Zn2+ were limited by the Tyrosine concentrations in cell lines. In the following, the in-vivo imaging capability of AT2 to Zn2+ and Tyrosine were demonstrated via zebrafish imaging studies. 3-day old embryos of zebrafish were firstly incubated with Zn2+ (50 µM) for 30 min, which did not show any fluorescence in blue or green channels. A strong green fluorescence was observed, as shown in Figure 11, after adding AT2 followed by incubating for 20 min. After incubating these zebrafish samples with Tyrosine for 20 min, the green channel fluorescence began to fade and finally turned into a mild blue channel fluorescence due to the AIEE of AT2. In zebrafish samples with higher fw, the blue emissive channel of AIEE could be observed within 1.5 h. From both cellular and zebrafish imaging studies, it was concluded that AT2 could be effectively used in AIEE, Zn2+, and the Tyrosine sensor tuned in-vitro/in-vivo imaging studies. Similar to cellular imaging studies, zebrafish imaging was also limited by Tyrosine concentrations. In-vivo samples/tissues with excess initial Tyrosine concentrations could affect Zn2+ imaging by AT2, therefore, careful monitoring on primary Tyrosine concentrations was mandatory. Finally, the use and performance of AT2-probe towards Zn2+ and Tyrosine detection were reliable and comparable to earlier reports [38,42,43,44,59,60,61,62,63,64,65,66,67,68,69,70,71,72] in terms of linear range, LODs and applications as displayed in Tables S3 and S4 (SI). Note that AT2-based sequential detection of Zn2+ and Tyrosine was considered as exceptional in terms of one-pot synthesize, linear range nanomolar LODs, and bioimaging applications.

4. Conclusions

An anthracene-based Schiff base probe (4-(anthracen-9-ylmethylene) amino)-5-phenyl-4H-1,2,4-triazole-3-thiol; AT2) was synthesized via one-pot reaction and its AIEE and PL “Off-On-Off” sensory utilities to Zn2+ and Tyrosine were systematically demonstrated. In the AIEE, the red-shifted UV-vis/PL peaks of AT2 (in ethanol) with increasing fw (0–97.5%) confirmed the J-type aggregation via AT2-AT2* excimer formation. Furthermore, AT2 (in ethanol) revealed highly selective sensitivity to Zn2+ (0.5 equiv.) via “Turn-On” green emission, which was restored with Tyrosine (0.5 equiv.) via displaying the “Turn-Off” emission of the probe. From the Job plot, HR-mass, 1H-NMR, and DFT studies, the binding modes, 2:1 and 1:1 stoichiometry of AT2-Zn2+-AT2* excimer and Tyrosine + Zn2+ complexes were clearly justified. Uniqueness of sensory responses was further supported by TRPL and pH-effect investigations. By means of standard deviation and linear fittings, association constants of AT2 to Zn2+ and Tyrosine to Zn2+ were determined as 2.28 × 10⁻⁶ M−2 and 1.39 × 10⁻⁷ M−1, respectively. Individual titrations of AT2 with Zn2+ and Tyrosine exhibited a linear regression between 0–35 µM and LODs of 179 nM and 667 nM (by 3σ/slope), correspondingly. From SEM, TEM, AFM, and DLS interrogations, the nano-morphological changes authenticated AT2 as a nanoprobe. The involvement of PET “On-Off-On” in Zn2+ and Tyrosine detection were verified by DFT studies. Similarly, feasible “On-Off” PET/TICT, and an RIR mechanism in AIEE were proposed based on UV/PL results. Moreover, adopting AT2-based AIEE and its sensors (towards Zn2+ and Tyrosine) in cellular and zebrafish imaging studies authenticated the potential in-vitro and in-vivo applications in many biological samples. However, the initial excess Tyrosine concentrations in cells or tissues may have affected Zn2+ selectivity by AT2 via direct Tyrosine-Zn2+ coordination, therefore, careful optimization was mandatory. Finally, optimizations of AT2-based OTFT devices for detection of Zn2+ and Tyrosine in solid state are currently under research.

Supplementary Materials

The following supporting information can be downloaded at: https://www.mdpi.com/article/10.3390/chemosensors10100381/s1, Figures S1–S29: The UV/PL, NMR, Mass, HR-DFT, TRPL, SEM, TEM, AFM, DLS, MTT assay and bioimages are available; Tables S1–S4: TRPL, DFT and comparative accounts are delivered.

Author Contributions

Conceptualization, methodology, data curation, formal analysis, investigation and writing—original draft, M.S.; Bioimaging analysis N.T.; DFT optimization studies B.A.; TRPL investigations, K.A.; writing—review and editing, supervision, project administration, and funding acquisition, K.W.S.; Supervision and validation of bioimaging analysis, S.-P.W.; Supervision and validation of DFT optimization, M.-C.L.; Supervision and validation of TRPL investigations, N.O. All authors have read and agreed to the published version of the manuscript.

Funding

This research was funded by the Ministry of Science and Technology of Taiwan under the contract Nos. MOST 110-2112-M-A49-029-; MOST 110-2811-M-A49-543; MOST 111-2112-M-A49-031- and MOST 111-2811-M-A49-528.

Institutional Review Board Statement

Not applicable.

Informed Consent Statement

Not applicable.

Data Availability Statement

Data are contained within the article.

Conflicts of Interest

The authors declare no conflict of interest.

References

  1. Harathi, J.; Thenmozhi, K. AIE-Active Schiff Base Compounds as Fluorescent Probes for the Highly Sensitive and Selective Detection of Fe3+ Ions. Mater. Chem. Front. 2020, 4, 1471–1482. [Google Scholar] [CrossRef]
  2. Jia, J.; Zhao, H. A Multi-Responsive AIE-Active Tetraphenylethylene-Functioned Salicylaldehyde-Based Schiff Base for Reversible Mechanofluorochromism and Zn2+ and CO32− Detection. Org. Electron. 2019, 73, 55–61. [Google Scholar] [CrossRef]
  3. Shellaiah, M.; Simon, T.; Srinivasadesikan, V.; Lin, C.-M.; Sun, K.W.; Ko, F.-H.; Lin, M.-C.; Lin, H.-C. Novel Pyrene Containing Monomeric and Dimeric Supramolecular AIEE Active Nano-Probes Utilized in Selective “Off–On” Trivalent Metal and Highly Acidic pH Sensing with Live Cell Applications. J. Mater. Chem. C 2016, 4, 2056–2071. [Google Scholar] [CrossRef]
  4. Shellaiah, M.; Sun, K.-W. Pyrene-Based AIE Active Materials for Bioimaging and Theranostics Applications. Biosensors 2022, 12, 550. [Google Scholar] [CrossRef] [PubMed]
  5. Wang, M.; Lu, L.; Song, W.; Wang, X.; Sun, T.; Zhu, J.; Wang, J. AIE-Active Schiff Base Compounds as Fluorescent Probe for the Highly Sensitive and Selective Detection of Al3+ Ions. J. Lumin. 2021, 233, 117911. [Google Scholar] [CrossRef]
  6. Yuan, B.; Wang, D.-X.; Zhu, L.-N.; Lan, Y.-L.; Cheng, M.; Zhang, L.-M.; Chu, J.-Q.; Li, X.-Z.; Kong, D.-M. Dinuclear HgII Tetracarbene Complex-Triggered Aggregation-Induced Emission for Rapid and Selective Sensing of Hg2+ and Organomercury Species. Chem. Sci. 2019, 10, 4220–4226. [Google Scholar] [CrossRef]
  7. Neupane, L.N.; Oh, E.-T.; Park, H.J.; Lee, K.-H. Selective and Sensitive Detection of Heavy Metal Ions in 100% Aqueous Solution and Cells with a Fluorescence Chemosensor Based on Peptide Using Aggregation-Induced Emission. Anal. Chem. 2016, 88, 3333–3340. [Google Scholar] [CrossRef] [PubMed]
  8. Zheng, H.-W.; Kang, Y.; Wu, M.; Liang, Q.-F.; Zheng, J.-Q.; Zheng, X.-J.; Jin, L.-P. ESIPT-AIE Active Schiff Base Based On 2-(2′-hydroxyphenyl)benzo-thiazole Applied as Multi-Functional Fluorescent Chemosensors. Dalton Trans. 2021, 50, 3916–3922. [Google Scholar] [CrossRef] [PubMed]
  9. Wang, D.; Li, S.-J.; Cao, W.; Wang, Z.; Ma, Y. ESIPT-Active 8-Hydroxyquinoline-Based Fluorescence Sensor for Zn(II) Detection and Aggregation-Induced Emission of the Zn(II) Complex. ACS Omega 2022, 7, 18017–18026. [Google Scholar] [CrossRef] [PubMed]
  10. Simon, T.; Shellaiah, M.; Srinivasadesikan, V.; Lin, C.-C.; Ko, F.-H.; Sun, K.W.; Lin, M.-C. Novel Anthracene- and Pyridine-Containing Schiff Base Probe for Selective “Off–On” Fluorescent Determination of Cu2+ Ions Towards Live Cell Application. New J. Chem. 2016, 40, 6101–6108. [Google Scholar] [CrossRef]
  11. Li, Y.; Zhong, H.; Huang, Y.; Zhao, R. Recent Advances in AIEgens for Metal Ion Biosensing and Bioimaging. Molecules 2019, 24, 4593. [Google Scholar] [CrossRef] [PubMed]
  12. Sun, H.; Jiang, Y.; Nie, J.; Wei, J.; Miao, B.; Zhao, Y.; Zhang, L.; Ni, Z. Multifunctional AIE-ESIPT Dual Mechanism Tetraphenylethene-Based Schiff Base for Inkless Rewritable Paper and A Colorimetric/Fluorescent Dual-Channel Zn2+ Sensor. Mater. Chem. Front. 2021, 5, 347–354. [Google Scholar] [CrossRef]
  13. Han, T.; Gu, X.; Lam, J.W.Y.; Leung, A.C.S.; Kwok, R.T.K.; Han, T.; Tong, B.; Shi, J.; Dong, Y.; Tang, B.Z. Diaminomaleonitrile-Based Schiff Bases: Aggregation-Enhanced Emission, Red Fluorescence, Mechanochromism and Bioimaging Applications. J. Mater. Chem. C 2016, 4, 10430–10434. [Google Scholar] [CrossRef]
  14. Rullyani, C.; Shellaiah, M.; Ramesh, M.; Lin, H.-C.; Chu, C.-W. Pyrene-SH Functionalized OTFT for Detection of Hg2+ Ions in Aquatic Environments. Org. Electron. 2019, 69, 275–280. [Google Scholar] [CrossRef]
  15. Shellaiah, M.; Chen, Y.-T.; Thirumalaivasan, N.; Aazaad, B.; Awasthi, K.; Sun, K.W.; Wu, S.-P.; Lin, M.-C.; Ohta, N. Pyrene-Based AIEE Active Nanoprobe for Zn2+ and Tyrosine Detection Demonstrated by DFT, Bioimaging, and Organic Thin-Film Transistor. ACS Appl. Mater. Interfaces 2021, 13, 28610–28626. [Google Scholar] [CrossRef] [PubMed]
  16. Okazawa, Y.; Kondo, K.; Akita, M.; Yoshizawa, M. Polyaromatic Nanocapsules Displaying Aggregation-Induced Enhanced Emissions in Water. J. Am. Chem. Soc. 2015, 137, 98–101. [Google Scholar] [CrossRef] [PubMed]
  17. Wu, L.; Liu, J.; Li, P.; Tang, B.; James, T.D. Two-Photon Small-Molecule Fluorescence-Based Agents for Sensing, Imaging, and Therapy within Biological Systems. Chem. Soc. Rev. 2021, 50, 702–734. [Google Scholar] [CrossRef]
  18. Bresolí-Obach, R.; Nos, J.; Mora, M.; Sagristà, M.L.; Ruiz-González, R.; Nonell, S. Anthracene-Based Fluorescent Nanoprobes for Singlet Oxygen Detection in Biological Media. Methods 2016, 109, 64–72. [Google Scholar] [CrossRef] [PubMed]
  19. Ayyavoo, K.; Velusamy, P. Pyrene Based Materials as Fluorescent Probes in Chemical and Biological Fields. New J. Chem. 2021, 45, 10997–11017. [Google Scholar] [CrossRef]
  20. Wu, X.; Mao, Y.; Wang, D.; Huang, Q.; Yin, Q.; Zheng, M.; Hu, Q.; Wang, H. Designing A Colorimetric Sensor Containing Nitrogen and Oxygen Atoms for Uranyl Ions Identification: Chromatic Mechanism, Binding Feature and on-Site Application. Sens. Actuators B 2020, 307, 127681. [Google Scholar] [CrossRef]
  21. Shellaiah, M.; Wu, Y.-H.; Lin, H.-C. Simple Pyridyl-Salicylimine-Based Fluorescence “Turn-On” Sensors for Distinct Detections of Zn2+, Al3+ and OH Ions in Mixed Aqueous Media. Analyst 2013, 138, 2931–2942. [Google Scholar] [CrossRef]
  22. Uzun, K.; Sayın, S.; Tamer, Ö.; Çevik, U. Comparison of Charge Transport and Opto-Electronic Properties of Pyrene and Anthracene Derivatives for OLED Applications. J. Mol. Model. 2021, 27, 174. [Google Scholar] [CrossRef] [PubMed]
  23. Singh, S.; Gupta, D.; Antony, B.; Tudorovskaya, M.; Tennyson, J. Electron Scattering Cross Sections for Anthracene and Pyrene. J. Phys. Chem. A 2020, 124, 7088–7100. [Google Scholar] [CrossRef] [PubMed]
  24. Shellaiah, M.; Wu, Y.-H.; Singh, A.; Ramakrishnam Raju, M.V.; Lin, H.-C. Novel Pyrene- and Anthracene-Based Schiff Base Derivatives as Cu2+ and Fe3+ Fluorescence Turn-on Sensors and for Aggregation Induced Emissions. J. Mater. Chem. A 2013, 1, 1310–1318. [Google Scholar] [CrossRef]
  25. Wei, X.; Liu, J.; Xia, G.-J.; Deng, J.; Sun, P.; Chruma, J.J.; Wu, W.; Yang, C.; Wang, Y.-G.; Huang, Z. Enantioselective Photoinduced Cyclodimerization of A Prochiral Anthracene Derivative Adsorbed on Helical Metal Nanostructures. Nature Chem. 2020, 12, 551–559. [Google Scholar] [CrossRef] [PubMed]
  26. Wang, Z.; Zhang, Y.; Song, J.; Li, M.; Yang, Y.; Gu, W.; Xu, X.; Xu, H.; Wang, S. A Highly Specific and Sensitive Turn-On Fluorescence Probe for Hypochlorite Detection Based on Anthracene Fluorophore and Its Bioimaging Applications. Dyes Pig. 2019, 161, 172–181. [Google Scholar] [CrossRef]
  27. Maret, W. Zinc in Cellular Regulation: The Nature and Significance of “Zinc Signals”. Int. J. Mol. Sci. 2017, 18, 2285. [Google Scholar] [CrossRef]
  28. Hara, T.; Takeda, T.-a.; Takagishi, T.; Fukue, K.; Kambe, T.; Fukada, T. Physiological Roles of Zinc Transporters: Molecular and Genetic Importance in Zinc Homeostasis. J. Physiol. Sci. 2017, 67, 283–301. [Google Scholar] [CrossRef]
  29. Krężel, A.; Maret, W. The Biological Inorganic Chemistry of Zinc Ions. Arch. Biochem. Biophys. 2016, 611, 3–19. [Google Scholar] [CrossRef] [PubMed]
  30. Jurowski, K.; Szewczyk, B.; Nowak, G.; Piekoszewski, W. Biological Consequences of Zinc Deficiency in the Pathomechanisms of Selected Diseases. J. Biol. Inorg. Chem. 2014, 19, 1069–1079. [Google Scholar] [CrossRef] [Green Version]
  31. Du, K.; Liu, M.-Y.; Zhong, X.; Wei, M.-J. Decreased Circulating Zinc Levels in Parkinson’s Disease: A Meta-Analysis Study. Sci. Rep. 2017, 7, 3902. [Google Scholar] [CrossRef] [PubMed]
  32. Dell’Aquila, C. Development of A Method for the Detection of Zinc in Brassica Oleracea using Solid Phase Extraction and Size-Exclusion Chromatography Inductively Coupled Plasma Mass Spectrometry (SEC-ICP-MS). MethodsX 2021, 8, 101428. [Google Scholar] [CrossRef] [PubMed]
  33. Sharanov, P.Y.; Volkov, D.S.; Alov, N.V. Quantification of Elements in Copper–Zinc Ores at Micro- and Macro-Levels by Total Reflection X-Ray Fluorescence and Inductively Coupled Plasma Atomic Emission Spectrometry. Anal. Methods 2019, 11, 3750–3756. [Google Scholar] [CrossRef]
  34. Rajabi, M.; Asemipour, S.; Barfi, B.; Jamali, M.R.; Behzad, M. Ultrasound-Assisted Ionic Liquid Based Dispersive Liquid–Liquid Microextraction and Flame Atomic Absorption Spectrometry of Cobalt, Copper, and Zinc in Environmental Water Samples. J. Mol. Liq. 2014, 194, 166–171. [Google Scholar] [CrossRef]
  35. Shellaiah, M.; Sun, K.W. Diamond-Based Electrodes for Detection of Metal Ions and Anions. Nanomaterials 2022, 12, 64. [Google Scholar] [CrossRef]
  36. Lu, J.; Qin, Y.; Wu, Y.; Meng, M.; Yan, Y.; Li, C. Recent Advances in Ion-Imprinted Membranes: Separation and Detection Via Ion-Selective Recognition. Environ. Sci. Water Res. Technol. 2019, 5, 1626–1653. [Google Scholar] [CrossRef]
  37. Xu, Z.; Yoon, J.; Spring, D.R. Fluorescent Chemosensors for Zn2+. Chem. Soc. Rev. 2010, 39, 1996–2006. [Google Scholar] [CrossRef]
  38. Liu, P.; Han, X.-F.; Wu, W.-N.; Wang, Y.; Fan, Y.-C.; Zhao, X.-L.; Xu, Z.-H. A Water Soluble Hydrazone Probe for Subsequent Fluorescent Detection of Zn2+ and S2− in Neat Aqueous Solution and Imaging in Mitochondria of Living Cells. J. Mol. Struct. 2022, 1249, 131629. [Google Scholar] [CrossRef]
  39. Koide, S.; Sidhu, S.S. The Importance of Being Tyrosine: Lessons in Molecular Recognition from Minimalist Synthetic Binding Proteins. ACS Chem. Biol. 2009, 4, 325–334. [Google Scholar] [CrossRef]
  40. Boni, C.; Laudanna, C.; Sorio, C. A Comprehensive Review of Receptor-Type Tyrosine-Protein Phosphatase Gamma (PTPRG) Role in Health and Non-Neoplastic Disease. Biomolecules 2022, 12, 84. [Google Scholar] [CrossRef]
  41. Dinu, A.; Apetrei, C. A Review of Sensors and Biosensors Modified with Conducting Polymers and Molecularly Imprinted Polymers Used in Electrochemical Detection of Amino Acids: Phenylalanine, Tyrosine, and Tryptophan. Int. J. Mol. Sci. 2022, 23, 1218. [Google Scholar] [CrossRef] [PubMed]
  42. Yadav, P.K.; Upadhyay, R.K.; Kumar, D.; Bano, D.; Chandra, S.; Jit, S.; Hasan, S.H. Synthesis of Green Fluorescent Carbon Quantum Dots from the Latex of Ficus Benghalensis for the Detection of Tyrosine and Fabrication of Schottky Barrier Diode. New J. Chem. 2021, 45, 12549–12556. [Google Scholar] [CrossRef]
  43. Chen, H.-Y.; Yeh, Y.-C. Detection of Tyrosine and Monitoring Tyrosinase Activity using An Enzyme Cascade-Triggered Colorimetric Reaction. RSC Adv. 2020, 10, 29745–29750. [Google Scholar] [CrossRef] [PubMed]
  44. Feng, D.-Q.; Liu, G.; Ma, G.; Nan, Z.; Wang, W. Phosphodiesters Quaternary Ammonium Nanoparticles as Label-Free Light Scattering Probe for Turn-Off Detection of Tyrosine. Spectrochim. Acta A 2019, 208, 1–6. [Google Scholar] [CrossRef]
  45. Bellomo, E.; Abro, A.; Hogstrand, C.; Maret, W.; Domene, C. Role of Zinc and Magnesium Ions in the Modulation of Phosphoryl Transfer in Protein Tyrosine Phosphatase 1B. J. Am. Chem. Soc. 2018, 140, 4446–4454. [Google Scholar] [CrossRef]
  46. Zhang, H.-L.; Wang, X.-C.; Liu, R. Zinc in Regulating Protein Kinases and Phosphatases in Neurodegenerative Diseases. Biomolecules 2022, 12, 785. [Google Scholar] [CrossRef]
  47. Bellomo, E.; Massarotti, A.; Hogstrand, C.; Maret, W. Zinc Ions Modulate Protein Tyrosine Phosphatase 1B Activity. Metallomics 2014, 6, 1229–1239. [Google Scholar] [CrossRef]
  48. Frisch, M.J.; Trucks, G.W.; Schlegel, H.B.; Scuseria, G.E.; Robb, M.A.; Cheeseman, J.R.; Scalmani, G.; Barone, V.; Petersson, G.A.; Nakatsuji, H.; et al. Gaussian 16, rev. C.01; Gaussian, Inc.: Wallingford, CT, USA, 2016. [Google Scholar]
  49. Becke, A.D. Density-Functional Exchange-Energy Approximation with Correct Asymptotic Behavior. Phys. Rev. A 1988, 38, 3098–3100. [Google Scholar] [CrossRef]
  50. Lee, C.; Yang, W.; Parr, R.G. Development of the Colle-Salvetti Correlation-Energy Formula into a Functional of the Electron Density. Phys. Rev. B 1988, 37, 785–789. [Google Scholar] [CrossRef]
  51. Shellaiah, M.; Simon, T.; Venkatesan, P.; Sun, K.W.; Ko, F.-H.; Wu, S.-P. Cysteamine-Modified Diamond Nanoparticles Applied in Cellular Imaging and Hg2+ Ions Detection. Appl. Surf. Sci. 2019, 465, 340–350. [Google Scholar] [CrossRef]
  52. Shellaiah, M.; Awasthi, K.; Chandran, S.; Aazaad, B.; Sun, K.W.; Ohta, N.; Wu, S.-P.; Lin, M.-C. Methylammonium Tin Tribromide Quantum Dots for Heavy Metal Ion Detection and Cellular Imaging. ACS Appl. Nano Mater. 2022, 5, 2859–2874. [Google Scholar] [CrossRef]
  53. Awasthi, K.; Chang, F.-L.; Hsieh, P.-Y.; Hsu, H.-Y.; Ohta, N. Characterization of Endogenous Fluorescence in Nonsmall Lung Cancerous Cells: A Comparison with Nonmalignant Lung Normal Cells. J. Biophoton. 2020, 13, e201960210. [Google Scholar] [CrossRef] [PubMed]
  54. Shellaiah, M.; Chen, T.H.; Simon, T.; Li, L.-C.; Sun, K.W.; Ko, F.-H. An Affordable Wet Chemical Route to Grow Conducting Hybrid Graphite-Diamond Nanowires: Demonstration by A Single Nanowire Device. Sci. Rep. 2017, 7, 11243. [Google Scholar] [CrossRef]
  55. Shellaiah, M.; Thirumalaivasan, N.; Sun, K.W.; Wu, S.-P. A pH Cooperative Strategy for Enhanced Colorimetric Sensing of Cr(III) Ions using Biocompatible L-Glutamic Acid Stabilized Gold Nanoparticles. Microchem. J. 2021, 160, 105754. [Google Scholar] [CrossRef]
  56. Shellaiah, M.; Rajan, Y.C.; Balu, P.; Murugan, A. A Pyrene Based Schiff Base Probe for Selective Fluorescence Turn-On Detection of Hg2+ Ions with Live Cell application. New J. Chem. 2015, 39, 2523–2531. [Google Scholar] [CrossRef]
  57. Shellaiah, M.; Sun, K.W. Review on Sensing Applications of Perovskite Nanomaterials. Chemosensors 2020, 8, 55. [Google Scholar] [CrossRef]
  58. Shellaiah, M.; Simon, T.; Thirumalaivasan, N.; Sun, K.W.; Ko, F.-H.; Wu, S.-P. Cysteamine-Capped Gold-Copper Nanoclusters for Fluorometric Determination and Imaging of Chromium(VI) and Dopamine. Microchim. Acta 2019, 186, 788. [Google Scholar] [CrossRef]
  59. Li, Z.; Wang, Y.-F.; Zeng, C.; Hu, L.; Liang, X.-J. Ultrasensitive Tyrosinase-Activated Turn-On Near-Infrared Fluorescent Probe with a Rationally Designed Urea Bond for Selective Imaging and Photodamage to Melanoma Cells. Anal. Chem. 2018, 90, 3666–3669. [Google Scholar] [CrossRef]
  60. Jung, E.; Shim, I.; An, J.; Ji, M.S.; Jangili, P.; Chi, S.-G.; Kim, J.S. Phenylthiourea-Conjugated BODIPY as an Efficient Photosensitizer for Tyrosinase-Positive Melanoma-Targeted Photodynamic Therapy. ACS Appl. Bio Mater. 2021, 4, 2120–2127. [Google Scholar] [CrossRef]
  61. Savastano, M.; Fiaschi, M.; Ferraro, G.; Gratteri, P.; Mariani, P.; Bianchi, A.; Bazzicalupi, C. Sensing Zn2+ in Aqueous Solution with a Fluorescent Scorpiand Macrocyclic Ligand Decorated with an Anthra-cene Bearing Tail. Molecules 2020, 25, 1355. [Google Scholar] [CrossRef] [Green Version]
  62. Kim, J.H.; Noh, J.Y.; Hwang, I.H.; Kang, J.; Kim, J.; Kim, C. An Anthracene-Based Fluorescent Chemosensor for Zn2+. Tetrahed. Lett. 2013, 54, 2415–2418. [Google Scholar] [CrossRef]
  63. Nguyen, M.-H.; Nguyen, T.-N.; Do, D.-Q.; Nguyen, H.-H.; Phung, Q.-M.; Thirumalaivasan, N.; Wu, S.-P.; Dinh, T.-H. A Highly Selective Fluorescent Anthracene-Based Chemosensor for Imaging Zn2+ in Liv-ing Cells and Zebrafish. Inorg. Chem. Commun. 2020, 115, 107882. [Google Scholar] [CrossRef]
  64. Ghosh Dastidar, D.; Mukherjee, P.; Ghosh, D.; Banerjee, D. Carbon Quantum Dots Prepared from Onion Extract as Fluorescence Turn-On Probes for Selective Estimation of Zn2+ in Blood Plasma. Colloids Surf. A 2021, 611, 125781. [Google Scholar] [CrossRef]
  65. Wang, B.; Liang, Z.; Tan, H.; Duan, W.; Luo, M. Red-Emission Carbon Dots-Quercetin Systems as Ratiometric Fluorescent Nanoprobes Towards Zn2+ and Adenosine Triphosphate. Microchim. Acta 2020, 187, 345. [Google Scholar] [CrossRef] [PubMed]
  66. Li, D.; Ma, Y.; Duan, H.; Jiang, F.; Deng, W.; Ren, X. Fluorescent/SERS Dual-Sensing and Imaging of Intracellular Zn2+. Anal. Chim. Acta 2018, 1038, 148–156. [Google Scholar] [CrossRef] [PubMed]
  67. Lee, N.; Ly, N.H.; Kim, J.S.; Jung, H.S.; Joo, S.-W. A Selective Triarylmethine-Based Spectroscopic Probe for Zn2+ Ion Monitoring. Dyes Pig. 2019, 171, 107721. [Google Scholar] [CrossRef]
  68. Fu, J.; Yao, K.; Li, B.; Mei, H.; Chang, Y.; Xu, K. Coumarin-Based Colorimetric-Fluorescent Sensors for the Sequential Detection of Zn2+ Ion and Phosphate Anions and Applications in Cell Imaging. Spectrochim. Acta A 2020, 228, 117790. [Google Scholar] [CrossRef]
  69. Dervin, S.; Ganguly, P.; Dahiya, R.S. Disposable Electrochemical Sensor Using Graphene Oxide–Chitosan Modified Carbon-Based Electrodes for the Detection of Tyrosine. IEEE Sensors J. 2021, 21, 26226–26233. [Google Scholar] [CrossRef]
  70. Shi, L.; Zhang, Z.; Zhang, L.; Tian, Y. Electrochemical Detection of Tyrosinase in Cell Lysates at Functionalized Nanochannels via Amplifying of Ionic Current Response. Electroanalysis 2022, 34, 1021–1026. [Google Scholar] [CrossRef]
  71. Li, Y.; Cai, N.; Wang, M.; Na, W.; Shi, F.; Su, X. Fluorometric Detection of Tyrosine and Cysteine Using Graphene Quantum dots. RSC Adv. 2016, 6, 33197–33204. [Google Scholar] [CrossRef]
  72. Zou, H.-Y.; Lu, X.-Y.; Kong, F.-Y.; Wang, Z.-X.; Li, H.-Y.; Fang, H.-L.; Wang, W. A Voltammetric Sensor Based on Reduced Graphene Oxide-Hemin-Ag Nanocomposites for Sensitive Determination of Tyrosine. RSC Adv. 2020, 10, 28026–28031. [Google Scholar] [CrossRef] [PubMed]
Figure 1. TOC schematic of AT2-based AIEE (at 0–97.5% fw), Zn2+ and Tyrosine sensors, TICT/PET involvement, nano-morphological changes and in-vitro/in-vivo (B16-F10 cellular and zebrafish) imaging applications described in this article.
Chemosensors 10 00381 g001
Scheme 1. Synthetic route of AT2.
Chemosensors 10 00381 sch001
Figure 2. (A) PL spectra of AT2 (50 µM in ethanol; λex = 418 nm) representing the aggregation-induced emission enhancement (AIEE) as a function of water fraction (fw) in %; (B) Fluorescence quantum yield (Φf) changes corresponding to AIEE of AT2; (C) photograph representing the AIEE of AT2 (50 µM in ethanol) from 0–97.5% fw under UV-lamp (λex = 365 nm).
Chemosensors 10 00381 g002
Figure 3. (A) PL selectivity of AT2 (50 µM in ethanol; λex = 418 nm) towards metal ions (25 µM in water); (B) PL spectra (λex = 418 nm) representing reversibility of AT2 + Zn2+ complex to Tyrosine (25 µM in water).
Chemosensors 10 00381 g003
Figure 4. Photographic images under UV lamp (λex = 365 nm) display (A) Selectivity of AT2 (50 µM in ethanol) to 25 µM of metal ions (10 mM stock solution in water); (B) Reversibility of AT2 + Zn2+-(C) in the presence of amino acids (25 µM from 10 mM stock solution in water).
Chemosensors 10 00381 g004
Figure 5. (A) PL spectral changes for AT2 (50 µM in ethanol; λex = 418 nm) titrated with 0–35 µM of Zn2+ in water (Inset: PL changes at 520 nm as a function of Zn2+ concentration); (B) PL spectral changes for AT2 + Zn2+ (50 µM + 25 µM in ethanol; λex = 418 nm) titrated with 0–35 µM of Tyrosine in water (Inset: PL changes at 520 nm as a function of tyrosine concentration); (C,D) Linear regression plots and calculated LODs of AT2 and AT2 + Zn2+ towards Zn2+ and Tyrosine evaluated from their respective titrations (A and B; n = 3).
Chemosensors 10 00381 g005
Figure 6. SEM images of (A) AT2 probe; (B) AT2@60% fw; (C) AT2 + Zn2+ and (D) AT2 + Zn2+ + Tyrosine; Scale bars: 1 µm, 10 µm, 1 µm and 1 µm, respectively.
Chemosensors 10 00381 g006
Figure 7. TEM images of (A) AT2 probe; (B) AT2@60% fw; (C) AT2 + Zn2+ and (D) AT2 + Zn2+ + Tyrosine; Scale bars: images (A,C) are at 100 nm and images (B,D) are at 200 nm scales, respectively.
Chemosensors 10 00381 g007
Figure 8. (A) Proposed preferred complex model of AT2-Zn2+-AT2*; (B) DFT-optimized structure for preferred complex model of AT2-Zn2+-AT2* (Colour representation; faded blue-hydrogen, green-carbon, sky blue-zinc, yellow-sulfur and pink-nitrogen); (C) Electrostatic potential of the AT2 probe; (D) Electrostatic potential of the AT2-Zn2+-AT2* preferred complex; (E) HOMO and LUMO of the AT2 probe; (F) HOMO and LUMO of AT2-Zn2+-AT2* preferred complex (All the DFT simulations were performed by B3LYP/6 − 31 + G(d,p) in gas phase and for panels (CF) the colour representation as follows; Grey-carbon; white-hydrogen; yellow-sulfur; blue-nitrogen; gentian-zinc).
Chemosensors 10 00381 g008
Figure 9. (A) Schematic illustration of AT2-AT2* excimer tuned J-aggregate formation with respect to 0–97.5% fw via the PET “On-Off” mechanism and Zn2+ induced AT2-AT2* excimer formation and its reversibility with Tyrosine via the PET “On-Off-On” mechanism; (B) HOMO, LUMO-based illustration of the PET “On-Off-On” mechanism for AT2-Zn-AT2* excimer formation and its reversibility with Tyrosine.
Chemosensors 10 00381 g009
Figure 10. Cellular images of AT2 probe, AT2 + Zn2+, and AT2 + Zn2+ + Tyrosine; Cell line: B16-F10; Scale bar: 25 µm.
Chemosensors 10 00381 g010
Figure 11. Zebra fish imaging of AT2 probe, AT2 + Zn2+, and AT2 + Zn2+ + Tyrosine; Scale bar: 750 µm.
Chemosensors 10 00381 g011
Table 1. HOMOs, LUMOs, band gaps, and optical properties of probe AT2 and its AIEE and sensory complexes.
CompositionHOMO (eV)LUMO (eV)Band Gap (eV)λabs (nm)λem (nm)Φfτ (ns)
Probe AT2−6.02−2.913.113964560.008 a0.1001
AT2@60% fWNDNDND4074700.142 a0.2021
AT2 + Zn2+−5.84 b−3.01 b2.83 b4015200.103 a0.2329
−5.69 c−2.64 c3.05c
AT2 + Zn2+ + TyrNDNDND3965200.011 a0.1003
Tyr + Zn2+−5.47 d−2.70 d2.77dNDNDNDND
ND: Not detected: a Fluorescein in ethanol (Φf = 0.79) was used as a standard reference; b DFT-optimized data for preferred complex model; c DFT-optimized data for unconventional complex model; d DFT-optimized HOMO, LUMO, and bandgap data were obtained from Ref. [15].
Publisher’s Note: MDPI stays neutral with regard to jurisdictional claims in published maps and institutional affiliations.

