Article

Sensitive Determination of Moxifloxacin HCl in Pharmaceuticals or Human Plasma Using Luminescence or Eye Vision

by
Gasser M. Khairy
1,*,
Zaitona A. Abd El-Naby
2,
Alaa M. A. Elgindy
2,
Axel Duerkop
3,* and
Eman A. Abdel Hameed
4
1
Chemistry Department, Faculty of Science, Suez Canal University, Ismailia 41522, Egypt
2
Pharmaceutical Analytical Chemistry, Faculty of Pharmacy, Suez Canal University, Ismailia 41522, Egypt
3
Institute of Analytical Chemistry, Chemo and Biosensors, Faculty of Chemistry and Pharmacy, University of Regensburg, 93053 Regensburg, Germany
4
Analytical Chemistry Department, Faculty of Pharmacy, Port Said University, Port Said 42511, Egypt
*
Authors to whom correspondence should be addressed.
Chemosensors 2022, 10(10), 378; https://doi.org/10.3390/chemosensors10100378
Submission received: 12 August 2022 / Revised: 15 September 2022 / Accepted: 19 September 2022 / Published: 21 September 2022
(This article belongs to the Section Optical Chemical Sensors)

Abstract

:
A new probe based on the complex of 1,2 dihydro-2-oxoquinoloine-4-carboxylic acid (DOCA) as a ligand with Europium (III) ion was developed for the quantitation of Moxifloxacin HCl (Moxi.HCl) in pharmaceuticals and human plasma using a luminescence method. The metal to ligand ratio of the complex is 1:2 as determined by a Job plot. The determination of Moxi.HCl is based on static quenching of the luminescence of the probe upon coordination of Moxi.HCl. The negative value for ΔG proves that this reaction is spontaneous. The calibration curve was constructed based on a Stern–Volmer equation and the quantitation range was 0.05–80 µg mL−1. This is low enough to determine the drug in blood plasma, even hours after administration, which is not feasible with the methods published so far. The LOD was 15 ng mL−1. The accuracy of the method was demonstrated by good recoveries of spiking experiments in tablets, ophthalmic eyedrops and human blood plasma, where the mean recovery was 99% with RSDs below 5%. The method was validated by closely matching concentrations of the drug found in all these real samples by HPLC. Additionally, Moxi.HCl can be assessed semi-quantitatively by eye vision upon excitation with a UV lamp at 365 nm by a gradual color shift from red to blue with increasing concentrations of Moxi.HCl.

1. Introduction

Moxifloxacin Hydrochloride (Moxi.HCl) is an antibiotic used to treat respiratory diseases such as sinus catarrh, acute episodes of acute cough, influenza, dermatology diseases, and tuberculosis [1,2,3]. In addition, Moxi.HCl is antibacterial and binds to the DNA gyrase enzyme of bacteria leading to inhibition of the replication of DNA and cell death [4]. The therapeutic benefits of Moxi.HCl have attracted a lot of attention, and the number of its pharmaceutical dosage forms has increased recently. For the evaluation of pharmaceutical formulations containing Moxi.HCl, no approved (pharmacopeia) procedures have been reported [5]. Various approaches have been applied for determination of Moxi.HCl in its pure form, pharmaceutical dosage forms, and biological fluids such as spectrophotometry [6,7,8,9,10], chromatography [11,12], electrochemistry [13,14], and atomic absorption spectrometry (AAS) [15,16]. Absorption spectroscopic approaches have many limitations, including lower selectivity due to the required detection wavelengths in the UV and a more complex sample pretreatment (e.g., liquid–liquid extraction, heating or precipitation) [15,17,18,19,20,21,22,23,24]. Chromatography and AAS have acceptable detection limits and large linear ranges but require expensive analytical instrumentation. Additionally, sample collection, preparation, and transportation may be time-consuming and prone to error.
Therefore, a simple, quick, and sensitive analytical approach is needed to regularly test for Moxi.HCl in various pharmaceutical dosage forms. Chemosensors fulfill these requirements. There are several benefits to using chemosensors over other approaches. Optical chemosensors using photoluminescence can provide high selectivity and sensitivity due to the molecular design. Additionally, lower detection limits can be achieved because the detected signal is proportional to the analyte concentration and intensity of the excitation source, unlike in photometry, where the negative log of a signal ratio is proportional to analyte concentration. Thus, by providing a chemosensor (or probe) with a suitable binding constant, high molar absorbance and high quantum yield, a fast response and real-time monitoring in real samples become feasible. Spectrofluorimetric approaches became the standard method for assessing diverse pharmaceuticals in various dosage forms and biological samples because they are currently performed in a high-throughput microtiter plate format where 96 or more samples are detected within minutes, which increases reproducibility by the testing of multiple replicates per sample [25,26].
Luminescent probes seem to be the best option among the numerous detection methods because of their high sensitivity, selectivity, direct detection capability, and rapid reaction time [27]. The emission intensity and absorption coefficients of the Eu(III) ion are low. Lehn [28] discovered that lanthanide complexes with an organic ligand possess remarkable photophysical features that qualify them for usage as light conversion molecular devices (LCMDs). These organic ligands act as sensitizers to enhance the population of the excited state of the lanthanide ion and Lehn referred to these ligands as “antennas” [28]. Following the light absorption of the excitation energy by the ligand the excitation energy is intramolecularly transferred to the Ln(III) ion, resulting in an amplified population of the excited state and a concomitant rise of luminescence intensity of the Ln(III) ion. Europium complexes have therefore received increased interest owing to their intense emission, caused by a strong luminescence due to hypersensitive f–f transition with a large Stokes shift as well as a long lifetime [28,29,30]. Additionally, the emission maximum around 615 nm is in the longwave range of the visible light where the co-absorption and luminescence background of real samples (e.g., in blood plasma) are significantly lower. These unique characteristics permitted the preparation of luminescent Eu(III) probes with high sensitivity.
In the present work, an accurate and precise spectrofluorimetric method was developed for sensing Moxi.HCl based on an Eu(III)-DOCA complex as a probe. The proposed method is the first based on a lanthanide probe and lanthanide luminescence. It uses quenching of the luminescence of the Eu(III) complex upon interaction with Moxi.HCl. In addition, this method provides an eye-vision readout upon excitation with a UV lamp with 365 nm by shifting gradually from red to blue. Upon reacting with the probe with increasing concentrations of Moxi.HCl, the red emission of the Eu(III)-(DOCA)2 complex at 612 nm is statically quenched. The quantitation range is wide and reaches so low that, unlike with methods published so far, the drug can be determined in blood plasma hours after administration. The proposed method was effectively applied to real samples, e.g., pharmaceuticals and human plasma, and the method accuracy was validated by HPLC. Hence, the new method is versatile, cost-effective, and more sensitive than prior spectrophotometric techniques.

2. Materials and Methods

2.1. Materials and Solutions

EuCl3⋅6 H2O was purchased from Sigma-Aldrich. (www.sigmaaldrich.com, accessed on 1 June 2021). The 2-oxo-1,2-dihydroquinoline-4-carboxylic acid (DOCA) was from Alfa Aesar. (www.alfa.com, accessed on 14 February 2020). Moxifloxacin HCl (Moxi.HCl) was from EGPI. (www.egyptiangroup.net, accessed on 24 January 2020). The chemical structures of the ligand and antibiotic are provided in Scheme S1 (see Supplementary Material). All solvents used were of analytical grade. The stock solutions were prepared as follows: 1.00 × 10⁻³ M of EuCl3⋅6 H2O (0.00366 g in 10.00 mL of bidistilled water), 1.00 × 10⁻³ M of Moxi.HCl (0.00438 g in 10.00 mL of methanol) and 1.00 × 10⁻³ M of DOCA (0.00189 g in 10.00 mL of ethanol). The working solutions were freshly prepared in appropriate solvents. Pharmaceutical samples were purchased and obtained as the following: Advancrib® tablets (batch No.042) (Egyptian Group for Pharmaceutical Industries E.G.P.I, El Obour City, Cairo, Egypt)) containing 400 mg Moxi.HCl, Vigamox® ophthalmic solution (Alcon Company, Cairo, Egypt) contain 0.5% Moxi.HCl as the base, Moxavidex® tablet (Utopia Pharmaceuticals, Cairo, Egypt) containing 400 mg Moxi.HCl.

2.2. Instruments

The UV–Vis spectra were acquired on a Shimadzu UV-1800 UV/Visible Spectrophotometer (https://www.shimadzu.com, accessed on 5 May 2017) in quartz cells with 1.000 cm path length. The luminescence spectra were recorded with a Jasco 6300 spectrofluorometer (https://jascoinc.com, accessed on 8 September 2010) with quartz cells of 1.000 cm path length and a 150 W xenon lamp for excitation. The sensitivity was medium. The excitation/emission bandwidths were 5 nm.
HPLC measurements were performed on an Agilent 1220 Infinity LC system (G4294B configuration; Agilent Technologies, Santa Clara, CA, USA), which consisted of a diode array detector (DAD), a dual solvent delivery system and an autosampler. The separation was carried out on a C18 thermo column (4.6 × 250 mm, 5 µm particle size). The mobile phase was prepared by isocratic elution, mixing 20 mM NaH2PO4⋅2H2O: ethanol with a ratio of 75:25, v/v (the pH was adjusted to 5 using NaOH). The flow rate was 1 mL min−1. All separations were accomplished at room temperature. The volume of the injection was 20 µL. The detector was set to λ = 350 nm. Data acquisition was performed on Class-VP software.

2.3. Sample Preparation

To prepare the real samples from tablets (that contain 400 mg Moxi.HCl for each tablet), 20 tablets of each commercial product were separately weighed and powdered. 10.00 mg for each tablet sample was accurately weighed and placed in a 10.00 mL volumetric flask. It was dissolved in methanol using an ultrasonic bath for 5 min and then filtrated. The filtrate solution was completed to 100.0 mL with methanol.
To prepare the ophthalmic samples (Vigamox eye drops were labeled to contain 0.5% of Moxi.HCl) 200 µL of the eye drop formulation were injected into a 10.00 mL volumetric flask and then the volume was completed with methanol to the mark. For the plasma sample, two volunteers were administered a 400 mg Advancrib tablet after fasting overnight. After 4 h, a blood sample (5 mL) was drawn in a tube containing heparin as an anticoagulant from two healthy volunteers. Approval of the ethic commission of the Suez Canal University was provided for this experiment. For plasma separation, the tube was centrifuged for 10 min at 9400 g. 1 mL of extracted human plasma was mixed with 1 mL of methanol. Then, this mixture was centrifuged at 9400 g for 30 min. The supernatant was separated and collected for analysis using the luminescent probe and HPLC.

2.4. Quantification of Moxi.HCl

For determination of Moxi.HCl, aliquots of working solutions of Moxi.HCl were pipetted into 10.00 mL volumetric flasks, after which 100 µL of 1 mM Eu(III)-(DOCA)2 were added. Then, the solutions were diluted to the mark with ethanol. The concentration range of Moxi.HCl was 0–100 µg mL−1. The solutions were measured at room temperature, and the average luminescence intensity (n = 3) was measured at a fixed wavelength of 612 nm and at λexc = 330 nm.
A standard addition method was utilized for the quantitation of Moxi.HCl in pharmaceutical formulations and human plasma. Increasing quantities of Moxi.HCl (0, 5, 10, and 20 µg mL−1) were added to a volumetric flask that contained a fixed amount of Eu(III)-complex as a probe and a diluted solution of the extracted sample (200-fold for tablets or eye drops and 10-fold for human plasma samples). The volume was filled to 10.00 mL with ethanol. Then, the solutions were measured under the same previous conditions.

3. Results and Discussion

3.1. Interaction of Eu (III) with 1,2 Dihydro-2-Oxoquinoloine-4-Carboxylic Acid (DOCA)

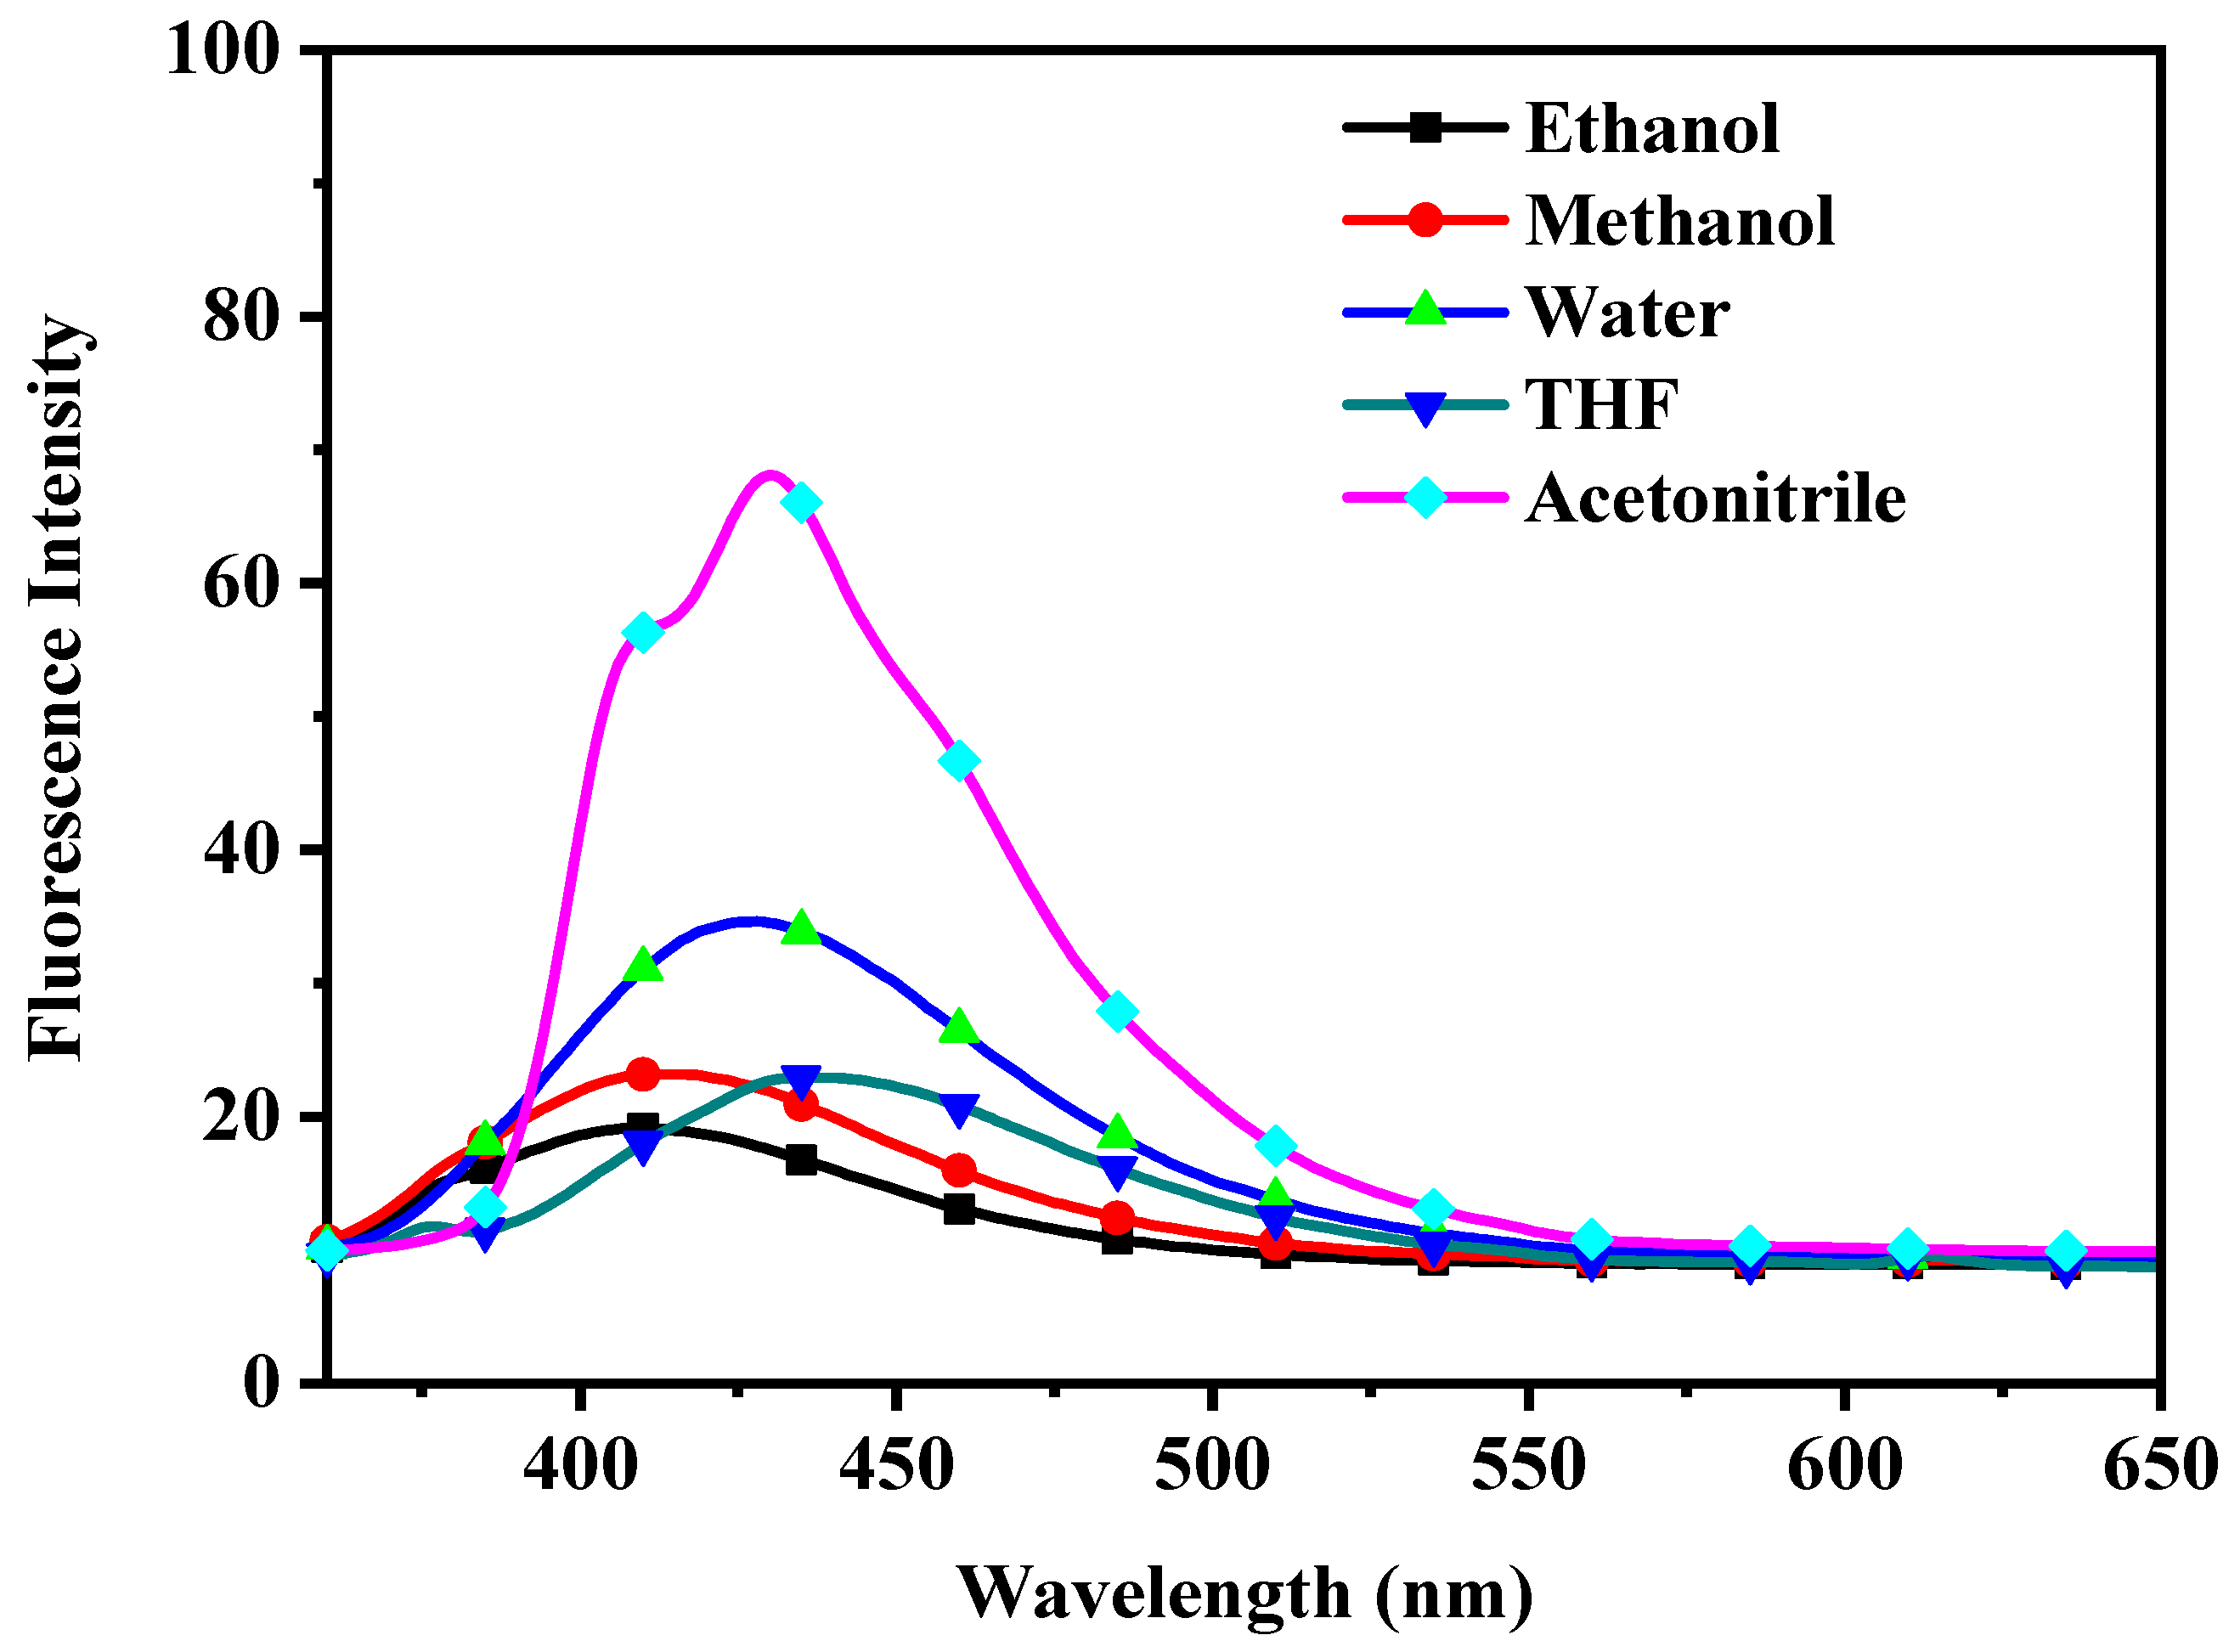
3.1.1. UV–Vis Spectroscopy

The absorption spectra of the 2-oxo-1,2-dihydroquinoline-4-carboxylic acid (DOCA) in the presence and absence of Eu(III) were recorded, as shown in Figure 1. The absorption spectrum of DOCA showed three absorption bands at 229, 282, and 330 nm, respectively. The band at 229 nm is due to the σ–π* transitions with an extinction coefficient of 29,200 ± 300 M−1 cm−1, while the bands at 282 and 330 nm (similar to [7,8]) are due to the π–π* and n–π* transitions (ε282 nm = 7050 ± 120 M−1 cm−1, ε330 nm = 6765 ± 100 M−1 cm−1). The absorption spectra of DOCA in the presence of Eu(III) showed a decrease in the absorbance of the previous three bands with a redshift for the band at 330 nm to 343 nm. In contrast, the bands at 229 and 282 nm remain unchanged, revealing the binding between DOCA and the Eu(III) ion and formation of a complex [31]. The molar absorbance of the probe at 343 nm was calculated to be 8800 ± 150 M−1 cm−1. The complex was stable for one week, as tested using a UV–Vis spectrophotometer.

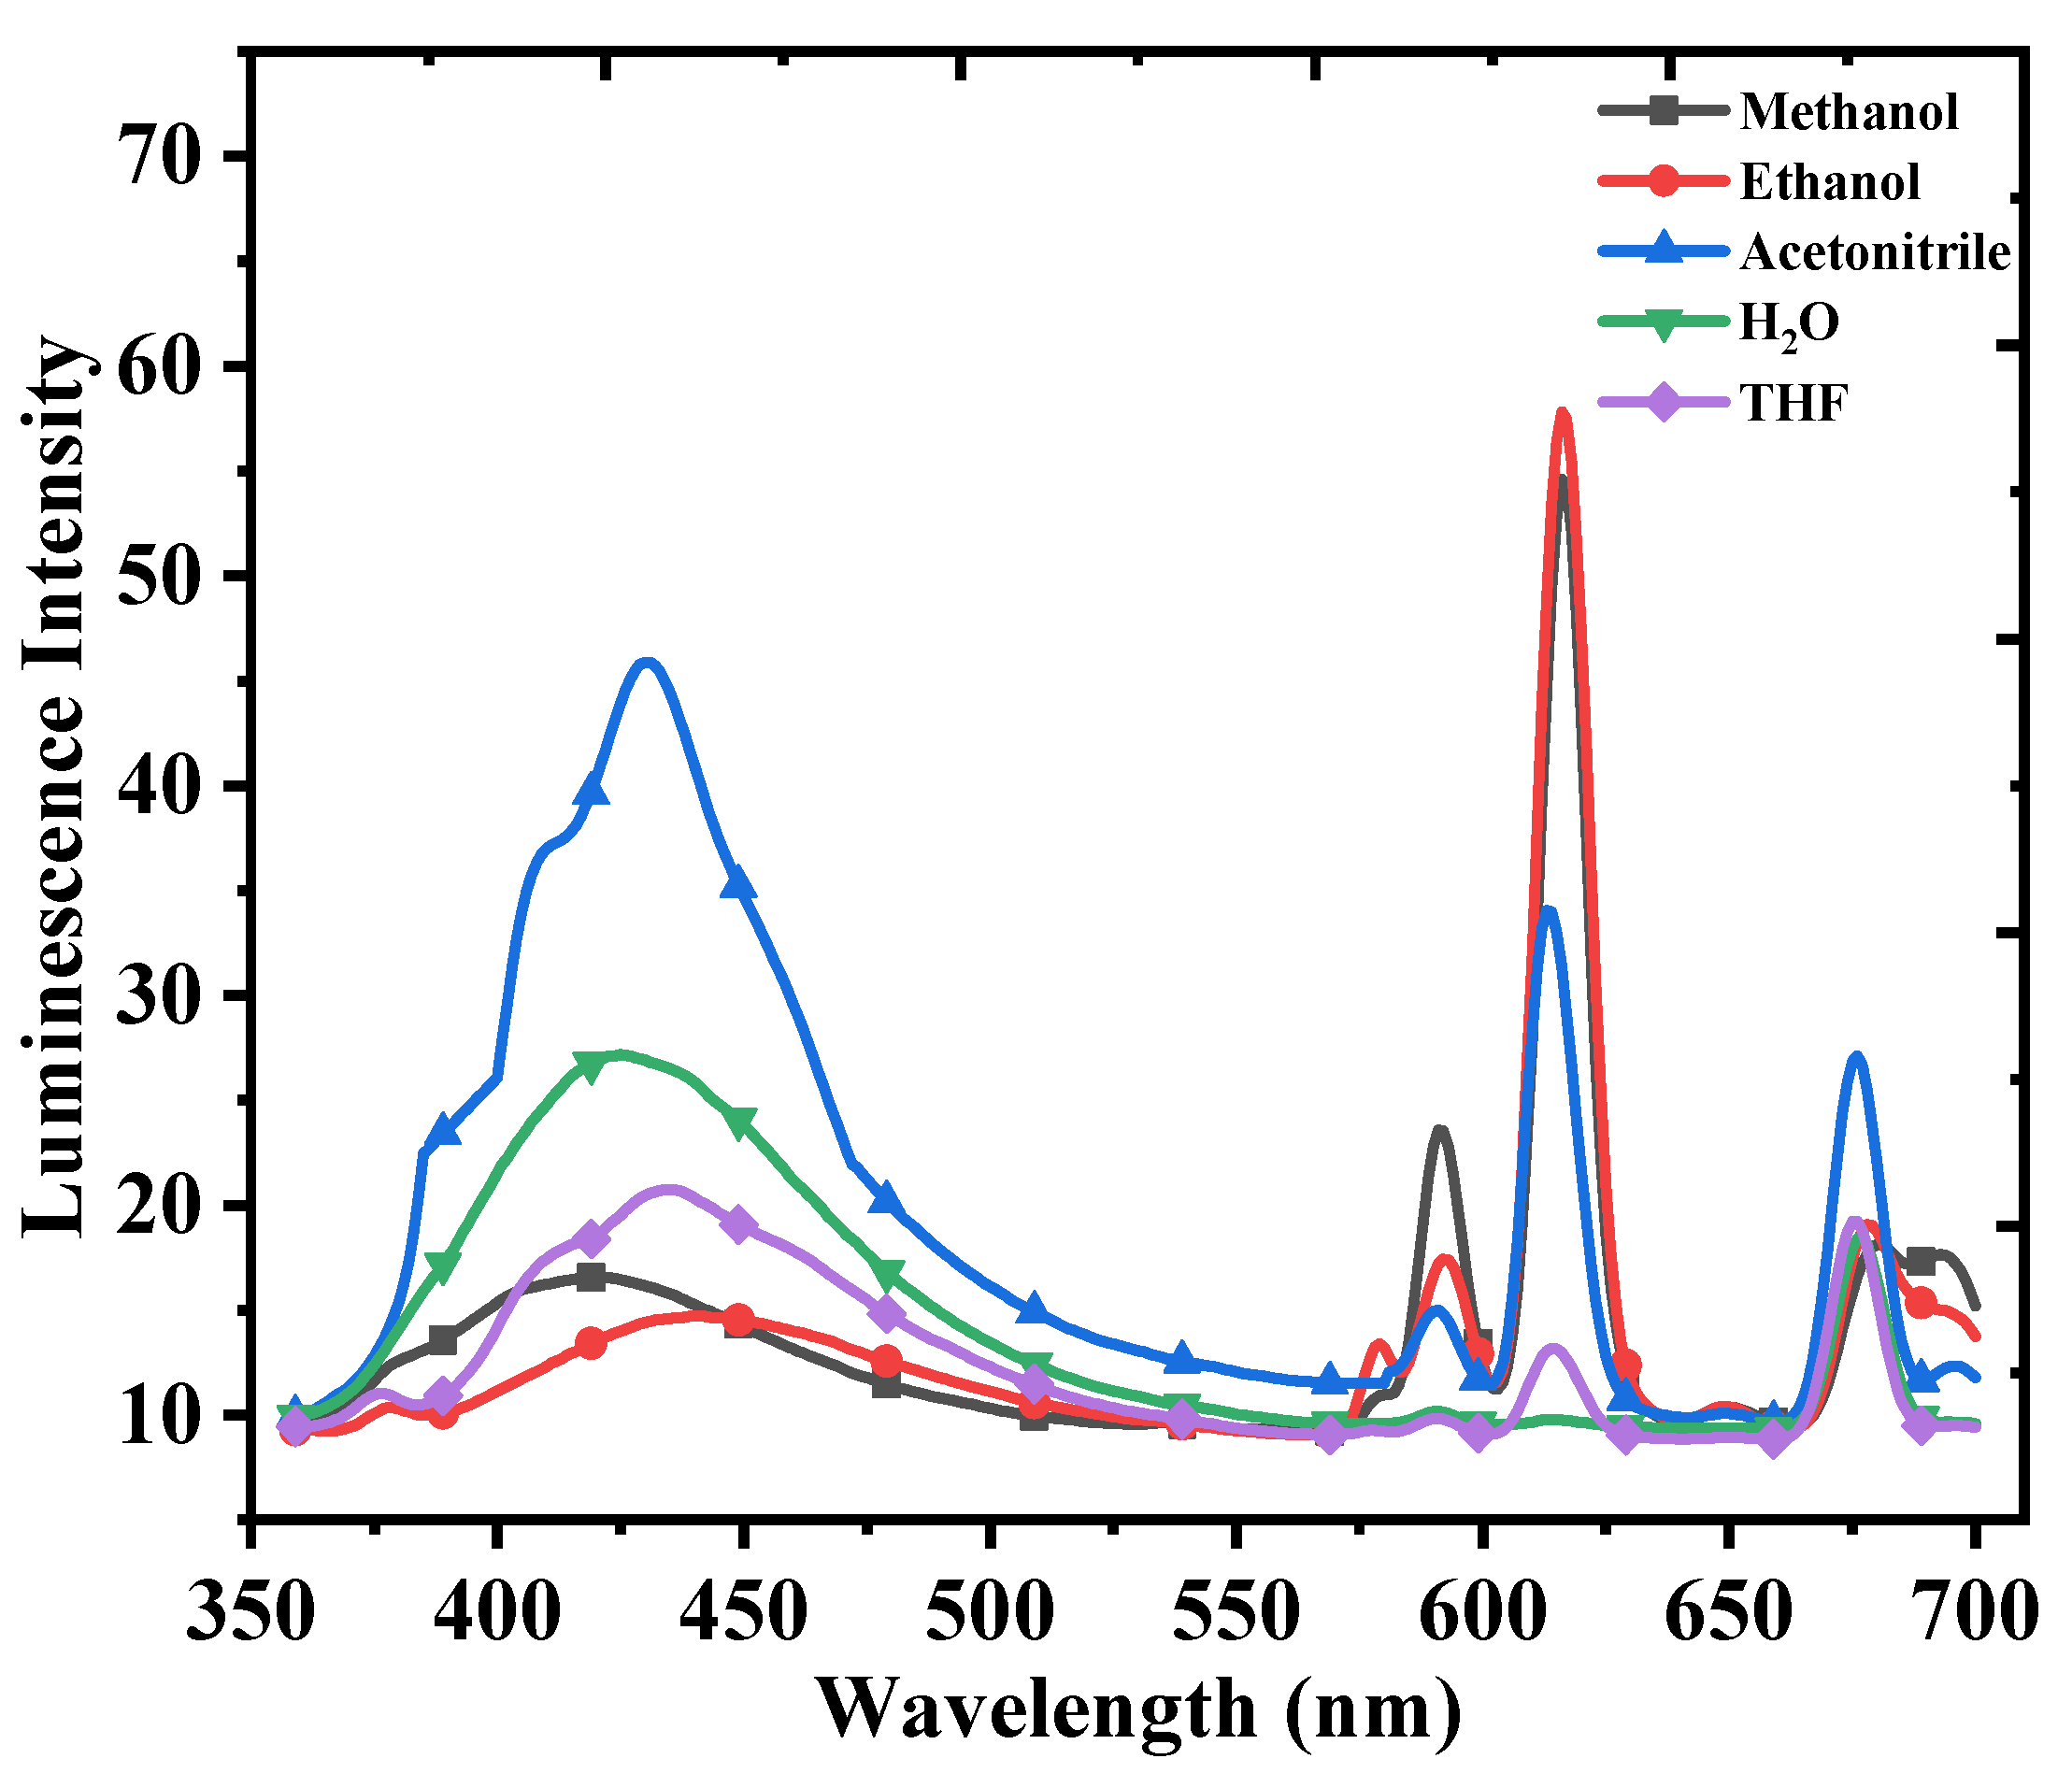
3.1.2. Luminescence Spectroscopy

Solvents significantly impact the luminescence intensity of the 1,2 dihydro-2-oxoquinoloine-4-carboxylic acid (DOCA), as shown in Figure 2. The luminescence spectra of DOCA showed an emission band with a maximum at 410, 411, 420, 430, and 435 nm for ethanol, methanol, water, acetonitrile, and THF, respectively. The strongest intensity was found in acetonitrile, while the lowest intensity was recorded in ethanol. Here, the difference in solvation between the ground and excited states of DOCA molecules determines the wavelength of the emission maxima. The blue shift of the maximum occurs with a higher ground state solvation than the solvation of the excited state of the drug molecules, as in the case of ethanol. Alternatively, a red shift in the spectra occurs if the solvation of the excited state is larger than the solvation of the ground state, as shown in the case of THF (see Figure 2) [32,33].
The solvent effect on the emission of the Eu(III)-(DOCA)2 probe is shown in Figure 3. The luminescence spectra of the probe showed three main emission bands characteristic of the Eu(III) ion at 590 nm, 612 nm and 675 nm, which correspond to the 5D0 → 7F1, 5D0 → 7F2 and 5D0 → 7F4 transitions, respectively. The emission intensity at 612 nm was superior to that at 590 nm. The emission intensity of the Eu(III)-(DOCA)2 complex was strongest in ethanol, while the bands almost disappeared in water due to quenching. The emission intensity of the probe at 612 nm was found to decrease in the following order: ethanol ≥ methanol > acetonitrile > THF > H2O. This can be explained using the antenna effect theory [30]. The emission of a lanthanide complex depends on the energy gap between the triplet level of the ligand and the emission level of the lanthanide ion, which sequentially impacts the efficiency of the intramolecular energy transfer from the ligand to the lanthanide metal ion. In organic solvents, this energy gap is lower, while the non-radiative energy transfer to water is a well-known major source of the quenching of lanthanide emission in water [34].

3.1.3. The Stoichiometry of Probe

A Job plot was used to determine the stichometry of the complex formed between Eu(III) and DOCA. First, a series of mixtures with varying mole fractions of DOCA and Eu(III) ion were prepared, and the luminescence intensity of each mixture was determined. Then, a Job plot was constructed, as illustrated in Figure S1. It is obvious from the plot that the maximum intensity of the luminescence occurs at a mole fraction of 0.33 of Eu(III). This finding reveals that one Eu(III) ion forms a complex with two molecules of DOCA, expressed as Eu(III)-(DOCA)2. According to the antenna theory [30], the emission of Eu(III) is enhanced by increasing the concentration of DOCA until the molar ratio [DOCA]/[Eu(III)] = 2:1, thus suggesting the formation of an Eu(III)-(DOCA)2 complex. By increasing the concentration of DOCA further, the emission intensity of Eu(III) is quenched by excess ligand molecules.

3.2. Moxifloxacin HCl Interaction with the Eu(III)-(DOCA)2 Complex

3.2.1. UV–Vis Absorption Spectroscopy, Luminescence and Investigation of Quenching Mechanism

UV–Vis absorption spectroscopy is a powerful technique for studying and investigating the mode of binding between the lanthanide complex and Moxi.HCl. Figure 4 shows the absorption spectra of the ligand, Moxi.HCl, the Eu(III)-(DOCA)2 complex, and Eu(III)-(DOCA)2-Moxi.HCl complex, respectively. The absorption spectra of Moxi.HCl exhibits two absorption bands [35]. Upon the addition of the Eu(III)-(DOCA)2 complex to Moxi.HCl, a blue shift of the absorption band of the drug from 296 nm to 291 nm with decreasing absorbance revealed the binding between the complex and the additional ligand. It was further observed that the longwave absorption band of the Eu(III)-(DOCA)2 complex shifted from 343 nm to 330 nm with increasing absorbance upon the addition of Moxi.HCl. This implies that a ligand displacement could occur from the complex by replacing DOCA with Moxi.HCl. Both the wavelength shifts and the changing absorbances of the related absorption bands of the DOCA ligand and Eu(III)-(DOCA)2 strongly point to the additional coordination of Moxi.HCl as an additional ligand to the Eu(III)-(DOCA)2 complex.
To evaluate the luminescence response of the Eu(III)-(DOCA)2 probe towards Moxi.HCl, a fixed concentration (10 µM) of the Eu(III)-(DOCA)2 complex was titrated against increasing concentrations of Moxi.HCl. (0, 0.05, 1, 5, 10, 20, 50, 80, 100 µg mL−1) in ethanol at ambient temperature. The emission spectra were acquired in triplicates using λexc = 330 nm. As seen in Figure 5A, Moxi.HCl quenches the luminescence of the probe at the hypersensitive 5D0 → 7F2 emission band of Eu(III) at 612 nm, while the emission band of the Moxi.HCl at 450 nm increases. The emission data at 612 nm were then analyzed using the Stern–Volmer equation:
F 0 F = 1 + K S V [ Q ]
Figure 5B shows that a graph of F0/F versus [Q] gives a straight line until a concentration of Moxi.HCl of 80 µg mL−1 is reached. This suggests that the quenching is static until a concentration of the drug of 80 µg mL−1. To further confirm the quenching mode, a temperature-dependent investigation of the quenching was conducted. We acquired Stern–Volmer plots at five different temperatures (see Figure 5C), which were found to be linear. It can be further observed that the slope of the plots of Eu(III)-(DOCA)2-Moxi.HCl luminescence (i.e., the KSV values) steadily decrease with increasing temperature (see Table 1). This translates into less quenching at higher temperature and is typical for static quenching because it involves the formation of a nonluminescent ground state complex between probe and quencher. Increasing temperature reduces complex stability, which is why a larger fraction of Eu(III)-(DOCA)2 is present at higher temperatures and correlates to the less quenching found [36]. This is a clear sign that Moxi.HCl acts as a static quencher of Eu(III)-(DOCA)2 luminescence, which is also termed chelation-enhanced luminescence quenching (CHEQ) [30]. A similar quenching behavior was observed upon the coordination of Moxi.HCl to Eu(tta)3 [37].

3.2.2. Binding Constant and Stoichiometry between Moxifloxacin HCl and Eu(III)-(DOCA)2 Complex

To evaluate the binding of the probe to Moxi.HCl, a fixed concentration (10 µM) of the Eu(III)-(DOCA)2 complex was titrated against increasing concentrations of Moxi.HCl. (0, 0.05, 1, 5, 10, 20, 50, 80, 100 µg mL−1) in ethanol at five temperatures. The binding constants (Ka) and a number of bindings (n) were evaluated using a double logarithmic Stern–Volmer equation:
log (F0F)/F = log Ka + n log [Moxi.HCl]
The values of Ka and n for the system under study at five temperatures were determined from the intercept and slope of the graph between log(F0F)/F versus log [Moxi.HCl] (Figure 5D). The data is shown in Table 1. It is clear from the data that the binding constants decreased upon an increase in the temperature, referring to the binding between the probe and drug getting disrupted with increasing temperature. Furthermore, the values of n were close to 1, indicating that one drug molecule was bound to one Eu(III)-(DOCA)2 complex.

3.2.3. Thermodynamic Parameters

The thermodynamic parameters for Eu(III)-(DOCA)2 -Moxi.HCl systems at five various temperatures (298, 303, 308, 313, and 318 K) were estimated by the following equations:
ln Ka = − ΔH/RT + ΔS/R
where R is the gas constant, T is the temperature in Kelvin, and Ka represents the binding constants just at the relevant temperature. Using
ΔG = ΔH-TΔS = −RT ln Ka
the entropy and enthalpy change of the studied system were determined via the intercept and slope of a plot of ln Ka versus 1/T (Figure 5E).
The thermodynamic data are presented in Table 1. It was found that ΔG as calculated for the Eu(III)-(DOCA)2-Moxi.HCl system at five different temperatures displayed a negative value, revealing that the interaction between the probe and Moxi.HCl was spontaneous. Similarly, the values of ΔS and ΔH were 61.94 J mol−1 K−1 and −6.66 kJ mol−1, respectively. The negative sign of the enthalpy change, and the positive value of the entropy change refer to that the reaction between the probe and drug is exothermic and the binding between them was mostly carried out by the electrostatic interactions between the probe and Moxi.HCl [38].

3.3. Visible Readout, Calibration Curve, and Limit of Detection for Moxifloxacin HCl

Under optimal parameters, the calibration curve for quantification of Moxi.HCl using our probe is expressed by the Stern–Volmer equation: F0/F = 1.11 + 0.075⋅[X] µg mL−1 (see Figure 5B), where F0 and F are the emission intensity of the probe at 612 nm in the absence and presence of Moxi.HCl, respectively, Ksv is the slope of the calibration plot equal to 0.075 mL µg−1, and [X] is the Moxi.HCl concentration in µg mL−1. The correlation coefficient (R2) is 0.9927, and the linear range is 0.05–80 µg mL−1. The LOD and LOQ are 0.015 µg mL−1 and 0.049 µg mL−1, respectively. The calibration plot for Moxi.HCl in ethanol was created using at least six successive concentrations with three repetitions. The linear quantitation range covers concentrations low enough to determine the drug in blood plasma, even hours after administration, which is not feasible with the methods published thus far (see Section 3.5 and [39]).
For a visible readout, Scheme 1 shows an image of a sensing microtiter plate that illustrates the color gradient that appears upon the reaction between the probe with different concentrations of Moxi.HCl upon excitation with UV light at 365 nm. A color change is visible by increasing the drug concentration from a deep red in the absence of Moxi.HCl over the red color, which decreased gradually after adding 0.01–5 µg mL−1 of Moxi.HCl. Then, a violet color appears as a transition at 10–20 µg/mL and changes into a deep blue at higher Moxi.HCl concentrations, then turns into bright blue at 60 µg mL−1 and higher concentrations. This corresponds well with the emission spectra shown in Figure 5A, where more blue light and less red europium emission is emitted at higher concentrations of Moxi.HCl. Hence, a visible, semi-quantitative estimation of Moxi.HCl in three concentration ranges with only a UV lamp as instrumentation is possible.
Table 2 summarizes the figures of merit of various techniques for the determination of Moxi.HCl. By comparing the previous methods to our proposed method, we observed that our approach is more sensitive than other methods. Furthermore, there is the capability of semi-quantitative evaluation of Moxi.HCl using eye vision. The detection limit attained by our approach is more than low enough for studying Moxi.HCl concentrations in pharmaceuticals and biological substances. Our proposed method has a more comprehensive linear range (more than three orders of magnitude) than the spectrophotometric and differential pulse polarography methods. As a result, most samples will not require additional dilution procedures. There are more sensitive methods available [39] that, e.g., combine solid phase extraction and LC/ESI-MS/MS. However, these require much more expensive instrumentation.

3.4. Interference Study

The luminescence response of the Eu(III)-(DOCA)2 complex was examined in the presence of both of the various potential interferents (primarily as used in pharmaceutical formulations) and the Moxi.HCl antibiotic (5 μg mL−1). The interferents studied were anhydrous lactose, boric acid, lactose monohydrate, Avicel PH101 (microcrystalline cellulose), iron oxide red, talc (hydrated magnesium silicate), titanium dioxide, magnesium stearate, croscarmellose sodium salt, polyethylene glycol (PEG 6000), Polyvinylpyrrolidone (PVP K30), hydroxypropyl methyl cellulose (HPMC E5; molecular weight = 10,000) and HPMC E15 (molecular weight = 13,000). The tolerance limit was set at the highest concentration of interferents yielding an inaccuracy of ±10.0%. The results are summarized in Table S1 and show no significant interferences of common formulation agents.

3.5. Determination of Moxi.HCl in Real Samples

The proposed method was then used to determine the concentration of moxifloxacin hydrochloride in five real samples. Among them, there were two plasma samples from healthy volunteers administered a 400 mg Advancrib tablet after fasting overnight and three pharmaceuticals (Vigamox ophthalmic drops, Moxavidex and Advancrib tablets). The samples were collected as described in Section 2.3, and the concentration of Moxi.HCl was determined using the Eu(III)-(DOCA)2-probe as outlined in Section 2.4. For validation, Moxi.HCl was additionally determined in these samples by HPLC as per the description in Section 2.2. The results are presented in Table 3, and show a good agreement of the concentrations of the antibiotic found with both methods within their standard deviations. For clinical investigation, Moxifloxacin is swiftly and fully absorbed upon oral dosing. After a single dosage of 400 mg, the moxifloxacin plasma concentration after 3 h is in a range of 2–5 µg mL−1, depending on the body weight of the patient. Its half-life in blood is about 12 h, and its bioavailability is nearly 90% [42]. From the data shown in Table 3, it is obvious that moxifloxacin concentrations of one-tenth of such plasma concentrations can be reliably determined, which is hardly possible with published methods (compare the third column of Table 3 with linear ranges given in Table 2). Moreover, the undiluted plasma concentrations found after 4 h (last column Table 3) are in a typical concentration range [42].
Furthermore, spiking Moxi.HCl into the abovementioned diluted real samples yielded recoveries from 89% to 107%, with an average of 99% and relative standard deviations of less than 5%. Even in a strong matrix like blood plasma, the luminescence method works reliably and accurately. This suggests that no substantial interference occurred in such real samples. These findings demonstrate that the present luminescence method is capable of reliably detecting Moxi.HCl in complex real pharmaceutical samples. The very similar results acquired by the reference approach (HPLC) underpin the validity of the results of the luminescence method.

4. Conclusions

A new and straightforward probe based on an Eu(III)-complex was evaluated to quantify the Moxi.HCl antibiotic using a luminescence-quenching method. The static emission quenching of the Eu(III)-complex upon interaction with the antibiotic allows the determination by a Stern–Volmer plot in relevant physiological concentrations in a 0.05–80 µg mL−1 range over more than three orders of magnitude. The binding constants were determined and decreased as the temperature increased. The thermodynamic parameters were calculated and show that the binding processes are exothermic and highly spontaneous with negative ΔG0 values. The Eu(III)-(DOCA)2 complex and Moxi.HCl mostly bind through electrostatic interactions. Finally, the probe was accurately determined in five real samples (patient sera and various pharmaceutical formulations), as confirmed by HPLC measurements.

Supplementary Materials

The following supporting information can be downloaded at: https://www.mdpi.com/article/10.3390/chemosensors10100378/s1, Scheme S1. Chemical structures of the studied ligand and antibiotic. (a) 2-oxo-1,2-dihydroquinoline-4-carboxylic acid (DOCA); (b) Moxifloxacin HCL (Moxi.HCl); Figure S1. Job plot of Eu(III)-(DOCA)2 complex at λexc = 330 nm in ethanol at room temperature; Table S1 Concentrations of interferences tolerated in the presence of 5 μg mL−1 Moxi.HCl.

Author Contributions

A.D. and G.M.K. are corresponding authors and conceptualized the experiments. G.M.K., E.A.A.H. and A.M.A.E. conceived the experiments. G.M.K., E.A.A.H. and Z.A.A.E.-N. conducted the experiments, and G.M.K. acquired funding. All authors analyzed and interpreted data, and wrote and reviewed the manuscript. All authors have read and agreed to the published version of the manuscript.

Funding

This research was funded by Suez Canal University, grant number 1.

Institutional Review Board Statement

The study was conducted according to the guidelines of the Declaration of Helsinki, and approved by the ethic commission of the Suez Canal University (protocol code 201809MH2 approved on 9 October 2018).

Informed Consent Statement

Not applicable.

Data Availability Statement

All data generated or analyzed during this study are included in this published article [and its supplementary information files].

Acknowledgments

The authors are thankful to the Graduate Studies Sector at Suez Canal University for funding the research group: “Chemo- and Bio-Sensors Development for Environmental and Biomedical Application”.

Conflicts of Interest

The authors declare that they have no known competing financial interests or personal relationships that could have appeared to influence the work reported in this paper.

References

  1. Guay, D.R. Moxifloxacin in the Treatment of Skin and Skin Structure Infections. Ther. Clin. Risk Manag. 2006, 2, 417–434. [Google Scholar] [CrossRef] [PubMed]
  2. Fogarty, C.; Torres, A.; Choudhri, S.; Haverstock, D.; Herrington, J.; Ambler, J. Efficacy of Moxifloxacin for Treatment of Penicillin-, Macrolide- and Multidrug-Resistant Streptococcus Pneumoniae in Community-Acquired Pneumonia. Int. J. Clin. Pr. 2005, 59, 1253–1259. [Google Scholar] [CrossRef]
  3. Wilson, R.; Macklin-Doherty, A. The Use of Moxifloxacin for Acute Exacerbations of Chronic Obstructive Pulmonary Disease and Chronic Bronchitis. Expert Rev. Respir. Med. 2012, 6, 481–492. [Google Scholar] [CrossRef]
  4. Fu, R.; Li, C.; Yu, C.; Xie, H.; Shi, S.; Li, Z.; Wang, Q.; Lu, L. A Novel Electrospun Membrane Based on Moxifloxacin Hydrochloride/Poly(Vinyl Alcohol)/Sodium Alginate for Antibacterial Wound Dressings in Practical Application. Drug Deliv. 2016, 23, 818–829. [Google Scholar] [CrossRef]
  5. The United States Pharmacopoeia. 35, NF 30, vol. 1, United States Pharmacopeial Convention; The United States Pharmacopoeia: Rockville, MD, USA, 2012. [Google Scholar]
  6. Soni, A.K.; Gohel, M.; Thakkar, V.; Baldaniya, L.; Gandhi, T. Simultaneous Determination of Moxifloxacin Hydrochloride and Difluprednate by Ratio Derivative Spectrophotometry. Int. J. Pharm. Pharm. Sci. 2014, 6, 387–390. [Google Scholar]
  7. Attimarad, M.; Al-Dhubiab, B.E.; Alhaider, I.A.; Nair, A.B.; Sree Harsha, N.; Mueen Ahmed, K. Simultaneous Determination of Moxifloxacin and Cefixime by First and Ratio First Derivative Ultraviolet Spectrophotometry. Chem. Cent. J. 2012, 6, 1–7. [Google Scholar] [CrossRef]
  8. Tarkase, K.N.; Admane, S.S.; Sonkhede, N.G.; Shejwal, S.R. Development and Validation of UV-Spectrophotometric Methods for Determination of Moxifloxacin HCL in Bulk and Pharmaceutical Formulations. Pharma Chem. 2012, 4, 1180–1185. [Google Scholar]
  9. Attimarad, M.; Chohan, M.S.; Balgoname, A.A. Simultaneous Determination of Moxifloxacin and Flavoxate by RP-HPLC and Ecofriendly Derivative Spectrophotometry Methods in Formulations. Int. J. Environ. Res. Public Health 2019, 16, 1196–1210. [Google Scholar] [CrossRef] [PubMed]
  10. Mahmood, A.; Chaudhry, A.H.; Ashfaq, K.M.; Malik, T.A. Spectrophotometric Determination of Moxifloxacin HCl in Pure and Blood Sample. Am. J. Pharmtech Res. 2012, 2, 263–270. [Google Scholar]
  11. Subbaiah, P.R.; Kumudhavalli, M.V.; Saravanan, C.; Kumar, M.; Chandira, R.M. Method Development and Validation for Estimation of Moxifloxacin HCl in Tablet Dosage Form by RP-HPLC Method. Pharm. Anal. Acta 2010, 1, 1–2. [Google Scholar] [CrossRef]
  12. Kalariya, P.D.; Namdev, D.; Srinivas, R.; Gananadhamu, S. Application of Experimental Design and Response Surface Technique for Selecting the Optimum RP-HPLC Conditions for the Determination of Moxifloxacin HCl and Ketorolac Tromethamine in Eye Drops. J. Saudi Chem. Soc. 2014, 21, S373–S382. [Google Scholar] [CrossRef]
  13. Shehata, M.; Fekry, A.M.; Walcarius, A. Moxifloxacin Hydrochloride Electrochemical Detection at Gold Nanoparticles Modified Screen-Printed Electrode. Sensors 2020, 20, 2797–2813. [Google Scholar] [CrossRef] [PubMed]
  14. Radi, A.-E.; Wahdan, T.; Anwar, Z.; Mostafa, H. Electrochemical Determination of Gatifloxacin, Moxifloxacin and Sparfloxacin Fluoroquinolonic Antibiotics on Glassy Carbon Electrode in Pharmaceutical Formulations. Drug Test. Anal. 2010, 2, 397–400. [Google Scholar] [CrossRef]
  15. Salem, H. Spectrofluorimetric, Atomic Absorption Spectrometric and Spectrophotometric Determination of Some Fluoroquinolones. Am. J. Appl. Sci. 2005, 2, 719–729. [Google Scholar] [CrossRef]
  16. Al-Ghannam, S.M. Atomic Absorption Spectroscopic, Conductometric and Colorimetric Methods for Determination of Some Fluoroquinolone Antibacterials Using Ammonium Reineckate. Spectrochim. Acta Part A Mol. Biomol. Spectrosc. 2008, 69, 1188–1194. [Google Scholar] [CrossRef]
  17. Sultan, M.A. New, Simple and Validated Kinetics Spectrophotometric Method for Determination of Moxifloxacine in Its Pharmaceutical Formulations. Arab. J. Chem. 2009, 2, 79–85. [Google Scholar] [CrossRef]
  18. Abdellaziz, L.M.; Hosny, M.M. Development and Validation of Spectrophotometric, Atomic Absorption and Kinetic Methods for Determination of Moxifloxacin Hydrochloride. Anal. Chem. Insights 2011, 6, 67–78. [Google Scholar] [CrossRef]
  19. Chaple, D.R.; Bhusari, K.P. Spectrophotometric Estimation of Fluroquinolones as Ion-Pairs with Bromocresol Green in Bulk and Pharmaceutical Dosage Form. Asian J. Chem. 2010, 22, 2593–2598. [Google Scholar]
  20. Ashour, S.; Bayram, R. Development and Validation of Sensitive Kinetic Spectrophotometric Method for the Determination of Moxifloxacin Antibiotic in Pure and Commercial Tablets. Spectrochim. Acta-Part A Mol. Biomol. Spectrosc. 2015, 140, 216–222. [Google Scholar] [CrossRef] [PubMed]
  21. Pekamwar, S.S.; Kalyankar, T.M.; Tambe, B.V.; Wadher, S.J. Validated UV-Visible Spectrophotometric Method for Simultaneous Estimation of Cefixime and Moxifloxacin in Pharmaceutical Dosage Form. J. Appl. Pharm. Sci. 2015, 5, 37–41. [Google Scholar] [CrossRef]
  22. Patel, P.U.; Suhagia, B.N.; Patel, M.M. Spectrophotometric Methods for Estimation of Moxifloxacin in Pharmaceutical Formulations. Indian Drugs 2005, 42, 112. [Google Scholar]
  23. Misra, M.; Misra, A.K.; Zope, P.; Panpalia, G.M.; Dorle, A.K. Simple and Validated UV-Spectroscopic Method for Estimation of Moxifloxacin.HCL in Bulk and Formulation. J. Glob. Pharma Technol. 2010, 2, 21–27. [Google Scholar] [CrossRef]
  24. Dhumal, D.M.; Shirkhedkar, A.A.; Surana, S.J. Quantitative Determination of Moxifloxacin Hydrochloride in Bulk and Ophthalmic Solution by UV-Spectrophotometry and First Order Derivative Using Area under Curve. Pharm. Lett. 2011, 3, 453–456. [Google Scholar]
  25. Xu, Z.; Han, S.J.; Lee, C.; Yoon, J.; Spring, D.R. Development of off–on Fluorescent Probes for Heavy and Transition Metal Ions. Chem. Commun. 2010, 46, 1679–1681. [Google Scholar] [CrossRef]
  26. Lü, B.; Chen, Y.; Li, P.; Wang, B.; Müllen, K.; Yin, M. Stable Radical Anions Generated from a Porous Perylenediimide Metal-Organic Framework for Boosting near-Infrared Photothermal Conversion. Nat. Commun. 2019, 10, 767–775. [Google Scholar] [CrossRef]
  27. Ueno, T.; Nagano, T. Fluorescent Probes for Sensing and Imaging. Nat. Methods 2011, 8, 642–645. [Google Scholar] [CrossRef]
  28. Lehn, J.-M. Perspectives in Supramolecular Chemistry—From Molecular Recognition towards Molecular Information Processing and Self-Organization. Angew. Chem. Int. Ed. Engl. 1990, 29, 1304–1319. [Google Scholar] [CrossRef]
  29. Leonard, J.P.; Nolan, C.B.; Stomeo, F. Photochemistry and Photophysics of Coordination Compounds: Lanthanides; Springer: Berlin/Heidelberg, Germany, 2007; pp. 1–43. [Google Scholar]
  30. Lehn, J.-M. Supramolekulare Chemie–Moleküle, Übermoleküle Und Molekulare Funktionseinheiten (Nobel-Vortrag). Angew. Chem. 1988, 100, 91–116. [Google Scholar] [CrossRef]
  31. Azab, H.A.; Khairy, G.M.; Abd El-Ghany, N.; Ahmed, M.A. A New Luminescent Bio-Probe of Europium(III)-Complex for Sensing Some Biomolecules and CT-DNA. J. Photochem. Photobiol. A Chem. 2019, 374, 1–9. [Google Scholar] [CrossRef]
  32. Wetzler, D.E.; Chesta, C.; Fernández-Prini, R.; Aramendía, P.F. Dynamic Solvatochromism in Solvent Mixtures. Pure Appl. Chem. 2001, 73, 405–409. [Google Scholar] [CrossRef]
  33. Błasiak, B.; Ritchie, A.W.; Webb, L.J.; Cho, M. Vibrational Solvatochromism of Nitrile Infrared Probes: Beyond the Vibrational Stark Dipole Approach. Phys. Chem. Chem. Phys. 2016, 18, 18094–18111. [Google Scholar] [CrossRef]
  34. Moore, E.G.; Samuel, A.P.S.; Raymond, K.N. From Antenna to Assay: Lessons Learned in Lanthanide Luminescence. Acc. Chem. Res. 2009, 42, 542–552. [Google Scholar] [CrossRef]
  35. Li, Z.; Zhang, J.; Sun, Q.; Shi, W.; Tao, T.; Fu, Y. Moxifloxacin Detection Based on Fluorescence Resonance Energy Transfer from Carbon Quantum Dots to Moxifloxacin Using a Ratiometric Fluorescence Probe. New J. Chem. 2022, 46, 4226–4232. [Google Scholar] [CrossRef]
  36. Joseph, R. Lacowicz Principles of Fluorescence Spectroscopy; Kluver Academic/Plenum Publishers: New York, NY, USA, 1999. [Google Scholar]
  37. Davydov, N.; Zairov, R.; Mustafina, A.; Syakayev, V.; Tatarinov, D.; Mironov, V.; Eremin, S.; Konovalov, A.; Mustafin, M. Determination of fluoroquinolone antibiotics through the fluorescent response of Eu(III) based nanoparticles fabricated by layer-by-layer technique. Anal. Chim. Acta 2013, 784, 65–71. [Google Scholar] [CrossRef]
  38. Tian, J.; Liu, J.; He, W.; Hu, Z.; Yao, X.; Chen, X. Probing the Binding of Scutellarin to Human Serum Albumin by Circular Dichroism, Fluorescence Spectroscopy, FTIR, and Molecular Modeling Method. Biomacromolecules 2004, 5, 1956–1961. [Google Scholar] [CrossRef]
  39. Vishwanathan, K.; Bartlett, M.G.; Stewart, J.T. Determination of moxifloxacin in human plasma by liquid chromatography electrospray ionization tandem mass spectrometry. J. Pharm. Biomed. Anal. 2002, 30, 961–968. [Google Scholar] [CrossRef]
  40. İnam, R.; Mercan, H.; Yılmaz, E.; Uslu, B. Differential Pulse Polarographic Determination of Moxifloxacin Hydrochloride in Pharmaceuticals and Biological Fluids. Anal. Lett. 2007, 40, 529–546. [Google Scholar] [CrossRef]
  41. Faria, A.F.; de Souza, M.V.N.; Oliveira, M.A.L. de Validation of a Capillary Zone Electrophoresis Method for the Determination of Ciprofloxacin, Gatifloxacin, Moxifloxacin and Ofloxacin in Pharmaceutical Formulations. J. Braz. Chem. Soc. 2008, 19, 389–396. [Google Scholar] [CrossRef]
  42. Öbrink-Hansen, K.; Hardlei, T.F.; Brock, B.; Jensen-Fangel, S.; Kragh Thomsen, M.; Petersen, E.; Kreilgaard, M. Moxifloxacin Pharmacokinetic Profile and Efficacy Evaluation in Empiric Treatment of Community-Acquired Pneumonia. Antimicrob. Agents Chemother. 2015, 59, 2398–2404. [Google Scholar] [CrossRef] [Green Version]
Figure 1. Absorption spectra of (1) 2 × 10⁻⁵ M DOCA and (2) 1 × 10⁻⁵ M Eu(III)-(DOCA)2 in ethanol at room temperature.
Chemosensors 10 00378 g001
Figure 2. Effect of solvents on the luminescence spectra of 2 × 10⁻⁵ M (DOCA) at λexc = 330 nm at room temperature.
Chemosensors 10 00378 g002
Figure 3. Luminescence spectra of 1 × 10⁻⁵ M of Eu(III)-(DOCA)2 complex in different solvents at room temperature. The excitation wavelength was 330 nm and emission and excitation slit widths were 5 nm, respectively.
Chemosensors 10 00378 g003
Figure 4. The absorption spectra of 2 × 10⁻⁵ M DOCA, 1 × 10⁻⁵ M Moxi.HCl, 1 × 10⁻⁵ M Eu(III)-(DOCA)2, and 1 × 10⁻⁵ M Eu(III)-(DOCA)2-Moxi.HCl in ethanol at room temperature.
Chemosensors 10 00378 g004
Figure 5. Quenching and thermodynamic plots for the interaction of 1 × 10⁻⁵ M Eu(III)-(DOCA)2 complex with increasing concentration of Moxi.HCl at λexc = 330 nm in ethanol at different temperatures. (A) Emission spectra of the probe with various concentrations of Moxi.HCl; (B) calibration plot for quantification of Moxi.HCl at λem = 612 nm; (C) the Stern–Volmer plots between F0/F and c(Moxi.HCl) at various temperatures; (D) the modified Stern–Volmer plots between log (F0-F)/F and log of the molar concentration of Moxi.HCl at different temperatures; (E) Van ’t Hoff plot between ln Ka and 1/T for the determination of thermodynamic parameters.
Chemosensors 10 00378 g005
Scheme 1. Schematic illustration of visual quantitation of Moxi.HCl in a microtiter plate with the Eu(III)-(DOCA)2 complex as a luminescent probe. The probe was reacted with different concentrations of Moxi.HCl and excited under UV light with λexc = 365 nm (the numbers indicate the concentrations of Moxi.HCl in µg mL−1).
Chemosensors 10 00378 sch001
Table 1. Thermodynamic parameters and quenching constants of the interaction of the Eu(III)-(DOCA)2 probe with Moxi.HCl at different temperatures.
Temperature (K)Ksv
(104 M−1)
R2Ka
(104 M−1)
nR2ΔH0
(kJ/mol)
ΔS0 (J/mol K)ΔG0 (kJ/mol)R2
2982.530.99622.440.980.9998−6.6661.94−25.120.99828
3032.400.99642.390.990.9992−25.41
3082.320.99642.291.000.9994−25.74
3132.240.99632.211.000.9998−26.07
3182.120.99472.141.030.9995−26.34
Table 2. Comparison of the present analytical methods for determination of Moxi.HCl.
MethodsLinear Range
(µg mL−1)
LOD
(µg mL−1)
LOQ
(µg mL−1)
Ref.
RP-HPLC5–2000.451.30[9]
Differential Pulse Polarography22–440.040.14[40]
Electrochemical Detection at Gold Nanoparticles Modified Screen-Printed Electrode3.50–2105.0816.91[13]
Spectrophotometric method1–200.5421.63[7]
Capillary zone electrophoresis25–1280.7952.65[41]
Solid phase extraction with LC/ESI-MS/MS0.001–10.000050.001[42]
Spectrofluorimetry0.05–800.0150.049Present method
Table 3. Recovery of Moxi.HCl in different pharmaceuticals and human plasma as determined by luminescence and HPLC (n = 3).
SamplesDilution FactorDetermined
Mean ± SD
(µg mL−1)
Added
(µg mL−1)
Found
(µg mL−1)
Recovery (%)Total Conc. of Moxi. HCl
(µg mL−1)
Advancrib tablet2001.86 ± 0.04 a
2.01 ± 0.03 b
57.21107.0372
1011.5396.7
2022.12101.3
Vigamox ophthalmic drops2001.95 ± 0.15 a
2.12 ± 0.05 b
56.5892.6390
1012.5105.5
2021.9199.8
Moxavidex tablet2002.18 ± 0.26 a
1.94 ± 0.05 b
56.9896.0436
1011.9097.2
2022.0399.3
Human plasma 1100.43 ± 0.04 a
0.40 ± 0.01 b
54.8889.04.30
1010.1897.5
2022.43101.0
Human plasma 2100.38 ± 0.02 a
0.41 ± 0.04 b
55.0693.63.80
1010.86104.8
2020.45100.4
a Proposed luminescence method. b HPLC method.
Publisher’s Note: MDPI stays neutral with regard to jurisdictional claims in published maps and institutional affiliations.

