1. Introduction
Radiation therapy is a type of cancer treatment that uses high intensity energy beams to kill cancer cells and shrink the tumor. In order to treat cancer, the radiation oncologist delineates the tumorous region or target volume on a computed tomography (CT) or magnetic resonance imaging (MRI) dataset. Additionally, the normal organs, known as organs-at-risk (OAR) volumes are delineated to spare and estimate radiation doses and reduce possible side effects. These delineated volumes are known as structures. Radiation oncology team members, such as radiation physicists and dosimetrists, delineate other types of structures termed as “planning organs at risk volume” (PRV). These structures are used strictly in the treatment planning process and take into account the mobility of the organs at risk, and therefore, a surrounding margin is added to these structures to compensate for geometric uncertainties. All delineated structures are given names that are usually written in free text as identifiers, but the lack of standardized nomenclature has created inconsistencies in naming the structures.
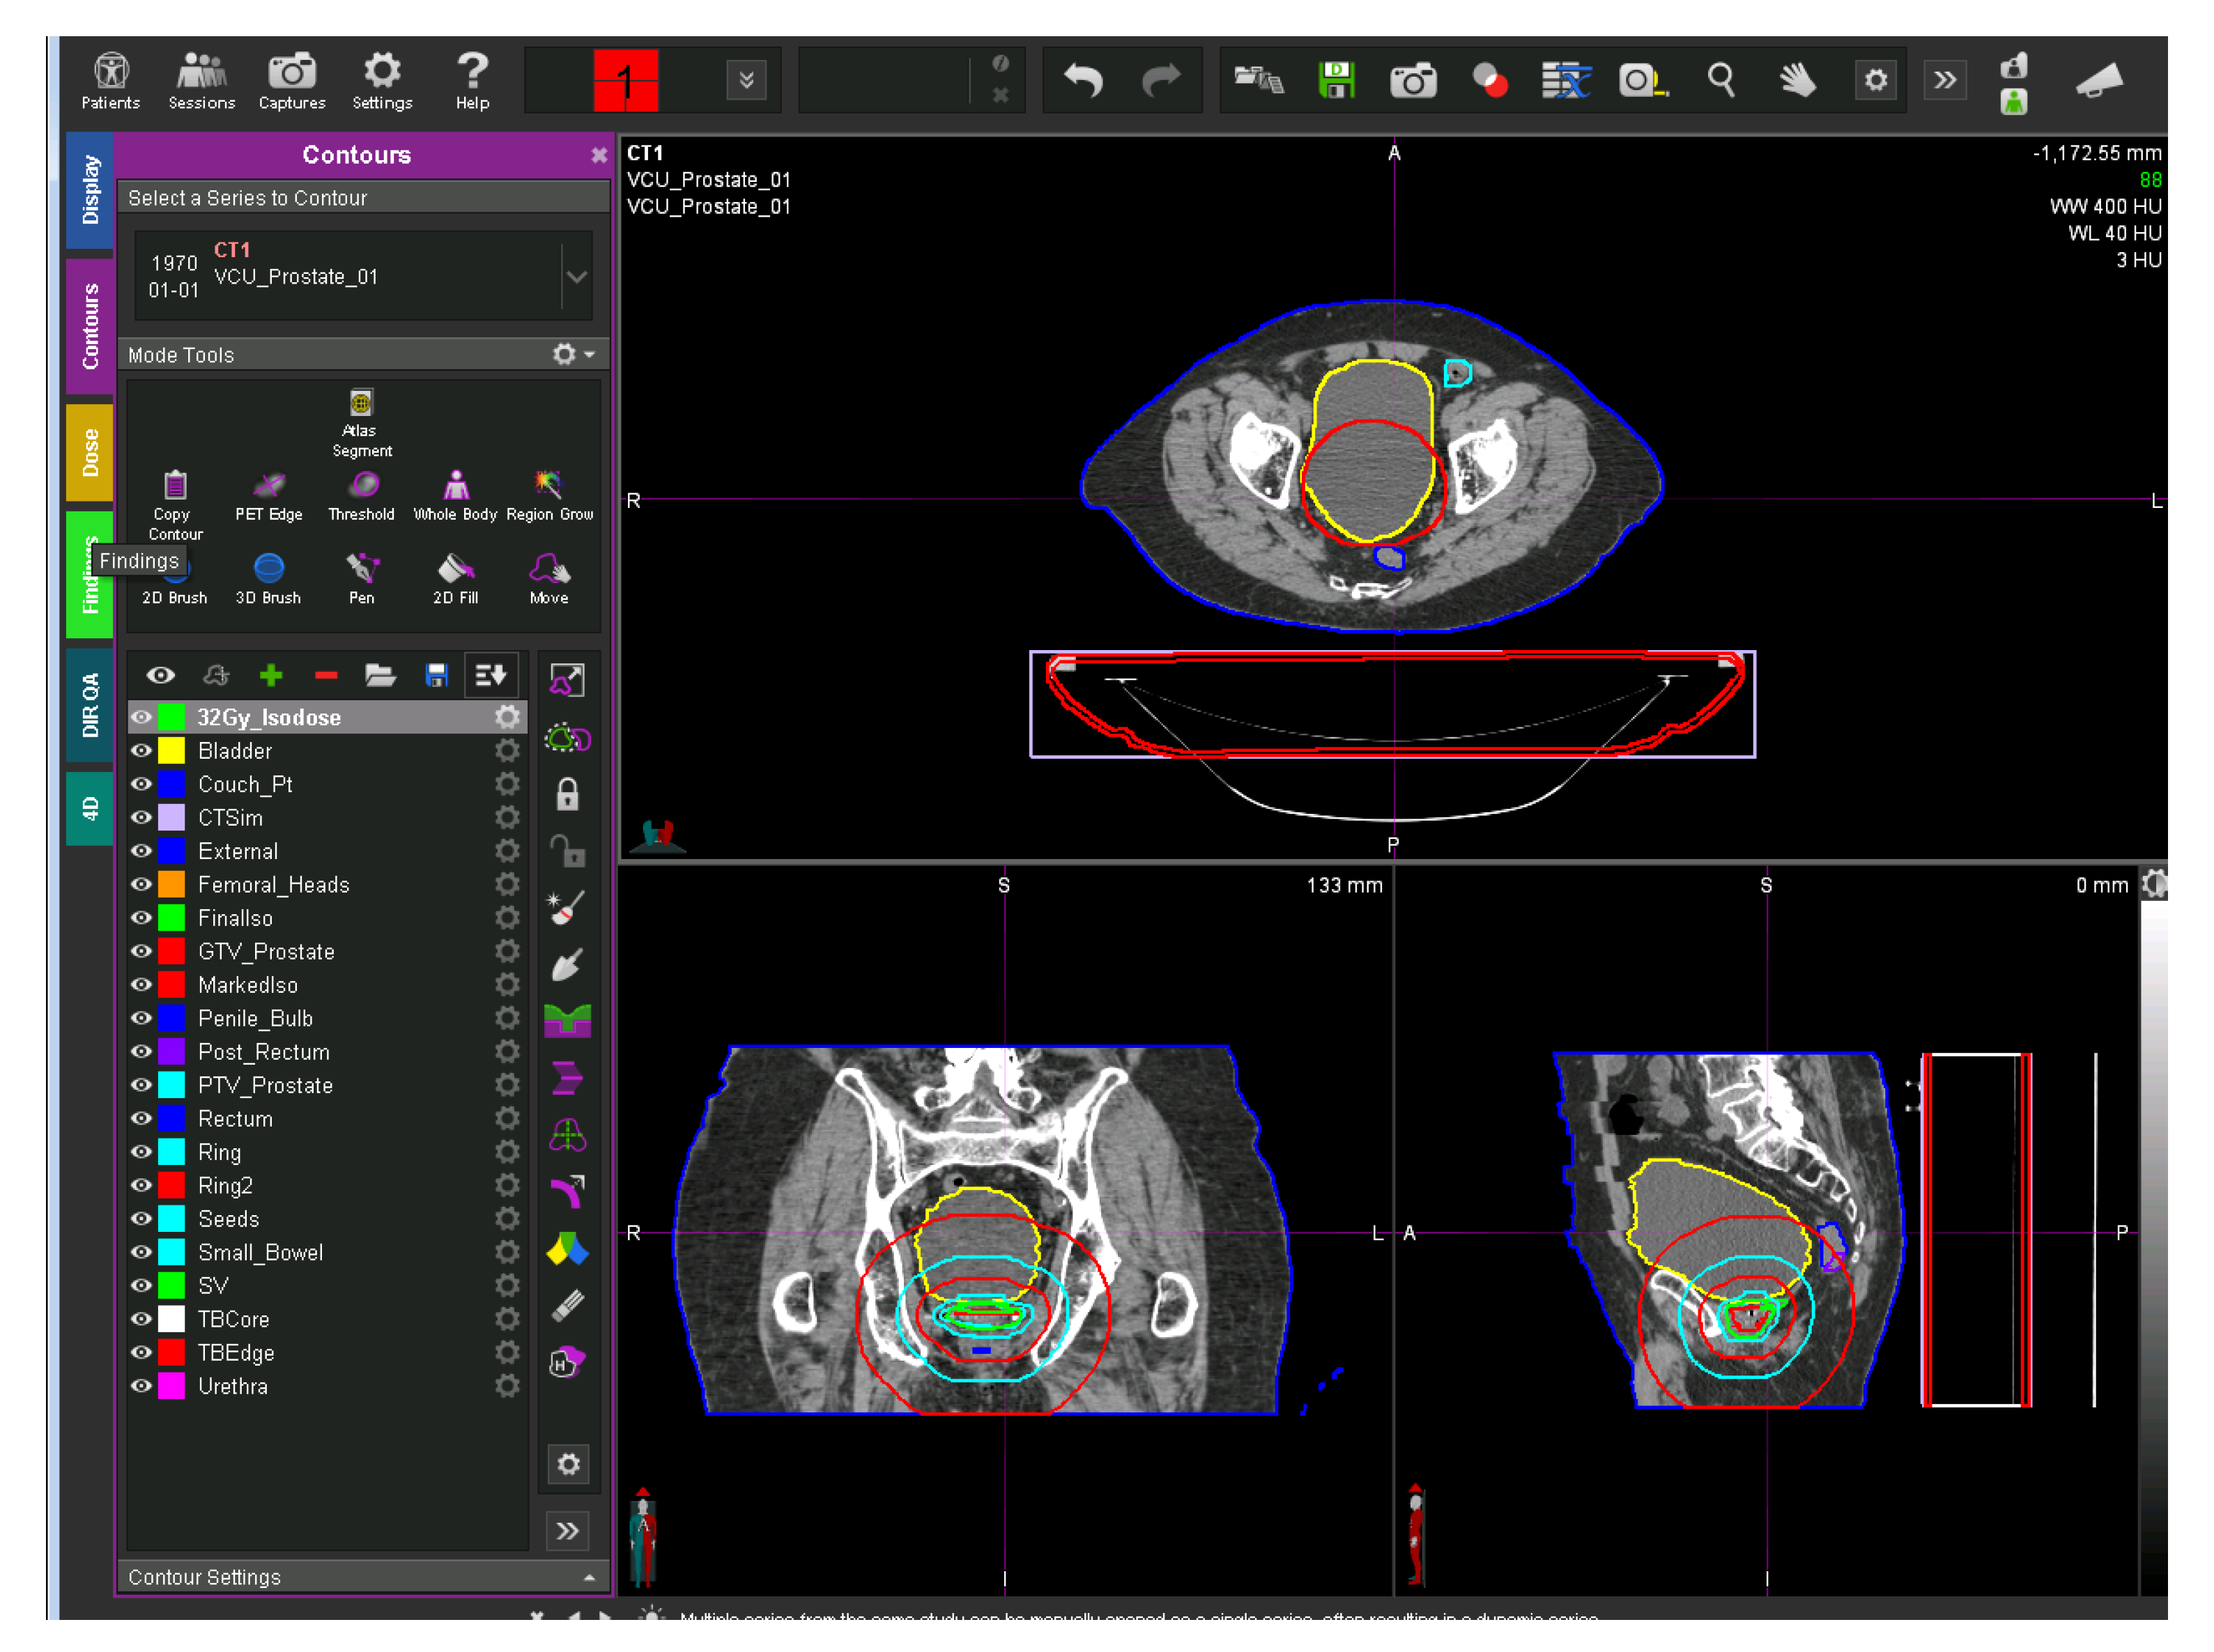
Figure 1 shows a representative CT image overlaid with its defined structures. The left side of the figure shows the physician-transcribed names of the structures delineated on the right side.
The use of standard nomenclature is an essential step for the construction and use of informatics-based tools to automatically extract pertinent data from electronic medical records in support of clinical trials, data-pooling initiatives, and clinical practice improvement. It also provides a foundation for the development of software tools to automate data extraction, analysis, data submission, exchange, and quality assurance (QA) [
1,
2].
To address these issues, the American Association of Physicists in Medicine (AAPM) has released a Task Group 263 (TG-263) report with the standardized nomenclature for structures names [
3]. This report was developed in collaboration with stakeholders from both multi-institutional and multi-vendor organizations. The American Society for Radiation Oncology (ASTRO) and AAPM have identified the following as the main challenges in RT structure name standardization [
3]:
Vendor-based challenges that originate from the inter-vendor variation on software architecture. Each vendor has a particular character set for naming the structures; limited allowable character sets, however, hinder the interoperability.
Multi-institutional-based challenges that may arise from the lack of participation, oversight, and guidelines in creating a standardized nomenclature.
Single institutional challenges include data governance issues; costs; and difficulties of implementing new nomenclatures, making them compatible with existing treatment modalities, and training the institutional staff to follow the standards.
Clinical staff challenges may encompass the lack of guidelines or a detailed schema to follow.
Strict adherence to a standardized nomenclature will help to achieve future standardization, but it cannot address retrospective data standardization. Manually relabeling inconsistent names with the corresponding standardized TG-263 names is one way to correct retrospective data; however, generating such mappings for multi-center data is slow, time consuming, inefficient, hard to generalize, and challenging to scale. This sets the stage for machine-learning-based methods that may be able to overcome some of these limitations. To address each of the issues mentioned above, we propose a methodology to retrospectively standardize the radiotherapy structure names using a combination of machine learning and natural language processing techniques.
The main contributions of this paper are:
Proposing a novel automated machine learning approach to standardize the physician-given structure names to the domain wide utilized TG-263 standard names.
Demonstrating that a relatively small amount of data from each center is enough to build a generalizable machine learning model, which a simple text mapping cannot achieve.
Establishing that the approach is disease site agnostic; it can be used on multiple disease sites.
Demonstrating that physician-given names hold enough information about the structures that can be utilized to predict the standard name.
Creating a scalable approach that requires little to no preprocessing.
2. Related Work
The existing techniques for structure name standardization can be broadly classified into three categories: expert-based, ontology-based, and machine-learning-based.
Previous works in the RT community to retrospectively standardize structure names mostly use the physician provided names (free-text labels) or geometric information such as volume, area, and location of the structures. The recently published works to standardize structure names using physician-given names are illustrated as below.
A research team in Australia recently proposed an expert-based approach to standardize radiotherapy structure names as per the TG-263 standard recommendations [
4]. In this study, a panel of experts developed a mapping and structure synonym set for 36 structures from their clinical database. With their method, they were able to map 99% of the relevant structures and relabel the names correctly. However, the major limitation of this approach are scalability and generalizability; data used in this project were from a single academically focused institution that could enforce the local standards, and the mappings were dependent on inputs provided by experts. This method is also center specific; mappings from one institute may not be useful to the other institute.
A different team in the Netherlands has proposed an ontology-based RESTful web service to standardize the structure names [
5]. However, this approach was more focused on building a linked data than a technique for structure name standardization. The authors used the mappings provided by the institutions to generate centralized mappings, thereby creating a common terminology for linked data.
There are few papers that have proposed machine-learning-based approaches to structure name standardization. Unlike expert-based and ontology-based methods, machine-learning-based methods use either free text labels or geometric information to build learning models for standardization. One such work made use of multiple string similarity measures to generate feature vectors, and these feature vectors were used as input for the classification algorithm to predict the labels [
6]. This paper used neural-network-based methods but lacked the pertinent details for reproducibility of the results. Two other papers proposed methods using geometrical information for structure name standardization [
7,
8]. Both of these papers have used a machine learning approach with neural networks to standardize the structure names of the head and neck region. Even though they both showed a high accuracy for identifying the standard names, the major limitation of these works was that they considered only limited OAR structures to build the ML model and Non_OARs were discarded. Removing Non_OAR structures makes it difficult to apply these two approaches in the real-world datasets because real-world datasets will contain both OARs and Non_OARs.
Expert-based methods have high accuracy but require manual effort from experienced clinicians, which makes scalability and generalizability challenging to achieve. Although ontology-based techniques can help in automating the labeling task, there is a paucity of domain-specific comprehensive ontologies in the radiation oncology. Machine-learning-based methods are well suited for retrospective structure name relabeling but are seldom used in this domain. Additionally, the TG-263 standardization was only completed in 2018 [
3], and hence applications of machine-learning-based methods for structure name prediction are still in their infancy.
3. Methods and Materials
3.1. Data
Across the United States, the Veterans Health Administration (VA) has 40 centers treating veterans with in-house radiation therapy services. The VA has put together the Radiation Oncology Quality Surveillance Program (VA-ROQS), and as part of this program the treatment quality is assessed from all VA centers [
9]. As part of the initial pilot study, data from all 40 centers were manually abstracted from clinical charts, imaging databases, and radiation oncology specific systems, such as treatment planning systems and treatment management systems. Data from up to 20 prostate and 20 lung cancer patients were manually abstracted from each center, resulting in a total of 794 and 754 patients respectively. The collected data included the DICOM (Digital Imaging and Communication in Medicine) structure set files representing anatomical structures of interest and the corresponding DICOM CT image datasets for each patient. For this project, ten lung and nine prostate OAR structures were identified. These structures were manually labeled to their TG-263 standard names, and all other structures, including target and PRVs, were labeled as Non_OAR. The dataset will be further referred to as the VA-ROQS dataset.
We also collected data from the Department of Radiation Oncology at Virginia Commonwealth University (VCU) as an external test dataset, which included DICOM structure set data from 50 randomly selected patients with prostate cancer and another 50 patients with lung cancer. The same procedure that was used in the VA-ROQS data preparation was also used to label the structures in this dataset, which will be referred to as the VCU dataset. The following prostate and lung OAR structures considered in this work are:
Prostate organs-at-risk structures: Bladder, Rectum, LargeBowel, SmallBowel, Femur_L, Femur_R, SeminalVesicles, PenileBulb, and External.
Lung organs-at-risk structures: Heart, Esophagus, Lungs, Lung_R, Lung_L, SpincalCord, BrachialPlexus, BrachialPlexus_L, BrachialPlexus_R, and External.
Table 1 shows the distributions of lung structures for the VA-ROQS and VCU datasets, while
Table 2 shows the distributions of the prostate structures in these two datasets. In both cases, the Non_OAR structures present an overwhelming majority; these Non_OARs include all the structures contoured as a part of treatment planning and delivery and the dose evaluation structures. We also observed similar class imbalances across all VA-ROQS centers’ data (see
Figures S1 and S2 in the Supplementary Material).
Table 3 shows the examples of physician-given names compared to the standard OAR structures, which highlights the variability in the physician-given names.
Table 1 also shows the number of unique names found in each Lung structure in the VA-ROQS and VCU datasets, and
Table 2 shows physician-given unique names for the prostate structures in VA-ROQS and VCU datasets.
3.2. Data Preprocessing
Structure names are short and have a limited character set to use, and the available character set is vendor dependent. As shown in
Table 3, even though there is high variability in physician-given structure names for most of the structure type, the character set used is limited. Preprocessing methods need to be selected to ensure that critical information is retained; losing the information might negatively affect the ability to standardize the structure names with high fidelity. Hence, we decided to keep the preprocessing of physician-given names to a minimum by just converting them to lower case.
3.3. Model Selection
After preprocessing the data, the next step is to select the appropriate machine learning method. We experimented with different types of methods to map the physician-given structure names to the TG-263 standardized names. The datasets presented have some unique characteristics that impacted the choices and performances of our algorithms. Structure names are very short in size (varying between 4 and 20 characters), which limits the use of complex machine learning algorithms [
10]. For better applicability of the machine learning algorithms, we identified the features from the structure names to build the feature vectors, which are necessary for any machine learning algorithm.
Since machine learning algorithms work on numerical data, we converted the text data into numerical features. Numericalization of text data involves two steps [
11]: (1) tokenization or feature set generation and (2) vectorizing the features with feature weight calculation techniques. We tried multiple feature generation and feature weight calculation methods, as discussed next.
We tested the following list of techniques for feature set generation.
Bag-of-words (BoW): In this model, text (such as a sentence or a document) is represented as the bag (multiset) of its words, disregarding grammar and even word order but keeping multiplicity [
12]. The bag-of-words model has also been used extensively in the natural language processing domain. For example, bag-of-words features for the physician-given name "femoral head left" are "femoral," "head," and "left."
Word n-grams: An n-gram is a contiguous sequence of n terms from a given sequence of text. Given a sentence, we can construct a list of n-grams from it by finding pairs of words that occur next to each other. For example, with a physician-given name, "femoral head left," we can construct bigrams (n-grams of length 2) by finding consecutive pairs of words; "femoral head" and "head left" are bi-grams.
Character n-gram: In this model, instead of considering a full token or a term, a set of continuously occurring characters is used to build the feature set. These character sets are considered to form n-gram features. For example: with the physician-given name "bladder," character three-gram features are "bla," "lad," "add," "dde," "der."
Assigning appropriate weights to individual features as per their relevance in a given dataset is known as feature weighting. It is generally thought of as a generalization of feature selection, where the presence of a feature serves as the criterion for its extraction. We used various feature weighting methods to build the feature vectors, as shown below.
Term presence (tp): In this method the presence or absence of a term in the given document is encoded as 1 or 0.
Term count (tc): This method is an extension of the tp method. Here, term occurrence is considered as the weight; it denotes the number of times a given term appears in a document.
Term frequency (tf): In this method, the term occurrence is usually normalized to prevent a bias towards longer documents (which may have a higher term count regardless of the actual importance of that term in the document) from giving a measure of the importance of the term t within the particular document d. Thus we have the term frequency, defined as follows [
13,
14].
Term frequency-inverse document frequency (tf-idf): tf-idf is a numerical statistic that reflects how important a word is to a document in a collection or corpus [
15]. It involves two parts: First is tf, which is defined as in Equation (
1). Second is inverse document frequency (idf)), which is a measure of the general importance of the term (obtained by dividing the total number of documents by the number of documents containing the term, and then taking the logarithm of that quotient).
In Equations (
1)–(
3), tf is term frequency, df is document frequency, t is term, d is document,
is number of documents a term (t) appears in, and N is the total number of documents.
Word embeddings: Words or phrases from the vocabulary are mapped to vectors of real numbers. Conceptually, it involves a mathematical embedding from a space with many dimensions per word to a continuous vector space with a much lower dimension; word2vec [
16], Glove [
17], and fastText [
18] are some of the well known word embedding techniques.
Feature Weighting Example
Here we show the examples of each of these weighting methods. Consider four physician-given names: (1)
large bowel, (2)
sigmoid colon, (3)
bowel, and (4)
bowel lg. If we consider the bag-of-words model for feature set generation, our feature set will consist of unique tokens from the above mentioned four names, which are { large, bowel, sigmoid, colon, lg }. The total number of documents is four (
N = 4) (physician-given names). Below are feature vectors with each of the weighting methods for physician-given name “large bowel” as below.
We used six different classification algorithms—SVM-linear [
19], SVM-RBF [
20], k-nearest neighbors (KNN) [
21], logistic regression [
22], random forest [
23], and fastText [
18]—for initial model selection. All models were built by using scikit-learn machine learning library in python [
24]. The best model was selected based on their performance on the VA-ROQS dataset.
Tables S1 and S2 show the performances of these models for the different feature vector methods. One of the objectives of this work was to understand the impact of feature weighting techniques on model performance. A thorough comparison of feature weighting techniques and their effects on structure name standardization is beyond the scope of this study. Nevertheless, we report the observations we made during the initial model selection as below.
Tables S1 and S2 show the machine learning model performance with different feature weighting methods. We observed that the tp, tc, and tf with all combinations of ML algorithms produced the same results. We believe these three feature weighting techniques produce the same feature vectors, where tp and tc produce the same vector, and tf is a normalized version of the tc. We believe this is because of the unique characteristics of our dataset. Instances (physician-given names) are short, and words within the names are not repeated. The examples shown above indicate the same. As we know from Equation (
3), the tf-idf feature weighting technique takes the global picture of words into account in the calculations, which changes the weights of the features when compared to other methods. Interestingly, tf-idf did not perform well when compared to the other weighting methods for both prostate and lung disease datasets. In comparison with all weighting methods, the word vector based fastText algorithm consistently outperformed all other algorithms; hence we selected it to build our final model.
3.4. Model Evaluation
An essential part of building a machine learning system is to demonstrate its quantifiable generalizability. For example, the critical goal of a machine learning classification algorithm is to create a learning model that accurately predicts the class labels of unseen data samples. Hence the machine learning model should work well for classifying future data.
Model validation is an important step in the machine learning process. Evaluation of a model on the training dataset would result in a biased score. Therefore the model is evaluated on the held-out set to give an unbiased estimate of model performance. Just a hold-out set validation is not enough to test the robustness and finalize the model. It is recommended to validate the model on the entire dataset [
25,
26]. One such technique is k-fold cross-validation. To that effect, we validated our models in three different ways on the VA-ROQS dataset and tested it on the VCU dataset (external dataset).
Model Validation
70:30: The VA-ROQS dataset was divided into a 70:30 ratio as the training and validation sets. The split was stratified by TG-263 standard names, which ensured that an equal percentage of data was taken from each standard name for training, validation, and testing, thereby avoiding center-based bias in modeling.
K-fold: The VA dataset was divided into K-folds in such a way that each fold was stratified by standard name. The K-1 fold of the data was used for training, and the remaining fold was for validation. This was repeated until all folds were validated. We performed 5-fold and 10-fold cross-validation to better capture the variance in data folds.
Center-based: The VA-ROQS dataset came from 40 (n = 40) different treatment centers. Data from 39 (n-1) centers were used for training, and one center’s data was used for testing. We repeated this process until all centers were tested based on the model trained on the remaining n-1 centers.
Model Testing
Once the model is thoroughly validated and finalized, we need to test it on entirely new data (unseen by the model during training). We built a final model on the VA-ROQS dataset and tested it on the VCU dataset. One of the reasons we choose VA-ROQS for training and VCU for testing was to avoid any overlap of data between the training and test sets.
3.5. Evaluation Metrics
The performance of a model can be measured with different evaluation metrics. However, these metrics need to consider the class (structure labels) distribution to evaluate the model accurately. The dataset presented has a high level of class imbalance, as shown in
Table 1 and
Table 2. Hence we evaluated the performance of each model using four distinct metrics—overall accuracy, macro-averaged precision, recall, and F
1 score. Overall accuracy simply measures the percentage of OARs in the validation set classified correctly.
A macro-averaged metric computes results for each class independently and then takes the average of all to calculate the overall average metric. In contrast, a micro-average aggregates the contributions of all classes to compute the overall metric. We note that in classification tasks such as ours in which each structure name is mapped to precisely one label, accuracy is the same as the micro-averaged F1 score. A micro-averaged F1 score and overall accuracy metrics do not disproportionately penalize a classifier for performing poorly on the less frequent classes, whereas macro-averaged F1 score is heavily influenced by how well the classifier performs on the less frequent classes. Hence the performance of a rare class and a more frequent class are equally important.
Accuracy measures how well a classifier performs overall, whereas macro-averaged precision, recall, and F
1 score better capture how well a classifier can identify cases that it does not often see, which is extremely important in real-world settings. The mathematical expressions of each of these metrics are shown below.
In the above formulae, truth table counts are represented by TP as true positives, TN as true negatives, FP as false positives, and FN as false negatives.
Along with all the above-mentioned metrics, we used a confusion matrix, which is a summary of prediction results on a classification task. The numbers of correct and incorrect predictions are summarized with count values and broken down by each class. The confusion matrix shows how the classification model is confused when it makes predictions. It provides insight not only into the errors made by a classifier, but more importantly, the types of errors that are made. All the metrics mentioned were computed from the confusion matrix.
3.6. fastText Classification Algorithm
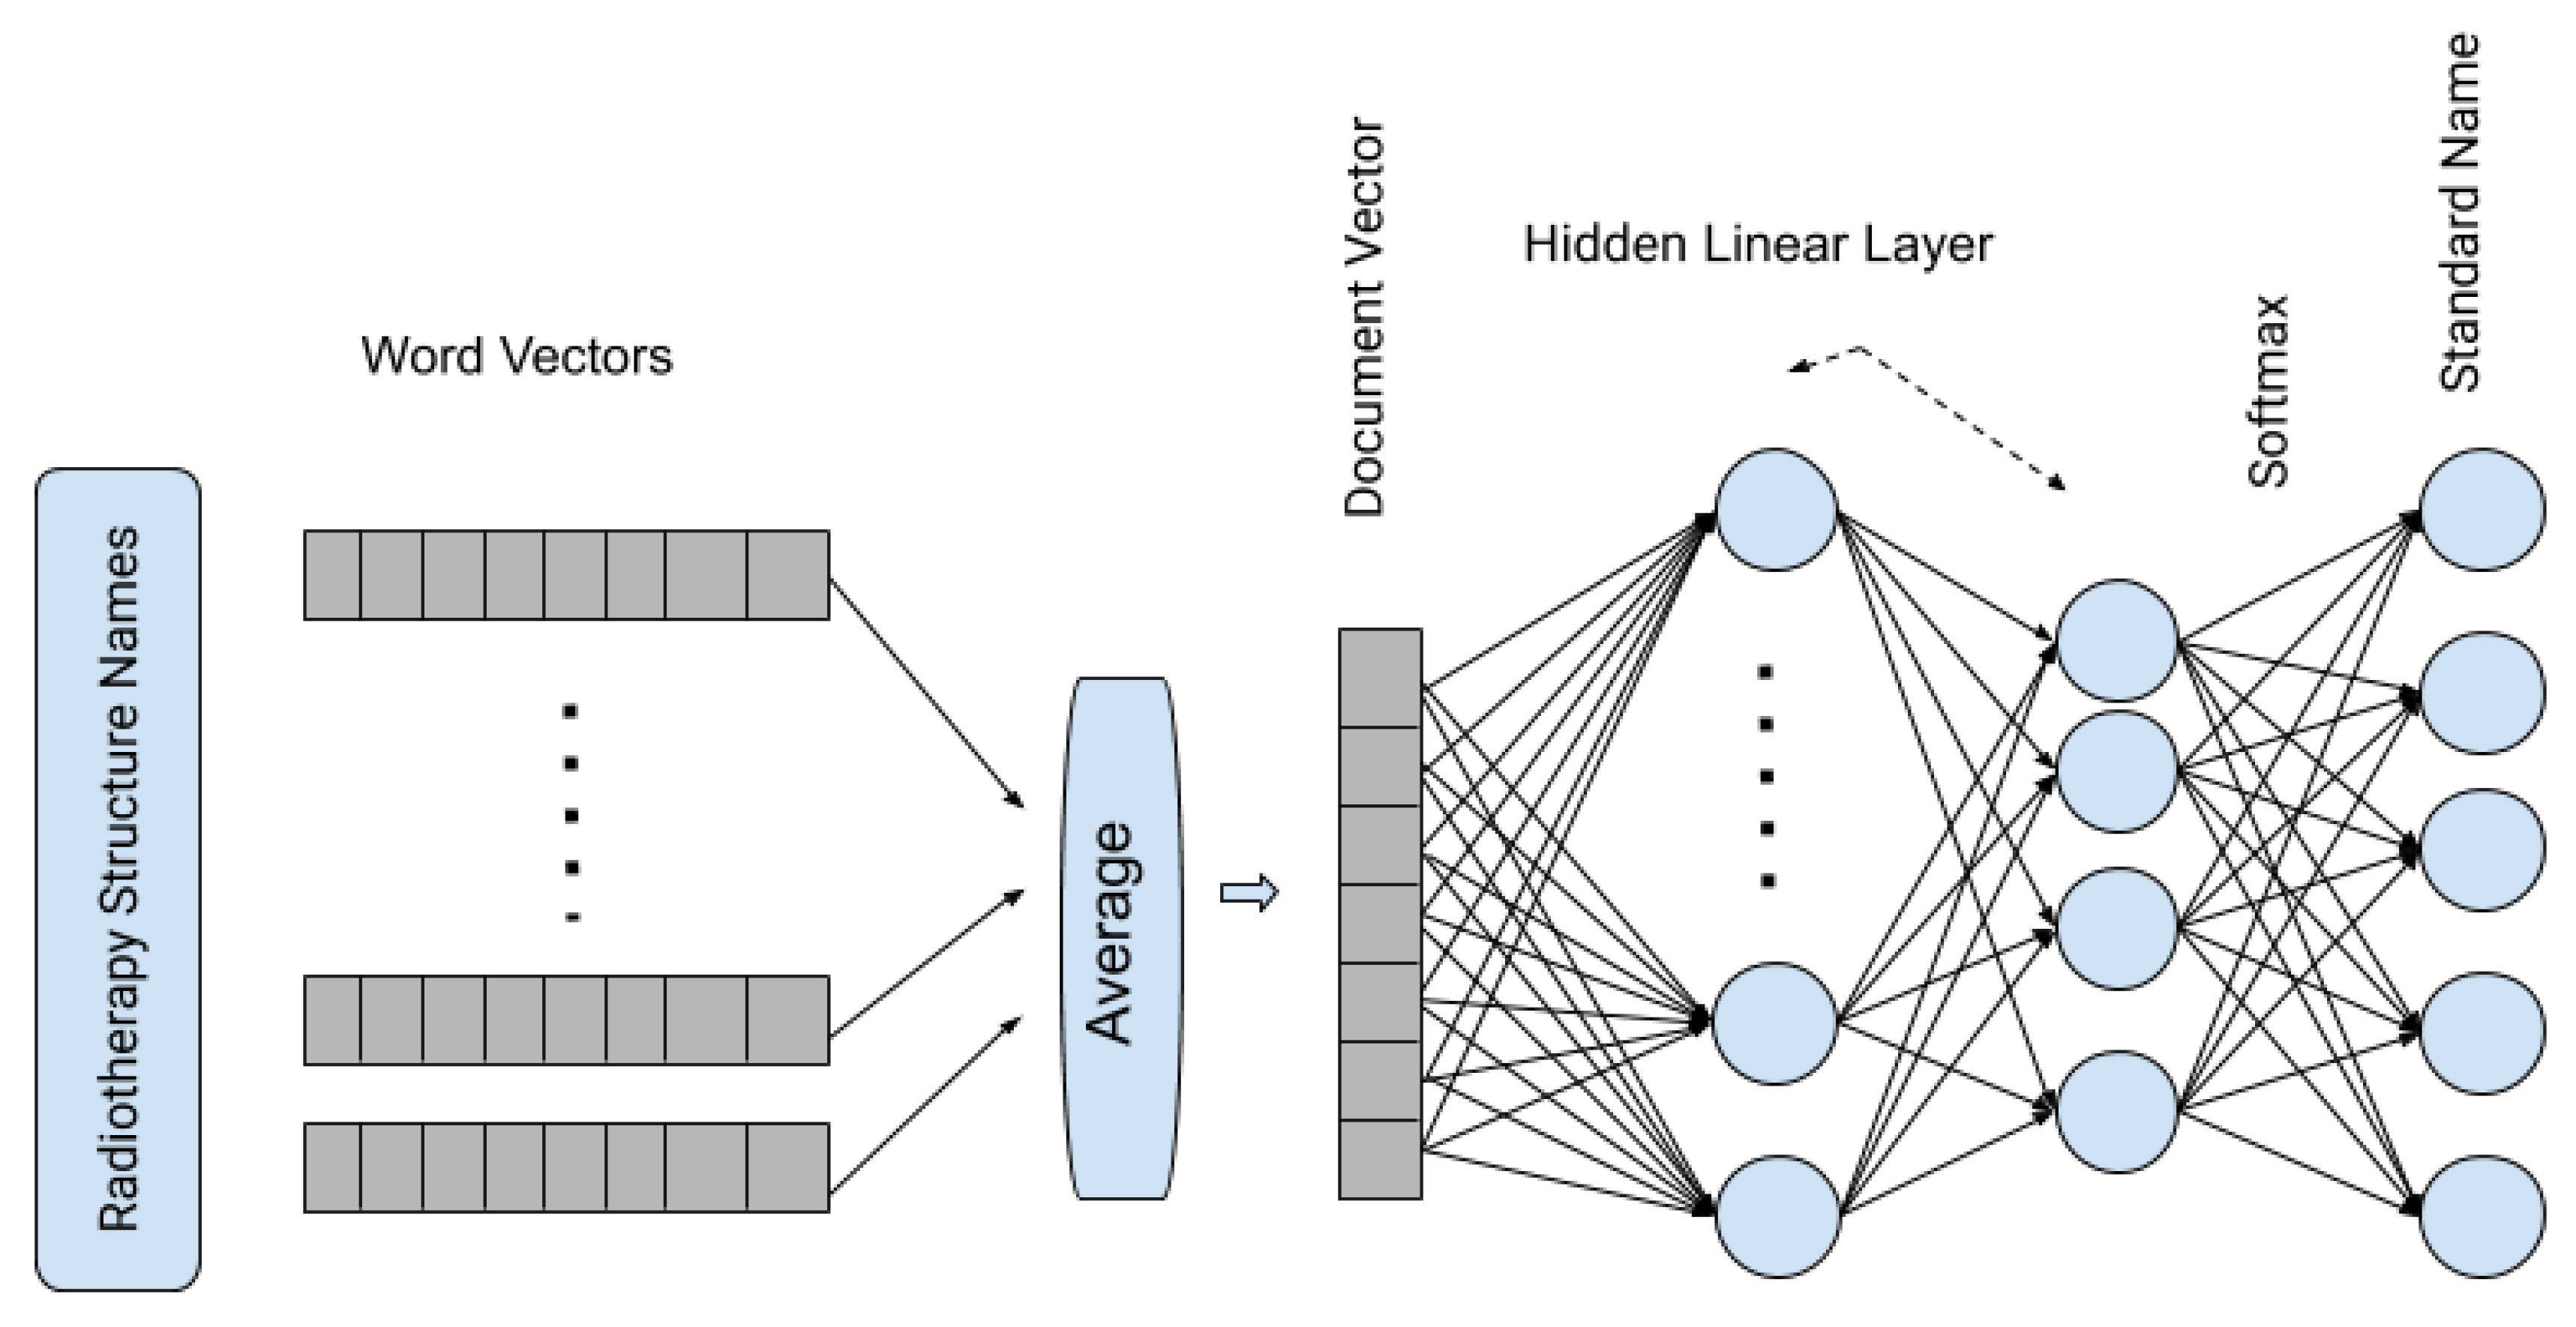
The fastText text classification algorithm [
18] is an extension of the word vector method, which includes three major steps. First, generating the word vectors: fastText learns the vector representation of words from subwords (character n-gram) [
27]. For example, the word “Bladder” with a character n-gram of 3 will have fastText representations such as “<bl, bla, lad, add, dde, der, er>” wherein < and > are added to indicate the beginning and end of the word. The technique of breaking the word into character n-gram makes it work well with rare words. This helps to find the vector representation of a word, even if it is not seen in training, and this done by breaking down the word into character n-grams to get the word embedding. A subword size can be selected with range
minn and
maxn, indicating the minimum and maximum length of the subwords to generate. Along with these, fastText also considers
wordNgrams (word n-gram) to build the vector representation. Vector size is selected by setting the
dim parameter. In
Section 3.7 we explained the hyperparameter tuning.
In the second step, word vectors are averaged to form a document vector, and in our method, it represents the vector representation of the complete RT structure. In the third and final step, it passes the averaged vectors through a shallow neural network with one hidden layer and uses the
softmax function to generate the probability of a structure is one of the standard RT structures.
Figure 2 shows the architecture of the fastText supervised classification algorithm.
3.7. fastText Hyperparameter Tuning
After the initial selection of models, we chose fastText for further analysis, as it performed better than all other models. To further improve the model’s performance, selecting appropriate hyperparameter values is important. The fastText algorithm has many hyperparameters, and we chose eight parameters to optimize, which have an impact on the data dictionary and model training. Out of eight hyperparameters selected for model tuning, two hyperparameters
minn and
wordNgrams were kept at fixed values.
wordNgrams selects the number of consecutive individual words while building a data dictionary. Physician-given names are most likely to have less than three distinct words; to avoid considering the complete given name as a token, we set
wordNgrams to 2. On the other hand, minn provides the minimum number of consecutive characters to consider as a token. We set
minn to 2 to capture the more meaningful tokens rather than selecting every character as a token.
Table 4 shows the hyperparameters and values tested.
A total of 15,360 combinations of hyperparameters was generated; each combination of hyperparameters was used to build a separate model for each disease type, and so considering the two disease types, overall we created 30,720 models. Models were evaluated with metrics described in
Section 3.5 on the validation dataset and were recorded separately for each of the diseases types.
Figures S3 and S4 show the impact of each hyperparameter on model performance. Boxplots are used to show the distribution of model performance (F
1 score) for each value of the hyperparameter; the value with the smallest inter-quartile range and highest median was selected. The hyperparameter value was selected based on its performance on both disease type data (prostate and lung). The best values for hyperparamter selected are shown in
Table 4 with brief descriptions.
4. Results
In this section, we present the results of our models for both the VA and VCU datasets. We built models with combinations of feature sets, feature weighting methods, and machine learning algorithms. We observed that among all models, the fastText model performed consistently well on our data. Hence we present the detailed descriptions of results from only the fastText models. Results from the remaining models are shown in the
Supplementary Material. The macro-averaged precision, recall, F
1 score, and overall accuracy for both prostate and lung datasets for all the validation types are shown in
Table 5. Individual class level results are shown in
Tables S4–S7 for prostate and
Tables S9–S12 for lung in the Supplementary Material.
After fastText was selected as a final model, we tested the robustness of this method with four different validation types. Each of the validation types tested a different aspect of our model performance. Below we describe the results for each of these validation types.
4.1. Validation Results
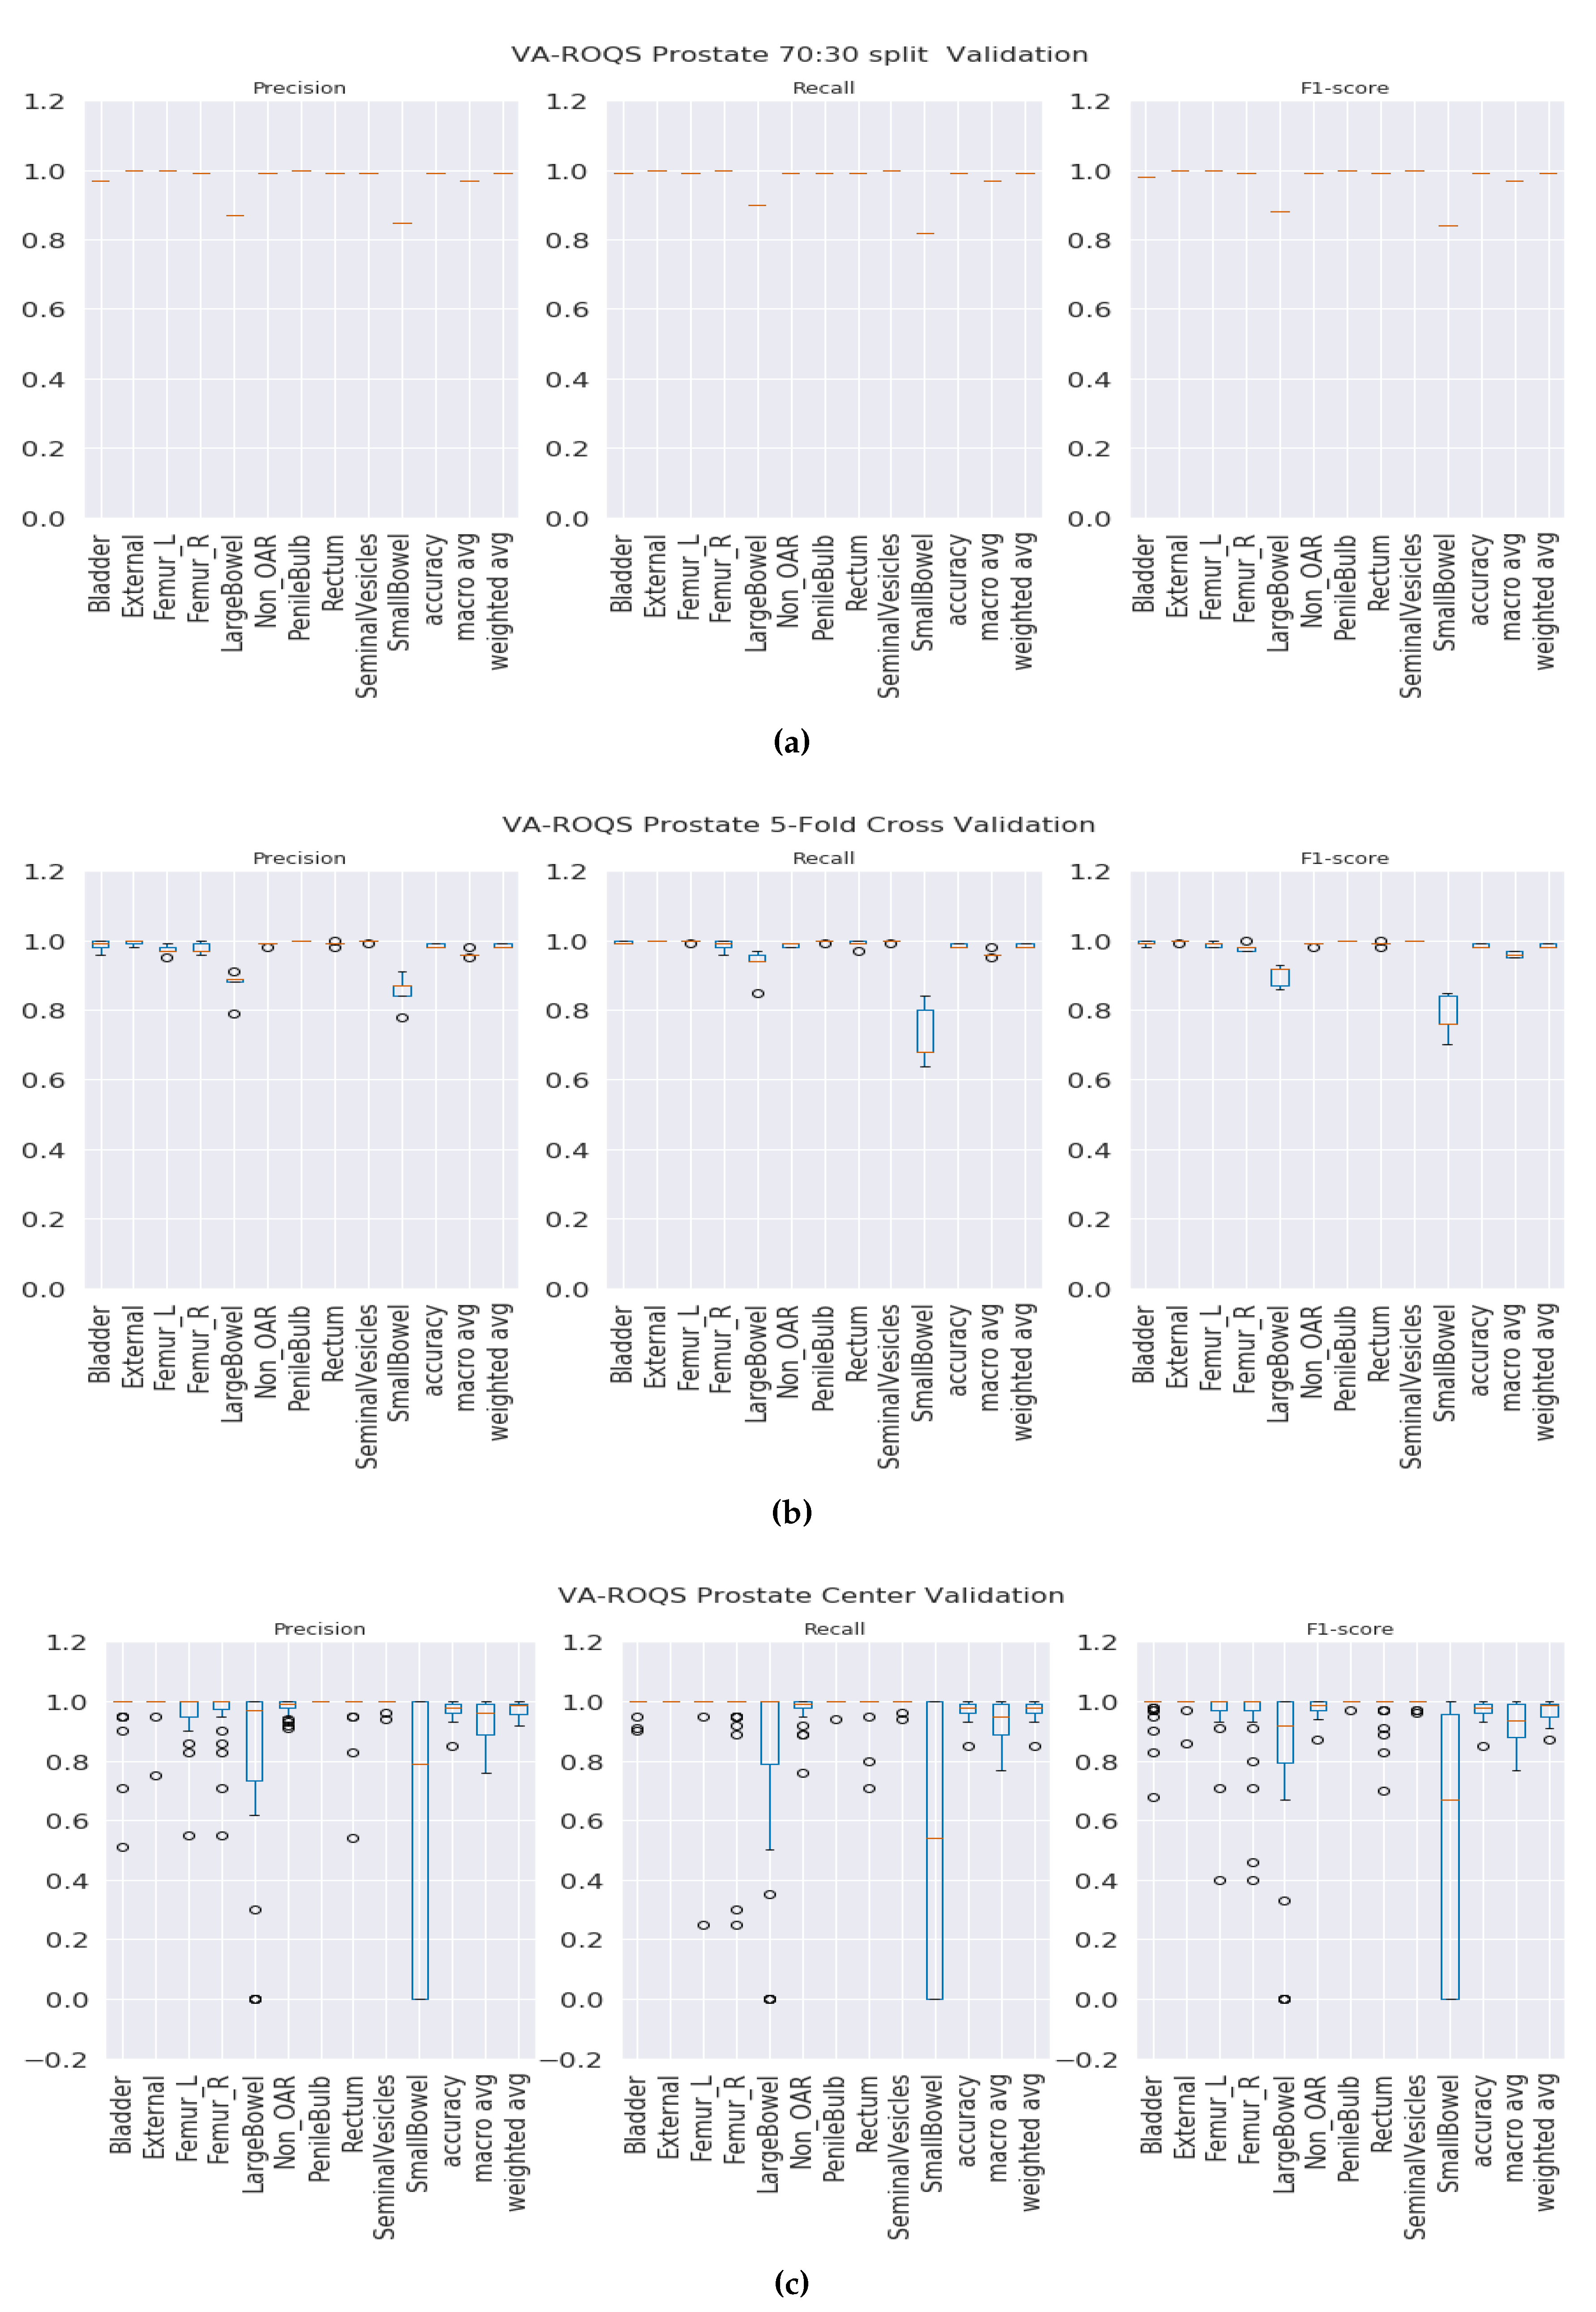
70:30 validation: This validation type was chosen to test the model generalizability when data was split into 70% for training and 30% for testing. We split the data such that 70% of the patients from each center were under the training set and the rest of the patients from each center were under the testing set. We observed that our method was able to generalize well, and our model achieved overall macro-averaged F
1 scores of 0.97 and 1.0 for prostate and lung datasets respectively. That indicates that our model was able to predict each label correctly. We also observed that our results were consistent across all classes regardless of class imbalance.
Figure 3a and
Figure 4a show the class-wise results for prostate and lung data.
K-fold validation: With this validation type we checked the performance on the complete dataset. Here, we split the data into K-folds using a K value of 5. We observed that the 5-fold cross-validation achieved overall macro-averaged F
1 scores of 0.96 and 0.98 for prostate and lung datasets respectively. Excellent results from 5-fold validation indicates that our model was able to generalize the overall data and not just on some random split of the data. We also repeated the same process for 10-fold cross-validation and observed that the model achieved similar results with 0.96 and 0.99 macro-averaged F
1 scores for prostate and lung respectively. We chose to present the 5-fold results here, and the 10-fold cross validation results are presented in the
Figure S5 for the prostate and
Figure S6 for the lung. It is important to see the consistent performance of each label in all folds.
Figure 3b for the prostate and
Figure 4b for the lung shows that our model has performed consistently well across all folds for each class and provided consistent performance.
Center-based validation: VA has 40 radiation therapy centers. Even though they all are under one VA management, we believe that there are some differences in their practices. Each center operates as an individual institution at the practice level. In order to test this hypothesis, we trained the model on the data from 39 centers and tested it on one center and repeated this process until all the centers had been tested. We observed that the model achieved 0.94 and 0.93 overall macro-average F1 scores for the prostate and lung respectively. Although the model performed well, the performance dropped by 2% for the prostate and around 6% for the lung. This indicates that our model has high performance, but the inherent variance in structure naming practices at the different VA centers caused the model to make some mistakes, which lead to a decrease in performance when compared to the first two validation types.
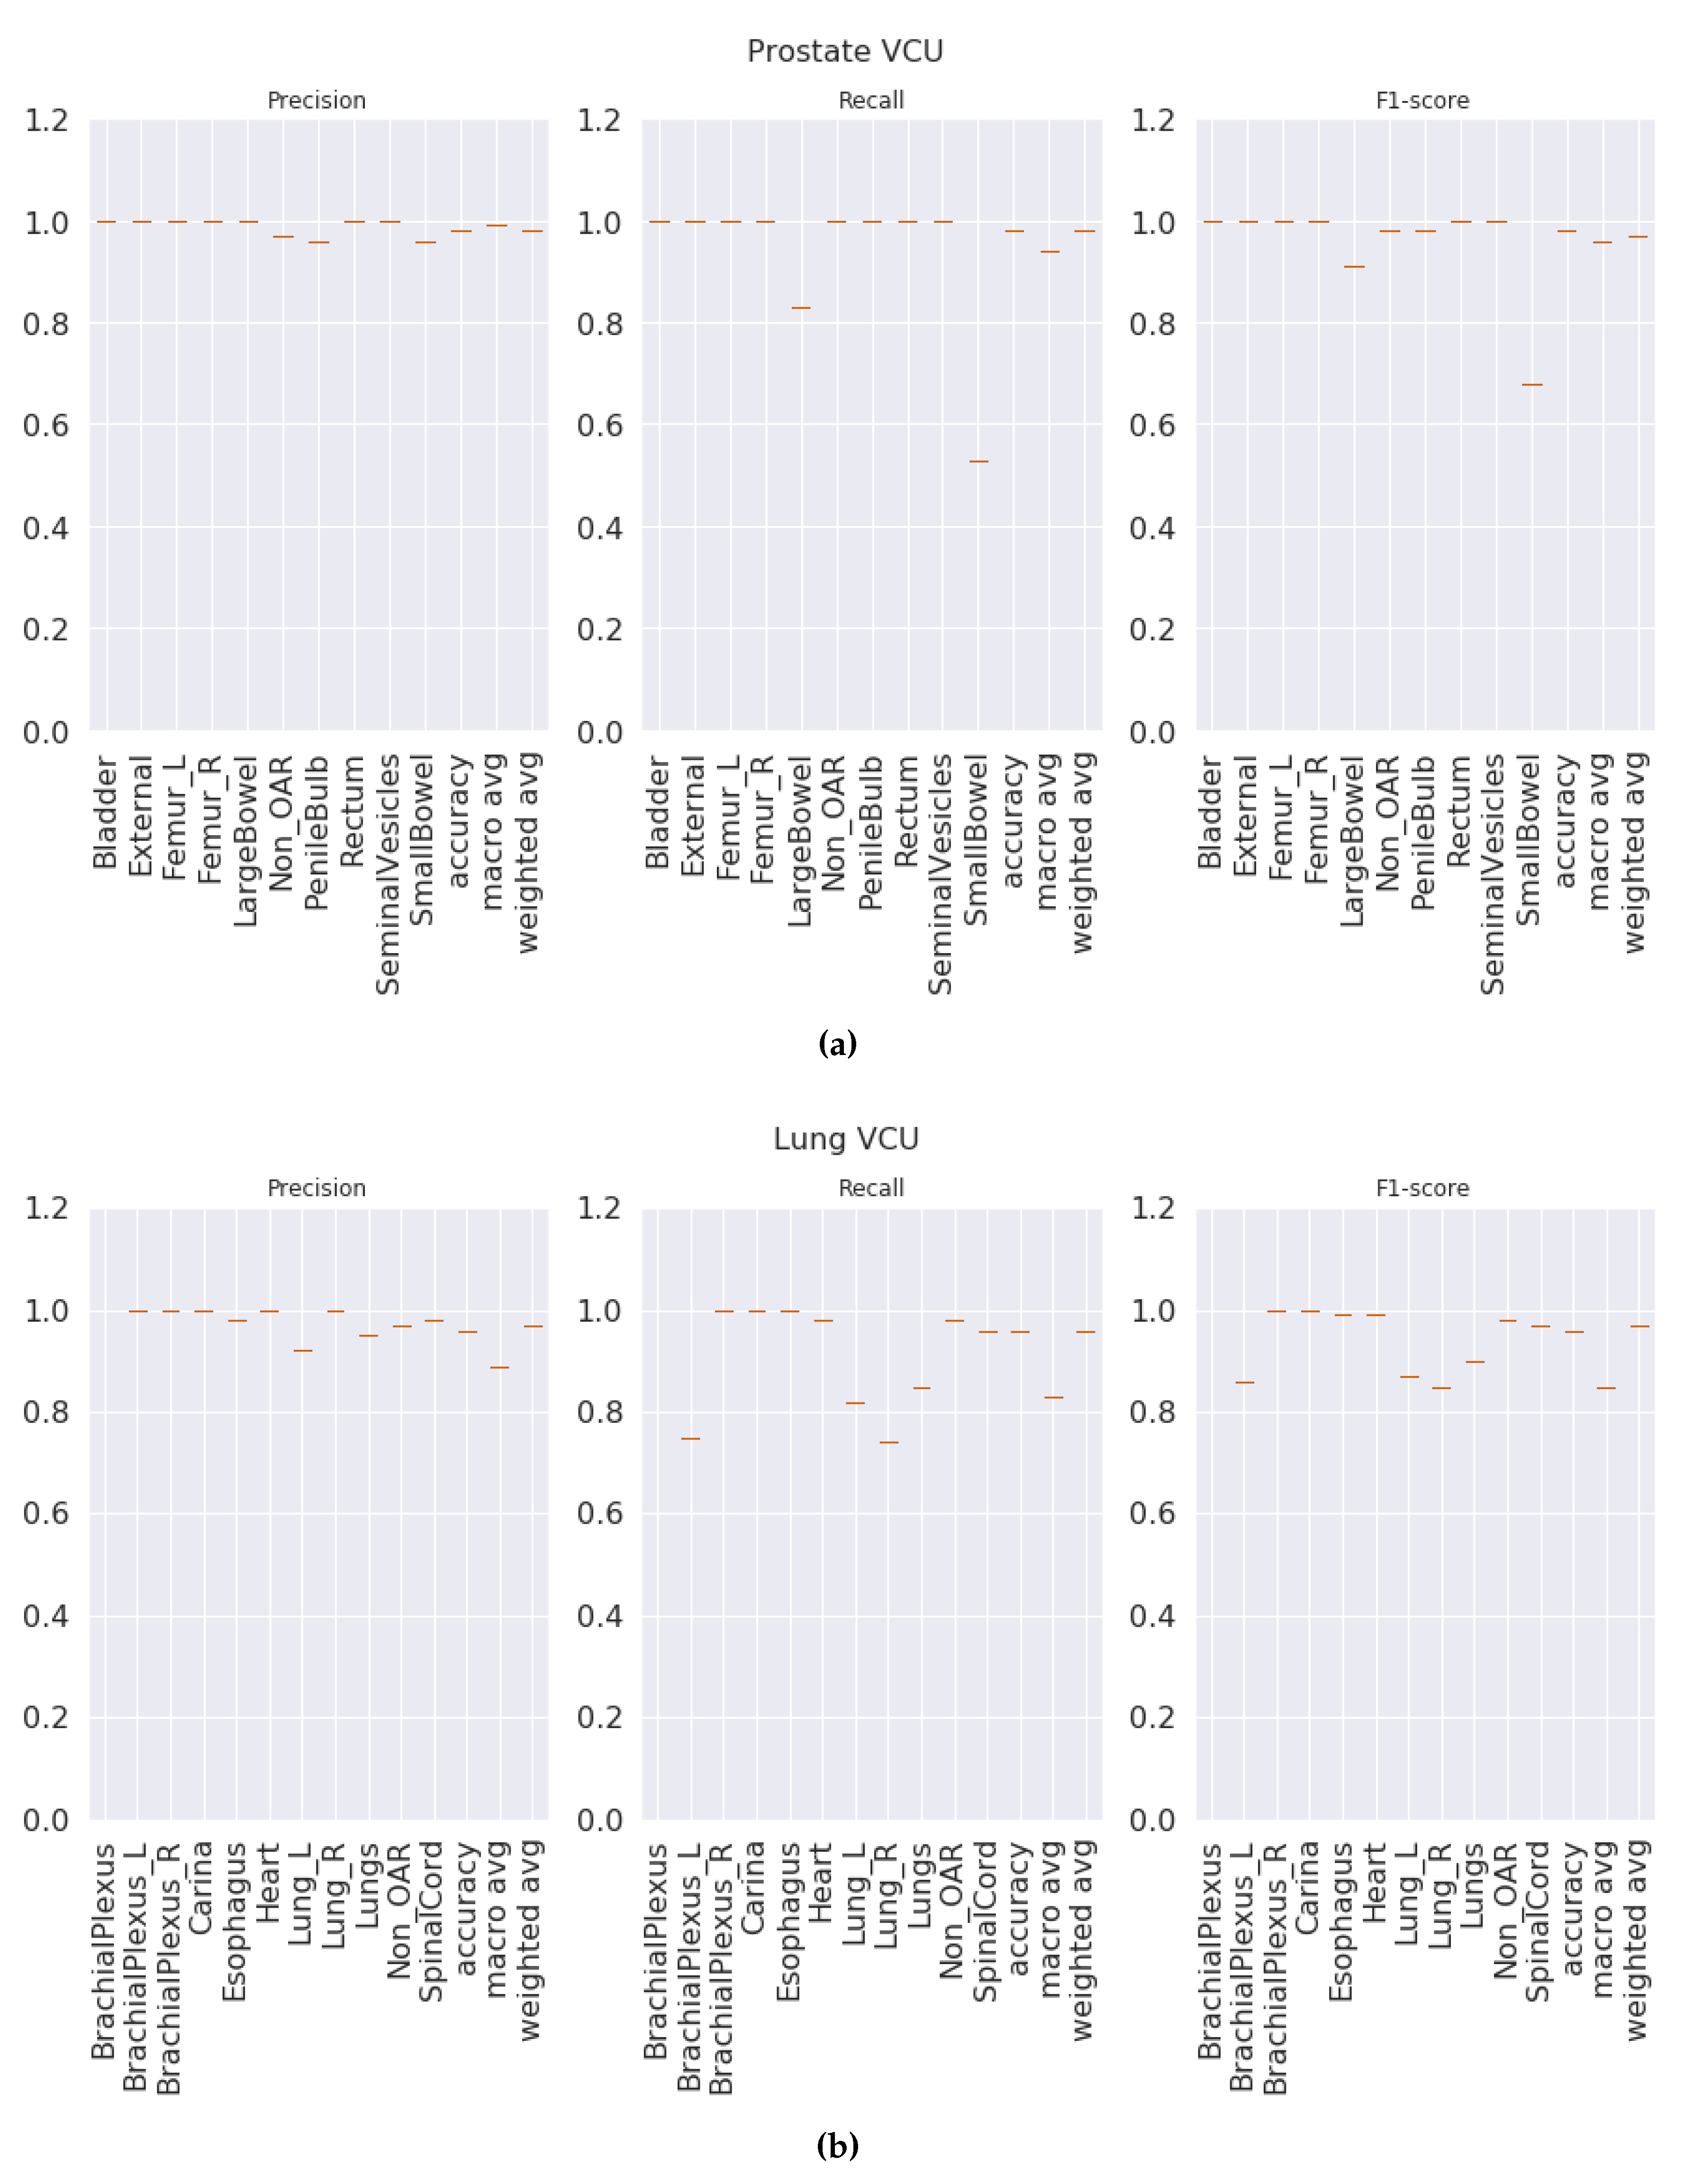
4.2. Test Results
Once the model is finalized after thorough validation methods, it is imperative to check the model’s performance on the unseen dataset. Here, the VCU dataset was used as a test set, which was never used in algorithm selection, model training, or validation. The final model was built with hyperparameters selected (see
Section 3.7) on the entire VA-ROQS dataset. By using the VCU dataset as a test set, we were able to assess two aspects of our model. First, the model’s ability to generalize the on unseen data. Second, generalizability and transfer learning on a dataset from a different source. We observed that our model was able to predict the correct labels with high macro-averaged F
1 scores of 0.94 and 0.86 for prostate and lung datasets, respectively. However, model performance dropped when compared to the model validation results, which indicates that although the model is robust, it is still affected by the change in the data source. We a observed drop in overall macro-average F
1 score due to the one OAR label
BrachialPlexus; VCU dataset did not have any OARs labeled
BrachialPlexus but our model predicted the
BrachialPlexus_L as
BrachialPlexus. Even if the number of samples is very few, macro-averaged metrics give equal importance to all labels and penalize the overall score regardless of the number of instances of labels in the dataset.
Figure 5a,b shows the class-wise results for prostate and lung data (see
Tables S3 and S8 in supplementary material for individual class level results of prostate and lung). We suspect that it is because VCU is an academic medical center, unlike the VA, and hence the structure-naming practices at VCU differ to accommodate the needs of academic hospitals.
5. Discussion
The proposed radiotherapy structure name standardization methodology is system agnostic. Each of the validation types we presented on the VA-ROQS data demonstrates that our model is robust and works well to identify the correct TG-263 standardized names. We also tested our model with data from outside of the VA system (VCU dataset) which shows that our method works well for data from other institutions.
For the prostate RT structures, we observed that the majority of mistakes made by the model were in classifying
SmallBowel and
LargeBowel. This confusion is attributed to the fact that the same name can be used for both anatomical structures. In
Table 6, we can see that “
bowel” is used to label both
SmallBowel and
LargeBowel.
In the VCU Lung dataset validation, accuracy and macro-average F
1 score dropped when compared to the 70:30 split validation. This drop was caused by the misclassification of the lung and brachial plexus related structures, as shown in
Table 7.
Error Analysis
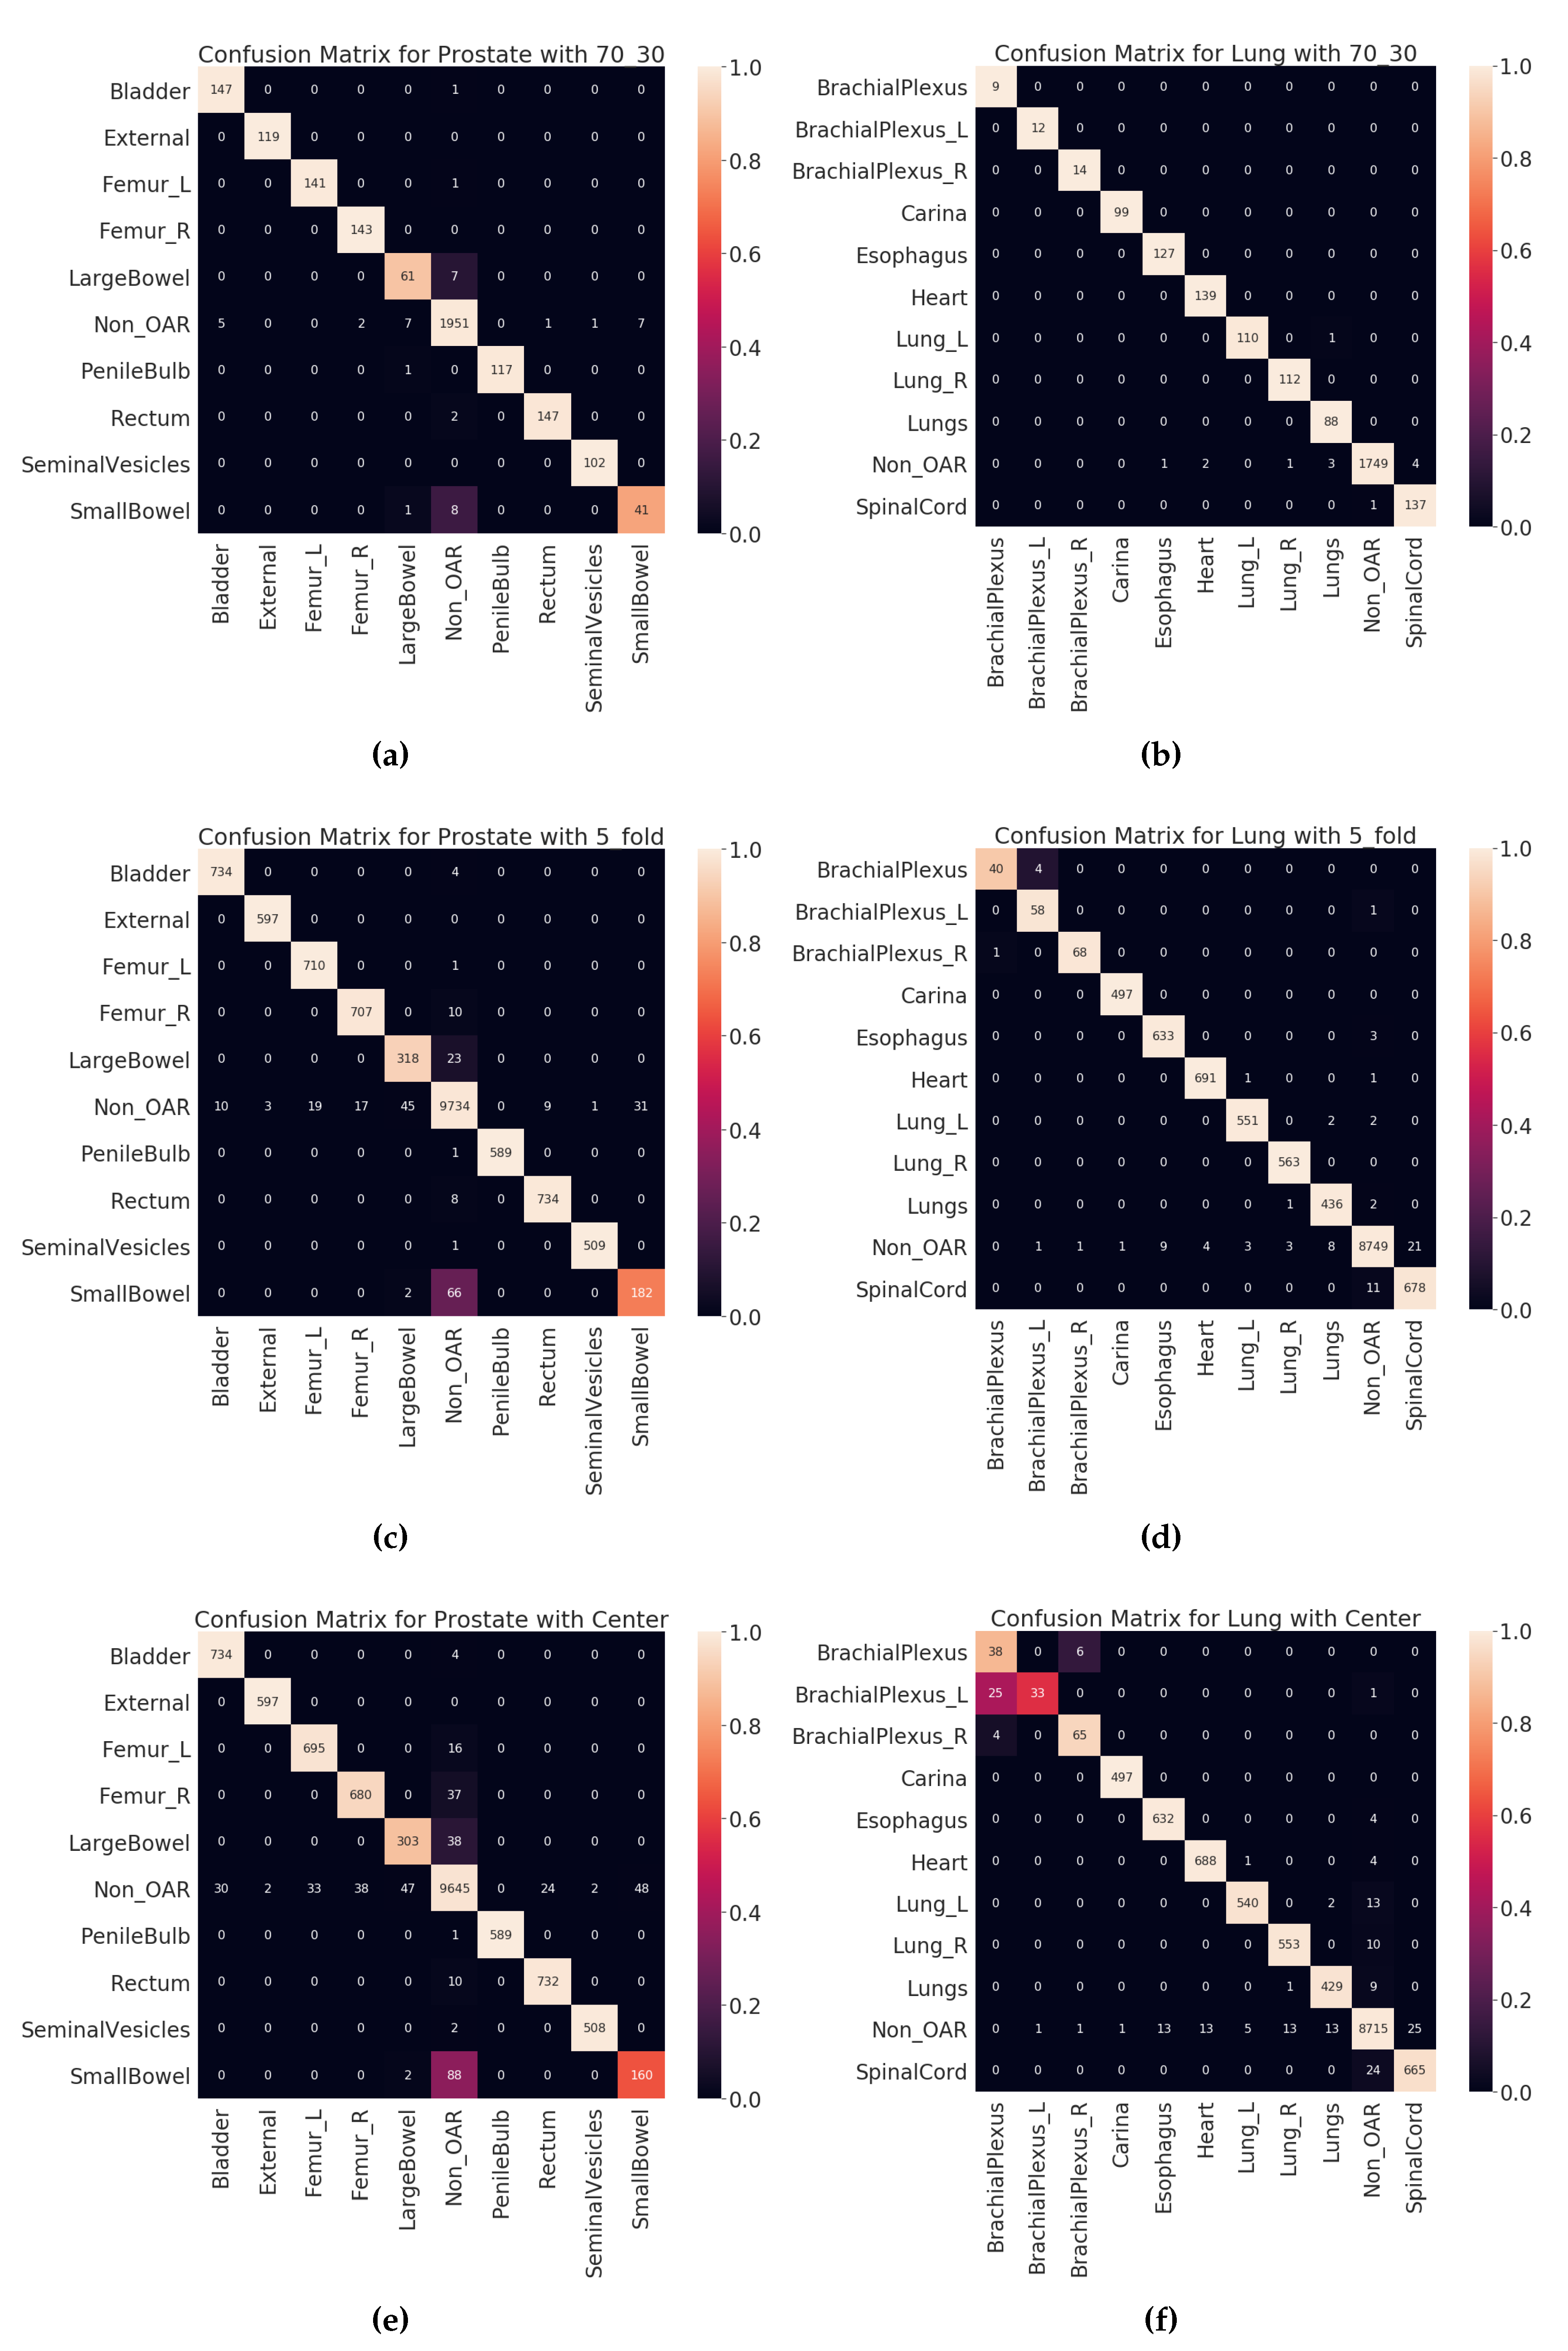
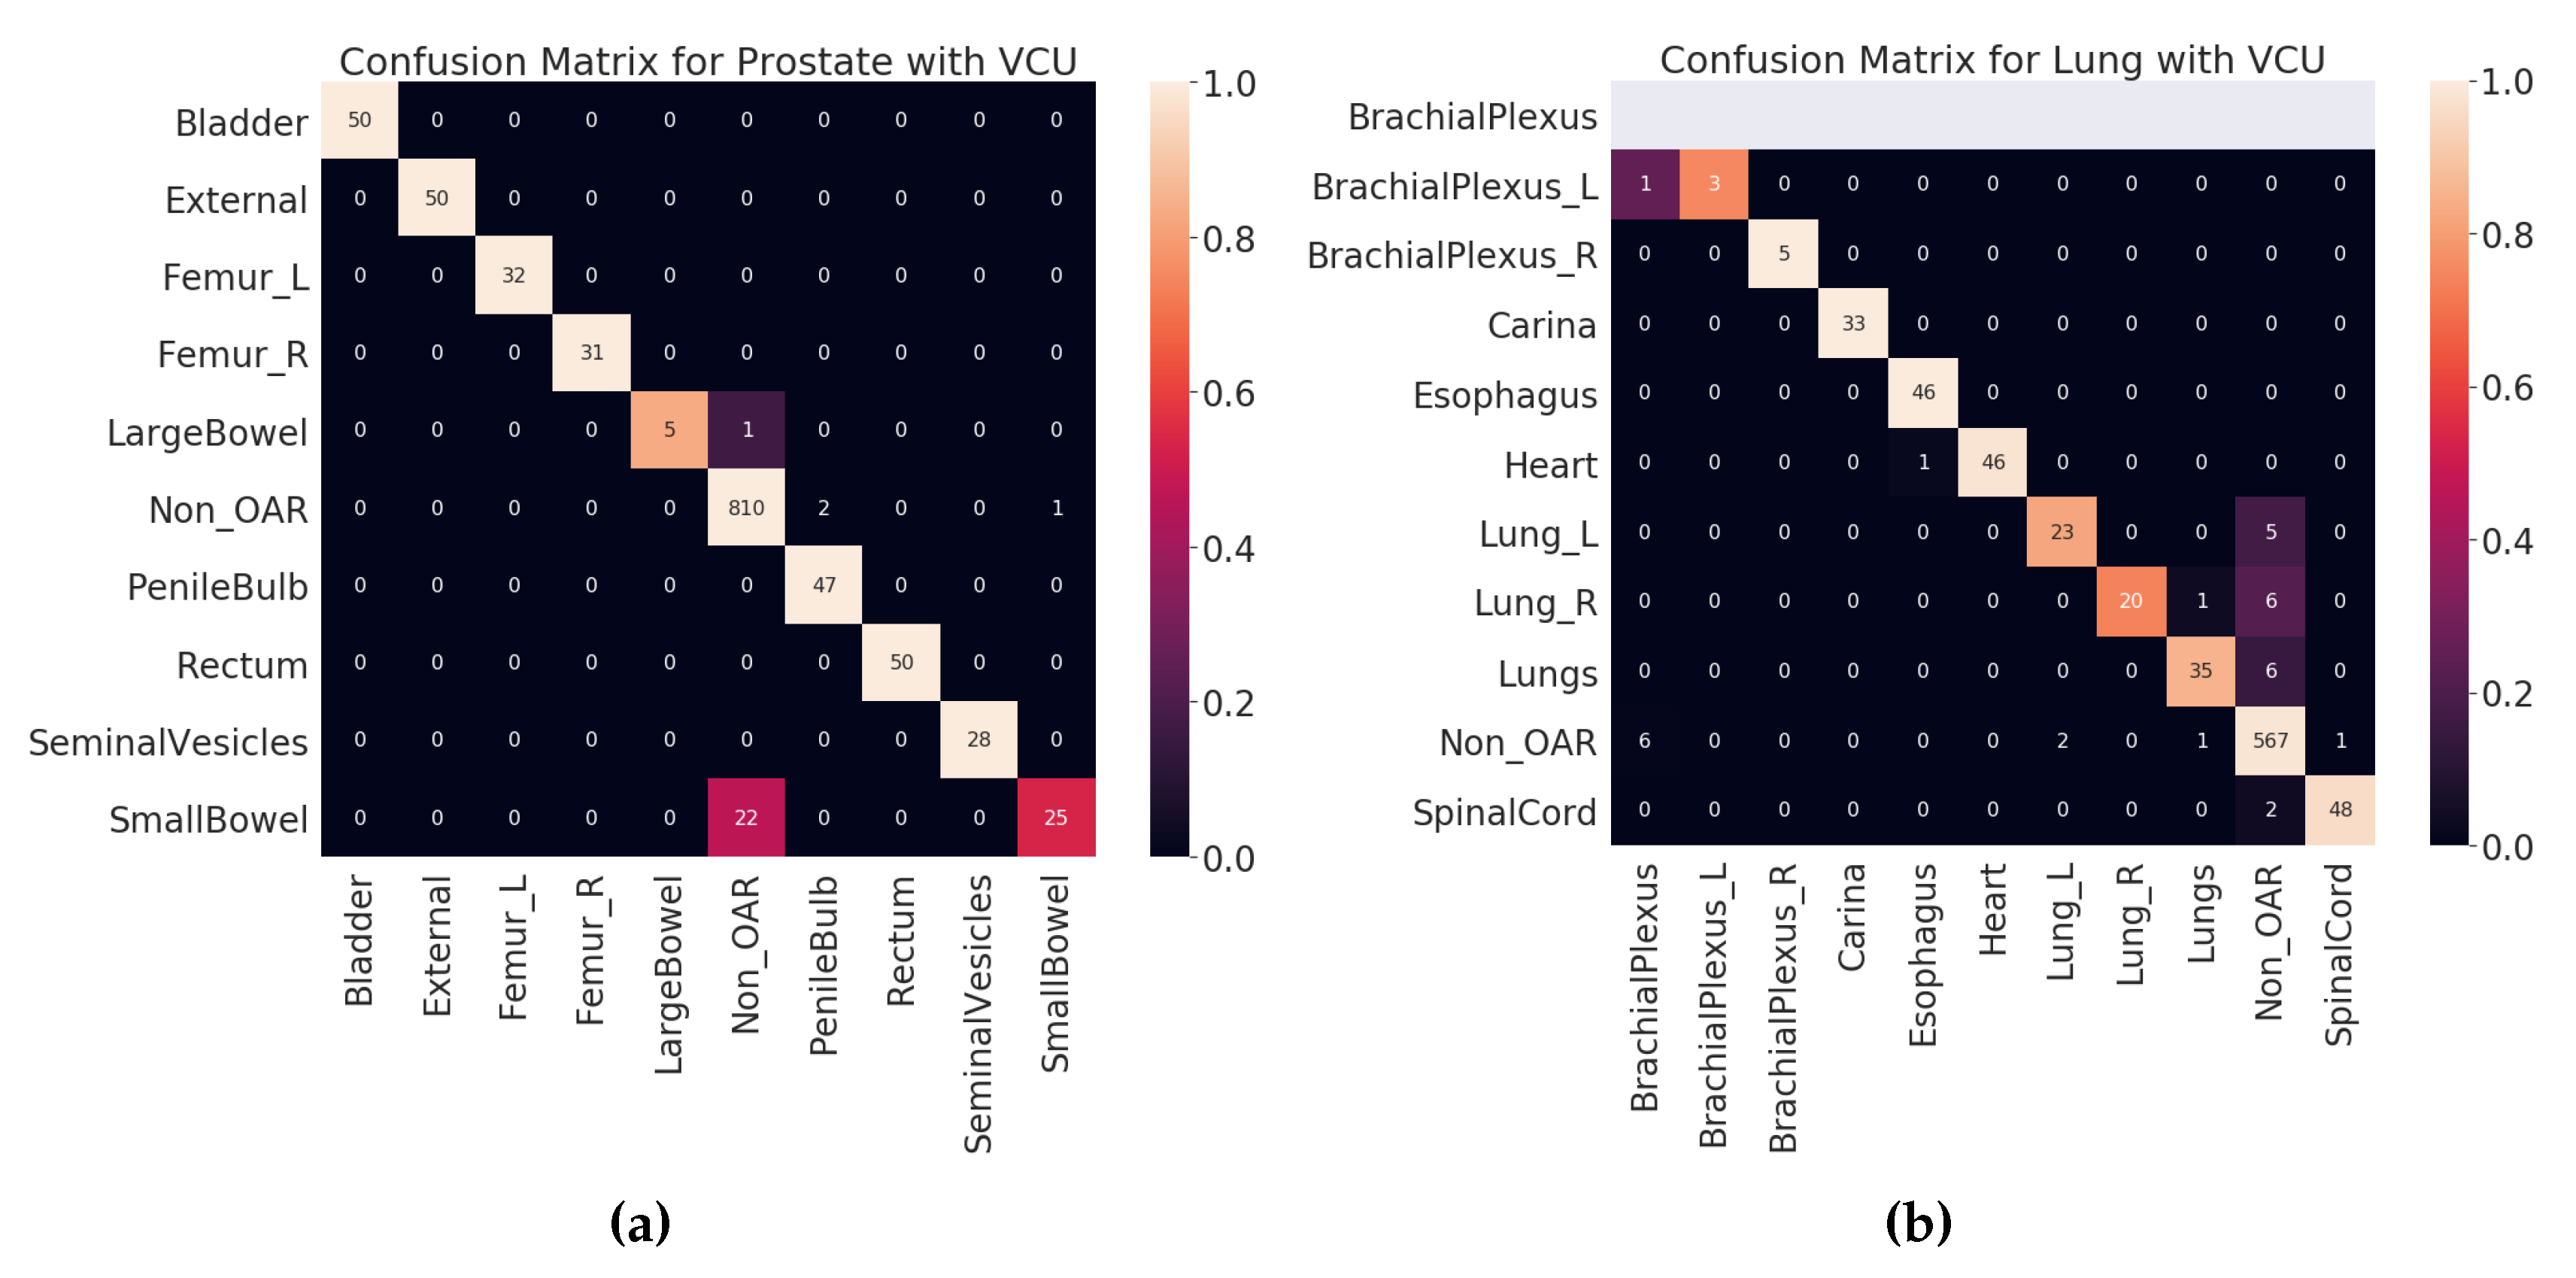
Figure 6 shows the confusion matrices for all validation types on validation dataset (VA-ROQS) and
Figure 7 shows the confusion matrices for each test dataset (VCU). We performed error analysis on the test set to understand our model’s ability to generalize on unseen data. Error analysis provides the insights into the reasoning behind the failure of the model prediction. We need to look at the types of errors made by our model; to this effect, we divided misclassified predictions into three main categories.
Type I: When the structure was OAR but predicted as Non_OAR.
Type II: When the structure was OAR but predicted as the wrong OAR.
Type III: When the structure was Non_OAR but predicted as OAR.
Type II and III errors are expensive errors when compared to the type I error, as they produce false-positive OAR. Below we will explain these errors based on each cancer type. Looking at the predicted and standard labels for physician-given names, we can infer that there is a pattern to errors for a few structures.
Table 6 shows the errors made on VCU Prostate dataset. We observe that the majority of the errors come from type I. The major error was due to the lack of signal in the text label. Just looking at the structure name “bowel” and inferring the “SmallBowel” or “LargeBowel” structures is difficult even for experts.
In case of Lung, we see that there are many more type II an III errors made by the model.
Table 7 shows all the errors made on the VCU Lung dataset. We can see that majority of the errors were made while predicting the structures related to the lungs (Lung_L, Lung_R, or Lungs) and brachial plexus. For lung-related structures we see that names containing numerical characters are most likely to be predicted as Non_OARs, as it is common for Non_OAR structures to contain numerical characters. For brachial plexus related structures, we can see that names containing “Plexus” are predicted as BrachialPlexus if there is no other information found to determine it as left or right BrachialPlexus. This also indicates the model errors due to the lack of signal in the input data. We also looked at the errors made by the model from holdout set (70:30 split) validation results (see
Tables S13 and S14 for prostate and lung errors respectively). We observed a similar patterns of errors for the prostate; the major confusion is between “SmallBowel” and “LargeBowel”.
Our work differs in many ways when compared to the most recent proposed approaches in the research community. Schuler et al. reported that their approach resulted in a 99% relabel rate [
4], but it requires the mappings from the domain expert from the same institute where data are collected. In contrast, our method provides the same success rate with the added advantage of working on arbitrary physician-given names from multiple institutes. Our work is scalable and generalizable to the external dataset. Two other works proposed machine-learning-based structure name standardization using geometric information [
7,
8]; both of those projects reported high accuracy. However, both of them did not use all the structures; instead they used only OARs. Our approach takes all possible structures into account and hence will work on real-world clinical datasets. However, due to the aforementioned limitations of the related work, it is not possible to perform a direct comparison between the accuracies from our approach and those from related work. It should also be noted that our proposed approach is the very first text mining based method to automatically standardize arbitrary structure names from the DICOM dataset.
6. Limitations and Future Work
Although a very high macro-average F1-score was achieved, we observed that our model made minor mistakes in identifying the correct TG-263 labels on the VCU dataset. To correct this issue, we plan to extend this work in two ways.
First, the fastText algorithm provides the probability of each predicted class. The probability of a class can be inferred as the model’s confidence in its prediction. By default, the model selects the class with the highest probability as it is prediction. However, this default setting generated high false positives. For example, there are nine standard structure names to choose from prostate data. If one class has 0.2 probability and the remaining is distributed rest of the classes, then the class with 0.2 probability is selected as a predicted class. It shows that the model has low confidence in its prediction and is most likely to provide a false-positive result. To avoid these false-positive predictions, we can accept the prediction only if it is above a certain threshold. Selecting the class above some high threshold will increase the model’s precision but will decrease the recall. It is crucial to have high precision and reasonably low recall; in the real world, false positives are more expensive than false negatives. It is vital to predict the correct labels in the structure name standardization process than being able to even predict all labels. False positives (wrong OAR labels) can hurt all downstream analyses. Hence, in the future, we will flag the low probability predictions to be verified by human experts, and these human-corrected predictions can then be used to retrain the model.
Secondly, just using physician-given names to predict the standard names has provided excellent results. However, we observed in some cases, just physician-given names are not enough to predict the standard label. For example, “Bowel” has been used by physicians to label SmallBowel and LargeBowel. It is clear from the example that physician-given names are not enough to build a highly accurate model for all the classes. We expect that image-based features will best augment the word-embedding-based features, which by themselves worked well, as demonstrated in this work. In the case where the combined model (word embedding with geometric information) is not enough, we plan to extend this model by further incorporating dose and volume data from the patient data to serve as additional features for consideration.
Our proposed model has three limitations. Firstly, we are only predicting the identities of the OARs and labeling them with standard names. However, the target (tumors) and PRVs are important structures and identifying and labeling them is also crucial for treatment delivery quality assessment. Secondly, we demonstrated that we can train on data from one institution and predict data from another. Our model is also language dependent, as it was trained only on structure names written in English. We believe the model pipeline will work for any language, but inter language models are only possible if they are trained on a mixture of languages. Thirdly, the ML pipeline from data preprocessing to prediction works as a standalone system. In the future, we plan to create a seamless enterprise informatics platform that can automatically collect data from the treatment planning systems and perform automatic structure name standardization on retrospective data.
7. Conclusions
In this paper, we presented a machine learning approach to standardize the radiotherapy structure names. We observed that the fastText algorithm works best when compared to other feature weighting and classification algorithms. Our method was evaluated with the data from 40 VA radiotherapy centers and tested on an external dataset from VCU. We demonstrated that our method works well on multiple disease sites and is also generalizable. To the best of our knowledge, this is the first and the only model using the physician-given name to predict the TG-263 standard name using NLP and machine-learning-based methods. We also observed that our approach fails in certain conditions, when enough information is not available for the model to infer the correct label. Our approach can be augmented with other available information, such as geometric information of structures. We believe that the proposed structure names standardization methods can help with big data analytics in the radiation therapy domain using population-derived datasets, including standardization of the treatment planning process, clinical decision support systems, treatment quality improvement programs, and hypothesis-driven clinical research.
Supplementary Materials
The following are available online at
https://www.mdpi.com/2227-9032/8/2/120/s1, Figure S1: Radiotherapy Structure name distribution per center for Prostate cancer in the VA-ROQS dataset; Figure S2: Radiotherapy Structure names distribution per center for Lung cancer patients in the VA-ROQS dataset; Figure S3: Hyperaparameter Tuning of fasttext for VA-ROQS Prostate cancer dataset; Figure S4: Hyperaparameter Tuning of fasttext for VA-ROQS Lung cancer dataset; Figure S5: VA-ROQS Prostate 10 fold cross-validation results; Figure S6: VA-ROQS Lung 10 fold cross-validation results; Table S1: Initial Model Selection Results for VA-ROQS Prostate datasets; Table S2: Initial Model Selection Results for VA-ROQS Lung datasets; Table S3: VCU Test Set results of Prostate structures; Table S4: VA-ROQS dataset 70:30 validation results for Prostate structures; Table S5: VA-ROQS Prostate dataset 5 fold validation results; Table S6: VA-ROQS Prostate dataset 10 fold validation; Table S7: VA-ROQS Prostate Center validation results; Table S8: VCU Test Set results of Lung structures; Table S9: VA-ROQS Lung dataset 70:30 validation results; Table S10: VA-ROQS Lung dataset Center validation results; Table S11: VA-ROQS Lung dataset 5 fold validation results; Table S12: VA-ROQS Lung dataset 10 fold Validation results; Table S13: Error analysis of VA prostate structure names with 70:30 split validation; Table S14: Error analysis of VA-ROQS dataset Lung structure names with 70:30 validation.
Author Contributions
Conceptualization, K.S.; data curation, W.S.I.; formal analysis, K.S.; investigation, K.S.; methodology, K.S. and P.G.; resources, R.K.; software, K.S. and K.I.; supervision, P.G.; validation, W.S.I. and P.G.; visualization, K.S.; writing—review and editing, K.S., W.S.I., K.I., R.K., J.P., M.H., and P.G. All authors have read and agreed to the published version of the manuscript.
Funding
The dataset used for this project was collected under a Department of Veteran Affairs funded study under the Radiation Oncology Quality Surveillance program. This anonymized dataset was available to us for secondary analysis and we utilized it for this study. The project was approved by Richmond Veteran Affairs Hospital Institution Review Board with an exempt status. The opinions, results, and conclusions reported in this paper are those of the authors and are independent from the funding sources. No endorsement by Veterans Health Affairs is intended or should be inferred.
Conflicts of Interest
The authors declare no conflict interest.
Abbreviations
The following abbreviations are used in this manuscript:
| AAPM | American Association of Physicists in Medicine |
| ASTRO | American Society for Radiation Oncology |
| TG-263 | Task Group-263 |
| RT | Radiotherapy |
| ROQS | Radiation Oncology Quality Surveillance Program |
| VCU | Virginia Commonwealth University |
| VA | Veterans Affairs |
| VHA | Veterans Health Administration |
| OAR | Organs-at-risk |
| Non_OAR | Non organs-at-risk |
| CT | Computed tomography |
| MRI | Magnetic resonance imaging |
| PRV | Planning organs-at-risk volume |
| QA | Quality assurance |
| NLP | Natural language processing |
| ML | Machine learning |
References
- Wright, J.L.; Yom, S.S.; Awan, M.J.; Dawes, S.; Fischer-Valuck, B.; Kudner, R.; Mailhot Vega, R.; Rodrigues, G. Standardizing Normal Tissue Contouring for Radiation Therapy Treatment Planning: An ASTRO Consensus Paper. Pract. Radiat. Oncol. 2019, 9, 65–72. [Google Scholar] [CrossRef] [PubMed]
- Benedict, S.H.; Hoffman, K.; Martel, M.K.; Abernethy, A.P.; Asher, A.L.; Capala, J.; Chen, R.C.; Chera, B.; Couch, J.; Deye, J.; et al. Overview of the American Society for Radiation Oncology–National Institutes of Health–American Association of Physicists in Medicine Workshop 2015: Exploring opportunities for radiation oncology in the era of big data. Int. J. Radiat. Oncol. Biol. Phys. 2016, 95, 873–879. [Google Scholar] [CrossRef] [PubMed]
- Mayo, C.S.; Moran, J.M.; Bosch, W.; Xiao, Y.; McNutt, T.; Popple, R.; Michalski, J.; Feng, M.; Marks, L.B.; Fuller, C.D.; et al. American Association of Physicists in Medicine Task Group 263: Standardizing Nomenclatures in Radiation Oncology. Int. J. Radiat. Oncol. Biol. Phys. 2018, 100, 1057–1066. [Google Scholar] [CrossRef] [PubMed]
- Schuler, T.; Kipritidis, J.; Eade, T.; Hruby, G.; Kneebone, A.; Perez, M.; Grimberg, K.; Richardson, K.; Evill, S.; Evans, B.; et al. Big Data Readiness in Radiation Oncology: An Efficient Approach for Relabeling Radiation Therapy Structures With Their TG-263 Standard Name in Real-World Data Sets. Adv. Radiat. Oncol. 2019, 4, 191–200. [Google Scholar] [CrossRef] [PubMed]
- Lustberg, T.; Van Soest, J.; Fick, P.; Fijten, R.; Hendriks, T.; Puts, S.; Dekker, A. Radiation Oncology Terminology Linker: A Step Towards a Linked Data Knowledge Base. Stud. Health Technol. Inform. 2018, 247, 855–859. [Google Scholar] [PubMed]
- Ruan, D.; Shao, W.; Wong, J.; Veruttipong, D.; Steinberg, M.; Low, D.; Kupelian, P. SU-F-T-102: Automatic Curation for a Scalable Registry Using Machine Learning. Med. Phys. 2016, 43, 3485. [Google Scholar] [CrossRef]
- Rhee, D.; Nguyen, C.; Netherton, T.; Owens, C.; Court, L.; Cardenas, C. TG263-Net: A Deep Learning Model for Organs-At-Risk Nomenclature Standardization. In MEDICAL PHYSICS; WILEY: Hoboken, NJ, USA, 2019; Volume 46, p. E263. [Google Scholar]
- Yang, Q.; Chao, H.; Nguyen, D.; Jiang, S. A Novel Deep Learning Framework for Standardizing the Label of OARs in CT. In Workshop on Artificial Intelligence in Radiation Therapy; Springer: Berlin/Heidelberg, Germany, 2019; pp. 52–60. [Google Scholar]
- Hagan, M.; Kapoor, R.; Michalski, J.; Sandler, H.; Movsas, B.; Chetty, I.; Lally, B.; Rengan, R.; Robinson, C.; Rimner, A.; et al. VA-Radiation Oncology Quality Surveillance Program. Int. J. Radiat. Oncol. Biol. Phys. 2020, 106, 639–647. [Google Scholar] [CrossRef] [PubMed]
- McCartney, A.; Hensman, S.; Longo, L. “How short is a piece of string?” The Impact of Text Length and Text Augmentation on Short-text Classification Accuracy. In Proceedings of the 25th Irish Conference on Artificial Intelligence and Cognitive Science, Dublin, Ireland, 7–8 December 2017. [Google Scholar]
- Bird, S.; Klein, E.; Loper, E. Natural Language Processing with Python: Analyzing Text with the Natural Language toolkit; O’Reilly Media, Inc.: Sebastopol, CA, USA, 2009. [Google Scholar]
- Harris, Z.S. Distributional structure. Word 1954, 10, 146–162. [Google Scholar] [CrossRef]
- Feldman, R.; Sanger, J. The Text Mining Handbook: Advanced Approaches in Analyzing Unstructured Data; Cambridge University Press: Cambridge, UK, 2007. [Google Scholar]
- Hill, T.; Lewicki, P.; Lewicki, P. Statistics: Methods and Applications: A Comprehensive Reference for Science, Industry, and Data Mining; StatSoft, Inc.: Tulsa, OK, USA, 2006. [Google Scholar]
- Sebastiani, F. Text categorization. In Encyclopedia of Database Technologies and Applications; IGI Global: Hershey, PA, USA, 2005; pp. 683–687. [Google Scholar]
- Mikolov, T.; Sutskever, I.; Chen, K.; Corrado, G.S.; Dean, J. Distributed representations of words and phrases and their compositionality. In Proceedings of the NIPS 2013 Advances in Neural Information Processing Systems, Lake Tahoe, NV, USA, 5–10 December 2013; pp. 3111–3119. [Google Scholar]
- Pennington, J.; Socher, R.; Manning, C. Glove: Global vectors for word representation. In Proceedings of the 2014 Conference on Empirical Methods in Natural Language Processing (EMNLP), Doha, Qatar, 25–29 October 2014; pp. 1532–1543. [Google Scholar]
- Joulin, A.; Grave, E.; Bojanowski, P.; Mikolov, T. Bag of Tricks for Efficient Text Classification. arXiv 2016, arXiv:1607.01759. [Google Scholar]
- Vapnik, V. The Nature of Statistical Learning Theory; Springer Science & Business Media: Berlin, Germany, 2013. [Google Scholar]
- Boser, B.E.; Guyon, I.M.; Vapnik, V.N. A training algorithm for optimal margin classifiers. In Proceedings of the Fifth Annual Workshop on Computational Learning Theory; ACM: New York, NY, USA, 1992; pp. 144–152. [Google Scholar]
- Cover, T.; Hart, P. Nearest neighbor pattern classification. IEEE Trans. Inf. Theory 1967, 13, 21–27. [Google Scholar] [CrossRef]
- Kleinbaum, D.G.; Dietz, K.; Gail, M.; Klein, M.; Klein, M. Logistic Regression; Springer: Berlin/Heidelberg, Germany, 2002. [Google Scholar]
- Breiman, L. Random forests. Mach. Learn. 2001, 45, 5–32. [Google Scholar] [CrossRef]
- Pedregosa, F.; Varoquaux, G.; Gramfort, A.; Michel, V.; Thirion, B.; Grisel, O.; Blondel, M.; Prettenhofer, P.; Weiss, R.; Dubourg, V.; et al. Scikit-learn: Machine Learning in Python. J. Mach. Learn. Res. 2011, 12, 2825–2830. [Google Scholar]
- Kuhn, M.; Johnson, K. Applied Predictive Modeling; Springer: Berlin/Heidelberg, Germany, 2013. [Google Scholar]
- Russell, S.; Norvig, P. Artificial Intelligence: A Modern Approach, global, 3rd ed.; Pearson: Essex, UK, 2016. [Google Scholar]
- Zhang, X.; LeCun, Y. Text understanding from scratch. arXiv 2015, arXiv:1502.01710. [Google Scholar]
Figure 1.
A representative CT image overlaid with its defined structures. The left side of the figure shows the physician-transcribed names of the structures delineated on the right side. The physician-transcribed names and structures delineated can be matched by the color.
Figure 1.
A representative CT image overlaid with its defined structures. The left side of the figure shows the physician-transcribed names of the structures delineated on the right side. The physician-transcribed names and structures delineated can be matched by the color.
Figure 2.
Pictorial representation of fastText supervised classification algorithm.
Figure 2.
Pictorial representation of fastText supervised classification algorithm.
Figure 3.
VA-ROQS prostate dataset—cross-validation results: (a) VA-ROQS 70:30 split cross-validation, (b) VA-ROQS 5-fold cross-validation, (c) VA-ROQS center based validation.
Figure 3.
VA-ROQS prostate dataset—cross-validation results: (a) VA-ROQS 70:30 split cross-validation, (b) VA-ROQS 5-fold cross-validation, (c) VA-ROQS center based validation.
Figure 4.
VA-ROQS lung dataset—cross-validation results: (a) VA-ROQS 70:30 split cross-validation (b) VA-ROQS 5-fold cross-validation (c) VA-ROQS center based validation.
Figure 4.
VA-ROQS lung dataset—cross-validation results: (a) VA-ROQS 70:30 split cross-validation (b) VA-ROQS 5-fold cross-validation (c) VA-ROQS center based validation.
Figure 5.
Test results (VCU dataset): (a) prostate, (b) lung.
Figure 5.
Test results (VCU dataset): (a) prostate, (b) lung.
Figure 6.
Validation set (VA-ROQS) confusion matrices of different validation types for both prostate and lung. (a) Prostate 70:30 split validation. (b) Lung 70:30 split validation. (c) Prostate 5-fold cross-validation. (d) Lung 5-fold cross-validation. (e) Prostate VA Center cross-validation. (f) Lung VA center cross-validation. Lighter color indicates better prediction. Diagonal indicates the correctly predicted labels.
Figure 7.
Test set (VCU) confusion matrices. (a) Prostate. (b) Lung. Lighter color indicates better prediction. Diagonal indicates the correctly predicted labels.
Figure 7.
Test set (VCU) confusion matrices. (a) Prostate. (b) Lung. Lighter color indicates better prediction. Diagonal indicates the correctly predicted labels.
Table 1.
Lung structure type distribution in VA-ROQS and VCU datasets.
Table 1.
Lung structure type distribution in VA-ROQS and VCU datasets.
| | VA-ROQS
Non Standard Name | VCU
Non Standard Name |
|---|
| Standard Name | Total Count | Unique Count | Total Count | Unique Count |
|---|
| Brachial_Plexus | 44 | 11 | 0 | 0 |
| Brachial_Plexus_L | 59 | 14 | 4 | 5 |
| Brachial_Plexus_R | 69 | 23 | 5 | 3 |
| Carina | 497 | 7 | 33 | 2 |
| Esophagus | 636 | 28 | 46 | 4 |
| Heart | 693 | 21 | 47 | 2 |
| Lung_L | 553 | 46 | 28 | 10 |
| Lung_R | 563 | 46 | 27 | 10 |
| Lungs | 439 | 39 | 41 | 10 |
| Non_OAR | 8800 | 3701 | 577 | 259 |
| SpinalCord | 689 | 37 | 50 | 7 |
| Total | 13,044 | 3973 | 858 | 309 |
Table 2.
Prostate structure type distribution in VA-ROQS and VCU datasets.
Table 2.
Prostate structure type distribution in VA-ROQS and VCU datasets.
| | VA-ROQS
Non Standard Name | VCU
Non Standard Name |
|---|
| Standard Name | Total Count | Unique Count | Total Count | Unique Count |
|---|
| SmallBowel | 250 | 40 | 47 | 7 |
| LargeBowel | 341 | 33 | 6 | 2 |
| Femur_R | 717 | 62 | 31 | 14 |
| Femur_L | 711 | 59 | 32 | 16 |
| Rectum | 742 | 14 | 50 | 3 |
| Bladder | 738 | 10 | 50 | 3 |
| External | 597 | 5 | 50 | 1 |
| SeminalVesicles | 510 | 50 | 28 | 8 |
| PenileBulb | 590 | 33 | 47 | 12 |
| Non_OAR | 9869 | 2886 | 813 | 425 |
| Total | 15,065 | 3195 | 1154 | 491 |
Table 3.
Examples of physician-given names of structures from 40 VHA-ROQS centers. These are some examples from all the names given by physicians.
Table 3.
Examples of physician-given names of structures from 40 VHA-ROQS centers. These are some examples from all the names given by physicians.
| TG-263 Standard Name | Examples of Physician-Given Names |
|---|
| LargeBowel | Colon_Sigmoid, BOWEL LARGE, Bowel, sigmoid colon, |
| Bowel_LG, SIGMOID_COLON, colon, Sigmoid OAR, |
| Bowel NOS, large bowl, Sigmoid AZ, large bowel, |
| Lg bowel, LG BOWEL, COLON_partial, LargeBowel, |
| Sigmoid-AZ, Bowel Large, Rectosigmoid, Sigmoid Colon, |
| LARGE BOWEL, SIGMOID08JUN16 |
| Femur_L | FEMORAL LT, Femur_L, LFH, Femur_LT, |
| Femoral Head Lt, Femoral Head_Lt, Lt Fem Head, |
| FEMUR_L, left_femhead, Femur L, |
| L_FEM HEAD, Lt Femur, Femur_Head_L, |
| Hip Left, Femur-Lt, Lt Femoral Head, |
| Fem hd neck Lt, Lt Hip, lt fem head, |
| Femoral Lt, Femoral Head L, FEM HEAD LT, |
| L Fem Hd, Femur Left, Femur l., |
| lt femoral hd, Left Femoral head JPC |
Table 4.
fastText hyperparameters and values tested for tuning the model.
Table 4.
fastText hyperparameters and values tested for tuning the model.
| Parameter | Name | Best Value | Values Tested | Description |
|---|
| epoch | number of epochs | 50 | 5, 10, 15, 20, 25, 35, 45, 50 | This parameter is used to determine the number of times a model will see the entire dataset |
| lr | learning rate | 1.0 | 0.05, 0.1, 0.25, 0.5, 0.7, 1.0 | This determines the step size taken at each iteration while moving toward a minimum of loss function |
| minn | minnum length of char ngram | 2 | 2 | minimum length of subword used to build word vector |
| maxn | maximum length of char ngram | 6 | 3, 4, 5, 6 | maximum length of subword used to build word vector |
| wordNgrams | maximum length of char ngram | 2 | 2 | Along with unique terms consecutive n-terms word vectors are generated |
| dim | size of the word vector | 300 | 100, 150, 200, 250, 300 | In ML context word vectors are numerical representations of word. dim indicates the length of the representation |
| ws | size of the context window | 3 | 3, 4, 5, 6 | Word vectors are build in such a way that it can predict the neighboring words in given text. It helps to encode the semantics of word. Window size indicates the range of words to predict. |
| loss | loss function | softmax | ns, hs, ova, softmax | A loss function is a measure of how good a prediction model does in terms of being able to predict the expected outcome. |
Table 5.
Disease specific macro-averaged precision, recall, F1 score, and overall accuracy for validation and test sets.
Table 5.
Disease specific macro-averaged precision, recall, F1 score, and overall accuracy for validation and test sets.
| Evaluation Type | Disease | Validation Type | Precision | Recall | F1 score | Accuracy |
|---|
Validation
(VA-ROQS) | Prostate | 70:30 | 0.97 | 0.97 | 0.97 | 0.99 |
| 5-fold | 0.96 | 0.96 | 0.96 | 0.98 |
| 10-fold | 0.96 | 0.97 | 0.96 | 0.98 |
| VA Center | 0.94 | 0.94 | 0.94 | 0.97 |
| Lung | 70:30 | 1.00 | 0.99 | 0.99 | 1.00 |
| 5-fold | 0.98 | 0.98 | 0.98 | 0.99 |
| 10-fold | 0.99 | 0.99 | 0.99 | 0.99 |
| VA Center | 0.93 | 0.93 | 0.93 | 0.99 |
Test
(VCU) | Prostate | - | 0.94 | 0.99 | 0.96 | 0.98 |
| Lung | - | 0.83 | 0.89 | 0.86 | 0.96 |
Table 6.
Error analysis of VCU dataset prostate structure.
Table 6.
Error analysis of VCU dataset prostate structure.
| Error Type | Physician
Given Name | TG-263 Name
Standard Name | Predicted
Name | Count |
|---|
| Type I | bowel | LargeBowel | Non_OAR | 1 |
| bowel | SmallBowel | Non_OAR | 22 |
| Type II | nonptvpenilebulb | Non_OAR | PenileBulb | 2 |
| small bowel | Non_OAR | SmallBowel | 1 |
Table 7.
Error analysis of VCU dataset lung structure names.
Table 7.
Error analysis of VCU dataset lung structure names.
| Error Type | Physician
Given Name | TG-263
Standard Name | Predicted
Name | Count |
|---|
| Type I | bilatlungs | Lungs | Non_OAR | 5 |
| ptv | Lungs | Non_OAR | 1 |
| lung-l | Lung_L | Non_OAR | 1 |
| lung_l1 | Lung_L | Non_OAR | 4 |
| lung-r | Lung_R | Non_OAR | 2 |
| lung_r1 | Lung_R | Non_OAR | 4 |
| spinal column | SpinalCord | Non_OAR | 1 |
| spine | SpinalCord | Non_OAR | 1 |
| Type II | brachial_plexus | BrachialPlexus_L | BrachialPlexus | 1 |
| esophagus | Heart | Esophagus | 1 |
| lung | Lung_R | Lungs | 1 |
| Type III | ipsi_lung | Non_OAR | Lung_L | 1 |
| left lung | Non_OAR | Lung_L | 1 |
| brachial plexus | Non_OAR | BrachialPlexus | 1 |
| brachial_plexus | Non_OAR | BrachialPlexus | 2 |
| lung | Non_OAR | Lungs | 1 |
| plexus | Non_OAR | BrachialPlexus | 3 |
| t7 cord | Non_OAR | SpinalCord | 1 |
© 2020 by the authors. Licensee MDPI, Basel, Switzerland. This article is an open access article distributed under the terms and conditions of the Creative Commons Attribution (CC BY) license (http://creativecommons.org/licenses/by/4.0/).

 ,
, 


