Impact of Media Reports and Environmental Pollution on Health and Health Expenditure Efficiency


Abstract
1. Introduction
2. Literature Review and Research Hypotheses
3. Research Method
3.1. The Meta Undesirable Two-Stage EBM DEA Model
3.2. Fixed Assets, Labor, Energy Consumption, GDP, Health Expenditure, Media, Birth Rate, and Respiratory Diseases Efficiencies
4. Empirical Study
4.1. Data Sources and Description
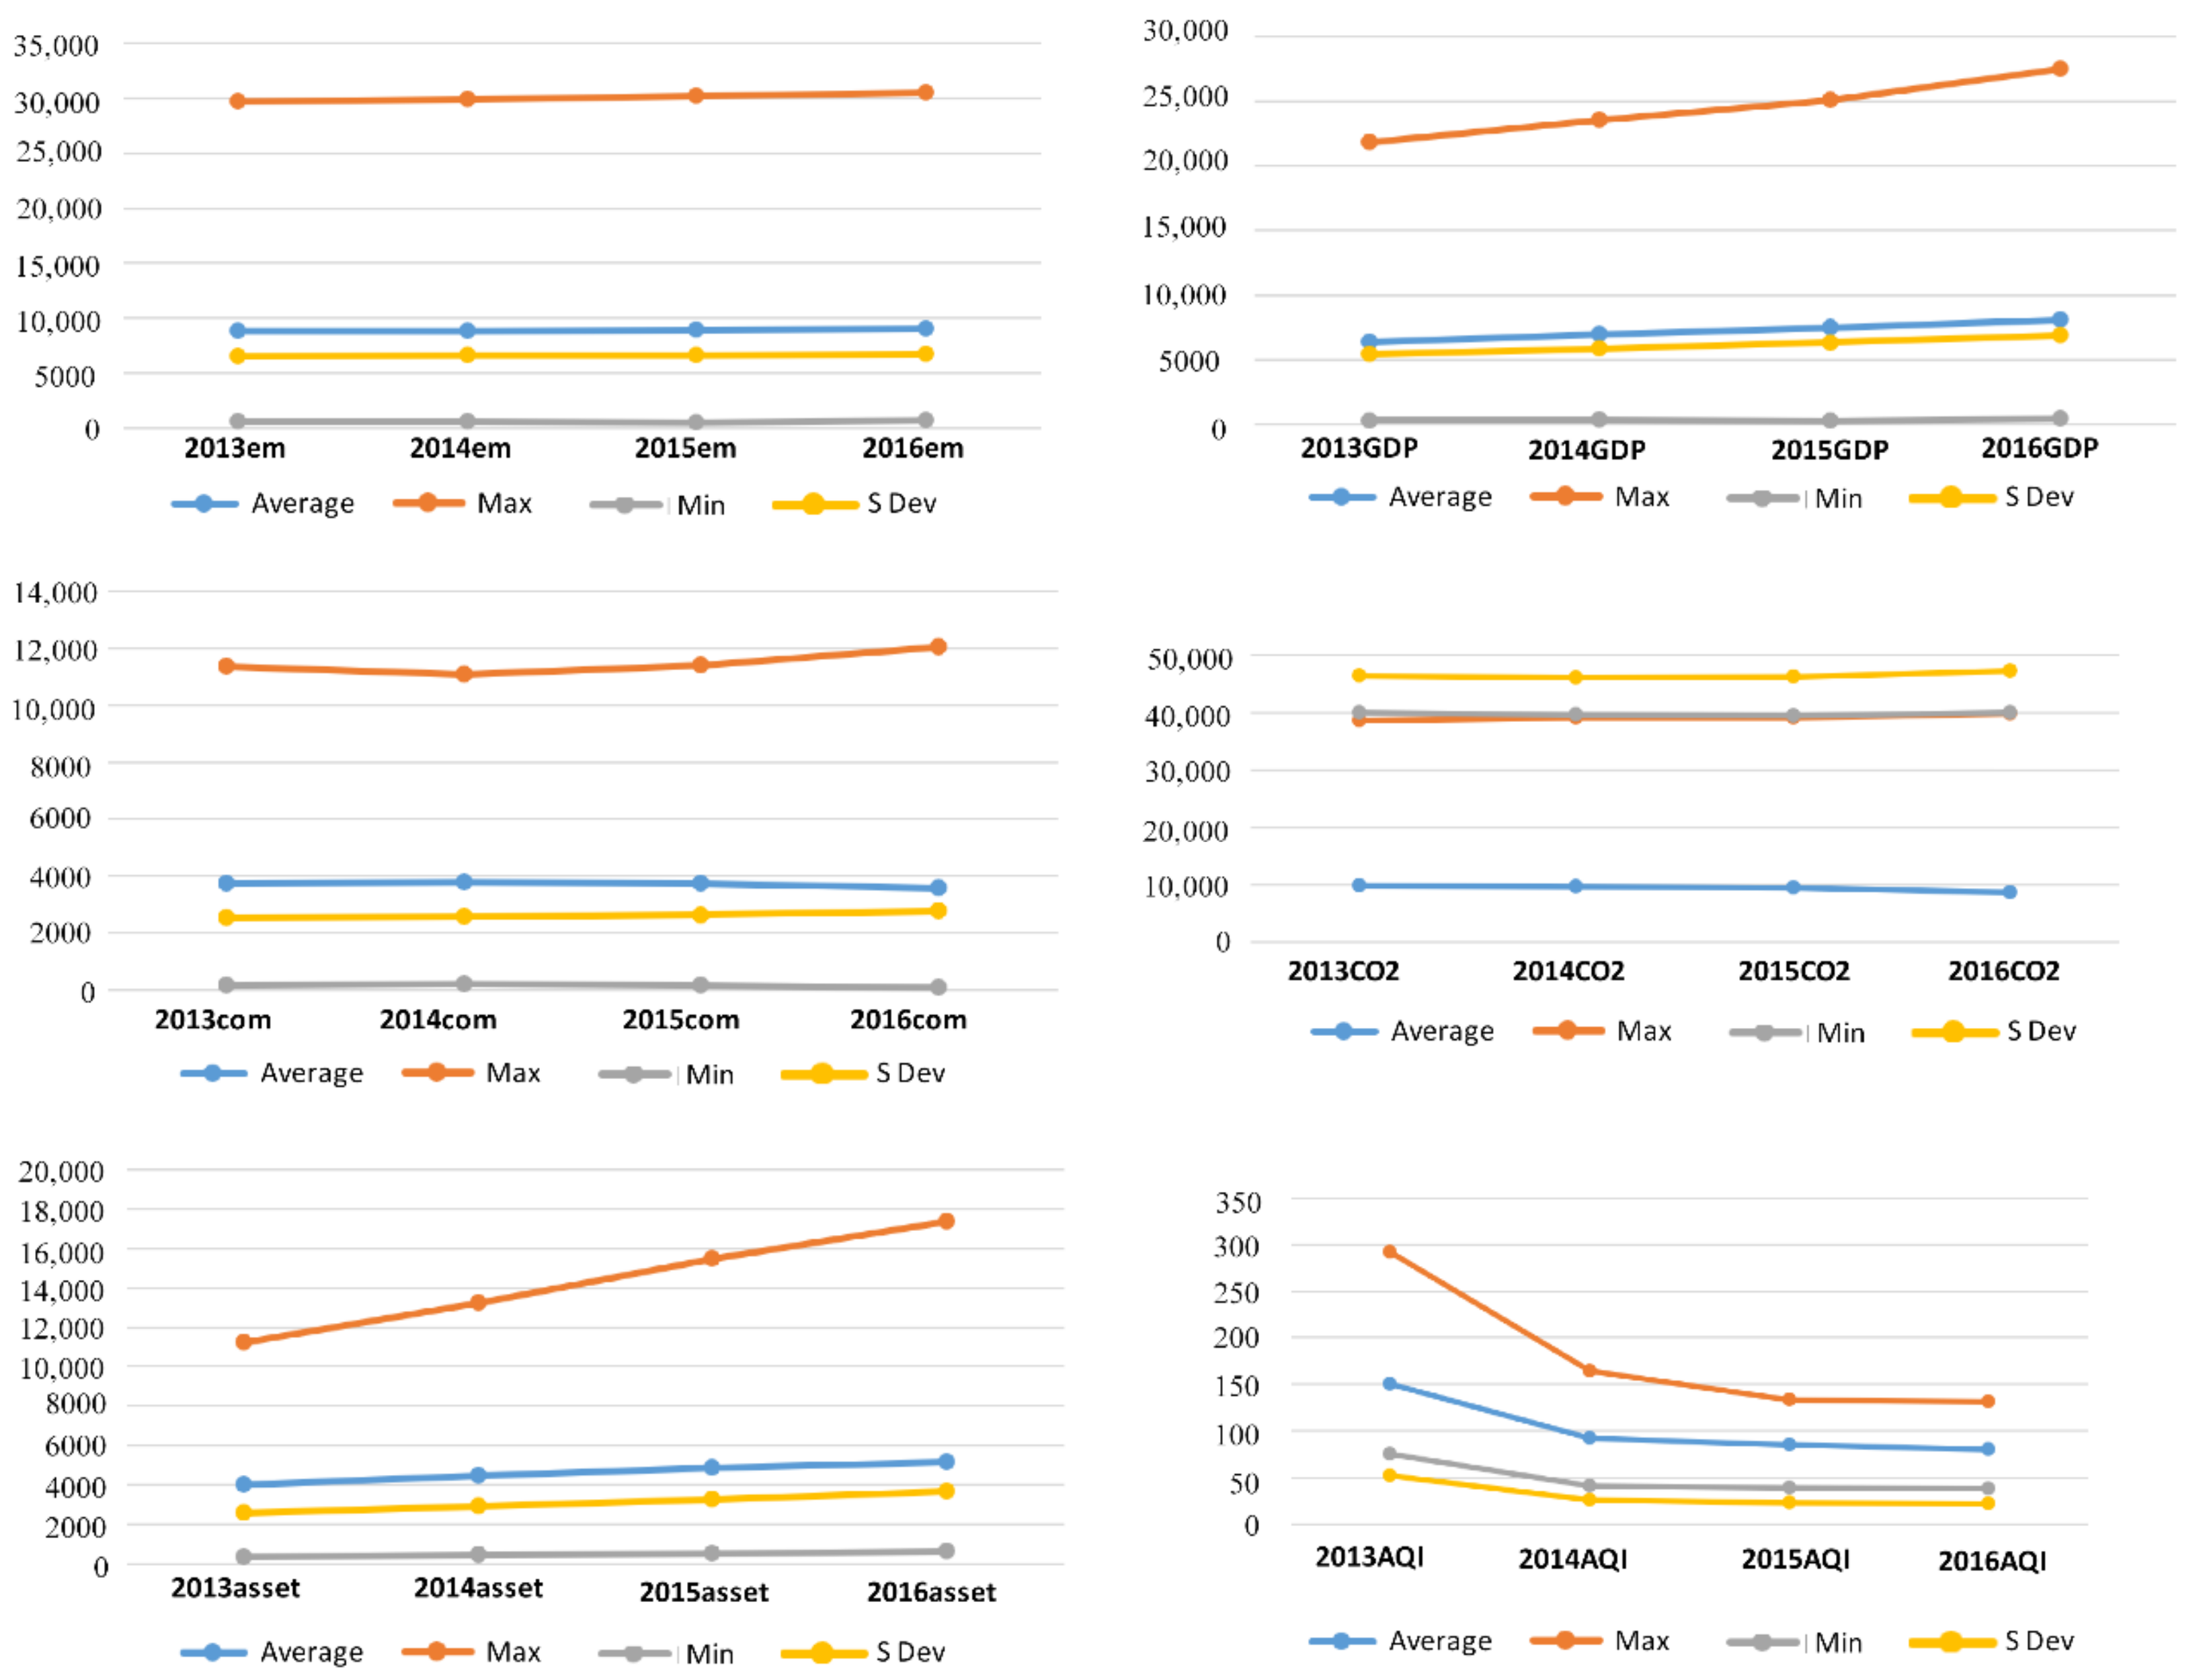
Data and Variables
- Labor input: Employees; this study used the number of employed people in each city at the end of each year; unit: person.
- Energy consumption was calculated from the total energy consumption in each city; unit: 100 million Tonnes.
- Fixed assets: the capital stock in each city was calculated using the fixed assets investment in each city; unit: 100 million CNY.
- Carbon dioxide: CO2, a common greenhouse gas;
- AQI: the air quality index, which is a measured concentration of the pollutants such as PM2.5, PM10, sulfur dioxide (SO2), and nitrogen.
- Health expenditure: the total amount of health care invested in each place. Since this study is unable to obtain medical input for different diseases, the study can only use the total amount of medical input and conduct research based on the efficiency changes in each region;
- Media reports: media reports can reduce the incidence of public diseases and improve the public’s physical and mental health. The media reports collected in this study are from the People’s Daily Online, Xinhuanet, and Sina Weibo of the People’s Daily, Beijing News, Caixin.com, China Youth Daily, and China News Weekly. These media are official Chinese state-owned media, and the reliability of the report is strong. Related air pollution news data were collected from the Xinhuanet media official website using the search string “province + air pollution.” Statistics were calculated in units of (years), with the number of statistics being the total amount in the year. The official news websites were selected because of the amount of news published and their wide influence.
- Respiratory Diseases: referring to the prevalence of respiratory diseases. In order to examine the effects of medical health inputs on diseases in various regions, only respiratory disease data can be collected, and data on specific respiratory diseases cannot be obtained. Therefore, in this study, the respiratory disease rate was used to measure the adverse effects of air pollutants and the effects of health management, mainly because a large amount of literature research has been proved. Some researchers had found that respiratory disease is significantly affected by air pollutants as PM10 (small dust particles). In some model specifications, ozone, another measure of pollution, is also found to affect respiratory illness. Furong et al. [70] studied data from 2009 to 2015 in Hefei, China, and showed that air pollution can significantly increase the mortality of respiratory diseases and lung cancer. Among them, the mortality rate of lung cancer is significantly correlated with SO2. Karimi et al. [71] collected the data of mortality and hospitalization rates for cardiovascular and respiratory diseases associated with air pollution from January 1980 to January 2018 in the PubMed, EMBASE, and Web of Science databases. The research used systematic review and meta-analysis to explore the relationship between air pollution, cardiovascular, respiratory mortality, and hospitalization rates. The results showed that air pollutants (O3, PM2.5, PM10, NO2, NOx, SO2, and CO) were associated with increased mortality and hospitalization rates, but PM2.5 and PM10 were more strongly affected.
- Birth rate: this study used the infant birth rate as the second output indicator for medical input. Carré [72] explored that air pollution, especially PM2.5, PM10, and NO2, had significant effects on female fertility and infant birth rate.
4.2. Basic Statistical Analysis
4.3. Overall Efficiency Analysis
4.4. Efficiency Analysis of the Production and Health Treatment Stages
4.5. Efficiency Analysis of the Indicators in the 31 Cities from 2013 to 2016
4.6. Technology Gap Ratio and the Two-Stage Technology Gap Ratio in Each City
Technology Gap between the Production Stage and the Health Management Stage in Each City
5. Conclusions and Policy Recommendations
- Guangzhou, Lhasa, and Shanghai had overall efficiencies of 1. Beijing’s overall efficiency score was only 1 in 2013 but was lower in other years, and the other 20 cities had four-year efficiency scores between 0.5 and 0.8; therefore, most cities needed efficiency improvements.
- Guangzhou, Lhasa, and Shanghai had annual efficiencies of 1 in the production stage, and Fuzhou, Guangzhou, Haikou, Lhasa Nanning, and Shanghai had annual efficiencies of 1 in the treatment stage. Overall, 15 cities had higher efficiencies in the production stage than in the treatment stage, and 12 cities had higher efficiencies in the treatment stage than in the production stage. Chongqing, Guiyang, Kunming, Lanzhou, Shijiazhuang, Taiyuan, Xining, and Yinchuan had four-year production stage efficiencies below 0.6, with the poorest being Shijiazhuang, with a four-year efficiency of around 0.4. Chengdu and Tianjin had the poorest treatment efficiencies; however, in general, the treatment stage and production stage efficiencies were similar.
- Guangzhou, Lhasa and Shanghai had fixed assets efficiencies of 1 in all four years, but 11 cities had four-year fixed assets efficiencies of only about 0.6, with Tianjin, which had a four-year efficiency of below 0.45, requiring the most improvement. Guangzhou, Lhasa, Nanning, and Shanghai had energy consumption efficiencies of 1 in all four years, nine cities had efficiencies higher than 0.8, and the lowest efficiency was in Taiyuan, at below 0.2. Guangzhou, Lhasa, and Shanghai had labor efficiencies of 1, and only seven other cities had labor efficiencies below 0.7 in most years.
- Fuzhou, Guangzhou, Haikou, Lhasa, Nanning, and Shanghai had carbon dioxide emissions efficiencies of 1 in all four production stage years, but the other 25 cities had carbon dioxide emissions efficiencies of less than 0.4 in all four years, of which Taiyuan had the lowest, at less than 0.2. Only Beijing had an AQI efficiency of 1 in all four years, and Chongqing, Fuzhou, Guangzhou, Haikou, Kunming, Lhasa, Nanjing, Nanning, Shanghai, and Urumqi had two- or three-year efficiencies of 1, with the other years being higher than 0.9. However, in most cities, the AQI efficiencies had large fluctuations, with eight cities fluctuating upward. Even though only three cities achieved GDP efficiencies, the efficiencies were relatively good in most cities, at close to 0.8.
- Fuzhou, Guangzhou, Haikou, Lhasa, Nanning, and Shanghai had media report efficiencies of 1 in all four years, and the efficiencies in 17 cities ranged from 0.5 to 0.9 in most years. However, Lanzhou and Xining’s highest annual efficiencies were only about 0.4. The media report efficiencies fluctuated significantly, and many cities experienced large declines, with the largest being in Beijing.
- Fuzhou, Guangzhou, Haikou, Lhasa, Nanning, and Shanghai had four-year health expenditure efficiencies of 1. However, Tianjin had the worst performance, with its health expenditure efficiency in three-years being below 0.2. The health expenditure efficiencies in the other cities fluctuated significantly, and many cities experienced large declines, with the largest being in Beijing. The urban birth rate efficiency improvements were small; however, Chengdu, Harbin, Shijiazhuang, and Tianjin had the lowest four-year efficiencies at above 0.7.
- The respiratory disease efficiencies required in most cities needed significant improvements, and the efficiency differences between the cities was wide. Fuzhou, Guangzhou, Haikou, Lhasa, Nanning, and Shanghai had four-year respiratory disease efficiencies of 1. Chengdu and Tianjin had low efficiencies of around 0.6 in most years. Nine cities had four-year efficiency fluctuations or declines, and the other 17 cities had upward fluctuations or continuous upward trends. Overall, the respiratory disease efficiencies improved.
- The media reports efficiency has a high correlation with respiratory diseases, AQI, and CO2 efficiency.
- Guangzhou, Lhasa, and Shanghai had technology frontiers of 1, but Chengdu, Chongqing, Nanchang, Shijiazhuang, and Taiyuan had large technology gaps. Changsha, Chengdu, Chongqing, Fuzhou, Hangzhou, Hefei, Jinan, Kunming, Nanjing, Shenyang, Wuhan, Urumqi, and Zhengzhou had rising technology frontiers, but the technology frontiers in the other 15 cities fell.
- Fuzhou, Guangzhou, Guiyang, Haikou, Lhasa, Nanjing, and Shanghai had treatment stage technology frontiers of 1. However, Harbin, Hohhot, Jinan, Nanchang, Shenyang, and Zhengzhou had backward technology frontiers. Beijing and Shijiazhuang had sustained fluctuating technology frontiers, and the technology frontiers in the other 23 cities all rose, indicating that the technological differences in the treatment stage shrank. Also, we found that high-income cities are higher technology gap than upper middle–income cities.
- As there were obvious differences between the cities, cooperation between regions should be actively promoted. The technology gap of high-income countries is higher than that of upper middle–income countries. So, high-income cities have technological advantages and rich experience in air pollution and health management. High-income cities can use advanced technologies for air pollution treatment by combining regional characteristics, economic and social development levels, geographical characteristics of cities, and meteorological conditions.
- Industrial structure and energy structure adjustments need to be more rapidly implemented to improve the production and environmental efficiencies in the Beijing-Tianjin region. The Beijing-centered Beijing-Tianjin region had lower production and treatment stage efficiencies than the Pearl River Delta area with Guangzhou at the center and the Yangtze River Delta area with Shanghai at the center. Therefore, the energy consumption, fixed assets investment, human resource input, and environmental efficiencies need to be improved in Beijing. The economic and energy structures in the Beijing-Tianjin region are closely related, and the economic growth in the region has relied heavily on coal for its energy production. Therefore, there needs to be a greater focus on energy structure adjustments and clean energy and clean coal–use technological developments to replace coal and maintain production. Developing and maintaining normal economic and social development is also an important treatment measure.
- The media is an important “link” and “bridge” for the dissemination of health information. It plays an irreplaceable role in reporting health knowledge, changing health concepts, and promoting healthy behavior. The media has strengthened coverage of air pollution, energy conservation and emission reduction, green development, and environmental protection in terms of content and channels. By continuously improving the scientific and professional reporting of the media, this can guide the public to rationally think about and interpret information and improve the accumulation of public health knowledge. On the other hand, it eliminates public fears and threats of air pollution and promotes public health awareness. Therefore, it is important to enhance the strategy of media coverage. In order to increase the effect of media reporting on public health, media organizations need to constantly improve and strengthen reporting strategies. The media needs to strengthen reports on air pollution, energy conservation, green development, and environmental protection in terms of content, channels, and forms of communication and needs to improve the science and professionalism of the reporting that guides the public to think about and interpret information rationally.
- Drawing on the advanced health management efficiency in the Pearl River Delta and the Yangtze River Delta, the government can enhance the health management efficiency in the Beijing-Tianjin region. Health management investment in the Beijing-Tianjin region needs to continue to increase in line with economic growth and social development. The Beijing-Tianjin region still needs to strengthen its overall management, improve governance, and design more effective systems to improve health management efficiency.
- The governance in the middle-income cities needs to adopt strategies and measures appropriate to the regional characteristics. Middle-income cities in the west, such as Lanzhou, Xining, and Yinchuan, need to strengthen their industrial and energy structure adjustments. The news reporting efficiencies in these cities also need significant improvement. Therefore, systems need to be developed that are more suitable to the energy, economic, social, environmental and news reporting characteristics in these cities.
- To improve their production efficiency and environmental efficiencies, middle-income cities in the midwest and some individual middle-income cities in the East (Changsha, Chengdu, Chongqing, Fuzhou, Hangzhou, Hefei, Jinan, Kunming, Nanjing, Shenyang, Wuhan, Urumqi, and Zhengzhou) need to learn from the advanced technologies in cities such as Guangzhou and Shanghai.
- Middle-income cities in the northeast and some central cities (Harbin, Hohhot, Jinan, Nanchang, Shenyang, and Zhengzhou) need to improve their news report and health governance efficiencies. Therefore, these cities could learn from the governance measures adopted in other cities to improve the effectiveness of their news reports to increase the environmental awareness of their residents.
Author Contributions
Funding
Conflicts of Interest
References
- World Health Statistics. 2018. Available online: https://kknews.cc/baby/bl2kooo.html (accessed on 16 September 2019).
- Global Cancer Statistics. American Cancer Society. 2018. Available online: https://www.cancer.org/about-us/policies/accessibility-policy.html (accessed on 16 September 2019).
- Ministry of Ecology and Environment of the People’s Republic of China. China’s Environmental and Protection Bureau Reports. 2017. Available online: http://www.mep.gov.cn/ (accessed on 26 March 2018).
- Georgiev, E.; Mihaylo, E. Economic growth and the environment: Reassessing the environmental Kuznets Curve for air pollution emissions in OECD countries. Lett. Spat. Resour. Sci. 2015, 8, 29–47. [Google Scholar] [CrossRef]
- Wang, Z.-X.; Peng, H.; Yao, P.-Y. Non-Linear Relationship between Economic Growth and CO2 Emissions in China: An Empirical Study Based on Panel Smooth Transition Regression Models. Int. J. Environ. Res. Public Health 2017, 14, 1568. [Google Scholar] [CrossRef] [PubMed]
- Ye, F.; Piver, W.T.; Ando, M.; Portier, C.J. Effects of temperature and air pollutants on cardiovascular and respiratory diseases for males and females older than 65 years of age in Tokyo, July and August 1980–1995. Environ. Health Perspect. 2001, 109, 355–359. [Google Scholar] [CrossRef] [PubMed]
- Lee, J.T.; Kim, H.; Song, H.; Hong, Y.C.; Cho, Y.S.; Shin, S.Y.; Hyun, Y.J.; Kim, Y.S. Air pollution and asthma among children in Seoul, Korea. Epidemiology 2002, 13, 481–484. [Google Scholar] [CrossRef] [PubMed]
- Pino, P.; Walter, T.; Oyarzun, M.; Villegas, R.; Romieu, I. Fine particulate matter and wheezing illnesses in the first year of life. Epidemiology 2004, 15, 702–708. [Google Scholar] [CrossRef]
- Chen, Y.; Yang, Q.; Krewski, D.; Shi, Y.; Burnett, R.T.; McGrail, K. Influence of relatively low level of particulate ar pollution on hospitalization for COPD in elderly people. Inhal. Toxicol. 2004, 16, 21–25. [Google Scholar] [CrossRef]
- Pénard-Morand, C.; Charpin, D.; Raherison, C.; Kopferschmitt, C.; Caillaud, D.; Lavaud, F.; Annesi-Maesano, I. Long-term exposure to background air pollution related to respiratory and allergic health in schoolchildren. Clin. Exp. Allergy 2005, 35, 1279–1287. [Google Scholar] [CrossRef]
- Loomis, D.; Huang, W.; Chen, G. The International Agency for Research on Cancer (IARC) evaluation of the carcinogenicity of outdoor air pollution: Focus on China. Chin. J. Cancer 2014, 33, 189–196. [Google Scholar] [CrossRef]
- Oakes, M.; Baxter, L.; Long, T.C. Evaluating the application of multipollutant exposure metrics in air pollution health studies. Environ. Int. 2014, 69, 90–99. [Google Scholar] [CrossRef]
- Fischer, P.H.; Marra, M.; Ameling, C.B.; Hoek, G.; Beelen, R.; de Hoogh, K.; Breugelmans, O.; Kruize, H.; Janssen, N.A.H.; Houthuijs, D. Air pollution and mortality in seven million adults: The Dutch Environmental Longitudinal Study (DUELS). Environ. Health Perspect. 2015, 123, 697–704. [Google Scholar] [CrossRef]
- Kelly, F.J.; Fussell, J.C. Air pollution and public health: Emerging hazards and improved understanding of risk. Environ. Geochem. Health 2015, 37, 631–649. [Google Scholar] [CrossRef] [PubMed]
- Pope, C.A., III; Cropper, M.; Coggins, J.; Cohen, A. Health benefits of air pollution abatement policy: Role of the shape of the concentration–response function. J. Air Waste Manag. Assoc. 2015, 65, 516–522. [Google Scholar] [CrossRef] [PubMed]
- Khafaie, M.A.; Ojha, A.; Salvi, S.S.; Yajnik, C.S. Methodological approach in air pollution health effects studies. J. Air Pollut. Health 2016, 1, 219–226. [Google Scholar]
- Khafaie, M.A.; Yajnik, C.S.; Salvi, S.S.; Ojha, A. Critical review of air pollution health effects with special concern on respiratory health. J. Air Pollut. Health 2016, 1, 123–136. [Google Scholar]
- Pannullo, F.; Lee, D.; Waclawski, E.; Leyland, A.H. How robust are the estimated effects of air pollution on health? Accounting for model uncertainty using Bayesian model averaging. Spat. Spatio Temporal Epidemiol. 2016, 18, 53–62. [Google Scholar] [CrossRef]
- Xie, Y.; Dai, H.; Dong, H.; Hanaoka, T.; Masui, T. Economic impacts from PM2.5 pollution-related health effects in China: A provincial-level analysis. Environ. Sci. Technol. 2016, 50, 4836–4843. [Google Scholar] [CrossRef]
- Yang, B.Y.; Liu, Y.; Hu, L.W.; Zeng, X.W.; Dong, G.H. Urgency to Assess the Health Impact of Ambient Air Pollution in China. In Ambient Air Pollution and Health Impact in China; Springer: Singapore, 2017; pp. 1–6. [Google Scholar]
- Rich, D.Q. Accountability studies of air pollution and health effects: Lessons learned and recommendations for future natural experiment opportunities. Environ. Int. 2017, 100, 62–78. [Google Scholar] [CrossRef]
- Newell, K.; Kartsonaki, C.; Lam, K.B.H.; Kurmi, O.P. Cardiorespiratory health effects of particulate ambient air pollution exposure in low-income and middle-income countries: A systematic review and meta-analysis. Lancet Planet. Health 2017, 1, 368–380. [Google Scholar] [CrossRef]
- Zigler, C.M.; Choirat, C.; Dominici, F. Impact of National Ambient Air Quality Standards nonattainment designations on particulate pollution and health. Epidemiology 2018, 29, 165–174. [Google Scholar] [CrossRef]
- Kinney, P.L. Interactions of Climate Change, Air Pollution, and Human Health. Curr. Environ. Health Rep. 2018, 5, 179–186. [Google Scholar] [CrossRef]
- Torretta, V.; Raboni, M.; Copelli, S.; Rada, E.C.; Ragazzi, M.; Ionescu, G.; Apostol, T.; Badea, A. Application of strategies for particulate matter reduction in urban areas: An Italian case. UPB Sci. Bull. Ser. D Mech. Eng. 2013, 75, 221–228. [Google Scholar]
- Schiavon, M.; Antonacci, G.; Rada, E.C.; Ragazzi, M.; Zardi, D. Modelling Human Exposure to Air Pollutants in an Urban Area. Revista de Chimie Bucharest Original Edition 2014, 65, 61–64. [Google Scholar]
- Schiavon, M.; Redivo, M.; Antonacci, G.; Rada Elena, C.; Ragazzi, M.; Dino, Z.; Giovannini, L. Assessing the air quality impact of nitrogen oxides and benzene from road traffic and domestic heating and the associated cancer risk in an urban area of Verona (Italy). Atmos. Environ. 2015, 120, 234–243. [Google Scholar] [CrossRef]
- Li, L.; Yalin, L.; Dongyan, P.; Chen, Y.; Si, C. Economic evaluation of the air pollution effect on public health in China’s 74 cities. SpringerPlus 2016, 5, 402. [Google Scholar] [CrossRef]
- He, L.-Y.; Ou, J.-J. Pollution Emissions, Environmental Policy, and Marginal Abatement Costs. Int. J. Environ. Res. Public Health 2017, 14, 1509. [Google Scholar] [CrossRef]
- Jose, R.S.; Perez, J.L.; Perez, L.; Gonzalez, B.; Rosa, M. Effects of climate change on the health of citizens modelling urban weather and air pollution. Energy 2018, 165, 53–62. [Google Scholar] [CrossRef]
- Lua, X.; Lin, C.; Li, W.; Chen, Y.; Huang, Y.; Funga, J.C.H.; Lau, A.K.H. Analysis of the adverse health effects of PM2.5 from 2001 to 2017 in China and the role of urbanization in aggravating the health burden. Sci. Total Environ. 2019, 652, 683–695. [Google Scholar] [CrossRef]
- Dworkin, J.M.; Pijawka, K.D. Public concern for air quality: Explaining change in Toronto, Canada, 1967–1978. Int. J. Environ. Stud. 1982, 20, 17–26. [Google Scholar] [CrossRef]
- Mayer, B. Relax and take a deep breath: Print media coverage of asthma and air pollution in the United States. Soc. Sci. Med. 2012, 75, 892–900. [Google Scholar] [CrossRef]
- Elliot, A.J.; Smith, S.; Dobney, A.; Thornes, J.; Smith, G.E.; Vardoulakis, S. Monitoring the effect of air pollution episodes on health care consultations and ambulance call-outs in England during March/April 2014: A retrospective observational analysis. Environ. Pollut. 2016, 214, 903–911. [Google Scholar] [CrossRef]
- Wang, S. Social Media as a Sensor of Air Quality and Public Response in China. J. Med. Internet Res. 2015, 17, e22. [Google Scholar] [CrossRef] [PubMed]
- Jiang, W.; Wang, Y.; Tsou, M.H.; Fu, X. Using Social Media to Detect Outdoor Air Pollution and Monitor Air Quality Index (AQI): A Geo-Targeted Spatiotemporal Analysis Framework with Sina Weibo (Chinese Twitter). PLoS ONE 2015, 10, e0141185. [Google Scholar] [CrossRef] [PubMed]
- Costa, D.L.; Kahn, M.E. Death and the Media: Infectious Disease Reporting During the Health Transition. Economica 2017, 84, 393–416. [Google Scholar] [CrossRef] [PubMed]
- Murukutla, N.; Negi, N.S.; Puri, P.; Mullin, S.; Onyon, L. Online media coverage of air pollution risks and current policies in India: A content analysis. WHO South-East Asia J. Public Health 2017, 6, 41–50. [Google Scholar] [CrossRef] [PubMed]
- Schwabe, J. The impact of severe air pollution in January 2013 in Beijing on sustained elevation of public environmental concern. Eur. J. East Asian Stud. 2018, 17, 135–157. [Google Scholar] [CrossRef]
- Fare, R.; Grosskopf, S.; Pasurka, C. Joint Production of Good and Bad Outputs with a Network Application. In Encyclopedia of Energy, Natural Resources and Environmental Economics; Shogren, J., Ed.; Elsevier: Amsterdam, The Netherlands, 2013; Volume 2, pp. 109–118. [Google Scholar]
- Hampf, B. Separating Environmental Efficiency into Production and Abatement Efficiency. J. Prod. Anal. 2014, 41, 457–473. [Google Scholar] [CrossRef][Green Version]
- Lozano, S. A Joint-inputs Network DEA approach to Production and Pollution-generating Technologies. Expert Syst. Appl. 2015, 42, 7960–7968. [Google Scholar] [CrossRef]
- Wu, J.; Lv, L.; Sun, J. A comprehensive analysis of China’s regional energy saving and emission reduction efficiency: From production and treatment perspectives. Energy Policy 2015, 84, 166–176. [Google Scholar] [CrossRef]
- Wu, J.; Zhu, Q.; Chu, J. Two-Stage Network Structures with undesirable Intermediate Outputs Reused: A DEA Based Approach. Comput. Econ. 2015, 46, 455–477. [Google Scholar] [CrossRef]
- Farrell, M.J. The Measurement of Productive Efficiency. J. R. Stat. Soc. 1957, 120, 253–281. [Google Scholar] [CrossRef]
- Charnes, A.; Cooper, W.; Rhodes, E. Measuring the Efficiency of Decision-Making Units. Eur. J. Oper. Res. 1978, 2, 429–444. [Google Scholar] [CrossRef]
- Banker, R.D.; Charnes, R.F.; Cooper, W.W. Some Models for Estimating Technical and Scale Inefficiencies in Data Envelopment Analysis. Manag. Sci. 1984, 30, 1078–1092. [Google Scholar] [CrossRef]
- Tone, K. A slacks-based measure of efficiency in data envelopment analysis. Eur. J. Oper. Res. 2001, 130, 498–509. [Google Scholar]
- Tone, K.; Tsutsui, M. An epsilon-based measure of efficiency in DEA—A third pole of technical efficiency. Eur. J. Oper. Res. 2010, 207, 1554–1563. [Google Scholar] [CrossRef]
- Färe, R.; Grosskopf, S.; Pasurka, C.A. Environmental production functions and environmental directional distance functions. Energy 2007, 32, 1055–1066. [Google Scholar] [CrossRef]
- Yao, C.; Joe, Z. Measuring Information Technology’s Indirect Impact on Firm Performance. Inf. Technol. Manag. J. 2004, 5, 9–22. [Google Scholar]
- Huang, S.N.; Kang, C.-C. Analyzing for Production Efficiency in Telecommunications Industry: The Taiwan Case. Bus. Rev. Camb. 2006, 5, 111–120. [Google Scholar]
- Kao, C.; Hwang, S.N. Efficiency Decomposition in Two-Stage Data Envelopment Analysis: An Application to Non-life Insurance Companies in Taiwan. Eur. J. Oper. Res. 2008, 185, 418–429. [Google Scholar] [CrossRef]
- Kao, C. Efficiency measurement for parallel production systems. Eur. J. Oper. Res. 2009, 196, 1107–1112. [Google Scholar] [CrossRef]
- Tone, K.; Tsutsui, M. Network DEA: A Slacks Based Measurement Approach. Eur. J. Oper. Res. 2009, 197, 243–252. [Google Scholar] [CrossRef]
- O’Donnell, C.J.; Rao, D.S.P.; Battese, G.E. Metafrontier frameworks for the study of firm-level efficiencies and technology ratios. Empir. Econ. 2008, 34, 231–255. [Google Scholar] [CrossRef]
- Battese, G.E.; Rao, D.S.P. Technology gap, efficiency and a stochastic metafrontier function. Int. J. Bus. Econ. 2002, 1, 87–93. [Google Scholar]
- Battese, G.E.; Rao, D.S.P.; O’ Donnell, C.J. A metafrontier production function for estimation of technical efficiencies and technology gaps for firms operating under different technologies. J. Product. Anal. 2004, 21, 91–103. [Google Scholar] [CrossRef]
- Hu, J.L.; Wang, S.C. Total-factor energy efficiency of regions in China. Energy Policy 2006, 34, 3206–3217. [Google Scholar] [CrossRef]
- Sustainable Development Goals (SDGs). World Bank. 2017. Available online: https://doi.org/10.1596/978-1-4648-1080-0 (accessed on 8 March 2018).
- Zhang, Q.; Streets, D.G.; Carmichael, G.R.; He, H.H.; National Bureau of Statistics of China. China Statistical Yearbook; National Bureau of Statistics of China: Beijing, China, 2017.
- China Statistical Yearbooks Database. Demographics and the Employment Statistical Yearbook of China, and the Statistical Yearbooks of all Cities; China Academic Journals Electronic Publishing House: Beijing, China, 2017. [Google Scholar]
- Wang, K.; Wei, Y.M. China’s regional industrial energy efficiency and carbon emissions abatement costs. Appl. Energy 2014, 130, 617–631. [Google Scholar] [CrossRef]
- Du, K.; Xie, C.; Ouyang, X. A comparison of carbon dioxide (CO2) emission trends among provinces in China. Renew. Sustain. Energy Rev. 2017, 73, 19–25. [Google Scholar] [CrossRef]
- Li, Y.; Sun, L.; Feng, T.; Zhu, C. How to reduce energy intensity in China: A regional comparison perspective. Energy Policy 2013, 61, 513–522. [Google Scholar] [CrossRef]
- Yeh, T.-L.; Chen, T.-Y.; Lai, P.-Y. A comparative study of energy utilization efficiency between Taiwan and China. Energy Policy 2010, 38, 2386–2394. [Google Scholar] [CrossRef]
- Choi, Y.; Zhang, N.; Zhou, P. Efficiency and abatement costs of energy-related CO2 emissions in China: A slacks-based efficiency measure. Appl. Energy 2012, 98, 198–208. [Google Scholar] [CrossRef]
- Wang, K.; Wei, Y.; Zhang, X. Energy and Emissions Efficiency Patterns of Chinese Regions: A Multi-Directional Efficiency Analysis. Appl. Energy 2013, 104, 105–116. [Google Scholar] [CrossRef]
- Zhang, T.; Chiu, Y.; Li, Y.; Lin, T. Air Pollutants and Health- Efficiency Evaluation Based on Network Data Envelopment Analysis. Int. J. Environ. Res. Public Health 2018, 15, 2046. [Google Scholar] [CrossRef] [PubMed]
- Furong, Z.; Rui, D.; Ruoqian, L.; Han, C.; Jie, L.; Chaowei, S.; Chao, Z.; Yachun, X.; Changchun, X.; Xiaoru, L.; et al. The short-term effects of air pollution on respiratory diseases and lung cancer mortality in Hefei: A time-series analysis. Respir. Med. 2019, 146, 57–65. [Google Scholar]
- Karimi, B.; Shokrinezhad, B.; Samadi, S. Mortality and hospitalizations due to cardiovascular and respiratory diseases associated with air pollution in Iran: A systematic review and meta-analysis. Atmos. Environ. 2019, 198, 438–447. [Google Scholar] [CrossRef]
- Carré, J.; Gatimel, N.; Moreau, J. Does air pollution play a role in infertility? A systematic review. Environ. Health 2017, 16, 82. [Google Scholar] [CrossRef] [PubMed]


| NO | DMU | 2013 | 2014 | 2015 | 2016 |
|---|---|---|---|---|---|
| 1 | Beijing | 1 | 0.920417 | 0.733929 | 0.781173 |
| 2 | Changchun | 0.780636 | 0.744334 | 0.626083 | 0.693914 |
| 3 | Changsha | 0.613127 | 0.83919 | 0.813482 | 0.888706 |
| 4 | Chengdu | 0.495873 | 0.569804 | 0.518157 | 0.491098 |
| 5 | Chongqing | 0.692683 | 0.700274 | 0.67162 | 0.709513 |
| 6 | Fuzhou | 0.976286 | 0.786121 | 0.945944 | 0.93785 |
| 7 | Guangzhou | 1 | 1 | 1 | 1 |
| 8 | Guiyang | 0.625708 | 0.615078 | 0.556014 | 0.619227 |
| 9 | Harbin | 0.667707 | 0.625093 | 0.548797 | 0.612453 |
| 10 | Haikou | 0.965631 | 0.816178 | 0.944715 | 0.912714 |
| 11 | Hangzhou | 0.599453 | 0.680341 | 0.589847 | 0.711524 |
| 12 | Hefei | 0.603771 | 0.578212 | 0.718987 | 0.948708 |
| 13 | Huhehot | 0.771201 | 0.783619 | 0.675695 | 0.761003 |
| 14 | Jinan | 0.576035 | 0.578343 | 0.582106 | 1 |
| 15 | Kunming | 0.651187 | 0.616113 | 0.667184 | 0.652977 |
| 16 | Lanzhou | 0.691725 | 0.647571 | 0.520495 | 0.657953 |
| 17 | Lhasa | 1 | 1 | 1 | 1 |
| 18 | Nanchang | 0.747725 | 0.751731 | 0.684811 | 0.678634 |
| 19 | Nanjing | 0.626384 | 0.771059 | 0.660945 | 0.752753 |
| 20 | Nanning | 1 | 1 | 1 | 0.963501 |
| 21 | Shanghai | 1 | 1 | 1 | 1 |
| 22 | Shenyang | 0.57641 | 0.653371 | 0.471707 | 0.872131 |
| 23 | Shijiazhuang | 0.481009 | 0.478092 | 0.462524 | 0.439574 |
| 24 | Taiyuan | 0.61132 | 0.568609 | 0.558776 | 0.617309 |
| 25 | Tianjin | 0.63171 | 0.624746 | 0.580419 | 0.618667 |
| 26 | Wuhan | 0.969384 | 0.743701 | 0.737345 | 0.701077 |
| 27 | Urumqi | 0.957401 | 0.944612 | 0.680446 | 0.97296 |
| 28 | Xian | 0.675965 | 0.826735 | 0.598937 | 0.652698 |
| 29 | Xining | 0.606469 | 0.610215 | 0.544589 | 0.570594 |
| 30 | Yinchuan | 0.768444 | 0.738936 | 0.658954 | 0.732169 |
| 31 | Zhengzhou | 0.755548 | 0.76361 | 0.791239 | 0.605025 |
| NO. | DMU | 2013 S-1 | 2013 S-2 | 2014 S-1 | 2014 S-2 | 2015 S-1 | 2015 S-2 | 2016 S-1 | 2016 S-2 |
|---|---|---|---|---|---|---|---|---|---|
| 1 | Beijing | 1 | 1 | 0.9841 | 0.859717 | 1 | 0.523655 | 0.967305 | 0.620516 |
| 2 | Changchun | 0.784014 | 0.777225 | 0.810363 | 0.683197 | 0.867712 | 0.440007 | 0.666735 | 0.722244 |
| 3 | Changsha | 0.867294 | 0.422157 | 0.854909 | 0.823818 | 0.847923 | 0.780553 | 0.862052 | 0.915606 |
| 4 | Chengdu | 0.631859 | 0.381234 | 0.599879 | 0.540916 | 0.666245 | 0.393688 | 0.588109 | 0.404624 |
| 5 | Chongqing | 0.57216 | 0.833457 | 0.577451 | 0.842549 | 0.577227 | 0.778049 | 0.58374 | 0.854677 |
| 6 | Fuzhou | 0.953513 | 1 | 0.612554 | 1 | 0.896525 | 1 | 0.882006 | 1 |
| 7 | Guangzhou | 1 | 1 | 1 | 1 | 1 | 1 | 1 | 1 |
| 8 | Guiyang | 0.430391 | 0.881465 | 0.464297 | 0.800737 | 0.48783 | 0.631223 | 0.496444 | 0.762751 |
| 9 | Harbin | 0.843138 | 0.523092 | 0.820257 | 0.468745 | 0.911042 | 0.304295 | 0.60593 | 0.619029 |
| 10 | Haikou | 0.932073 | 1 | 0.662616 | 1 | 0.894992 | 1 | 0.839084 | 1 |
| 11 | Hangzhou | 0.828935 | 0.421705 | 0.819238 | 0.561614 | 0.830777 | 0.405179 | 0.857406 | 0.588141 |
| 12 | Hefei | 0.750495 | 0.479733 | 0.748732 | 0.439018 | 0.734275 | 0.703888 | 0.901489 | 1 |
| 13 | Huhehot | 0.794014 | 0.749271 | 0.79885 | 0.768767 | 0.784616 | 0.579296 | 0.767966 | 0.754124 |
| 14 | Jinan | 0.69103 | 0.474712 | 0.681966 | 0.48622 | 0.648869 | 0.520022 | 1 | 1 |
| 15 | Kunming | 0.447209 | 0.924271 | 0.450665 | 0.824437 | 0.506021 | 0.870361 | 0.495605 | 0.849659 |
| 16 | Lanzhou | 0.512725 | 0.92661 | 0.437378 | 0.935135 | 0.448104 | 0.600829 | 0.457415 | 0.93038 |
| 17 | Lhasa | 1 | 1 | 1 | 1 | 1 | 1 | 1 | 1 |
| 18 | Nanchang | 0.849399 | 0.655427 | 0.83084 | 0.678777 | 0.794252 | 0.5873 | 0.662679 | 0.695209 |
| 19 | Nanjing | 0.865647 | 0.443562 | 0.822589 | 0.72271 | 0.880772 | 0.487604 | 0.918836 | 0.614334 |
| 20 | Nanning | 1 | 1 | 1 | 1 | 1 | 1 | 0.928314 | 1 |
| 21 | Shanghai | 1 | 1 | 1 | 1 | 1 | 1 | 1 | 1 |
| 22 | Shenyang | 0.677385 | 0.487561 | 0.668757 | 0.638463 | 0.651262 | 0.328558 | 1 | 0.761222 |
| 23 | Shijiazhuang | 0.420644 | 0.546837 | 0.420201 | 0.541625 | 0.381233 | 0.554448 | 0.388758 | 0.494223 |
| 24 | Taiyuan | 0.497082 | 0.745665 | 0.485602 | 0.6623 | 0.48296 | 0.64264 | 0.496031 | 0.76024 |
| 25 | Tianjin | 0.79577 | 0.49495 | 0.788973 | 0.489891 | 0.777944 | 0.420716 | 0.830746 | 0.451418 |
| 26 | Wuhan | 0.939486 | 1 | 0.759276 | 0.728561 | 0.760506 | 0.714807 | 0.806428 | 0.608009 |
| 27 | Urumqi | 0.91658 | 1 | 0.892165 | 1 | 0.594624 | 0.778365 | 0.947314 | 1 |
| 28 | Xian | 0.625065 | 0.730118 | 0.680201 | 1 | 0.615122 | 0.582851 | 0.559771 | 0.758082 |
| 29 | Xining | 0.497994 | 0.733845 | 0.4237 | 0.855227 | 0.420998 | 0.69296 | 0.443779 | 0.726317 |
| 30 | Yinchuan | 0.610989 | 0.961078 | 0.566618 | 0.954052 | 0.557347 | 0.775328 | 0.570696 | 0.932932 |
| 31 | Zhengzhou | 0.878029 | 0.645468 | 0.905744 | 0.638679 | 0.973174 | 0.63835 | 0.726674 | 0.497766 |
| Total | Production Stage | Treatment Stage | |
|---|---|---|---|
| 2013 | 0.0590* | 0.0064** | 0.0094** |
| 2014 | 0.2711 | 0.2083 | 0.2275 |
| 2015 | 0.0590* | 0.0086** | 0.0030** |
| 2016 | 0.0569* | 0.2264 | 0.1763 |
| No. | DMU | 2013–2016 Average Labor | 2013–2016 Average Asset | 2013–2016 Average Energy Consumption |
|---|---|---|---|---|
| 1 | Beijing | 0.9383 | 0.9780 | 0.9956 |
| 2 | Changchun | 0.8428 | 0.6555 | 0.8828 |
| 3 | Changsha | 0.9419 | 0.5077 | 0.6611 |
| 4 | Chengdu | 0.7700 | 0.6418 | 0.7700 |
| 5 | Chongqing | 0.5457 | 0.4480 | 0.7471 |
| 6 | Fuzhou | 0.9217 | 0.6527 | 0.9419 |
| 7 | Guangzhou | 1.0000 | 1.0000 | 1.0000 |
| 8 | Guiyang | 0.6463 | 0.5036 | 0.5556 |
| 9 | Harbin | 0.7143 | 0.6105 | 0.8928 |
| 10 | Haikou | 0.7574 | 0.9182 | 0.9447 |
| 11 | Hangzhou | 0.9201 | 0.6535 | 0.7757 |
| 12 | Hefei | 0.8974 | 0.5208 | 0.8974 |
| 13 | Huhehot | 0.8923 | 0.7088 | 0.6350 |
| 14 | Jinan | 0.8601 | 0.8368 | 0.6553 |
| 15 | Kunming | 0.6486 | 0.5393 | 0.6027 |
| 16 | Lanzhou | 0.6441 | 0.6225 | 0.3322 |
| 17 | Lhasa | 1.0000 | 1.0000 | 1.0000 |
| 18 | Nanchang | 0.8860 | 0.5537 | 0.8860 |
| 19 | Nanjing | 0.9455 | 0.5825 | 0.7513 |
| 20 | Nanning | 0.9069 | 0.8994 | 1.0000 |
| 21 | Shanghai | 1.0000 | 1.0000 | 1.0000 |
| 22 | Shenyang | 0.8612 | 0.5788 | 0.7322 |
| 23 | Shijiazhuang | 0.5828 | 0.5092 | 0.3962 |
| 24 | Taiyuan | 0.6742 | 0.6651 | 0.1782 |
| 25 | Tianjin | 0.9061 | 0.4395 | 0.6792 |
| 26 | Wuhan | 0.9094 | 0.5740 | 0.7818 |
| 27 | Urumqi | 0.8964 | 0.9026 | 0.8934 |
| 28 | Xian | 0.7718 | 0.5276 | 0.7718 |
| 29 | Xining | 0.6272 | 0.6054 | 0.3283 |
| 30 | Yinchuan | 0.7506 | 0.5442 | 0.3119 |
| 31 | Zhengzhou | 0.8945 | 0.6344 | 0.9369 |
| No. | DMU | 2013–2016 Average GDP | 2013–2016 Average CO2 | 2013–2016 Average AQI (Air Quality Index) |
|---|---|---|---|---|
| 1 | Beijing | 0.9957 | 0.9935 | 0.9978 |
| 2 | Changchun | 0.9075 | 0.8822 | 0.6527 |
| 3 | Changsha | 0.9480 | 0.6615 | 0.8828 |
| 4 | Chengdu | 0.8428 | 0.7701 | 0.8041 |
| 5 | Chongqing | 0.8321 | 0.7445 | 0.9934 |
| 6 | Fuzhou | 0.7726 | 1.0000 | 0.9952 |
| 7 | Guangzhou | 1.0000 | 1.0000 | 0.9958 |
| 8 | Guiyang | 0.7931 | 0.5915 | 0.7348 |
| 9 | Harbin | 0.9182 | 0.8930 | 0.5992 |
| 10 | Haikou | 0.7959 | 0.9998 | 0.9938 |
| 11 | Hangzhou | 0.9312 | 0.7762 | 0.8889 |
| 12 | Hefei | 0.8563 | 0.8985 | 0.7460 |
| 13 | Huhehot | 0.9115 | 0.6353 | 0.5633 |
| 14 | Jinan | 0.8982 | 0.6545 | 0.7602 |
| 15 | Kunming | 0.7939 | 0.6027 | 0.9736 |
| 16 | Lanzhou | 0.7924 | 0.3301 | 0.5271 |
| 17 | Lhasa | 1.0000 | 0.9994 | 0.9957 |
| 18 | Nanchang | 0.9094 | 0.8865 | 0.8332 |
| 19 | Nanjing | 0.9513 | 0.7524 | 0.9186 |
| 20 | Nanning | 0.9617 | 0.9998 | 0.9961 |
| 21 | Shanghai | 1.0000 | 1.0000 | 0.9968 |
| 22 | Shenyang | 0.8988 | 0.7322 | 0.7841 |
| 23 | Shijiazhuang | 0.7727 | 0.4518 | 0.6126 |
| 24 | Taiyuan | 0.8028 | 0.1786 | 0.4634 |
| 25 | Tianjin | 0.9212 | 0.6792 | 0.7933 |
| 26 | Wuhan | 0.9254 | 0.7935 | 0.7364 |
| 27 | Urumqi | 0.8867 | 0.9183 | 0.8364 |
| 28 | Xian | 0.8440 | 0.8120 | 0.6197 |
| 29 | Xining | 0.7868 | 0.3272 | 0.5541 |
| 30 | Yinchuan | 0.8338 | 0.3122 | 0.5175 |
| 31 | Zhengzhou | 0.9481 | 0.9358 | 0.7081 |
| No. | DMU | 2013–2016 Average Media | 2013–2016 Average Health Expenditure | 2013–2016 Average Birth Rate | 2013–2016 Average Respiratory Diseases |
|---|---|---|---|---|---|
| 1 | Beijing | 0.3643 | 0.551 | 0.90675 | 0.87775 |
| 2 | Changchun | 0.7965 | 0.4625 | 0.86225 | 0.7965 |
| 3 | Changsha | 0.6610 | 0.839 | 0.89275 | 0.839 |
| 4 | Chengdu | 0.6050 | 0.46 | 0.7805 | 0.605 |
| 5 | Chongqing | 0.9125 | 0.69775 | 0.9255 | 0.9125 |
| 6 | Fuzhou | 1.0000 | 1 | 1 | 1 |
| 7 | Guangzhou | 1.0000 | 1 | 1 | 1 |
| 8 | Guiyang | 0.8618 | 0.73475 | 0.90075 | 0.8715 |
| 9 | Harbin | 0.6468 | 0.46575 | 0.7975 | 0.64675 |
| 10 | Haikou | 1.0000 | 1 | 1 | 1 |
| 11 | Hangzhou | 0.5170 | 0.66425 | 0.801 | 0.66425 |
| 12 | Hefei | 0.6230 | 0.76225 | 0.86475 | 0.77825 |
| 13 | Huhehot | 0.8313 | 0.706 | 0.878 | 0.83475 |
| 14 | Jinan | 0.4268 | 0.74375 | 0.85425 | 0.761 |
| 15 | Kunming | 0.9415 | 0.551 | 0.948 | 0.9415 |
| 16 | Lanzhou | 0.3515 | 0.73225 | 0.9575 | 0.9385 |
| 17 | Lhasa | 1.0000 | 1 | 1 | 1 |
| 18 | Nanchang | 0.5108 | 0.53225 | 0.865 | 0.81325 |
| 19 | Nanjing | 0.5690 | 0.71575 | 0.82675 | 0.72425 |
| 20 | Nanning | 1.0000 | 1 | 1 | 1 |
| 21 | Shanghai | 1.0000 | 1 | 1 | 1 |
| 22 | Shenyang | 0.7003 | 0.63925 | 0.80625 | 0.64475 |
| 23 | Shijiazhuang | 0.4755 | 0.624 | 0.81675 | 0.7095 |
| 24 | Taiyuan | 0.5468 | 0.64575 | 0.882 | 0.84375 |
| 25 | Tianjin | 0.5703 | 0.2585 | 0.79575 | 0.65425 |
| 26 | Wuhan | 0.8633 | 0.71775 | 0.90075 | 0.86325 |
| 27 | Urumqi | 0.7778 | 0.97575 | 0.97975 | 0.97575 |
| 28 | Xian | 0.8383 | 0.613 | 0.90575 | 0.87175 |
| 29 | Xining | 0.3163 | 0.8015 | 0.90575 | 0.88175 |
| 30 | Yinchuan | 0.3618 | 0.9675 | 0.975 | 0.97025 |
| 31 | Zhengzhou | 0.3415 | 0.404 | 0.8515 | 0.785 |
| CO2 | AQI | Respiratory Diseases | |
|---|---|---|---|
| 2013Media | 0.5861 | 0.4072 | 0.5932 |
| 2014Media | 0.4275 | 0.3387 | 0.4252 |
| 2015Media | 0.4384 | 0.6535 | 0.5751 |
| 2016Media | 0.5631 | 0.5619 | 0.3697 |
| NO | DMU | 2013 | 2014 | 2015 | 2016 |
|---|---|---|---|---|---|
| 1 | Beijing | 1 | 0.920417 | 0.951156 | 0.905517 |
| 2 | Changchun | 0.799766 | 0.865208 | 0.626083 | 0.765738 |
| 3 | Changsha | 0.688145 | 0.876117 | 0.813482 | 0.888706 |
| 4 | Chengdu | 0.649096 | 0.66255 | 0.777481 | 0.7262 |
| 5 | Chongqing | 0.692683 | 0.700274 | 0.67162 | 0.709513 |
| 6 | Fuzhou | 0.976286 | 0.998914 | 1.001418 | 0.986605 |
| 7 | Guangzhou | 1 | 1 | 1 | 1 |
| 8 | Guiyang | 0.804812 | 0.789525 | 0.765699 | 0.783652 |
| 9 | Harbin | 0.78929 | 0.742931 | 0.661526 | 0.771179 |
| 10 | Haikou | 0.965631 | 0.891907 | 0.9715 | 0.934996 |
| 11 | Hangzhou | 0.892932 | 0.894409 | 0.914981 | 0.9587 |
| 12 | Hefei | 0.895494 | 0.881029 | 0.776732 | 0.948708 |
| 13 | Huhehot | 0.771201 | 0.783619 | 0.675695 | 0.761003 |
| 14 | Jinan | 0.845658 | 0.839612 | 0.801471 | 1 |
| 15 | Kunming | 0.742354 | 0.754756 | 0.790251 | 0.779946 |
| 16 | Lanzhou | 0.846304 | 0.818117 | 0.772737 | 0.777249 |
| 17 | Lhasa | 1 | 1 | 1 | 1 |
| 18 | Nanchang | 0.747725 | 0.751731 | 0.697362 | 0.703055 |
| 19 | Nanjing | 0.843292 | 0.887507 | 0.926665 | 0.952523 |
| 20 | Nanning | 1 | 1 | 1 | 0.963501 |
| 21 | Shanghai | 1 | 1 | 1 | 1 |
| 22 | Shenyang | 0.77126 | 0.724574 | 0.755926 | 0.872131 |
| 23 | Shijiazhuang | 0.76481 | 0.769609 | 0.718522 | 0.731075 |
| 24 | Taiyuan | 0.766194 | 0.758631 | 0.75676 | 0.718906 |
| 25 | Tianjin | 0.866574 | 0.975213 | 0.943439 | 0.952695 |
| 26 | Wuhan | 0.980431 | 0.955047 | 0.970918 | 0.997056 |
| 27 | Urumqi | 0.957401 | 0.944612 | 0.680446 | 0.97296 |
| 28 | Xian | 0.821765 | 0.875207 | 0.809363 | 0.767682 |
| 29 | Xining | 0.890846 | 0.81891 | 0.821108 | 0.801893 |
| 30 | Yinchuan | 0.831326 | 0.817149 | 0.794892 | 0.789536 |
| 31 | Zhengzhou | 0.755548 | 0.76361 | 0.791239 | 0.901562 |
| NO | DMU | 2013 S1 | 2013 S2 | 2014 S1 | 2014 S2 | 2015 S1 | 2015 S2 | 2016 S1 | 2016 S2 |
|---|---|---|---|---|---|---|---|---|---|
| 1 | Beijing | 1 | 1 | 0.9841 | 0.859717 | 1 | 0.894374 | 0.977258 | 0.829966 |
| 2 | Changchun | 0.784014 | 0.816048 | 0.810363 | 0.924697 | 0.867712 | 0.440007 | 0.666735 | 0.880661 |
| 3 | Changsha | 0.879721 | 0.524584 | 0.932426 | 0.823818 | 0.847923 | 0.780553 | 0.862052 | 0.915606 |
| 4 | Chengdu | 0.631859 | 0.655117 | 0.599879 | 0.730815 | 0.666245 | 0.924537 | 0.588109 | 0.917548 |
| 5 | Chongqing | 0.57216 | 0.833457 | 0.577451 | 0.842549 | 0.577227 | 0.778049 | 0.58374 | 0.854677 |
| 6 | Fuzhou | 0.953513 | 1 | 0.997512 | 1 | 1.002561 | 1 | 0.974467 | 1 |
| 7 | Guangzhou | 1 | 1 | 1 | 1 | 1 | 1 | 1 | 1 |
| 8 | Guiyang | 0.633033 | 0.994539 | 0.596955 | 1.026177 | 0.579653 | 1.010953 | 0.597173 | 1.01622 |
| 9 | Harbin | 0.853814 | 0.722546 | 0.820257 | 0.661141 | 0.915633 | 0.440075 | 0.608234 | 0.98388 |
| 10 | Haikou | 0.932073 | 1 | 0.791953 | 1 | 0.945958 | 1 | 0.880062 | 1 |
| 11 | Hangzhou | 1.007733 | 0.777175 | 0.970302 | 0.819937 | 0.970346 | 0.849596 | 0.961007 | 0.956052 |
| 12 | Hefei | 0.805091 | 1.00597 | 0.79557 | 0.985432 | 0.734275 | 0.823614 | 0.901489 | 1 |
| 13 | Huhehot | 0.794014 | 0.749271 | 0.79885 | 0.768767 | 0.784616 | 0.579296 | 0.767966 | 0.754124 |
| 14 | Jinan | 0.980467 | 0.721654 | 0.910867 | 0.768498 | 0.91115 | 0.701844 | 1 | 1 |
| 15 | Kunming | 0.548987 | 0.978743 | 0.570825 | 0.977019 | 0.626686 | 0.985638 | 0.608274 | 0.987527 |
| 16 | Lanzhou | 0.703492 | 1.011085 | 0.605101 | 1.079956 | 0.604982 | 0.983986 | 0.568089 | 1.046075 |
| 17 | Lhasa | 1 | 1 | 1 | 1 | 1 | 1 | 1 | 1 |
| 18 | Nanchang | 0.849399 | 0.655427 | 0.83084 | 0.678777 | 0.823516 | 0.5873 | 0.710809 | 0.695209 |
| 19 | Nanjing | 0.999461 | 0.698904 | 0.987955 | 0.797774 | 0.972082 | 0.876073 | 0.970163 | 0.935064 |
| 20 | Nanning | 1 | 1 | 1 | 1 | 1 | 1 | 0.928314 | 1 |
| 21 | Shanghai | 1 | 1 | 1 | 1 | 1 | 1 | 1 | 1 |
| 22 | Shenyang | 0.835419 | 0.70751 | 0.823663 | 0.638463 | 0.796233 | 0.70001 | 1 | 0.761222 |
| 23 | Shijiazhuang | 0.605896 | 0.962323 | 0.620055 | 0.953419 | 0.566882 | 0.901437 | 0.560729 | 0.952653 |
| 24 | Taiyuan | 0.58826 | 0.989451 | 0.556767 | 1.031572 | 0.576715 | 0.988437 | 0.518786 | 0.985778 |
| 25 | Tianjin | 0.986385 | 0.752208 | 1.000127 | 0.948332 | 1.013662 | 0.860202 | 1.045958 | 0.854936 |
| 26 | Wuhan | 0.961032 | 1 | 0.929586 | 0.981111 | 1.00099 | 0.941638 | 0.99833 | 0.995729 |
| 27 | Urumqi | 0.91658 | 1 | 0.892165 | 1 | 0.594624 | 0.778365 | 0.947314 | 1 |
| 28 | Xian | 0.72997 | 0.924013 | 0.762626 | 1 | 0.681047 | 0.97043 | 0.614017 | 0.957543 |
| 29 | Xining | 0.805349 | 0.979803 | 0.650721 | 1.007062 | 0.668876 | 0.991888 | 0.627061 | 1.015135 |
| 30 | Yinchuan | 0.697177 | 0.985967 | 0.635244 | 1.040927 | 0.633286 | 0.993166 | 0.621991 | 0.995286 |
| 31 | Zhengzhou | 0.878029 | 0.645468 | 0.905744 | 0.638679 | 0.973174 | 0.63835 | 0.990239 | 0.811945 |
| Total | Production Stage | Treatment Stage | |
|---|---|---|---|
| 2013 | 0.0238** | 0.0016** | 0.0010** |
| 2014 | 0.0787* | 0.0453** | 0.0929* |
| 2015 | 0.0344** | 0.0006** | 0.0003** |
| 2016 | 0.0169** | 0.0065** | 0.0199** |
© 2019 by the authors. Licensee MDPI, Basel, Switzerland. This article is an open access article distributed under the terms and conditions of the Creative Commons Attribution (CC BY) license (http://creativecommons.org/licenses/by/4.0/).
Share and Cite
Li, Y.; Chiu, Y.-H.; Chen, H.; Lin, T.-Y. Impact of Media Reports and Environmental Pollution on Health and Health Expenditure Efficiency. Healthcare 2019, 7, 144. https://doi.org/10.3390/healthcare7040144
Li Y, Chiu Y-H, Chen H, Lin T-Y. Impact of Media Reports and Environmental Pollution on Health and Health Expenditure Efficiency. Healthcare. 2019; 7(4):144. https://doi.org/10.3390/healthcare7040144
Chicago/Turabian StyleLi, Ying, Yung-Ho Chiu, Huaming Chen, and Tai-Yu Lin. 2019. "Impact of Media Reports and Environmental Pollution on Health and Health Expenditure Efficiency" Healthcare 7, no. 4: 144. https://doi.org/10.3390/healthcare7040144
APA StyleLi, Y., Chiu, Y.-H., Chen, H., & Lin, T.-Y. (2019). Impact of Media Reports and Environmental Pollution on Health and Health Expenditure Efficiency. Healthcare, 7(4), 144. https://doi.org/10.3390/healthcare7040144