2.6. Measurement Instruments
Personal Information Form: A form developed by the researchers from the relevant literature, recording sociodemographic characteristics (age, sex, marital status, educational level, perceived income), anthropometric data (height, weight, body mass index), and obesity-related and clinical characteristics (comorbid disease, duration of overweight, duration of weight-loss attempts, weight-loss methods used, previous surgery, prior knowledge and prior use of virtual reality, and the source of information about the planned operation).
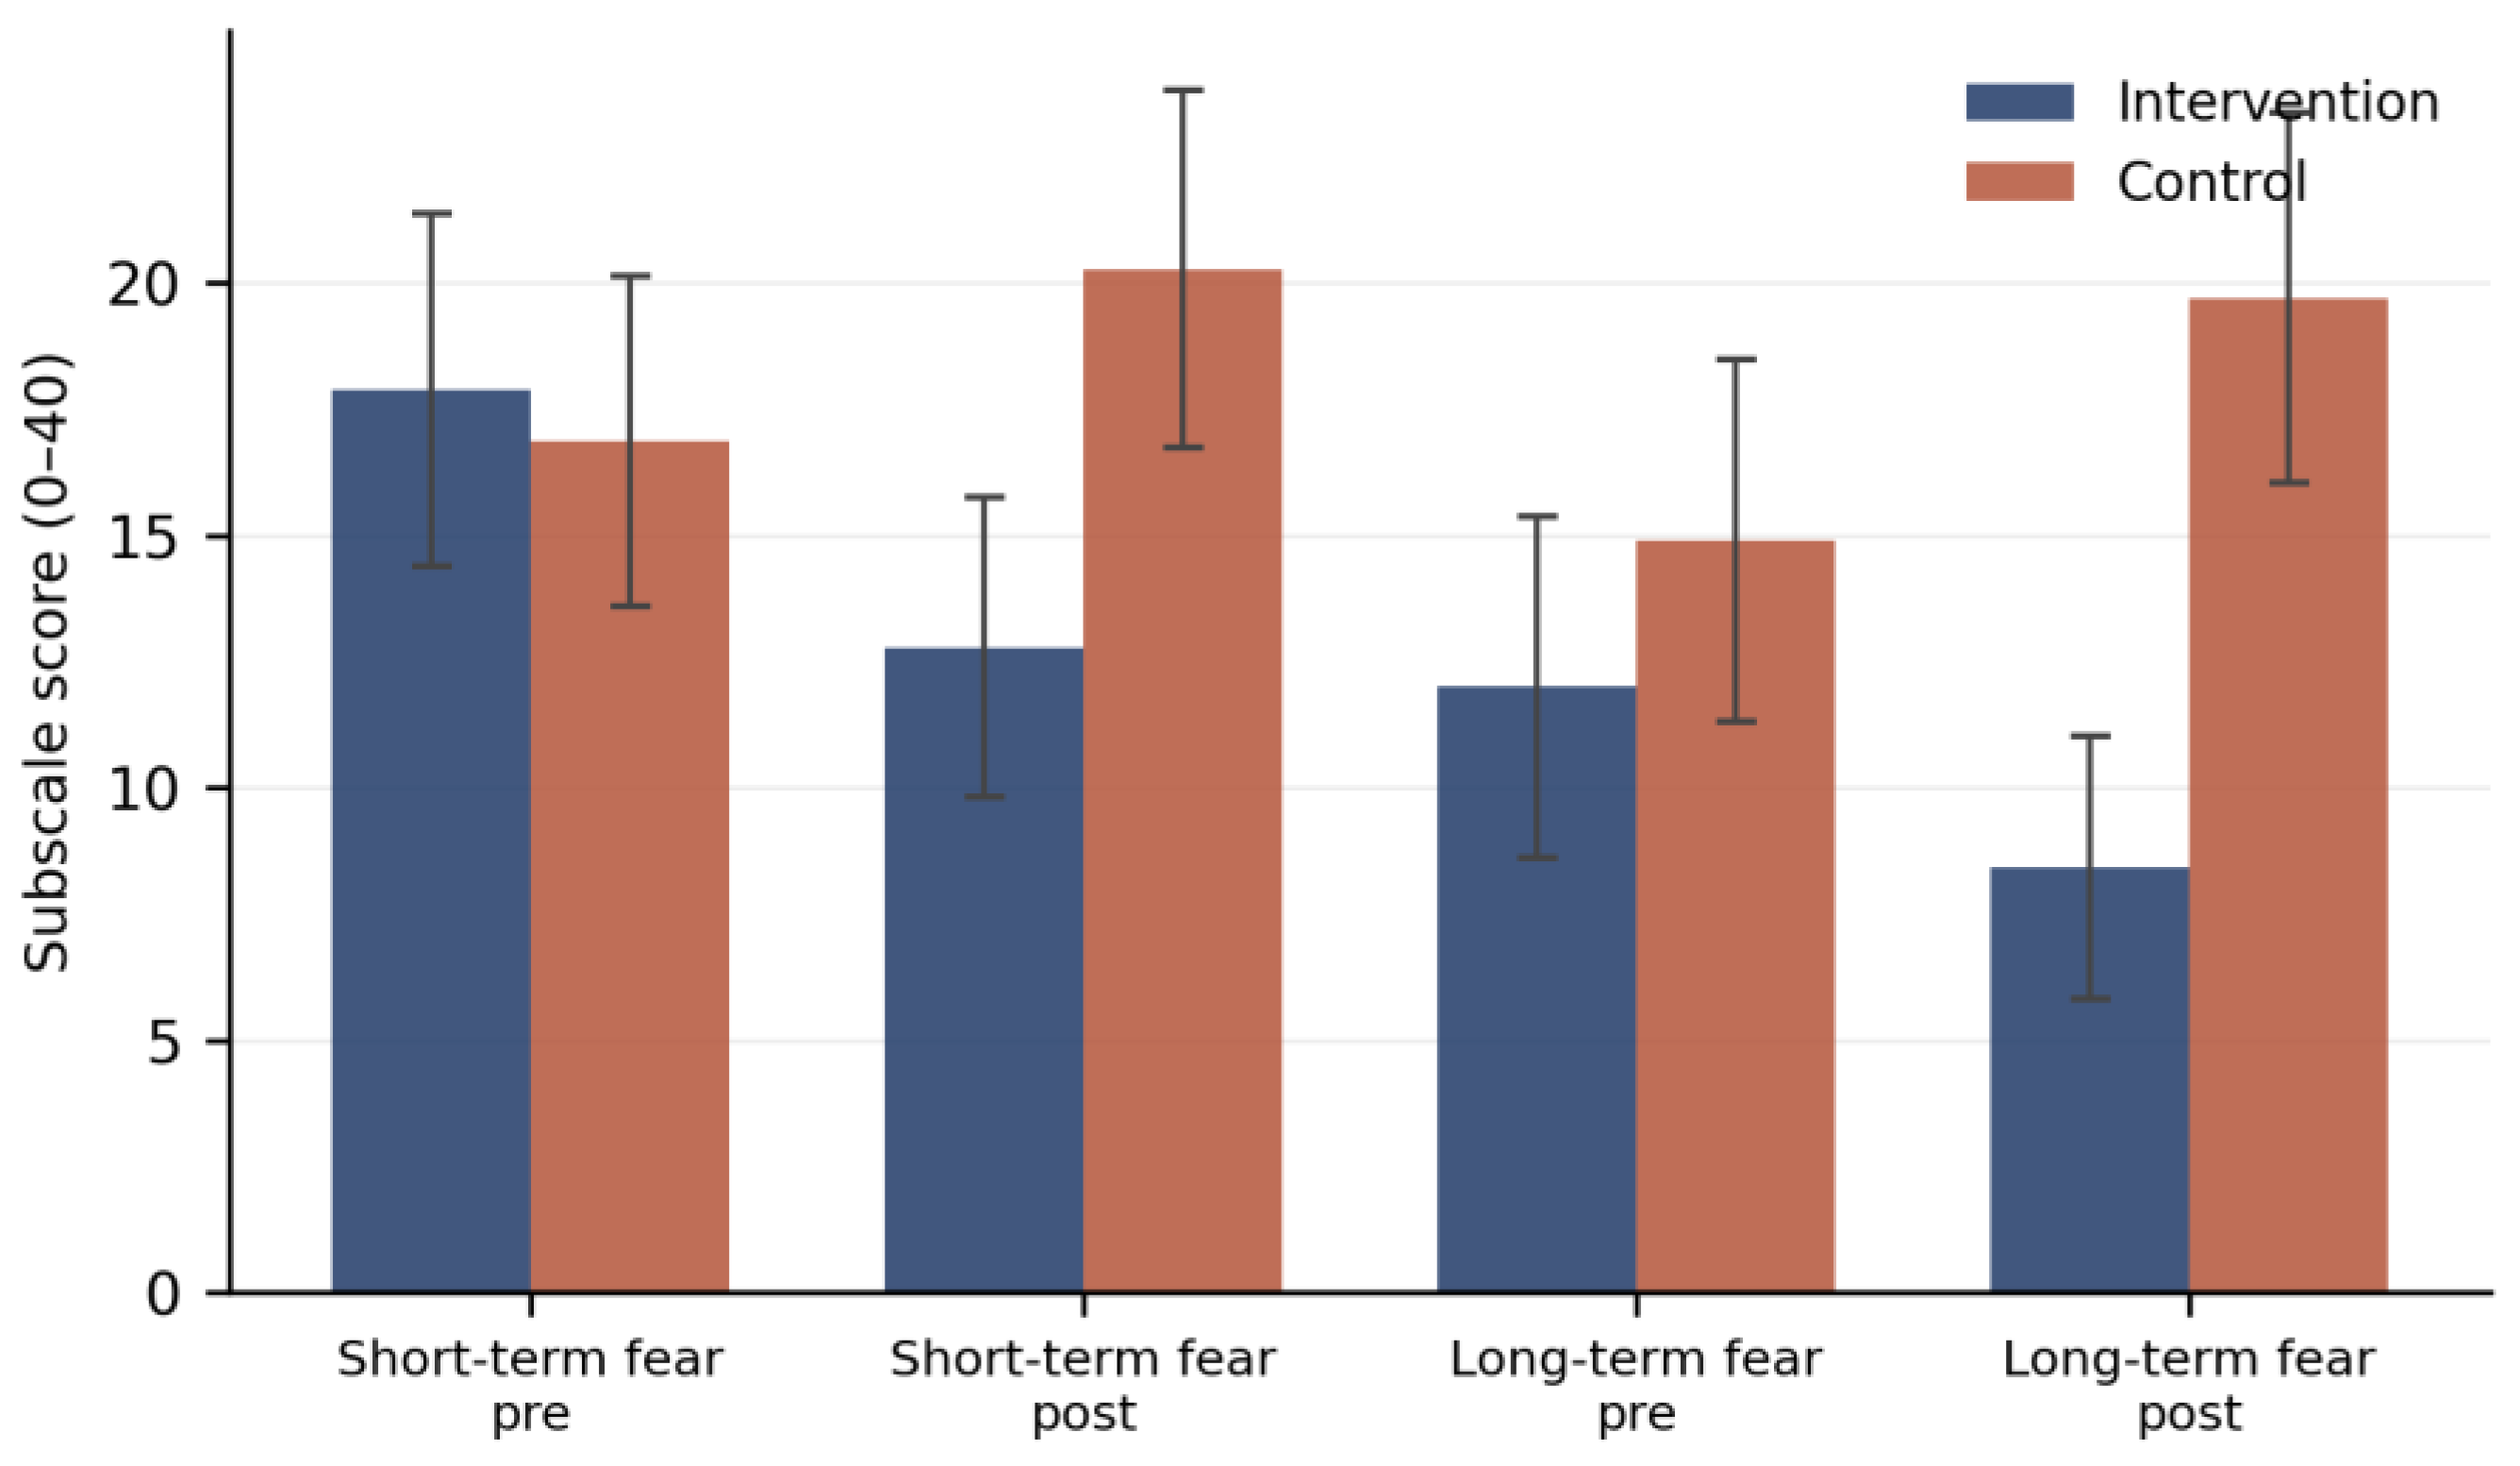
Surgical Fear Questionnaire (SFQ): Developed by Theunissen et al. to quantify fear in patients awaiting elective surgery [
10] and adapted into Turkish by Bağdigen and Karaman Özlü [
28]. Eight items are rated on an 11-point numeric rating scale anchored at 0 (“not afraid at all”) and 10 (“very afraid”). Items 1–4 form the short-term fear subscale and items 5–8 the long-term fear subscale; each subscale ranges from 0 to 40 and the total from 0 to 80. Cronbach’s α was 0.93 in the original validation study [
10]. In the present sample, it was 0.98 at pre-test and 0.99 at post-test; the interpretation of these unusually high values is addressed in
Section 3.7 and
Section 4.5.
State Anxiety Inventory (STAI-S): Developed by Spielberger et al. [
29] and adapted into Turkish by Öner and Le Compte [
30]. Twenty items are rated from 1 to 4, of which 10 are reverse-worded. The total ranges from 20 to 80, with higher scores indicating greater state anxiety. Cronbach’s α was 0.83 in the adaptation study [
30]. In the present sample, it was 0.90 at pre-test and 0.97 at post-test.
2.7. Intervention
Patients allocated to the intervention arm received a single session two hours before transfer to the operating theatre. After the pre-test measures had been completed, the headset was introduced and demonstrated. A VR Shinecon G04ea head-mounted display (Dongguan Shinecon Digital Device Co., Ltd., Dongguan, China) with integrated headphones, fitted with the researcher’s mobile telephone, was used. All participants viewed the same 360° nature video, comprising forest, sea, and landscape scenes with an accompanying natural soundtrack; content was not selected by the patient or the researcher and did not vary between participants. The stimulus was a publicly available YouTube video entitled “Son Çalışma” (video identifier cMK08aolmD8;
https://youtu.be/cMK08aolmD8 (accessed on 1 March 2025)), with a total running time of 30 min and 35 s, of which the first 20 min were shown; playback was stopped at 20 min in every case. The video was played through the YouTube application on an iPhone 14 Pro Max (Apple Inc., Cupertino, CA, USA) mounted in the head-mounted display. The video was available throughout the data collection period but has since been removed by its uploader and is no longer retrievable; the identifier, running time and content description are given so that the stimulus can be documented and an equivalent selected by others. The material was monoscopic 360° video rather than an interactive virtual environment: head movement altered the viewpoint within the scene, but participants could not otherwise interact with the content. Audio was delivered through the headphones integrated into the device. Participants were seated or semi-recumbent in their own room, from which noise and interruptions were excluded, and the researcher remained present throughout to monitor the participant and assist with the device. For these reasons, the intervention is described more precisely as immersive 360° virtual nature exposure delivered through a head-mounted display than as interactive virtual reality. A duration of 20 min was chosen because relaxation-focused sessions of roughly 15 to 40 min are those most commonly reported to be effective and well tolerated, whereas longer exposures increase the risk of cybersickness [
31]. Post-test measures were administered 10 min after the session ended. Adverse effects were not elicited using a predefined checklist or a structured tolerability questionnaire; they were recorded only when reported spontaneously by the patient or observed by the researcher. No adverse effect was reported or observed among the 60 patients who received the intervention, and no session was interrupted. Because ascertainment was passive, this should not be read as evidence that the intervention is free of adverse effects; two otherwise eligible patients reported ocular discomfort when the device was demonstrated before enrolment and did not take part (
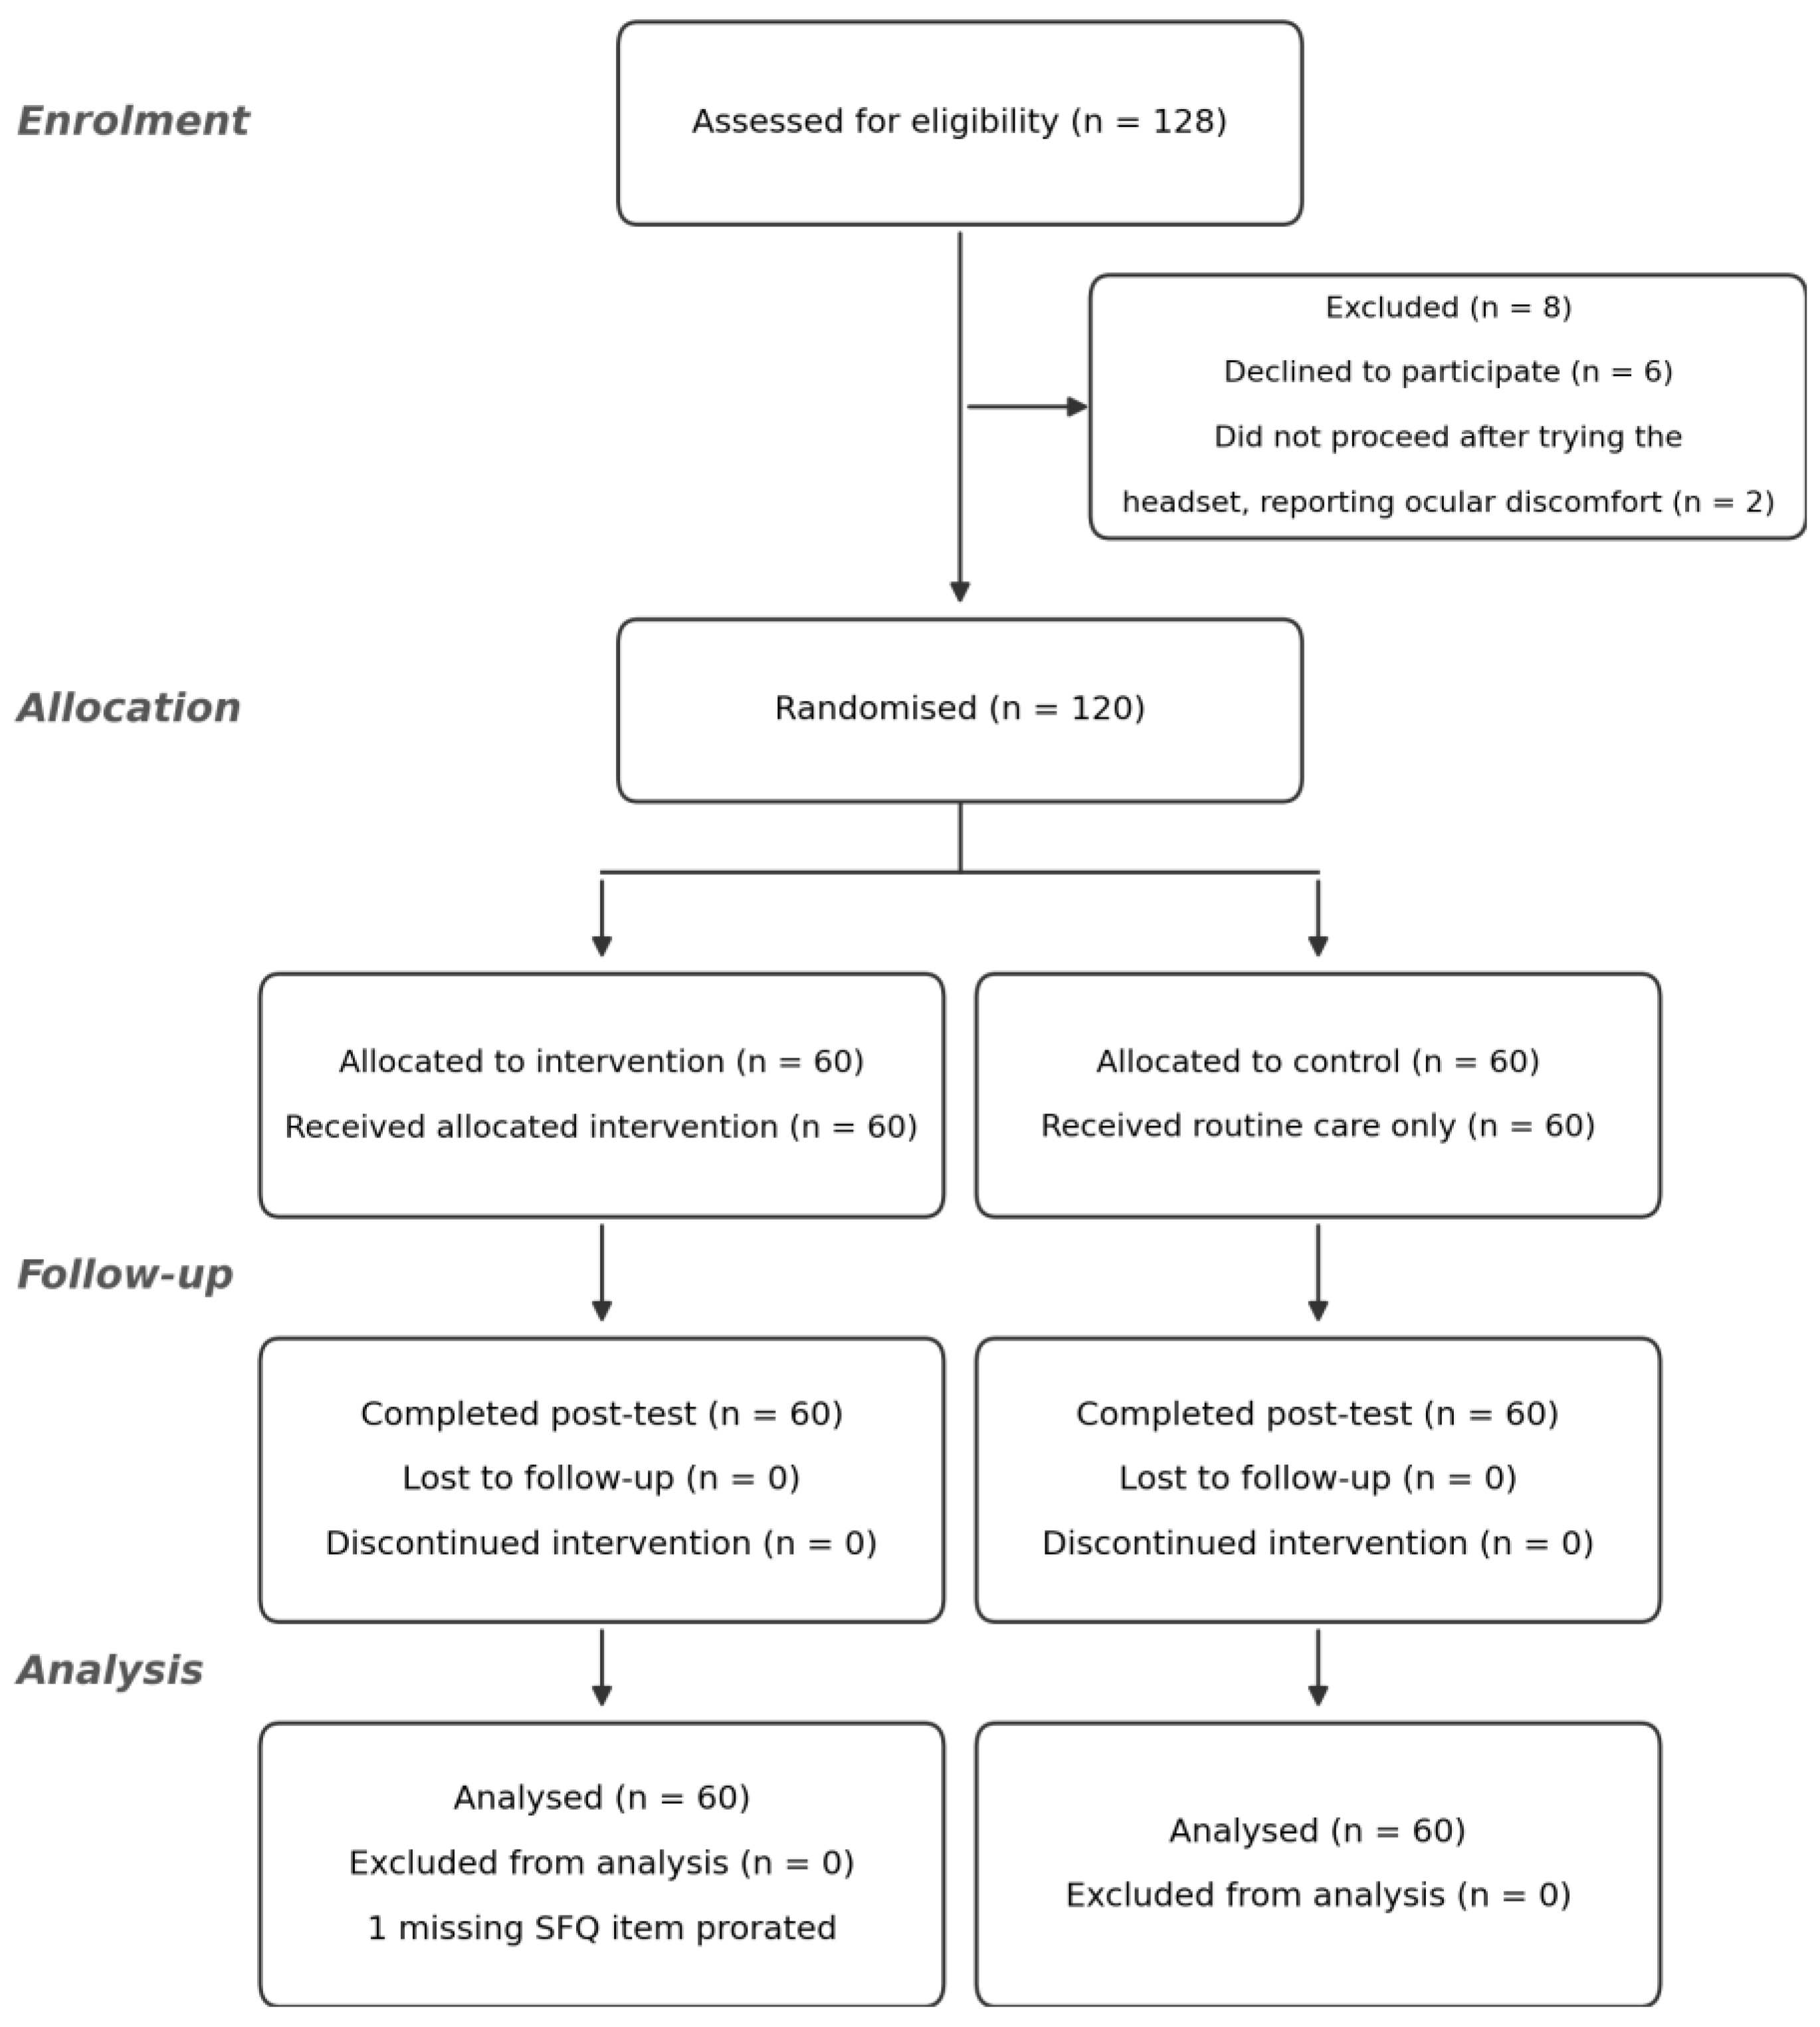
Figure 1).
2.10. Statistical Analysis
Data were analysed with SPSS version 25.0 (IBM Corp., Armonk, NY, USA). Analyses followed the intention-to-treat principle; no participant was lost to follow-up, and all 120 randomised patients were analysed in the arm to which they were allocated. Across 6720 item responses (120 participants, two instruments, two time points), a single item was missing (0.015%), on the pre-test SFQ of one participant. Questionnaires were completed in the presence of the researcher, who checked each form for completeness before the participant left, which accounts for the very low rate of missing data. The missing item was handled by person-mean prorating, in which the mean of the seven observed SFQ items was multiplied by eight; a complete-case sensitivity analysis gave materially identical results.
Because the trial was registered only after data collection had been completed, no analysis can be described as prospectively specified on the basis of the registry entry. The following hierarchy is therefore stated explicitly. The primary analysis was the baseline-adjusted between-group comparison of post-test SFQ total score, the primary outcome named in the ethics-approved protocol. The corresponding analysis of post-test STAI-S was the single secondary analysis. We do not describe either as confirmatory in the prespecification sense, because no analysis plan predating inspection of the data exists; the protocol establishes the outcome and the comparison, not the particular statistical models used to estimate them. All remaining analyses reported below, namely the SFQ subscale analyses, the mixed analysis of variance, change-score comparisons, within-group tests, correlations, the Reliable Change Index classifications, the moderation analysis, and every sensitivity analysis, are exploratory or supportive and are reported as such. No correction for multiplicity was applied because only one primary comparison and one secondary comparison were made; the p-values attached to exploratory analyses are descriptive and should not be read as independent confirmations of efficacy.
Continuous variables are summarised as means and standard deviations and categorical variables as frequencies and percentages. Internal consistency in the present sample was quantified with Cronbach’s alpha. Normality was examined with the Shapiro–Wilk test together with skewness and kurtosis coefficients, and homogeneity of variance with Levene’s test. Baseline sociodemographic and clinical characteristics were summarised descriptively by randomised group; no null-hypothesis significance tests were used to assess baseline comparability. Observed imbalances judged potentially relevant to outcome interpretation were examined in sensitivity analyses.
The primary analysis was an analysis of covariance of the post-test score with group as a fixed factor and the corresponding pre-test score as a covariate, the recommended approach for two-arm pre-test/post-test trials [
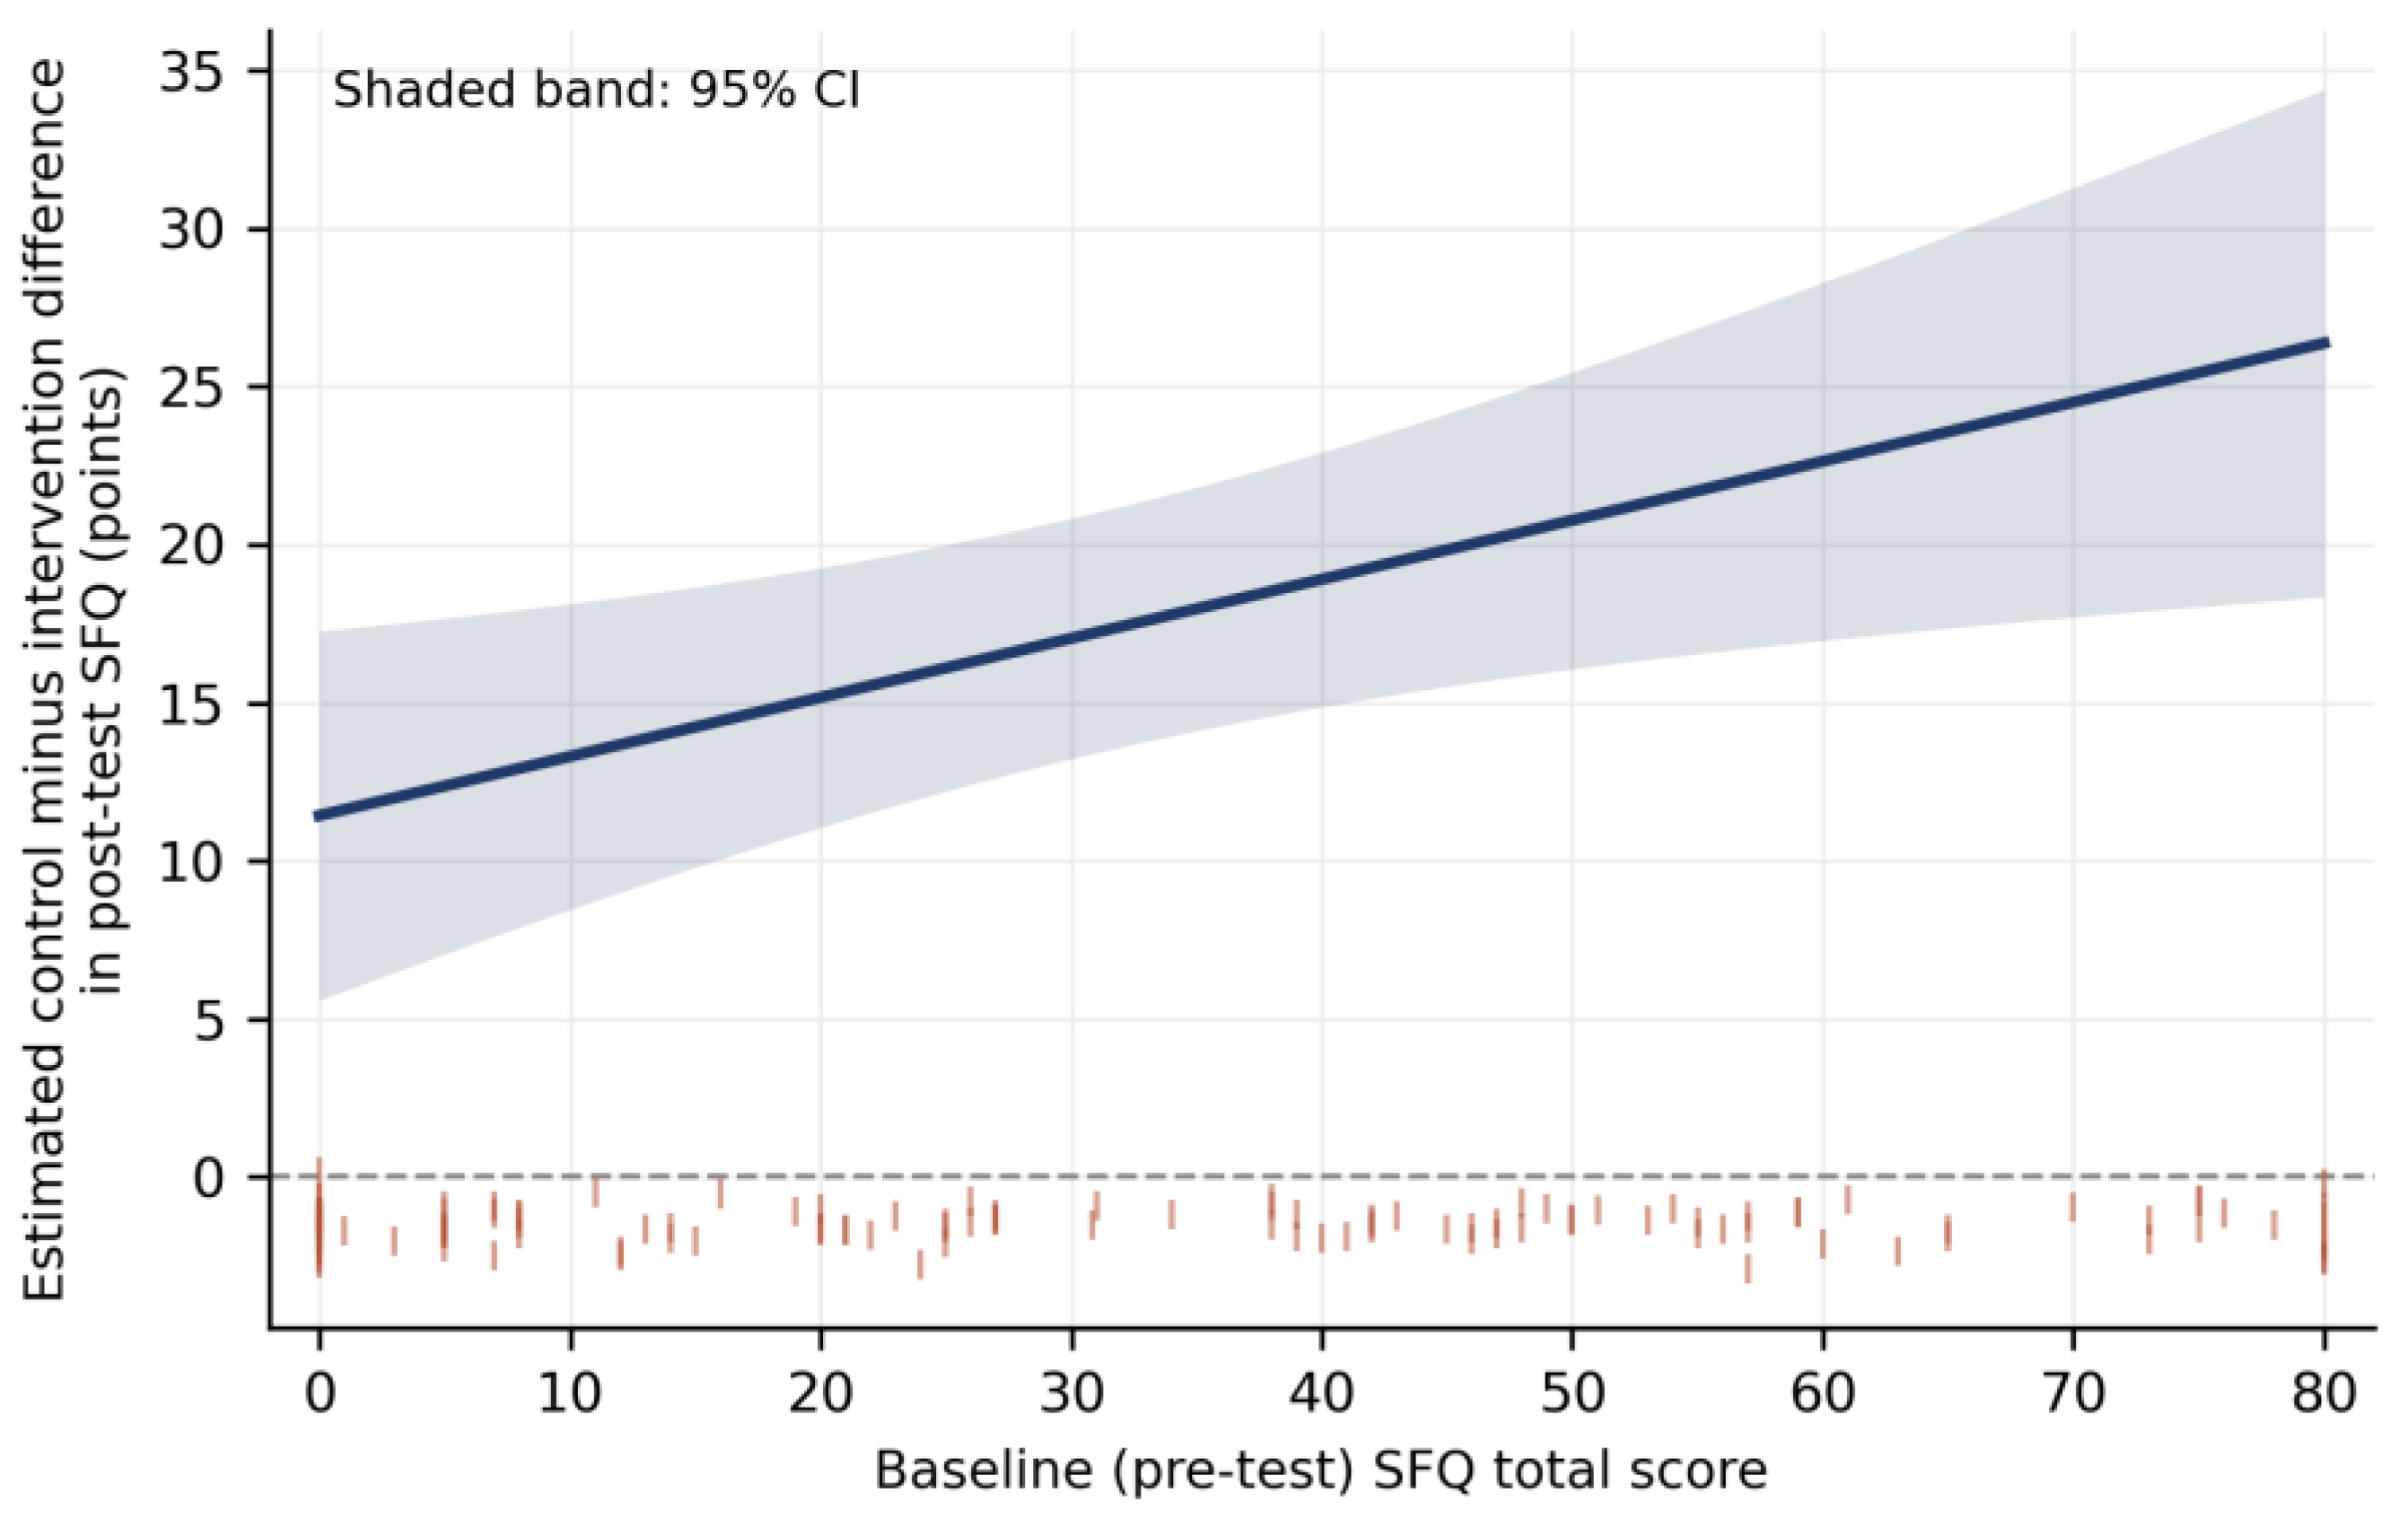
32]. Homogeneity of regression slopes was tested by adding the group-by-covariate interaction term. For surgical fear, this assumption was violated, and the interaction model was therefore adopted as the primary model for that outcome. Because a single constant coefficient cannot represent a treatment effect that varies with baseline, the full interaction model is reported with coefficients, standard errors, and confidence intervals, and conditional treatment effects with 95% confidence intervals are given at interpretable baseline values across the observed range, together with a Johnson–Neyman analysis of the region of significance. Group was coded 0 for the intervention arm and 1 for the control arm, and the covariate was mean-centred, so that a positive group coefficient indicates a higher (worse) post-test score under routine care. The multivariable model for surgical fear retains the same interaction term.
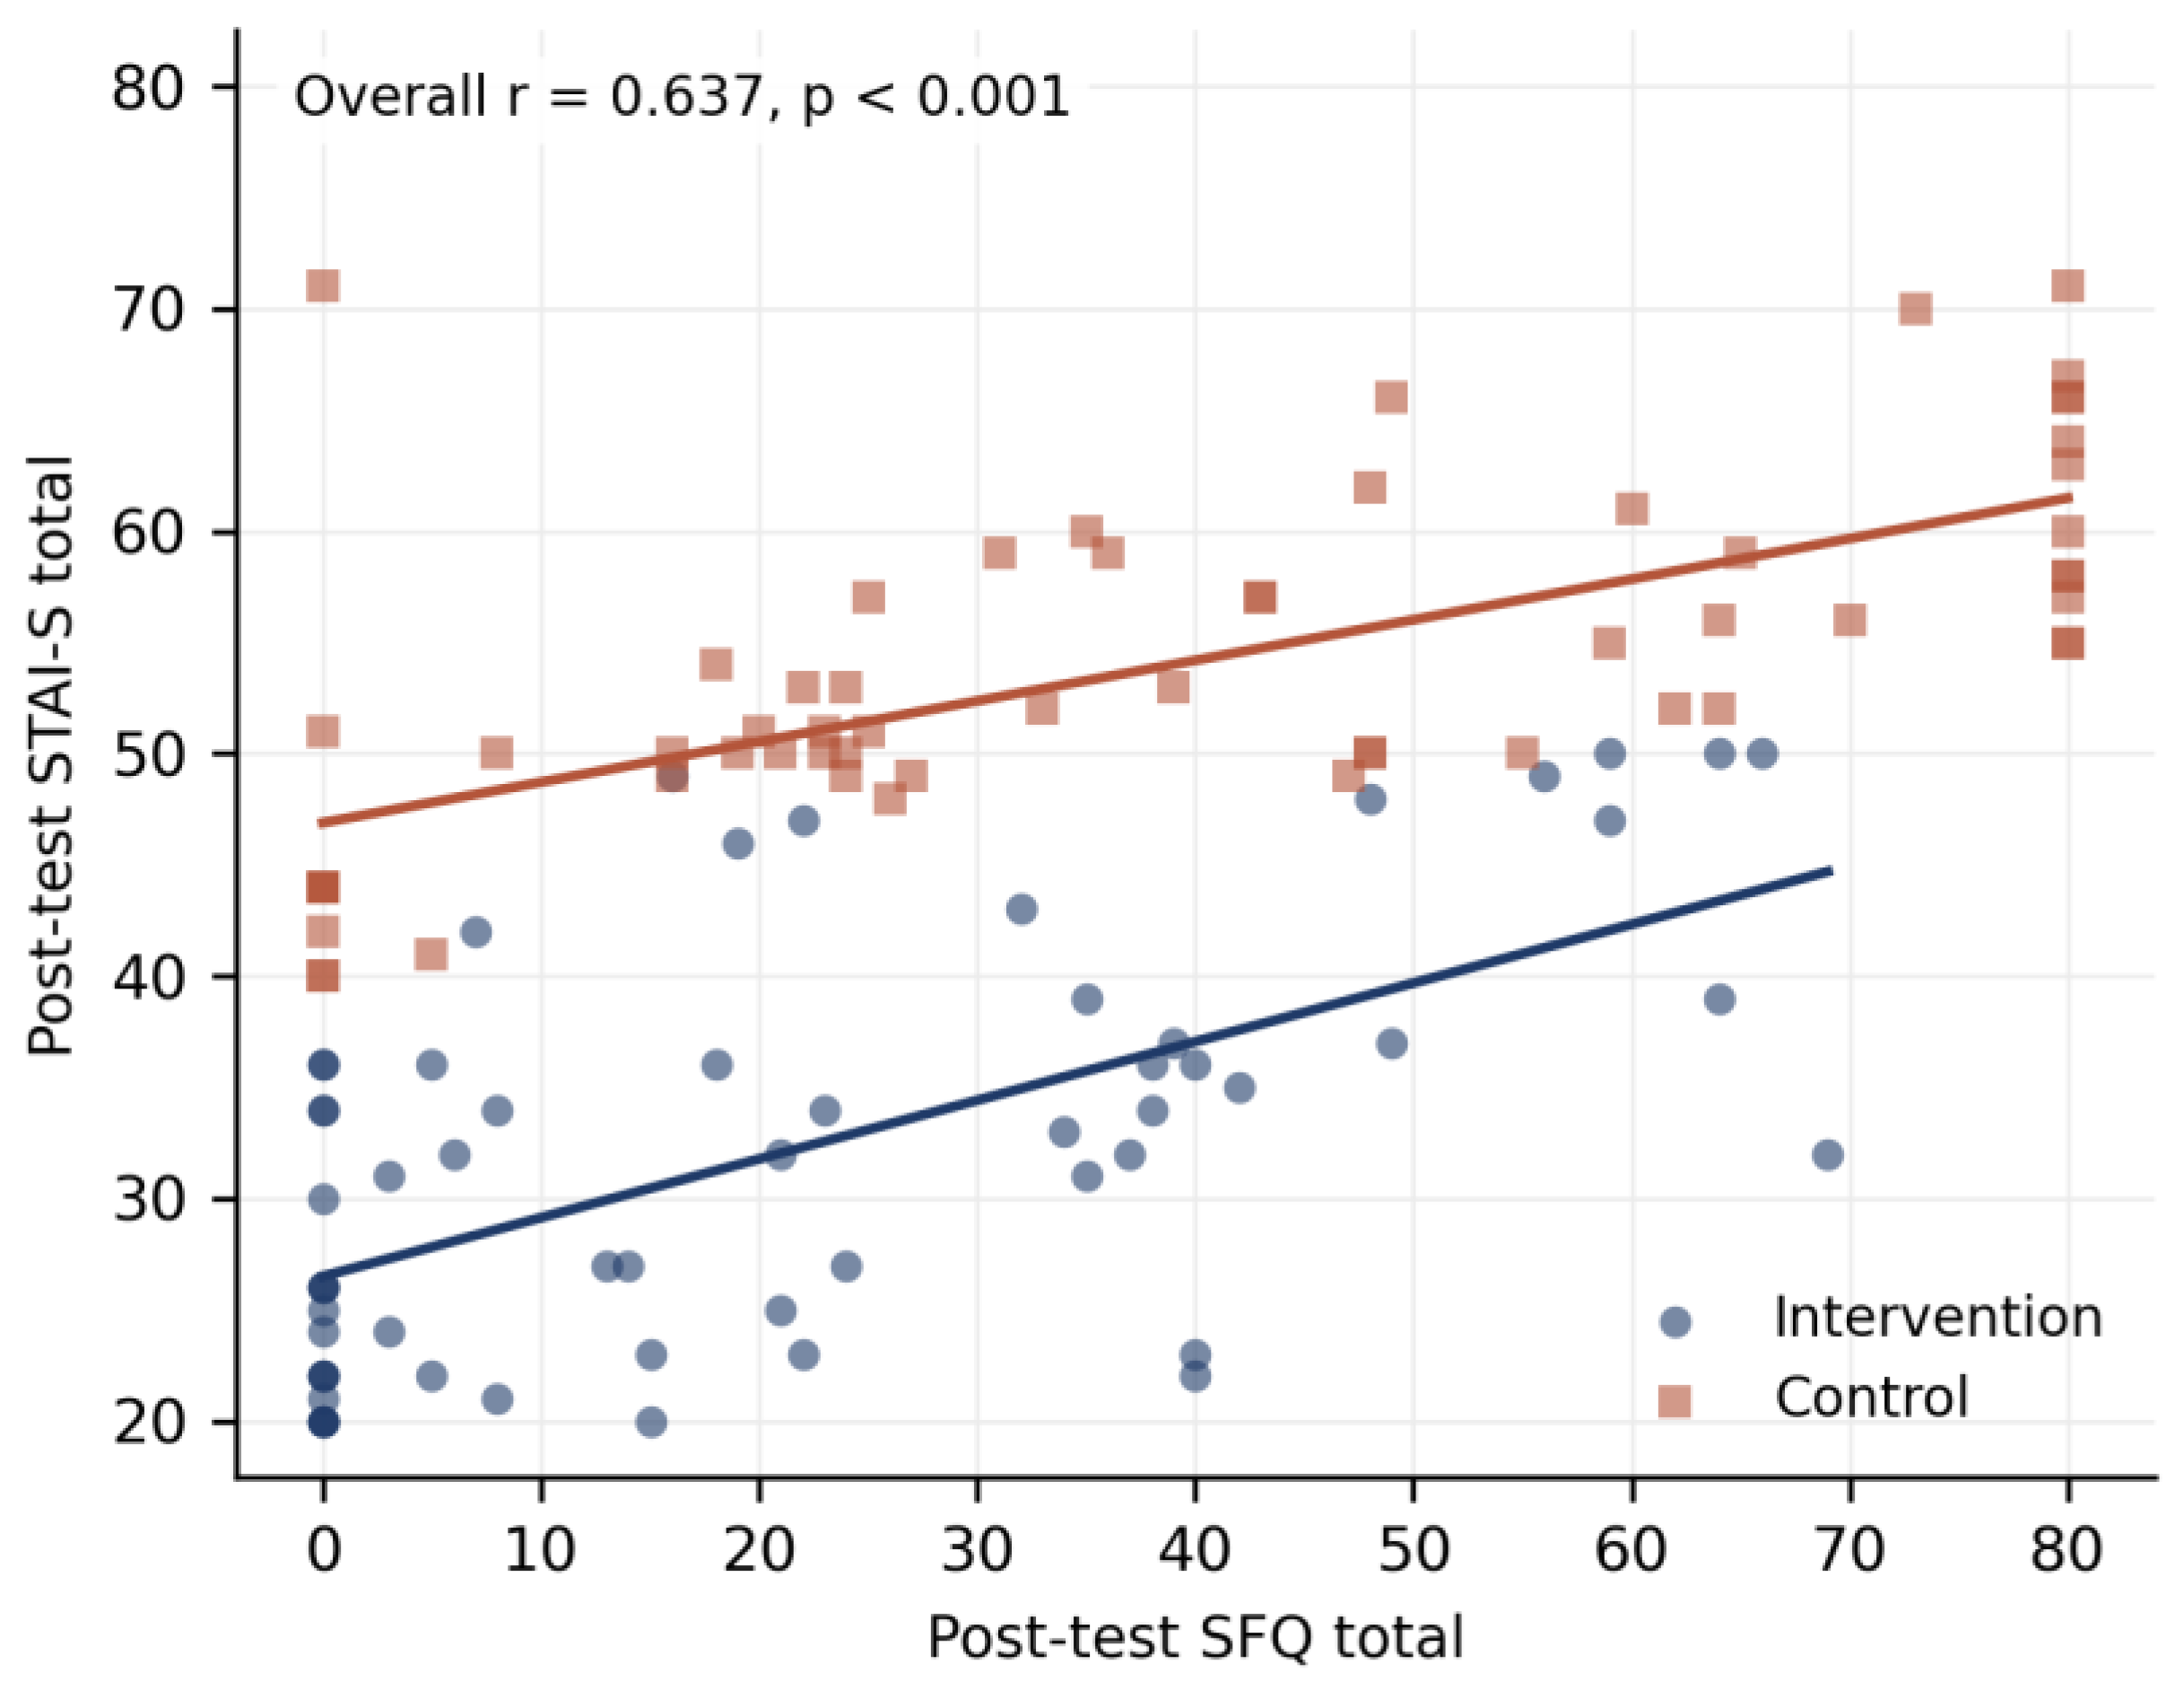
Supportive analyses comprised independent-samples t tests at each time point and on change scores (with Welch’s correction where Levene’s test indicated unequal variances), paired-samples t tests within groups, a 2 × 2 mixed analysis of variance testing the time by group interaction, Mann–Whitney U and Wilcoxon signed-rank repetitions of every parametric comparison, a rank-transformed analysis of covariance, non-parametric bootstrap resampling with 10,000 replications, and multivariable linear regression adjusted for age, sex, body mass index and previous surgery, with multicollinearity assessed by variance inflation factors and tolerance and residual independence by the Durbin–Watson statistic. Associations between surgical fear and state anxiety were quantified with Pearson’s correlation coefficient, with Fisher z-transformed confidence intervals, and with Spearman’s rank correlation as a sensitivity analysis.
Inspection of the item-level data showed that a substantial proportion of participants had given identical responses to all eight SFQ items. The analyses that follow from this observation were therefore post hoc and were prompted by the data rather than planned. The proportion of uniform responders was quantified at each time point and separately for uniform zero and uniform non-zero patterns, and the primary baseline-adjusted analysis was repeated in the corresponding subsamples so that the same analytical framework is applied throughout.
Effect sizes are reported as Hedges’ g with 95% confidence intervals for between-group comparisons, Cohen’s dz for within-group change, and partial eta squared for analysis-of-variance terms, using the conventional benchmarks [
33] only as a frame of reference. Given the design limitations set out in
Section 4.5, confidence intervals rather than conventional qualitative descriptors should carry the interpretation of these effect sizes. The Reliable Change Index was computed for both instruments [
34] as an exploratory analysis. Cronbach’s alpha quantifies internal consistency and not the stability of repeated measurement, and using it in the Reliable Change Index formula understates measurement error and makes the threshold for reliable improvement permissive. The index was therefore computed twice, once using Cronbach’s alpha and once using the pre-test to post-test correlation within the control arm. Neither coefficient is a satisfactory estimate of test–retest reliability, because the control arm did not remain stable over the interval, and no independently established test–retest coefficient for the SFQ in a comparable population was available. The individual-level classification for surgical fear is therefore reported as
Table S1 rather than in the main text, and only the state anxiety classification, which is far less sensitive to the coefficient used, is retained here. All tests were two-sided, and significance was set at
p < 0.05.