
Comparative Analyses Between Vulnerability Biomarkers of Aging and Health Biomarkers in Middle-Aged and Older Female Adults


 , and
, and
Abstract
1. Introduction
2. Materials and Methods
2.1. Measurements
2.2. Statistical Analysis
3. Results
4. Discussion
5. Conclusions
Author Contributions
Funding
Institutional Review Board Statement
Informed Consent Statement
Data Availability Statement
Conflicts of Interest
Abbreviations
| GDF-15 | Growth Differentiation Factor 15 |
| TS | Training Status |
| GFFI | General Functional Fitness Index |
| AAHPERD | American Alliance for Health, Physical Education, Recreation and Dance |
| DXA | Dual-energy X-ray Absorptiometry |
| SBP | Systolic Blood Pressure |
| DBP | Diastolic Blood Pressure |
| TC | Total Cholesterol |
| HDL-C | High-Density Lipoprotein Cholesterol |
| LDL-C | Low-Density Lipoprotein Cholesterol |
| TG | Triglycerides |
| GL | Glucose |
| η2p | ETA Partial Square |
References
- Andrew, M.K.; Mitnitski, A.; Kirkland, S.A.; Rockwood, K. The impact of social vulnerability on the survival of the fittest older adults. Age Ageing 2012, 41, 161–165. [Google Scholar] [CrossRef] [PubMed]
- Guo, J.; Huang, X.; Dou, L.; Yan, M.; Shen, T.; Tang, W.; Li, J. Aging and aging-related diseases: From molecular mechanisms to interventions and treatments. Signal Transduct. Target. Ther. 2022, 7, 391. [Google Scholar] [CrossRef]
- Li, X.; Li, C.; Zhang, W.; Wang, Y.; Qian, P.; Huang, H. Inflammation and aging: Signaling pathways and intervention therapies. Signal Transduct. Target. Ther. 2023, 8, 239. [Google Scholar] [CrossRef]
- Lima, T.; Li, T.Y.; Mottis, A.; Auwerx, J. Pleiotropic effects of mitochondria in aging. Nat. Aging 2022, 2, 199–213. [Google Scholar] [CrossRef] [PubMed]
- Corral-Pérez, J.; Casals, C.; Ávila-Cabeza-de-Vaca, L.; González-Mariscal, A.; Martínez-Zaragoza, I.; Villa-Estrada, F.; Reina-Campos, R.; Vázquez-Sánchez, M.Á. Health factors associated with cognitive frailty older adults living in the community. Front. Aging Neurosci. 2023, 15, 1232460. [Google Scholar] [CrossRef]
- Fried, L.P.; Tangen, C.M.; Walston, J.; Newman, A.B.; Hirsch, C.; Gottdiener, J.; Seeman, T.; Tracy, R.; Kop, W.J.; Burke, G.; et al. Frailty in Older Adults: Evidence for a Phenotype. J. Gerontol. A Biol. Sci. Med. Sci. 2001, 56, M146–M157. [Google Scholar] [CrossRef]
- Bootcov, M.R.; Bauskin, A.R.; Valenzuela, S.M.; Moore, A.G.; Bansal, M.; He, X.Y.; Zhang, H.P.; Donnellan, M.; Mahler, S.; Pryor, K.; et al. MIC-1, a novel macrophage inhibitory cytokine. Proc. Natl. Acad. Sci. USA 1997, 94, 11514–11519. [Google Scholar] [CrossRef] [PubMed]
- Wischhusen, J.; Melero, I.; Fridman, W.H. Growth/Differentiation Factor-15 (GDF-15): From Biomarker to Novel Targetable Immune Checkpoint. Front. Immunol. 2020, 11, 951. [Google Scholar] [CrossRef] [PubMed] [PubMed Central]
- Teng, X.; Zhang, J.; Shi, Y.; Liu, Y.; Yang, Y.; He, J.; Luo, S.; Huang, Y.; Liu, Y.; Liu, D.; et al. Growth differentiation factor-15 as an indicator of disease severity in COVID-19 patients. Front. Immunol. 2021, 12, 662465. [Google Scholar] [CrossRef]
- Yatsuga, S.; Fujita, Y.; Ishii, A.; Fukumoto, Y.; Arahata, H.; Kakuma, T.; Kojima, T.; Ito, M.; Tanaka, M.; Saiki, R.; et al. Growth differentiation factor 15 as a useful biomarker for mitochondrial disorders. Ann. Neurol. 2015, 78, 814–823. [Google Scholar] [CrossRef]
- Cruz-Jentoft, A.J.; Baeyens, J.P.; Bauer, J.M.; Boirie, Y.; Cederholm, T.; Landi, F.; Martin, F.C.; Michel, J.P.; Rolland, Y.; Schneider, S.M.; et al. Sarcopenia: European consensus on definition and diagnosis: Report of the European Working Group on Sarcopenia in Older People. Age Ageing 2010, 39, 412–423. [Google Scholar] [CrossRef] [PubMed] [PubMed Central]
- Walston, J.D. Sarcopenia in older adults. Curr. Opin. Rheumatol. 2012, 24, 623–627. [Google Scholar] [CrossRef]
- Wang, D.; Day, E.A.; Townsend, L.K.; Djordjevic, D.; Jørgensen, S.B.; Steinberg, G.R. GDF15: Emerging biology and therapeutic applications for obesity and cardiometabolic disease. Nat. Rev. Endocrinol. 2021, 17, 592–607. [Google Scholar] [CrossRef] [PubMed]
- Tsai, V.W.; Lin, S.; Brown, D.A.; Salis, A.; Breit, S.N. Anorexia–cachexia and obesity treatment may be two sides of the same coin: Role of the TGF-b superfamily cytokine MIC-1/GDF15. Int. J. Obes. 2016, 40, 193–197. [Google Scholar] [CrossRef]
- Caldas, P.C. Envelhecimento com dependência: Responsabilidades e demandas da família. Cad. Saúde Pública 2003, 19, 733–781. [Google Scholar] [CrossRef] [PubMed]
- Soysal, P.; Stubbs, B.; Lucato, P.; Luchini, C.; Solmi, M.; Peluso, R.; Sergi, G.; Isik, A.T.; Manzato, E.; Maggi, S.; et al. Inflammation and frailty in the elderly: A systematic review and meta-analysis. Ageing Res. Rev. 2016, 31, 1–8. [Google Scholar] [CrossRef]
- Dent, E.; Morley, J.E.; Cruz-Jentoft, A.J.; Woodhouse, L.; Rodríguez-Mañas, L.; Fried, L.P.; Woo, J.; Aprahamian, I.; Sanford, A.; Lundy, J.; et al. Physical frailty: ICFSR international clinical practice guidelines. J. Nutr. Health Aging 2019, 23, 771–787. [Google Scholar] [CrossRef]
- Alberro, A.; Iribarren-Lopez, A.; Sáenz-Cuesta, M.; Matheu, A.; Vergara, I.; Otaegui, D. Inflammaging markers characteristic of advanced age. Sci. Rep. 2021, 11, 4358. [Google Scholar] [CrossRef]
- Boreskie, K.F.; Kehler, D.S.; Costa, E.C.; Hiebert, B.M.; Hamm, N.C.; Moffatt, T.L.; Hay, J.L.; Stammers, A.N.; Kimber, D.E.; Kent, D.E.; et al. Standardization of the Fried frailty phenotype improves cardiovascular disease risk discrimination. Exp. Gerontol. 2019, 119, 40–44. [Google Scholar] [CrossRef]
- Benedetti, T.R.B.; Mazo, G.Z.; Gobbi, S.; Amorim, M.; Gobbi, L.T.B.; Ferreira, L.; Hoefelmann, C.P. Valores normativos de aptidão funcional em mulheres de 70 a 79 anos. Rev. Bras. Cineantropom Desempenho Hum. 2007, 9, 28–36. [Google Scholar]
- Mazo, G.Z.; Benedetti, T.R.B.; Gobbi, S.; Ferreira, L.; Lopes, M.A. Valores normativos e aptidão funcional em homens de 60 a 69 anos de idade. Rev. Bras. Cineantropom Desempenho Hum. 2010, 12, 316–323. [Google Scholar]
- Zago, A.S.; Gobbi, S. Valores normativos da aptidão funcional de mulheres de 60 a 70 anos. Rev. Bras. Ciên Mov. 2003, 11, 77–86. [Google Scholar]
- Osness, W.H.; Adrian, M.; Clark, B.; Hoeger, W.; Raab, D.; Wiswell, R. Functional Fitness Assessment for Adults over 60 Years (A Field Based Assessment): Published Test Protocols; American Alliance of Health, Physical Education, Recreation and Dance: Reston, VA, USA, 1990; pp. 1–24. [Google Scholar]
- Laskey, M.A. Dual-energy X-ray absorptiometry and body composition. Nutrition 1996, 12, 45–51. [Google Scholar] [CrossRef] [PubMed]
- Lukaski, H.C. Soft tissue composition and bone mineral status: Evaluation by dual-energy X-ray absorptiometry. J. Nutr. 1993, 123 (Suppl. 2), 438–443. [Google Scholar] [CrossRef] [PubMed]
- Barroso, W.K.S.; Rodrigues, C.I.S.; Bortolotto, L.A.; Mota-Gomes, M.A.; Brandão, A.A.; Feitosa, A.D.M.; Machado, C.A.; Poli-de-Figueiredo, C.E.; Amodeo, C.; Júnior, D.M.; et al. Diretrizes Brasileiras de Hipertensão Arterial—2020. Arq. Bras. Cardiol. 2021, 116, 516–658. [Google Scholar] [CrossRef]
- The Jamovi Project (2024). Jamovi. (Version 2.6) [Computer Software]. Available online: https://www.jamovi.org (accessed on 1 November 2024).
- Lehallier, B.; Gate, D.; Schaum, N.; Nanasi, T.; Lee, S.E.; Yousef, H.; Moran Losada, P.; Berdnik, D.; Keller, A.; Verghese, J.; et al. Undulating changes in human plasma proteome profiles across the lifespan. Nat. Med. 2019, 25, 1843–1850. [Google Scholar] [CrossRef] [PubMed] [PubMed Central]
- Liu, H.; Huang, Y.; Lyu, Y.; Dai, W.; Tong, Y.; Li, Y. GDF15 as a biomarker of ageing. Exp. Gerontol. 2021, 146, 111228. [Google Scholar] [CrossRef] [PubMed]
- Tanaka, T.; Biancotto, A.; Moaddel, R.; Moore, A.Z.; Gonzalez-Freire, M.; Aon, M.A.; Candia, J.; Zhang, P.; Cheung, F.; Fantoni, G.; et al. Plasma proteomic signature of age in healthy humans. Aging Cell 2018, 17, e12799. [Google Scholar] [CrossRef] [PubMed] [PubMed Central]
- Conte, M.; Ostan, R.; Fabbri, C.; Santoro, A.; Guidarelli, G.; Vitale, G.; Mari, D.; Sevini, F.; Capri, M.; Sandri, M.; et al. Human Aging and Longevity Are Characterized by High Levels of Mitokines. J. Gerontol. A Biol. Sci. Med. Sci. 2019, 74, 600–607. [Google Scholar] [CrossRef] [PubMed]
- Fujita, Y.; Taniguchi, Y.; Shinkai, S.; Tanaka, M.; Ito, M. Secreted growth differentiation factor 15 as a potential biomarker for mitochondrial dysfunctions in aging and age-related disorders. Geriatr. Gerontol. Int. 2016, 16 (Suppl. S1), 17–29. [Google Scholar] [CrossRef] [PubMed]
- Kleinert, M.; Clemmensen, C.; Sjøberg, K.A.; Carl, C.S.; Jeppesen, J.F.; Wojtaszewski, J.F.P.; Kiens, B.; Richter, E.A. Exercise increases circulating GDF15 in humans. Mol. Metab. 2018, 9, 187–191. [Google Scholar] [CrossRef] [PubMed] [PubMed Central]
- Zhang, H.; Fealy, C.E.; Kirwan, J.P. Exercise training promotes a GDF15-associated reduction in fat mass in older adults with obesity. Am. J. Physiol. Endocrinol. Metab. 2019, 316, E829–E836. [Google Scholar] [CrossRef] [PubMed] [PubMed Central]
- Tchou, I.; Margeli, A.; Tsironi, M.; Skenderi, K.; Barnet, M.; Kanaka-Gantenbein, C.; Papassotiriou, I.; Beris, P. Growth-differentiation factor-15, endoglin and N-terminal pro-brain natriuretic peptide induction in athletes participating in an ultramarathon foot race. Biomarkers 2009, 14, 418–422. [Google Scholar] [CrossRef] [PubMed]
- De Sousa, C.A.Z.; Sierra, A.P.R.; Martínez Galán, B.S.; Maciel, J.F.S.; Manoel, R.; Barbeiro, H.V.; de Souza, H.P.; Cury-Boaventura, M.F. Time Course and Role of Exercise-Induced Cytokines in Muscle Damage and Repair After a Marathon Race. Front. Physiol. 2021, 12, 752144. [Google Scholar] [CrossRef] [PubMed] [PubMed Central]
- Seo, M.W.; Jung, S.W.; Kim, S.W.; Lee, J.M.; Jung, H.C.; Song, J.K. Effects of 16 Weaks of Resistance Training on Muscle Quality and Muscle Growth Factors in Older Adult Women with Sarcopenia: A Randomized Controlled Trial. Int. J. Environ. Res. Public Health 2021, 18, 6762. [Google Scholar] [CrossRef] [PubMed] [PubMed Central]
- Chang, J.S.; Namkung, J. Effects of Exercise Intervention on Mitochondrial Stress Biomarkers in Metabolic Syndrome Patients: A Randomized Controlled Trial. Int. J. Environ. Res. Public Health 2021, 18, 2242. [Google Scholar] [CrossRef] [PubMed] [PubMed Central]
- Torrens-Mas, M.; Navas-Enamorado, C.; Galmes-Panades, A.; Masmiquel, L.; Sanchez-Polo, A.; Capo, X.; Gonzalez-Freire, M. GDF-15 as a proxy for epigenetic aging: Associations with biological age markers, and physical function. Biogerontology 2025, 26, 22. [Google Scholar] [CrossRef] [PubMed]
- Tavenier, J.; Rasmussen, L.J.H.; Andersen, A.L.; Houlind, M.B.; Langkilde, A.; Andersen, O.; Petersen, J.; Nehlin, J.O. Association of GDF15 with Inflammation and Physical Function During Aging and Recovery After Acute Hospitalization: A Longitudinal Study of Older Patients and Age-Matched Controls. J. Gerontol. Ser. A 2021, 76, 964–974. [Google Scholar] [CrossRef]
- Smart, N.A.; Downes, D.; van der Touw, T.; Hada, S.; Dieberg, G.; Pearson, M.J.; Wolden, M.; King, N.; Goodman, S.P.J. The Effect of Exercise Training on Blood Lipids: A Systematic Review and Meta-analysis. Sports Med. 2024, 55, 67–78. [Google Scholar] [CrossRef]
- Silva, R.F.; Iwamoto, J.M.; Filho, D.M.P.; Monteiro, H.L.; Villar, R.; Zago, A.S. A cross-sectional analysis of risk factors for cardiovascular diseases in older females: Association between body fat distribution and physical fitness. J. Women Aging 2021, 34, 181–193. [Google Scholar] [CrossRef]

| Weak TS | Regular TS | Good TS | p | ƞ2p | |
|---|---|---|---|---|---|
| Estimated Training Status | |||||
| Coordination (seconds) | 20.3 ± 8.5 | 13.2 ± 2.2 | 10.5 ± 1.7 a | 0.001 | 0.285 |
| Flexibility (cm) | 48.6 ± 13.2 | 61.8 ± 8.5 | 63.3 ± 6.8 a | 0.004 | 0.261 |
| Muscular strength (repetition) | 21.0 ± 3.9 | 24.2 ± 3.5 | 32.1 ± 2.3 ab | 0.001 | 0.613 |
| Agility and dynamic balance (seconds) | 33.2 ± 9.8 | 23.5 ± 4.1 a | 20.7 ± 2.0 a | 0.001 | 0.335 |
| Cardiovascular endurance (seconds) | 655.3 ± 92 | 547.6 ± 25 a | 475.0 ± 27 a | 0.001 | 0.548 |
| General Functional Fitness Index (score) | 119.9 ± 42 | 224.1 ± 37 a | 371.7 ± 44 a | 0.000 | 0.861 |
| Blood Biochemistry | |||||
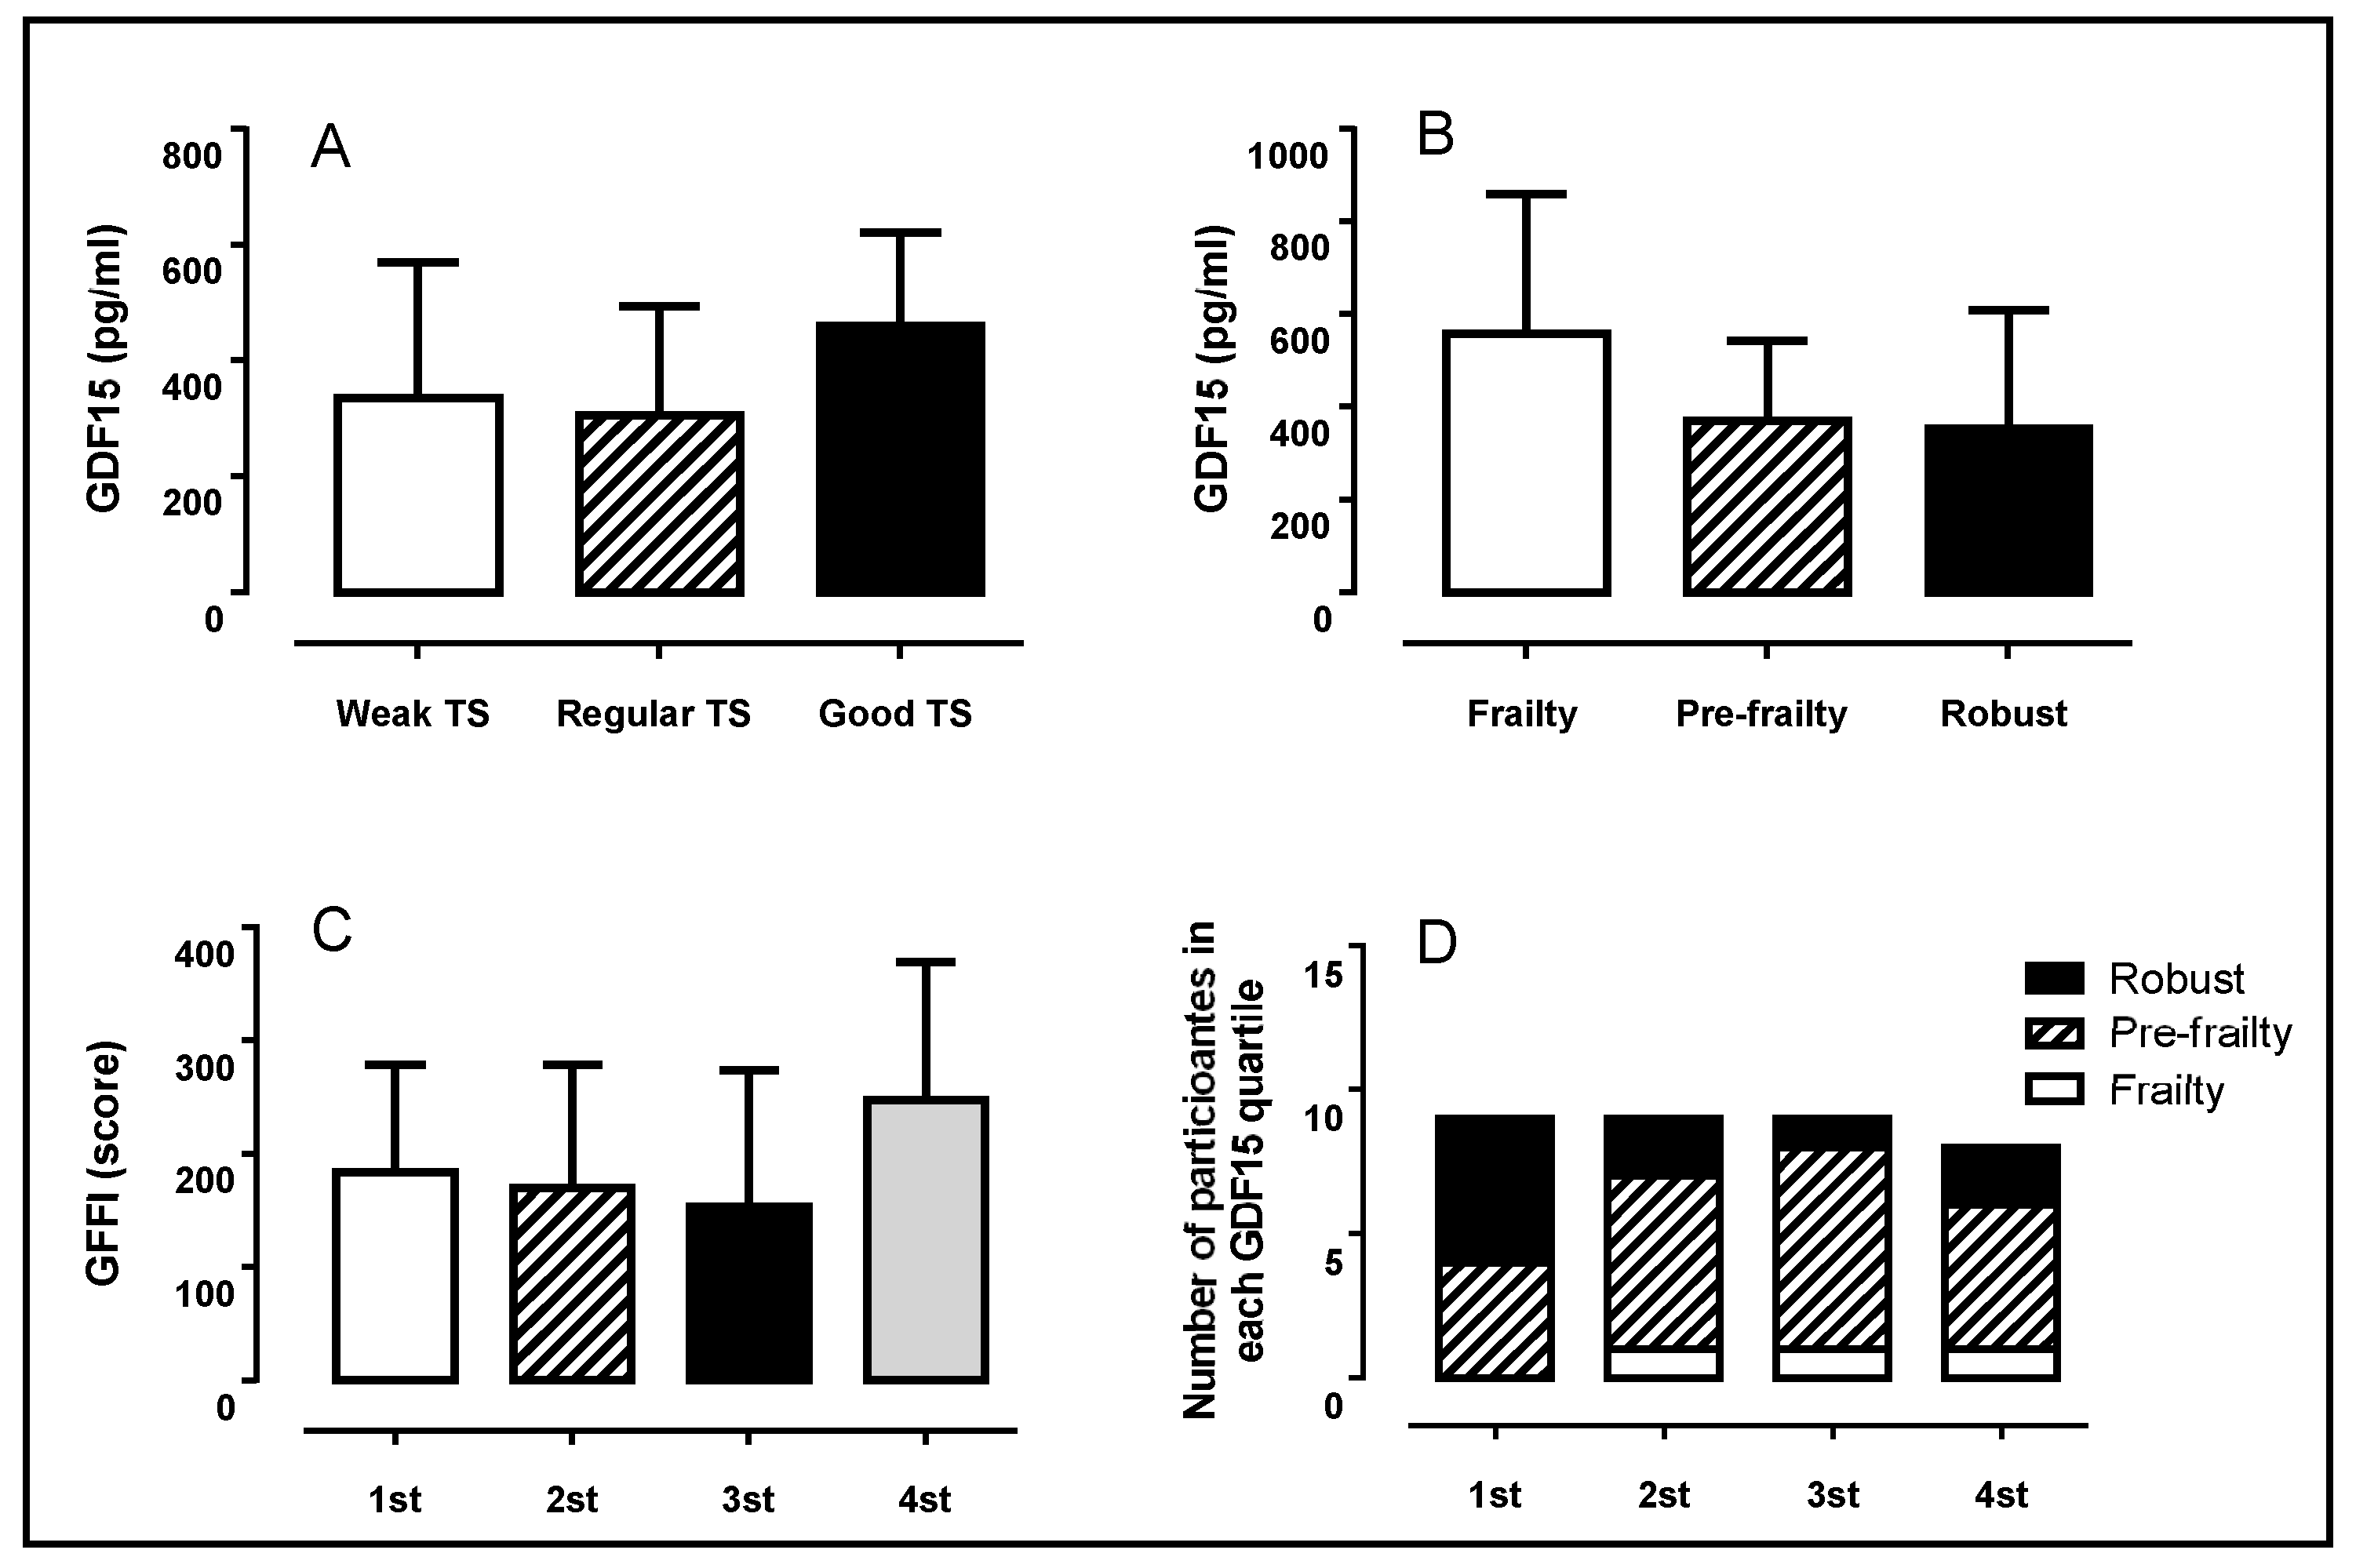
| GDF-15 (pg·mL−1) | 366.3 ± 234 | 306.5 ± 188 | 461.6 ± 160 | 0.347 | 0.052 |
| Total cholesterol (mg/dL) | 199.0 ± 40 | 219.0 ± 19 | 154.7 ± 37 ab | 0.006 | 0.253 |
| HDL cholesterol (mg/dL) | 44.3 ± 16 | 32.0 ± 10 | 61.6 ± 7 ab | 0.002 | 0.296 |
| LDL cholesterol (mg/dL) | 140.3 ± 44 | 166.0 ± 29 | 80.0 ± 32 ab | 0.001 | 0.346 |
| VLDL cholesterol (mg/dL) | 14.3 ± 11 | 20.9 ± 13 | 13.0 ± 2 | 0.353 | 0.058 |
| Triglycerides (mg/dL) | 95.6 ± 47 | 125.6 ± 45 | 65.3 ± 10 b | 0.048 | 0.195 |
| Glucose (mg/dL) | 115.8 ± 41 | 102.1 ± 8 | 95.2 ± 13 | 0.310 | 0.065 |
| Body Composition | |||||
| Lean mass (kg) | 41.0 ± 9 | 35.5 ± 4 | 34.0 ± 4 | 0.095 | 0.126 |
| Lean mass (%) | 57.4 ± 5 | 57.1 ± 4 | 55.0 ± 7 | 0.637 | 0.025 |
| Fat mass (kg) | 29.2 ± 9 | 25.0 ± 5 | 27.0 ± 9 | 0.540 | 0.035 |
| Fat mass (%) | 39.8 ± 5 | 39.8 ± 5 | 41.9 ± 7 | 0.706 | 0.020 |
| Bone mineral content (kg) | 1.9 ± 0.4 | 1.8 ± 0.2 | 1.8 ± 0.3 | 0.935 | 0.004 |
| Sarcopenic index | 6.8 ± 1.4 | 6.1 ± 0.7 | 5.6 ± 0.6 | 0.055 | 0.153 |
| Body mass index (kg/m2) | 29.9 ± 6 | 27.4 ± 3 | 26.3 ± 3 | 0.220 | 0.083 |
| Blood Pressure | |||||
| Systolic blood pressure (mmHg) | 133.2 ± 12 | 120.9 ± 10 | 113.5 ± 11 a | 0.001 | 0.333 |
| Diastolic blood pressure (mmHg) | 76.5 ± 8 | 80.0 ± 7 | 71.6 ± 8 | 0.194 | 0.092 |
| Frail | Pre-Frail | Robust | p | ƞ2p | |
|---|---|---|---|---|---|
| Estimated Training Status | |||||
| Coordination (seconds) | 24.5 ± 9 | 17.6 ± 8 | 14.3 ± 5 | 0.240 | 0.110 |
| Flexibility (cm) | 54.3 ± 18 | 50.7 ± 13 | 59.6 ± 11 | 0.249 | 0.092 |
| Muscular strength (repetition) | 16.3 ± 7 | 22.8 ± 4 | 27.8 ± 5 ab | 0.050 | 0.321 |
| Agility and dynamic balance (seconds) | 33.9 ± 8 | 30.6 ± 10 | 24.9 ± 5 | 0.266 | 0.093 |
| Cardiovascular endurance (seconds) | 577.0 ± 100 | 616.0 ± 107 | 564.0 ± 106 | 0.981 | 0.049 |
| General Functional Fitness Index (score) | 93.6 ± 50 | 163.6 ± 86 | 262.7 ± 126 ab | 0.009 | 0.237 |
| Blood Biochemistry | |||||
| GDF-15 (pg·mL−1) | 558.2 ± 302 | 370.5 ± 173 | 354.1 ± 256 | 0.621 | 0.069 |
| Total cholesterol (mg/dL) | 238.0 ± 44 | 203.1 ± 28 | 161.8 ± 46 ab | 0.002 | 0.306 |
| HDL cholesterol (mg/dL) | 36.9 ± 15 | 47.0 ± 17 | 46.5 ± 16 | 0.634 | 0.026 |
| LDL cholesterol (mg/dL) | 172.5 ± 42 | 142.3 ± 39 | 101.0 ± 52 ab | 0.014 | 0.216 |
| VLDL cholesterol (mg/dL) | 28.5 ± 22 | 13.8 ± 10 | 14.2 ± 7 | 0.078 | 0.135 |
| Triglycerides (mg/dL) | 142.6 ± 110 | 93.7 ± 31 | 77.4 ± 29 | 0.074 | 0.170 |
| Glucose (mg/dL) | 135.6 ± 61 | 105.4 ± 31 | 110.2 ± 34 | 0.376 | 0.054 |
| Body Composition | |||||
| Lean mass (kg) | 40.0 ± 6 | 37.3 ± 6 | 40.8 ± 12 | 0.525 | 0.036 |
| Lean mass (%) | 57.4 ± 5 | 56.7 ± 6 | 56.9 ± 5 | 0.984 | 0.001 |
| Fat mass (kg) | 27.4 ± 2 | 27.8 ± 9 | 28.7 ± 8 | 0.946 | 0.003 |
| Fat mass (%) | 39.6 ± 5 | 40.4 ± 6 | 40.1 ± 5 | 0.974 | 0.002 |
| Bone mineral content (kg) | 2.0 ± 0.4 | 1.8 ± 0.3 | 2.0 ± 0.3 | 0.230 | 0.081 |
| Sarcopenic index | 6.8 ± 0.9 | 6.4 ± 1.2 | 6.4 ± 1.6 | 0.928 | 0.004 |
| Body mass index (kg/m2) | 29.2 ± 1.7 | 28.4 ± 5.0 | 29.3 ± 6.7 | 0.883 | 0.007 |
| Blood Pressure | |||||
| Systolic blood pressure (mmHg) | 139.3 ± 14 | 126.8 ± 14 | 124.1 ± 14 | 0.284 | 0.071 |
| Diastolic blood pressure (mmHg) | 78.3 ± 5.5 | 77.8 ± 9.9 | 72.1 ± 6.0 | 0.181 | 0.096 |
| 1st | 2nd | 3rd | 4th | p | ƞ2p | |
|---|---|---|---|---|---|---|
| Estimated Training Status | ||||||
| Coordination (sec) | 19.3 ± 12 | 16.2 ± 4 | 1935 ± 8 | 14.6 ± 4 | 0.439 | 0.066 |
| Flexibility (cm) | 56.0 ± 14 | 54.6 ± 13 | 44.9 ± 13 | 58.2 ± 12 | 0.219 | 0.141 |
| Muscular strength (repetition) | 24.4 ± 4 | 22.0 ± 6 | 21.3 ± 6 | 27.3 ± 4 | 0.121 | 0.170 |
| Agility and dynamic balance (sec) | 29.4 ± 9 | 29.1 ± 7 | 30.1 ± 10 | 27.4 ± 13 | 0.977 | 0.010 |
| Cardiovascular endurance (sec) | 640.9 ± 106 | 604.6 ± 116 | 573.5 ± 93 | 541.7 ± 118 | 0.401 | 0.119 |
| GFFI (score) | 183.6 ± 95 | 169.8 ± 109 | 153.4 ± 120 | 247.5 ± 122 | 0.325 | 0.101 |
| Blood Biochemistry | ||||||
| GDF-15 (pg·mL−1) | 163.4 ± 46 | 288.8 ± 60 a | 422.4 ± 34 ab | 686.8 ± 168 abc | 0.001 | 0.833 |
| Total cholesterol (mg/dL) | 175.7 ± 41 | 202.4 ± 37 | 210.8 ± 35 | 177.2 ± 50 | 0.204 | 0.132 |
| HDL cholesterol (mg/dL) | 44.6 ± 14 | 46.4 ± 10 | 53.8 ± 22 | 43.7 ± 18 | 0.587 | 0.058 |
| LDL cholesterol (mg/dL) | 117.3 ± 48 | 142.2 ± 39 | 137.8 ± 45 | 120.2 ± 62 | 0.643 | 0.050 |
| VLDL cholesterol (mg/dL) | 13.8 ± 9 | 13.8 ± 9 | 19.1 ± 14 | 13.2 ± 9 | 0.654 | 0.049 |
| Triglycerides (mg/dL) | 89.1 ± 33 | 89.0 ± 35 | 107.8 ± 69 | 85.2 ± 34 | 0.779 | 0.042 |
| Glucose (mg/dL) | 111.7 ± 38 | 110.5 ± 49 | 112.2 ± 36 | 104.4 ± 17 | 0.968 | 0.008 |
| Body Composition | ||||||
| Lean mass (kg) | 43.2 ± 14.0 | 35.8 ± 2.8 | 40.6 ± 6.8 | 35.2 ± 4.9 | 0.173 | 0.142 |
| Lean mass (%) | 56.4 ± 4 | 58.4 ± 7 | 56.2 ± 5 | 56.9 ± 7 | 0.882 | 0.020 |
| Fat mass (kg) | 31.2 ± 9 | 25.0 ± 9 | 30.0 ± 7 | 25.7 ± 8 | 0.349 | 0.096 |
| Fat mass (%) | 41.0 ± 4 | 38.6 ± 7 | 41.0 ± 5 | 39.9 ± 7 | 0.845 | 0.025 |
| Bone mineral content (kg) | 1.9 ± 0.4 | 1.7 ± 0.2 | 1.9 ± 0.4 | 1.9 ± 0.3 | 0.682 | 0.045 |
| Sarcopenic index | 7.1 ± 1.9 | 5.9 ± 0.5 | 6.8 ± 1.0 | 6.1 ± 1.3 | 0.186 | 0.138 |
| Body mass index (kg/m2) | 32.4 ± 7.8 | 25.9 ± 3.9 | 29.9 ± 3.2 | 27.0 ± 4.7 | 0.059 | 0.224 |
| Blood Pressure | ||||||
| Systolic blood pressure (mmHg) | 124.7 ± 17 | 130.0 ± 11 | 132.9 ± 14 | 118.5 ± 13 | 0.201 | 0.137 |
| Diastolic blood pressure (mmHg) | 77.0 ± 8 | 75.9 ± 7 | 76.5 ± 10 | 72.1 ± 9 | 0.683 | 0.046 |
Disclaimer/Publisher’s Note: The statements, opinions and data contained in all publications are solely those of the individual author(s) and contributor(s) and not of MDPI and/or the editor(s). MDPI and/or the editor(s) disclaim responsibility for any injury to people or property resulting from any ideas, methods, instructions or products referred to in the content. |
© 2025 by the authors. Licensee MDPI, Basel, Switzerland. This article is an open access article distributed under the terms and conditions of the Creative Commons Attribution (CC BY) license (https://creativecommons.org/licenses/by/4.0/).
Share and Cite
Knoblauch, K.K.B.; Losnack, L.F.; Zacarias, G.C.; Satyro, G.G.; Villar, R.; Zago, A.S. Comparative Analyses Between Vulnerability Biomarkers of Aging and Health Biomarkers in Middle-Aged and Older Female Adults. Healthcare 2025, 13, 667. https://doi.org/10.3390/healthcare13060667
Knoblauch KKB, Losnack LF, Zacarias GC, Satyro GG, Villar R, Zago AS. Comparative Analyses Between Vulnerability Biomarkers of Aging and Health Biomarkers in Middle-Aged and Older Female Adults. Healthcare. 2025; 13(6):667. https://doi.org/10.3390/healthcare13060667
Chicago/Turabian StyleKnoblauch, Klara Karin Brigitte, Luana Froes Losnack, Gustavo Castillo Zacarias, Gabriel Gasparini Satyro, Rodrigo Villar, and Anderson Saranz Zago. 2025. "Comparative Analyses Between Vulnerability Biomarkers of Aging and Health Biomarkers in Middle-Aged and Older Female Adults" Healthcare 13, no. 6: 667. https://doi.org/10.3390/healthcare13060667
APA StyleKnoblauch, K. K. B., Losnack, L. F., Zacarias, G. C., Satyro, G. G., Villar, R., & Zago, A. S. (2025). Comparative Analyses Between Vulnerability Biomarkers of Aging and Health Biomarkers in Middle-Aged and Older Female Adults. Healthcare, 13(6), 667. https://doi.org/10.3390/healthcare13060667