
Physical Activity in Cerebral Palsy: A Current State Study

 ,
,  , , and
Abstract
1. Introduction
- -
- Frequency refers to the number of sessions conducted per week. Ideally, aiming for at least 3–5 sessions per week with a 24–36 h-recovery period in between is recommended to improve or maintain cardiorespiratory fitness. However, for people with CP who are very deconditioned, a more suitable approach would be to initiate with 1–2 sessions per week and gradually progress as they adapt to the physical demands [2,14,15].
- -
- Intensity is a crucial aspect linked to the effort exerted during PA, often expressed relative to maximal heart rate or heart rate reserve (HRR). HRR represents the difference between an individual’s measured or predicted maximum heart rate and their resting heart rate and/or peak oxygen consumption. For effective results, the intensity should generally align with the recommendation of exceeding 60% of the maximum heart rate or exceeding 40% of HRR throughout training, which is considered as a moderate or a vigorous exercise [16];
- -
- Time denotes the duration of each training session, which should be at least 20 min for aerobic workouts, and conducted consistently for a minimum of 8 to 16 consecutive weeks, depending on the chosen frequency;
- -
- A diverse range of exercises or types of activities can be adapted to suit the specific conditions and abilities of individuals with CP. These activities may include sports, running, muscle-strengthening exercises, and others, as long as they align with the recommendations provided by the therapist and are tailored to meet the individual’s unique needs and capabilities.
- What is the percentage of individual with CP who adhere to recommendations for RPA in terms of frequency and duration of training sessions?
- Is there any loss of interest in physical activity over time among people with CP?
- If so, at what stage does this declining interest in physical activity typically occur?
- Are there specific mechanisms, tools, or strategies that could effectively engage people with CP in regular physical activity over an extended period?
2. Methodology
2.1. Study Design
2.2. Participants
2.3. Ethics Committee
2.4. Procedure
2.5. Analysis
3. Results
3.1. General Population Description (Block 1)
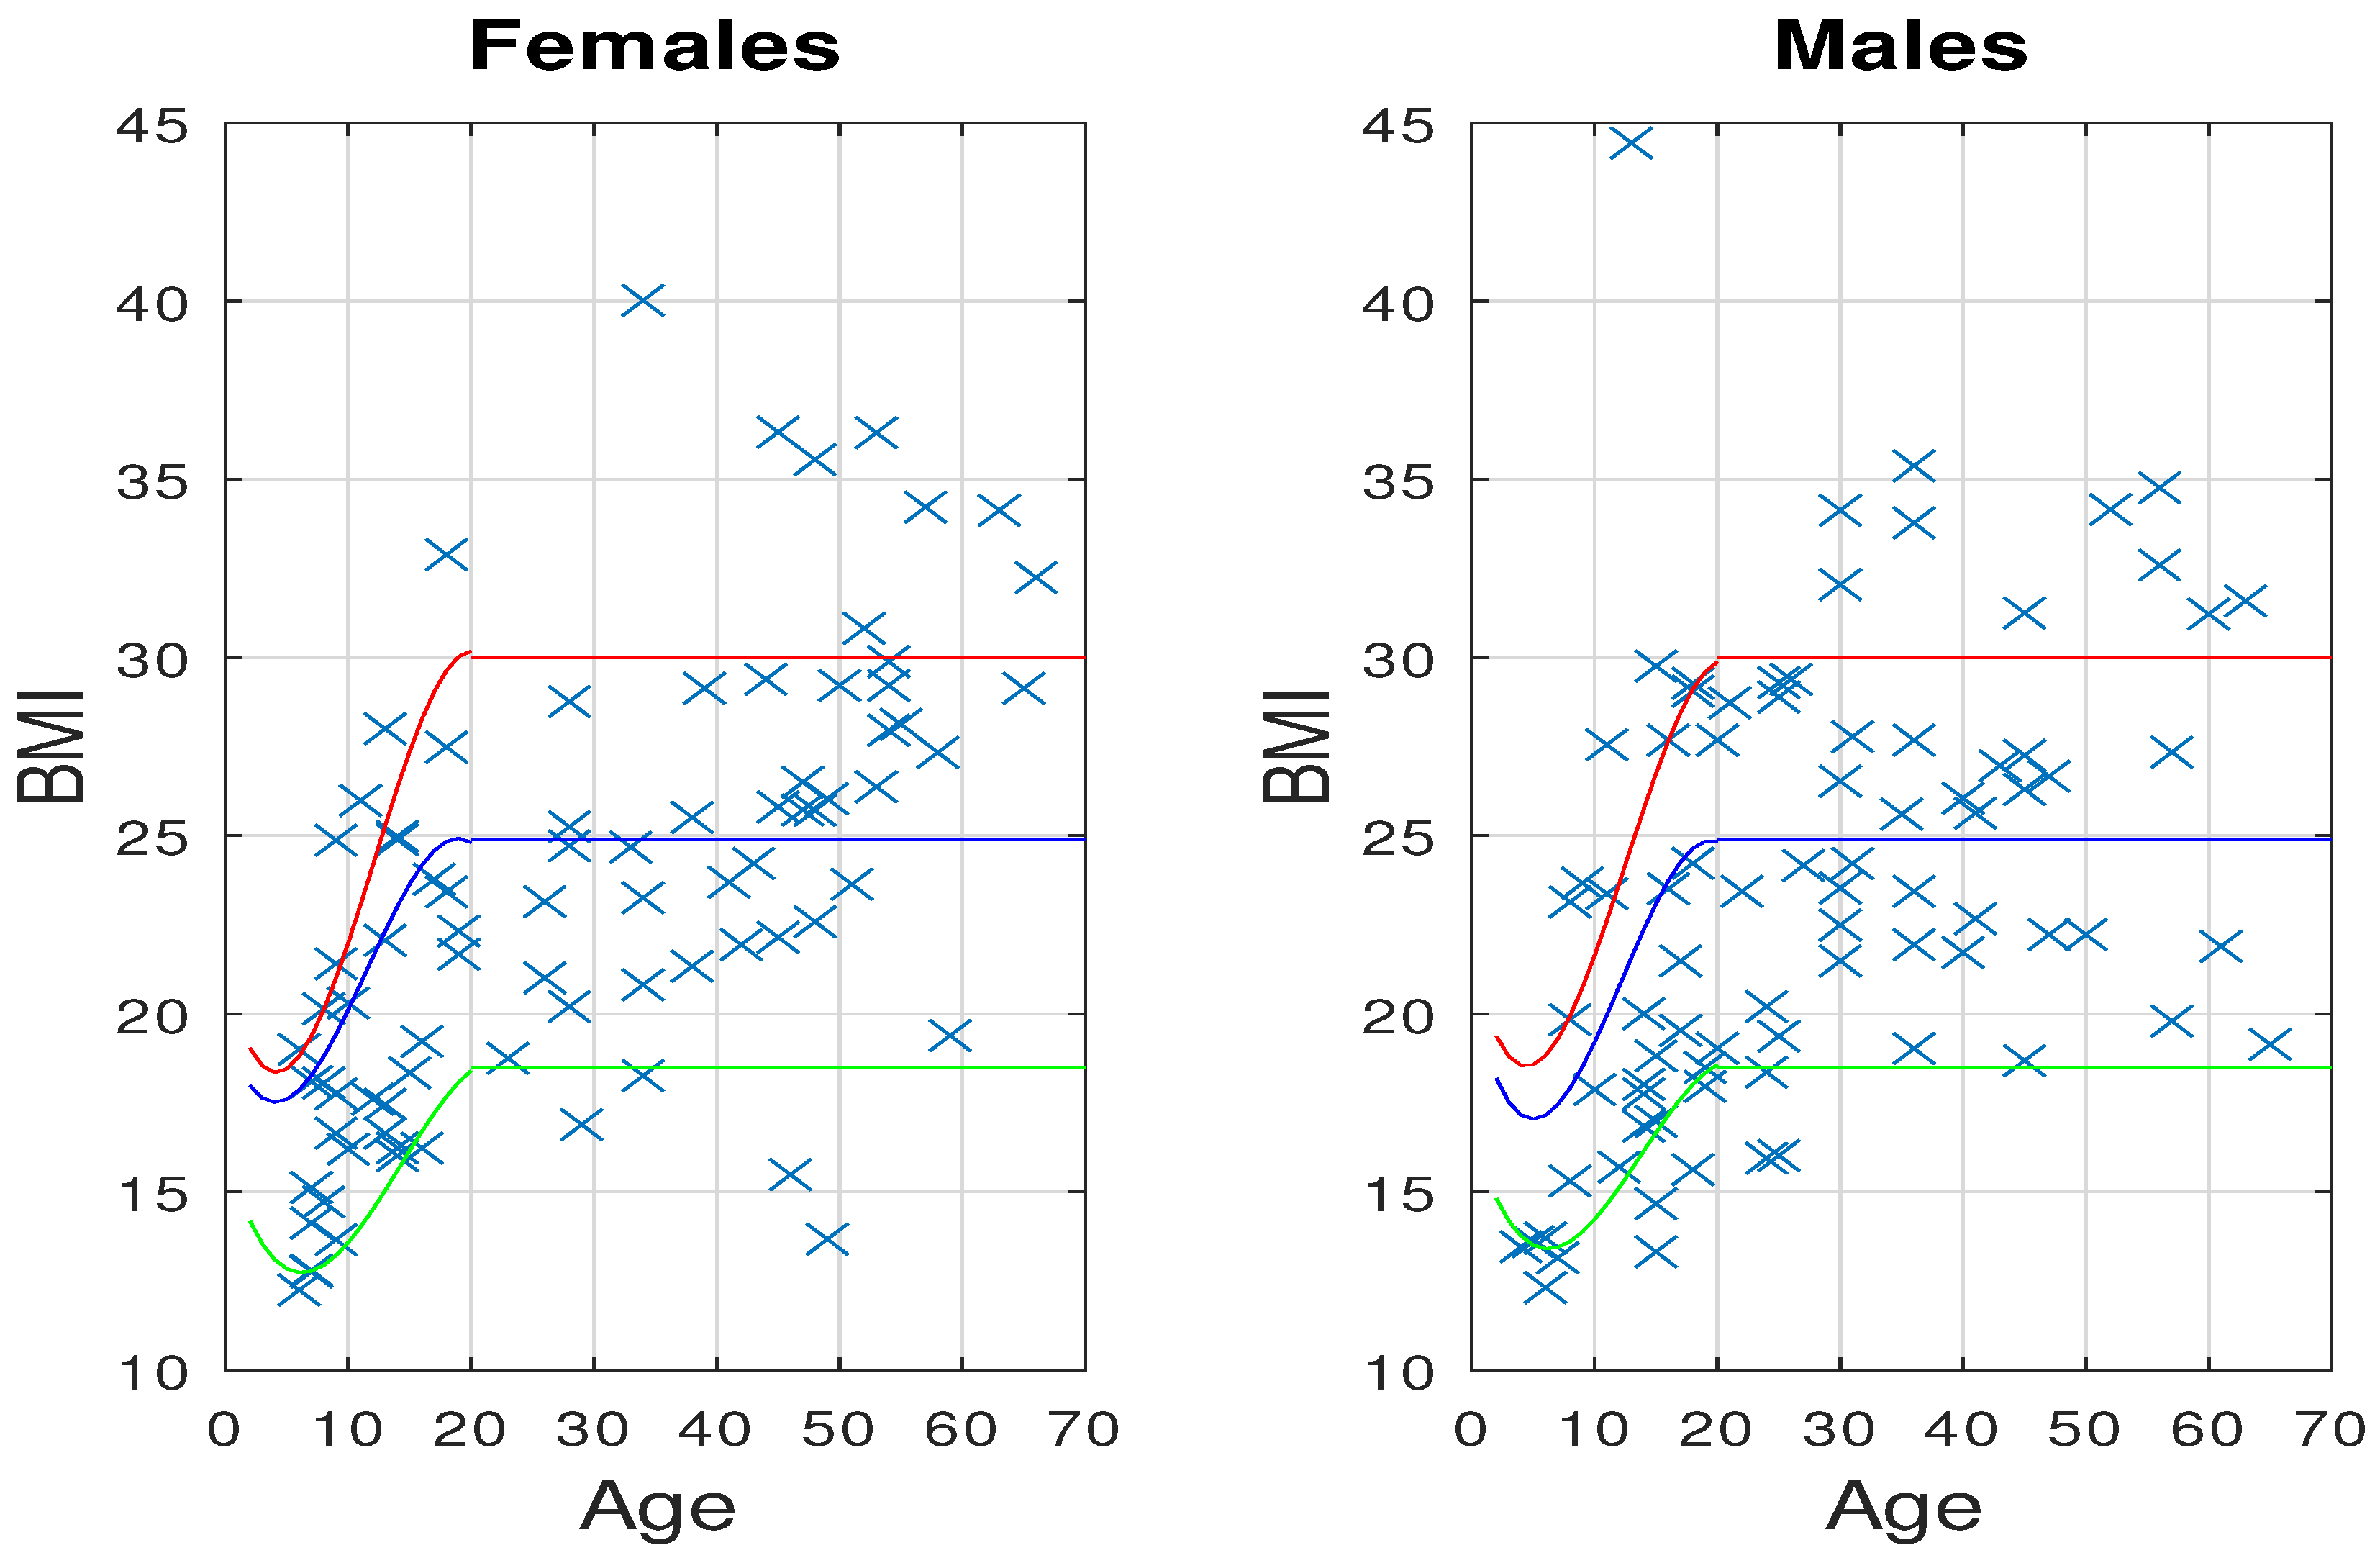
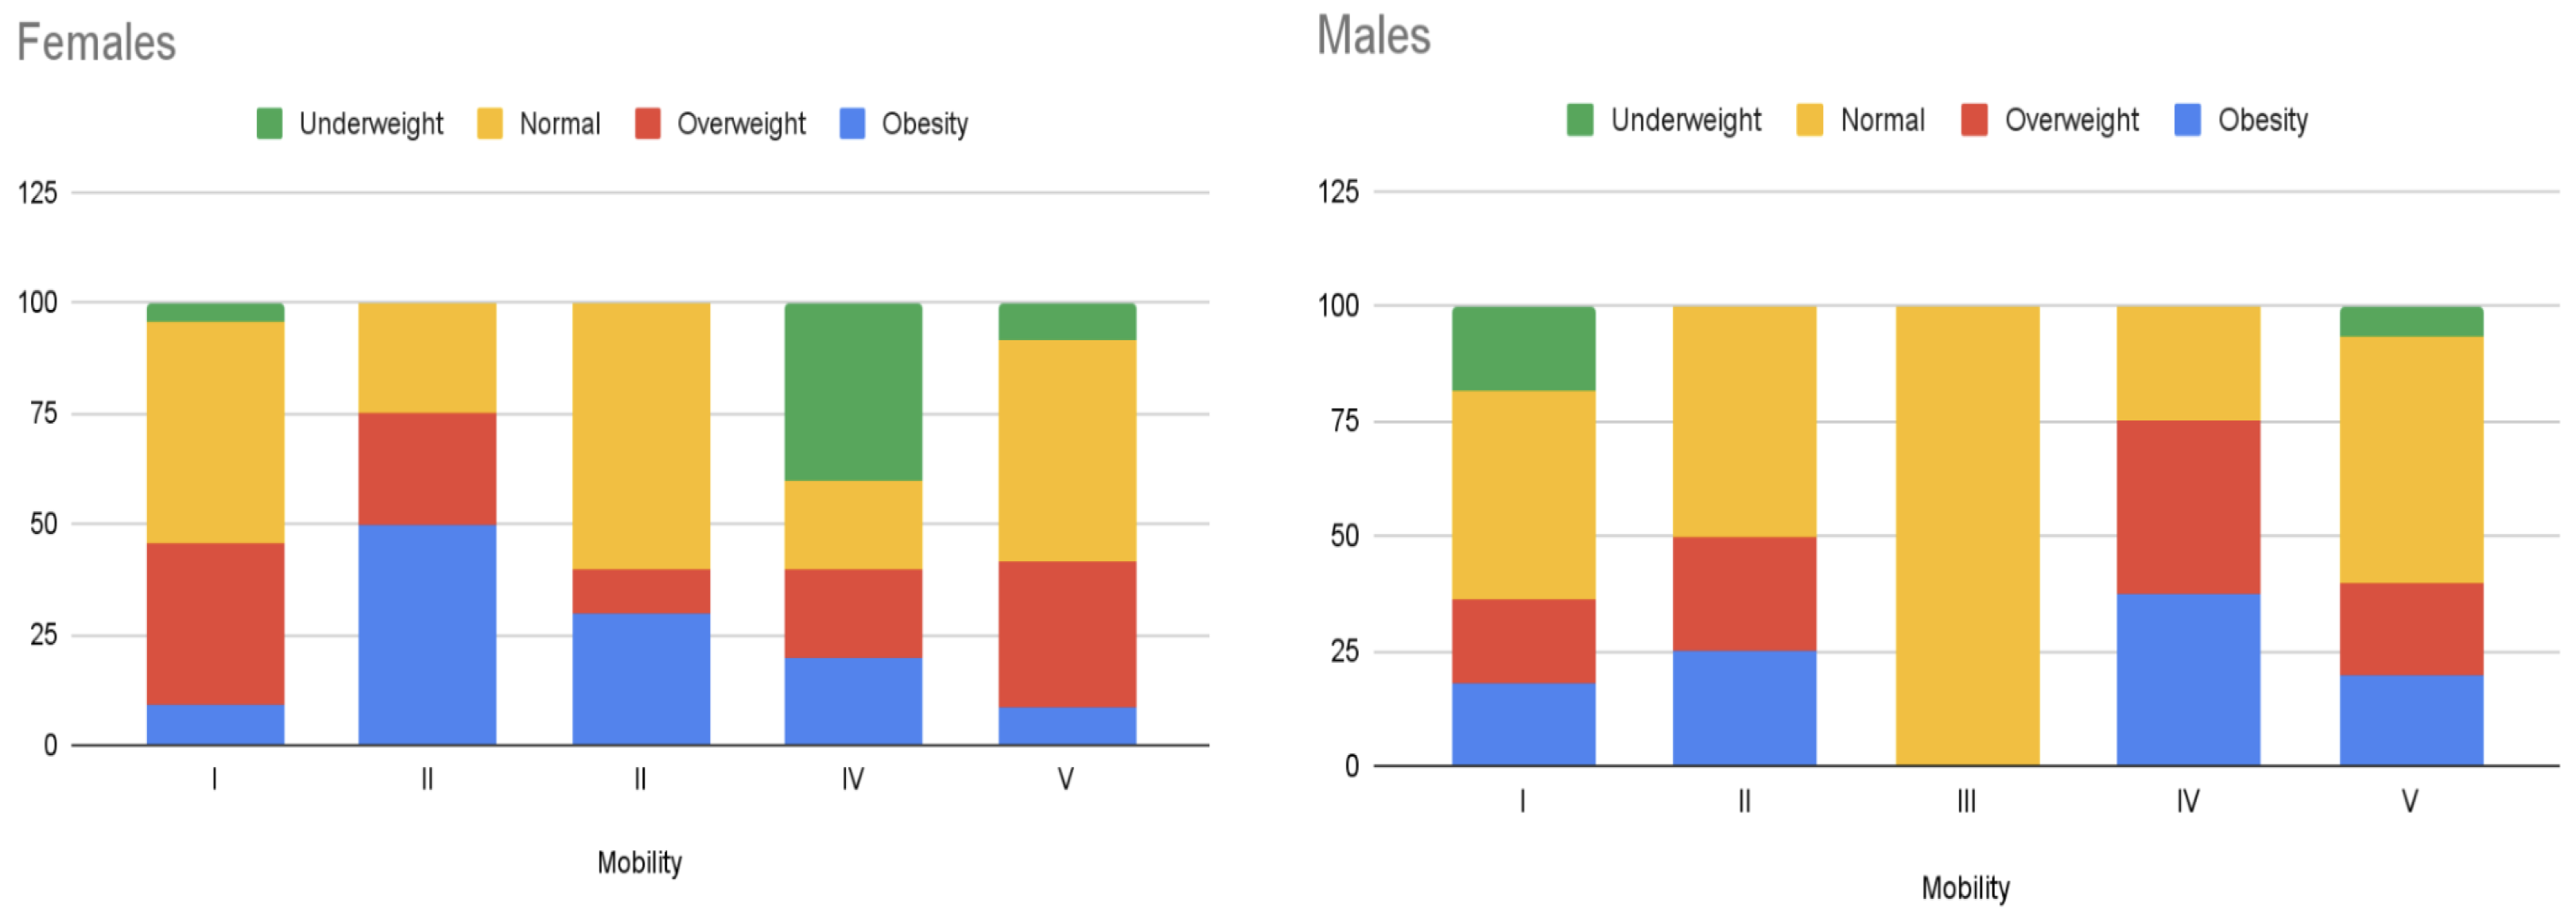
Body Mass Index (BMI)
3.2. Mobility and Communication Skills (Block 2)
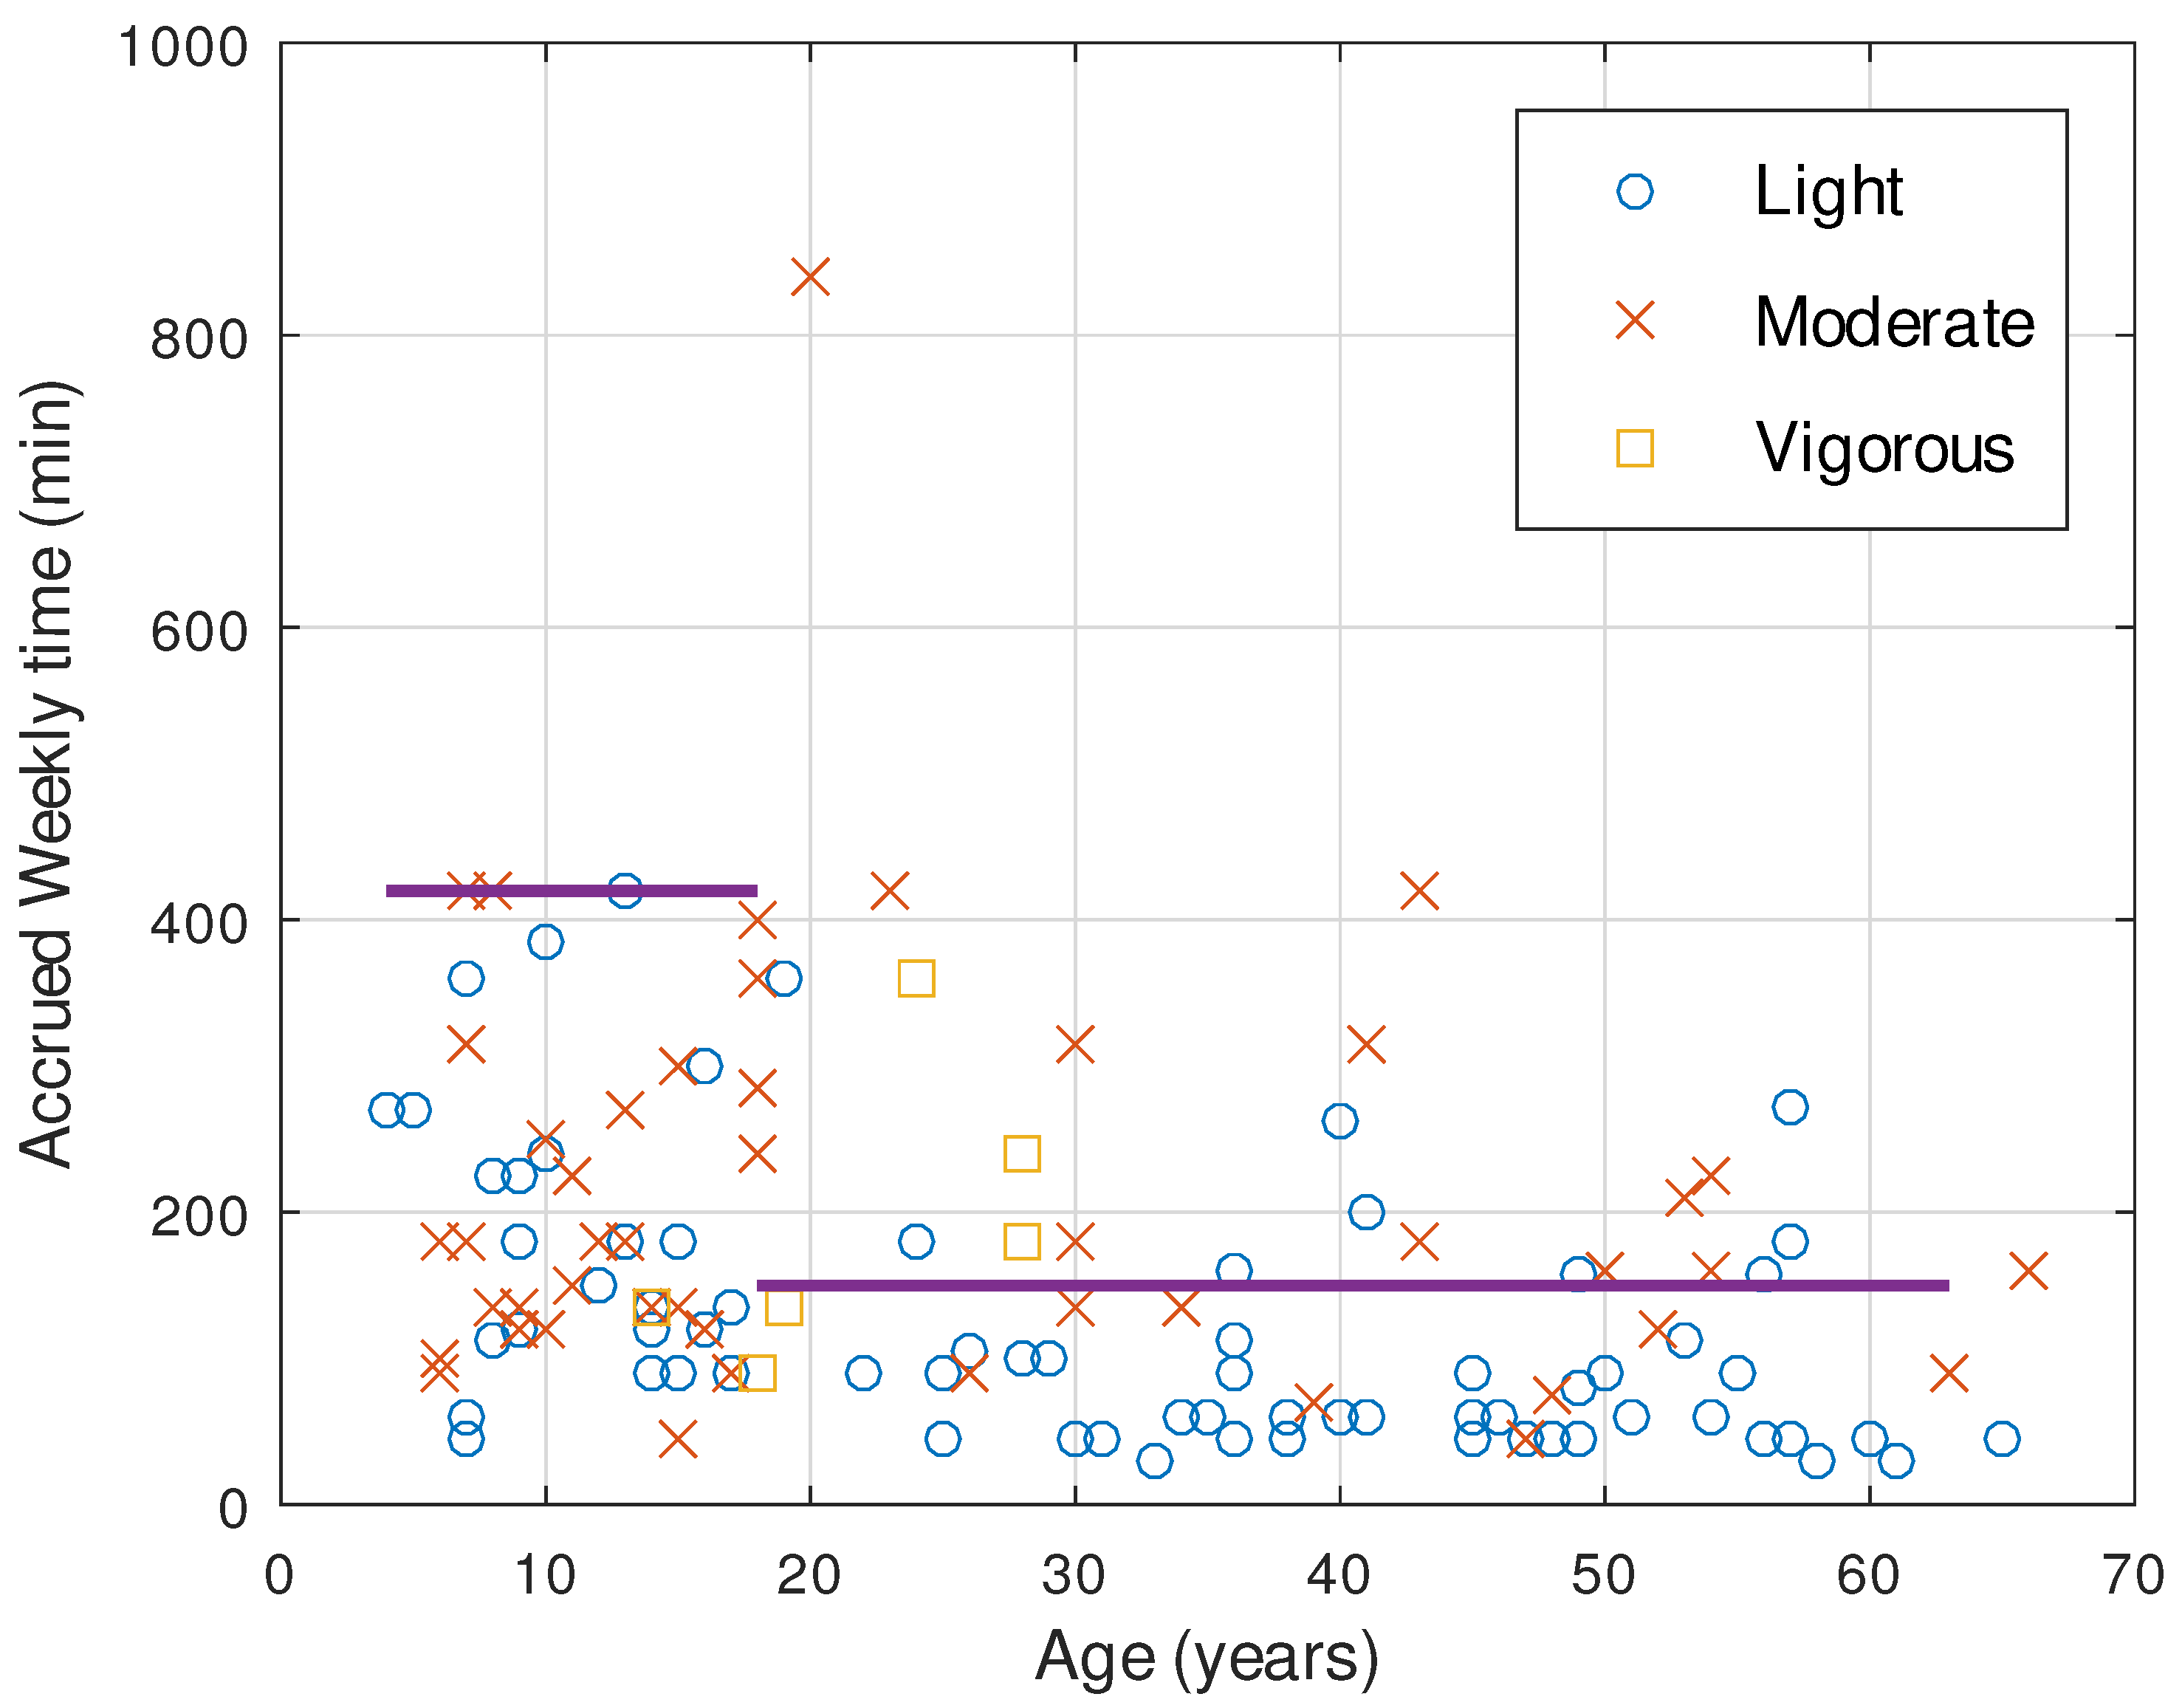
3.3. Physical Activity (Block 3)
- -
- Walking or Trekking in Open Spaces: This is pursued by 59 individuals;
- -
- Aquatic Activities: These involve hydrotherapy or simple swimming and are practiced by 41 participants;
- -
- Adapted Sports: A group of 30 participants partake in sports like boccia, wheelchair basketball, soccer, athletics, martial arts, shooting, and sailing;
- -
- Gym Workouts: 12 individuals frequent the gym, where they often utilize adapted pedals and treadmills;
- -
- Equine Therapy: 8 participants find benefit in equine therapy;
- -
- Dancing: A smaller subset of 3 individuals engage in dancing.
3.4. Other Daily Activities (Block 4)
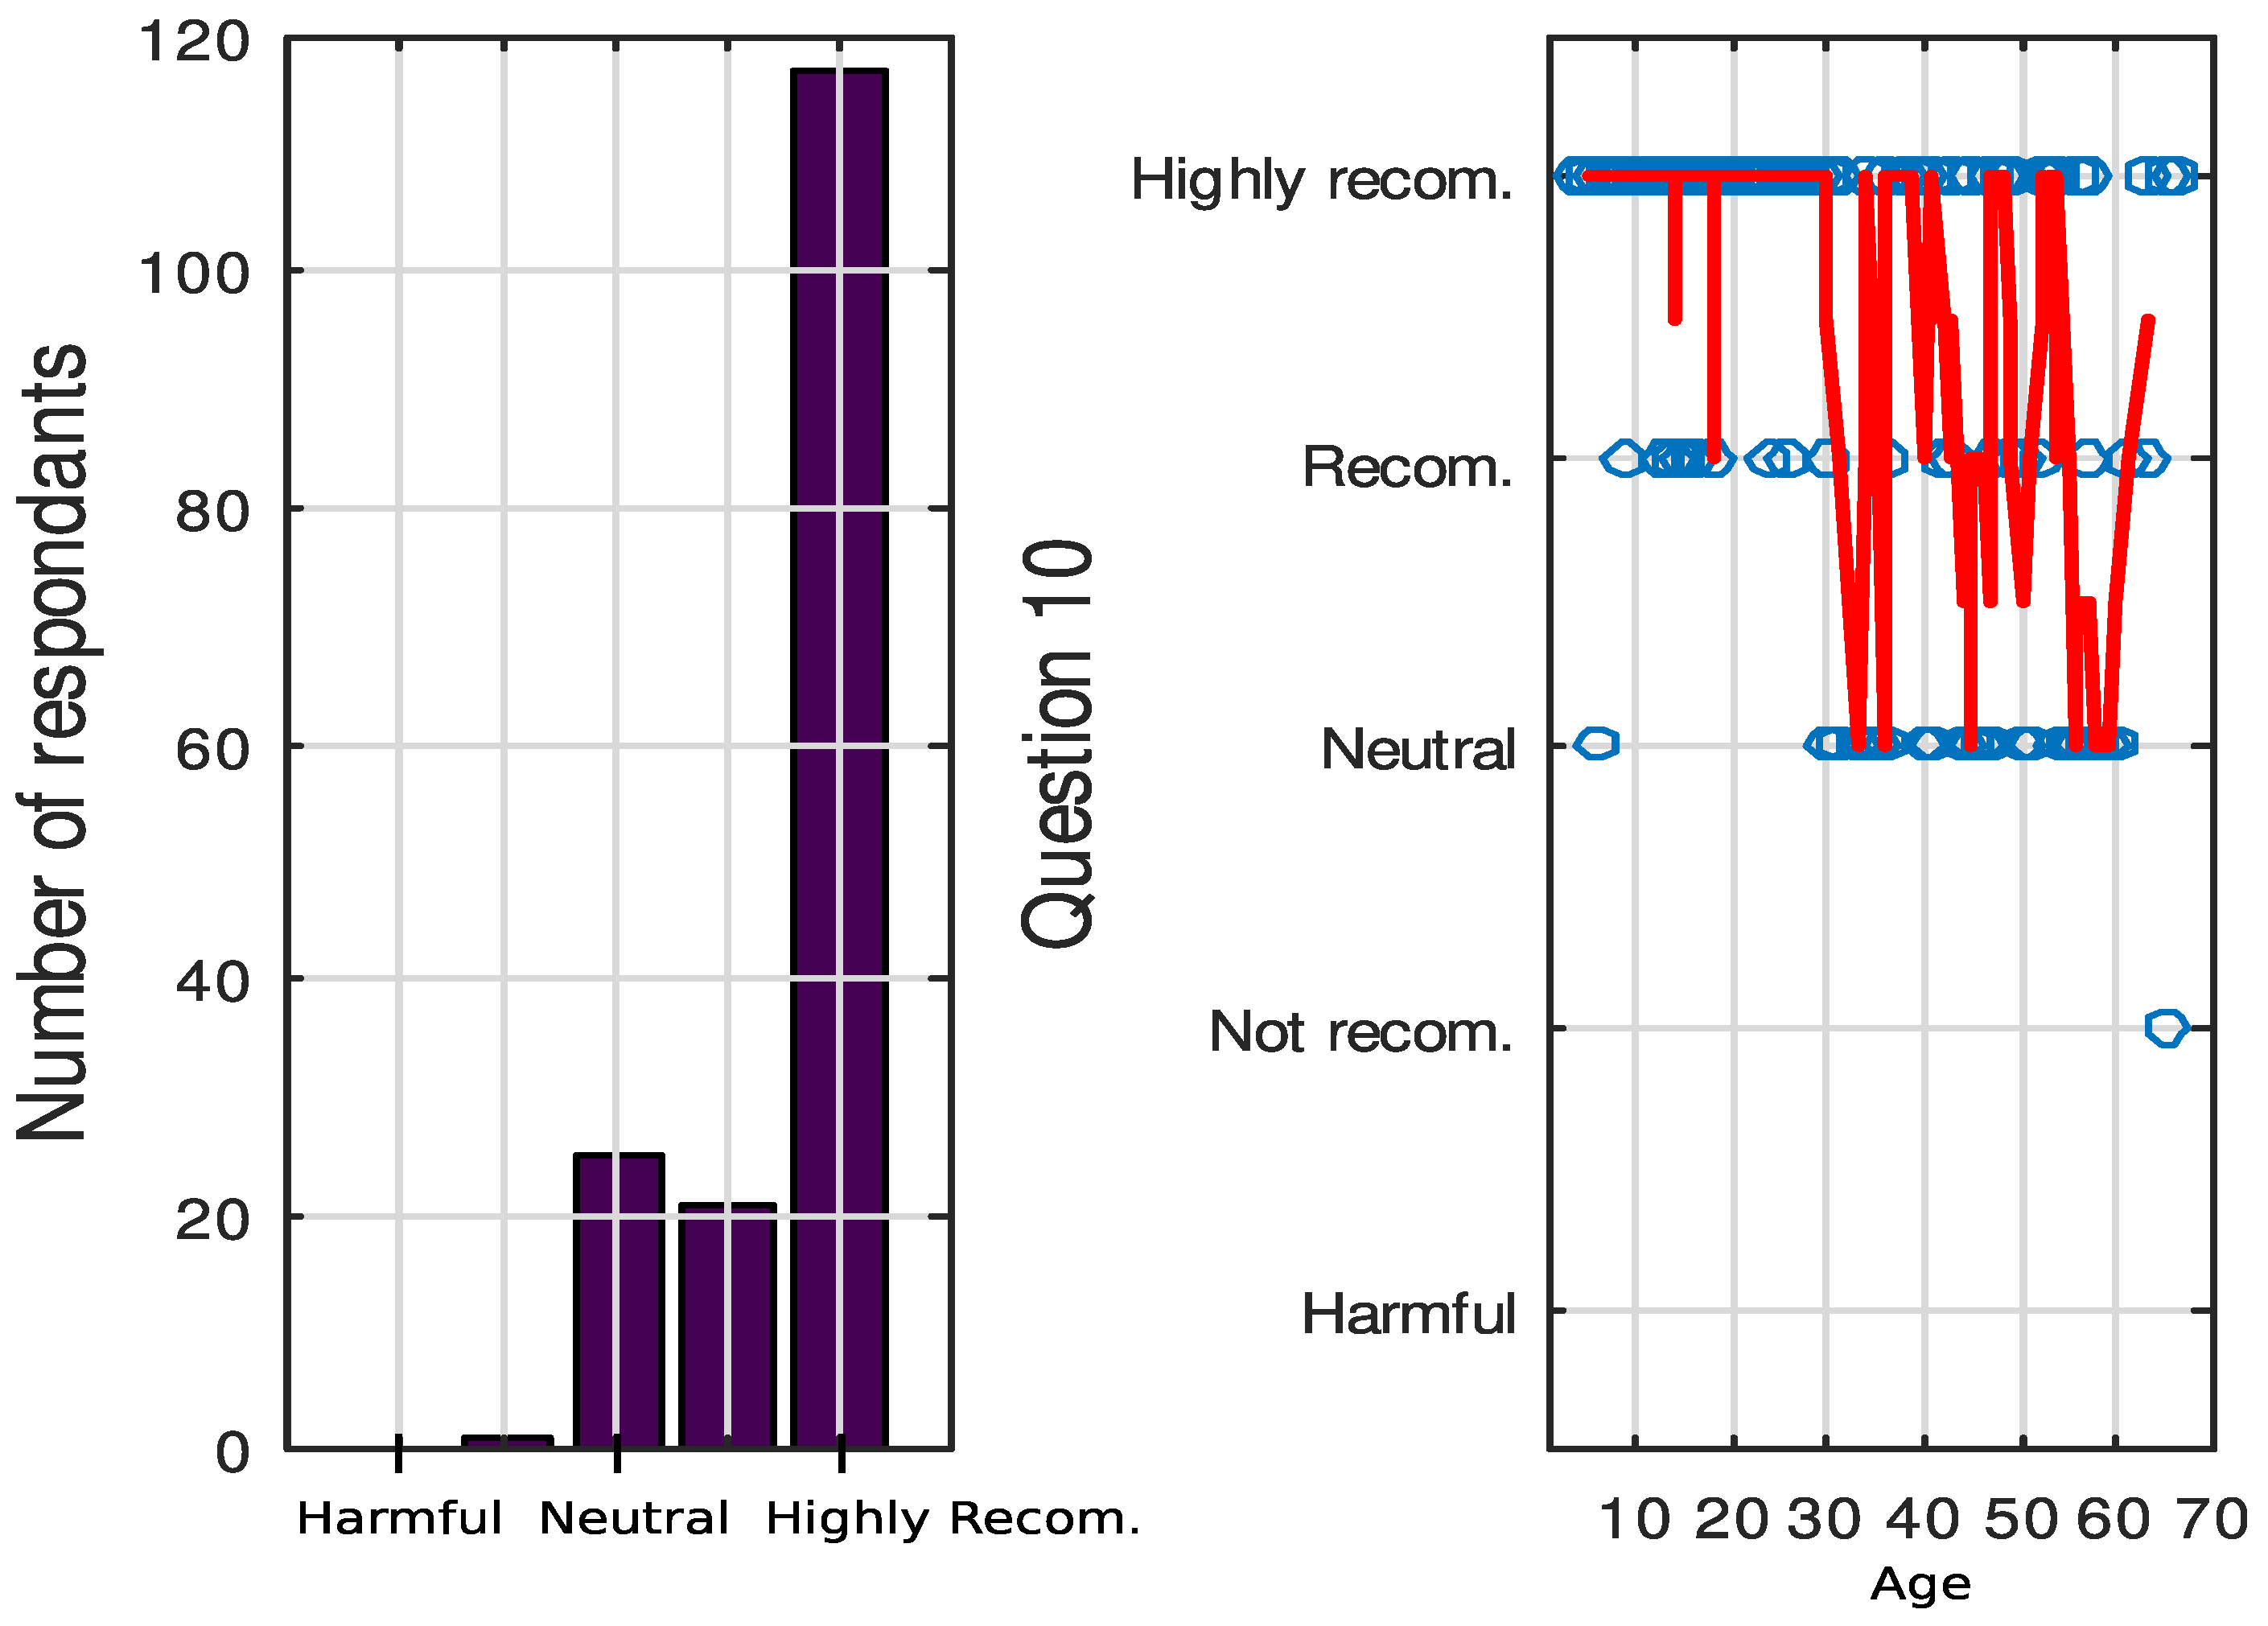
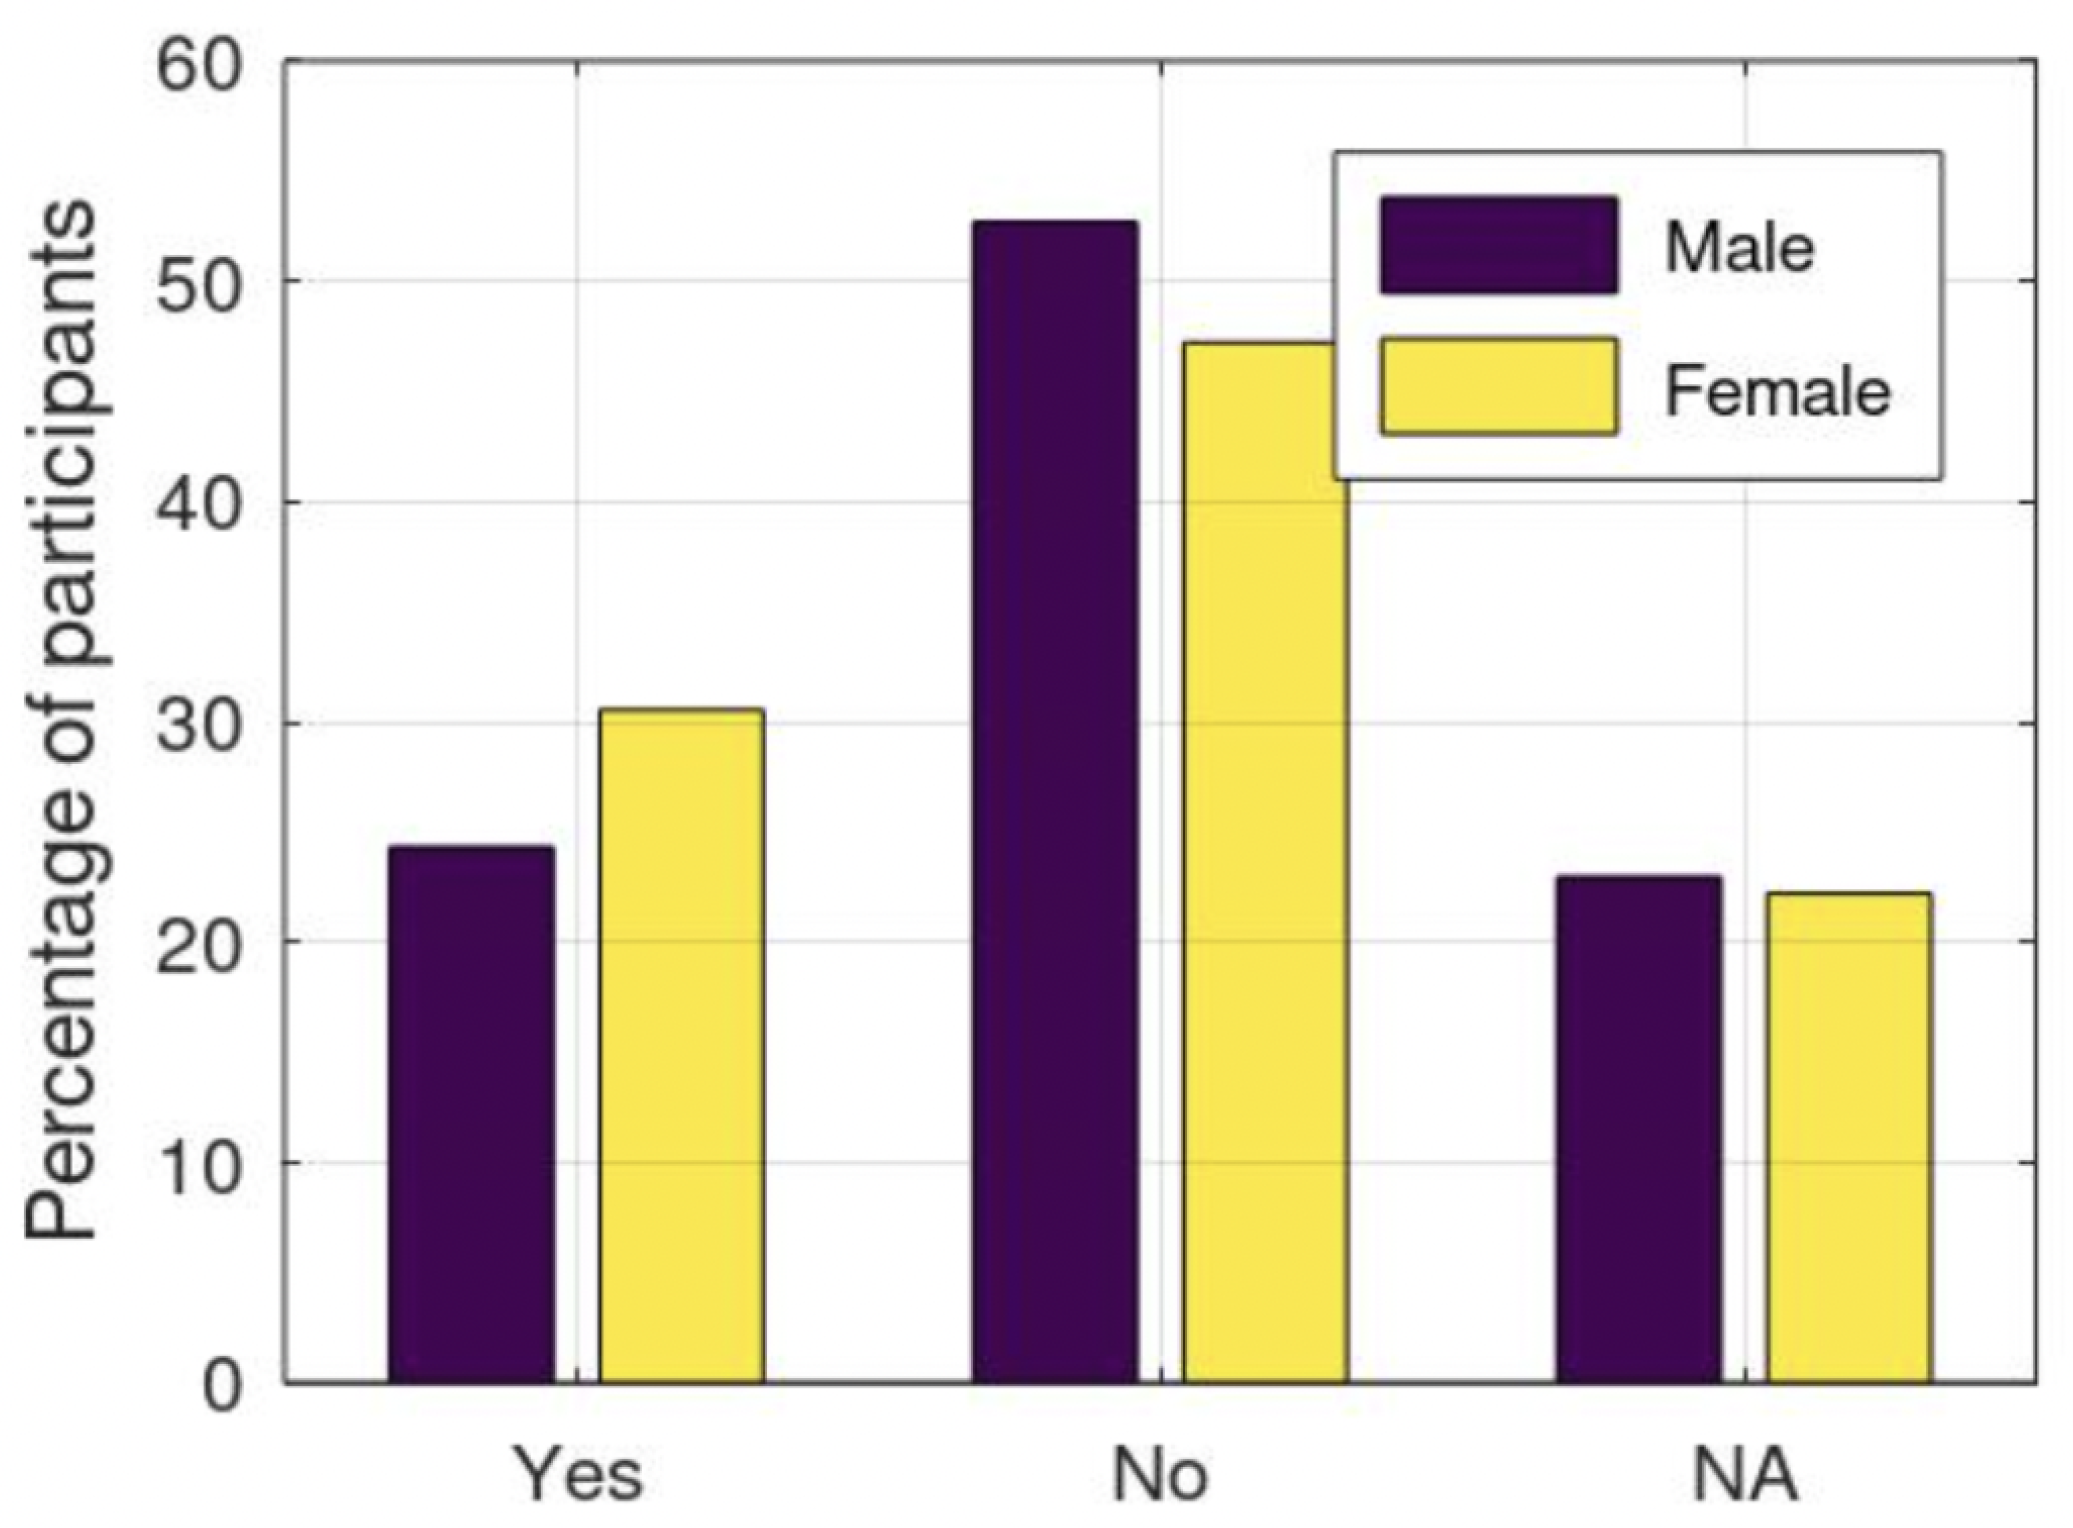
3.5. Personal Beliefs and Preferences (Block 5)
3.6. Assistive Technology, Gadgets, and Applications for Promoting Exercise and Controlling its Intensity (Block 6)
4. Discussion
4.1. BMI Index Dependence on Mobility Level and PA
4.2. Relationship between PA and Mobility Level
4.3. Relationship between PA with Other Variables
4.4. Relationship between Personal Beliefs and Other Variables
4.5. Engagement in PA
4.6. Limitations of the Study
5. Conclusions
Author Contributions
Funding
Institutional Review Board Statement
Informed Consent Statement
Data Availability Statement
Acknowledgments
Conflicts of Interest
Appendix A. Survey Questions

| Block | Question | Text | Options |
|---|---|---|---|
| 1 | Label | ||
| 1 | 2 | Age | |
| 3 | Mass (Kg) | ||
| 4 | Height (cm) | ||
| 5 | Biological sex | ||
| 2 | 6 | Mobility | 1. They can walk at home, outdoors, and in the community. They are able to run and jump, but their balance is limited. 2. They walk in most spaces, but at school/work they use a hand-held assistive device for safety. In outdoor spaces and in the community they use a wheelchair for long distances. They are able to go up and down stairs with a handrail. 3. They walk with the aid of a manual assistive device and use a manual wheelchair or motorized chair at school and in the community. Sometimes they can go up and down stairs with a handrail. 4. They use a wheeled device in most spaces to get around. They need the assistance of one or two people for transfers. Sometimes they can use a motorized chair and walk short distances indoors with the help of a walker. 5. They are transported in a manual wheelchair in all types of spaces. The physical assistance of one or two people or a crane is required for transfers. |
| 7 | Communication | 1. The person understands and makes himself understood by most people and in most environments. Communication occurs easily and at a comfortable pace with familiar and unfamiliar interlocutors. 2. Same as 1 but the pace of conversation is slow. May need more time to understand messages, form messages, and/or repair communication errors with known and unknown interlocutors. 3. The person understands and makes him/herself understood with familiar (but not unfamiliar) interlocutors in most settings. Communication is not consistently effective with unfamiliar interlocutors, but is usually effective with familiar ones. 4. The person: (a) can occasionally understand and be understood effectively, or; (b) can be understood well, but understands to a limited extent, or (c) can understand well, but being understood is very limited. Communication is occasionally effective with familiar interlocutors. 5. The person has limitations in both understanding and being understood by most people and appears to have limited comprehension of messages. Communication is rarely effective even with familiar interlocutors. | |
| 8 | Do you use any assistive device or augmentative and alternative communication system (AACS)? | 1. Yes 2. No | |
| 9 | If you answered “Yes” in the previous question, please indicate which one you use | ||
| 5 | 10 | Indicate whether you think it is advisable to practice physical activity in people with reduced mobility. | 1. It is harmful in my situation 2. Not recommended 3. NS/NC 4. Recommended 5. Highly recommended |
| 3 | 11 | Do you practice any type of physical activity frequently? | 1. Yes 2. No |
| 5 | 12 | What are the main difficulties in exercising or increasing the frequency of exercise? | - Physical barriers in the environment. - Lack of resources for sports practice near my residence. - Not having the appropriate adapted sports equipment - Lack of information or advice - Lack of support from family members - Personal disinterest, in general - Other reasons |
| 13 | What would you need to do to increase exercise or physical activity? | ||
| 4 | 14 | How many hours a week do you usually spend reading, watching TV, using the computer or doing crafts? | |
| 15 | If applicable, how many hours per week do you spend walking or riding in the wheelchair (pushed by you)? | ||
| 16 | If applicable, how many hours a week do you spend doing house tasks such as washing dishes, dusting, or sweeping the floor? | ||
| - | 17 | It is not necessary to continue with the questionnaire if in question 11 (Do you practice any type of physical activity frequently?) you answered NO. | |
| 3 | 18 | Indicate the type of physical activity you usually do: walking, sports, rehabilitation, etc. | |
| 19 | If you exercise regularly, either as part of a rehabilitation program or as a personal choice, assess your motivation. | 1. I do not like it at all 2. I do not like it very much 3. I do not care 4. I like it 5. I like it a lot | |
| 20 | Indicate how many times per week you perform the activity. | ||
| 21 | How long does a session last on average? | ||
| 22 | Choose the intensity of the exercise or physical activity. | 1. Light activity 2. Moderate activity: Your breathing speeds up, but you do not get out of breath. You sweat after about 10 min of activity. You can follow a conversation 3. Intense activity: Your breathing is deep and fast; you sweat after a few minutes of activity. minutes of activity; you cannot talk without pausing to breathe. | |
| 23 | Where do you usually do most of your exercise or physical activity? | - At home - In open spaces - In specialized centers (gymnasium) - At the association’s center (e.g., ASPACE) | |
| 24 | Indicate other places where you also exercise or do physical activity (List in order of most to least frequency. Example: In swimming pool, gym, etc.) | ||
| 25 | What is the purpose of physical activity? | - Rehabilitation - Personal choice - Both | |
| 26 | Have any health personnel recommended exercise or physical activity to you? | 1. Yes 2. No | |
| 5 | 27 | Do you think you are less motivated to be physically active or exercise now than you were in previous years or when you were a teenager or child? (Please answer if applicable, this question is more oriented to adults) | 1. Yes 2. No |
| 28 | If you checked yes in the previous question, please indicate some reasons why | ||
| 6 | 29 | Do you use any assistive device for physical activity? | 1. Yes 2. No |
| 30 | If you checked yes in the previous question, please indicate which ones. | ||
| 31 | Do you use any software/application to help you monitor or promote physical activity? | 1. Yes 2. No | |
| 32 | If you checked yes in the previous question, please indicate which ones. | ||
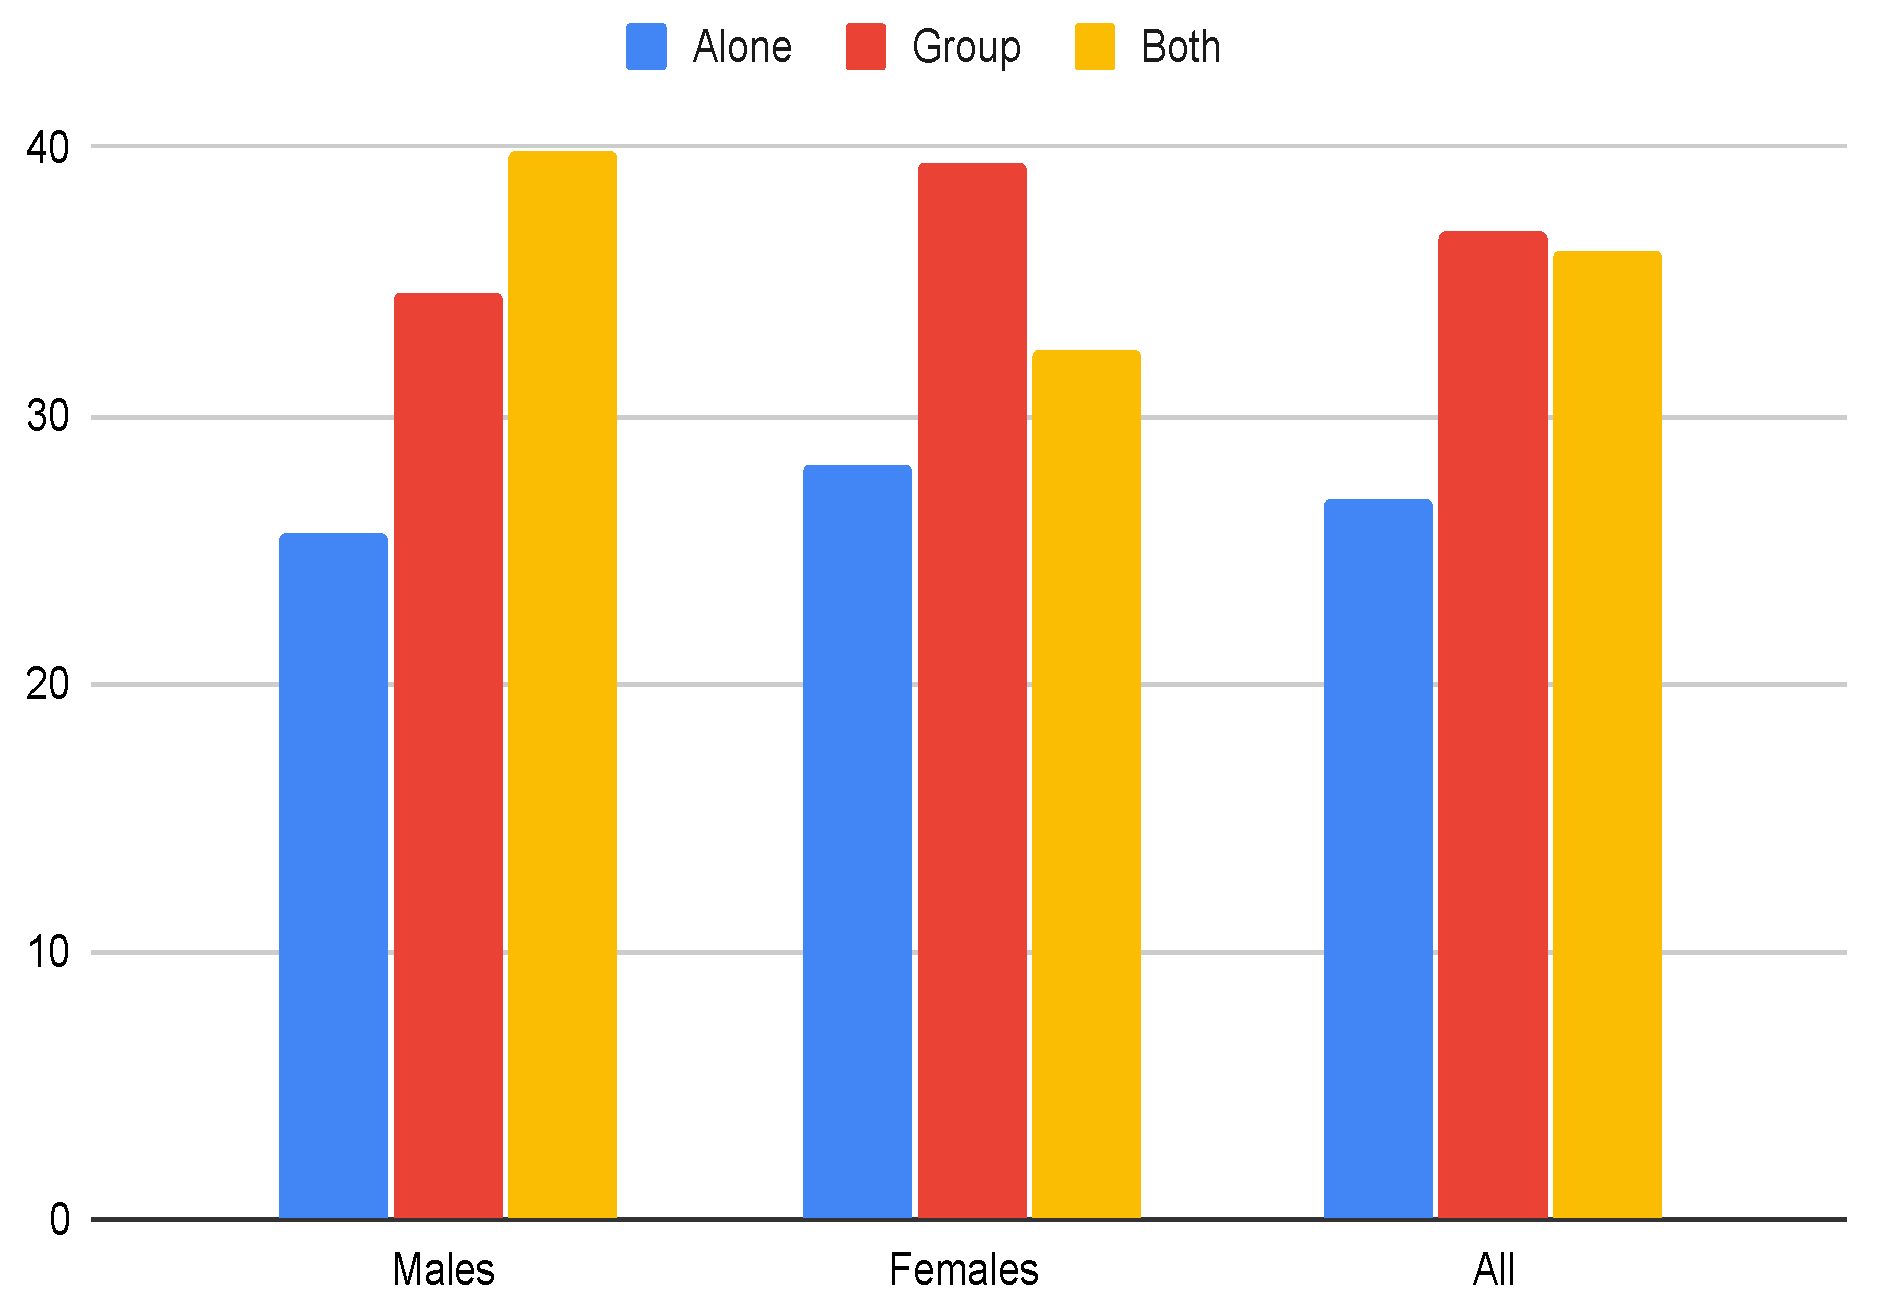
| 5 | 33 | How do you prefer to be physically active? (Group activity would include playing sports such as boccia, wheelchair basketball, etc.) | 1. Alone 2. Group 3. Both |
| 34 | What kind of activities that take place in your association’s center do you think could increase your motivation to PA? | ||
| 35 | Do you think that your exercise or physical activity practice may be conditioned by your communication skills or support systems? | 1. Yes 2. No 3. NA | |
| 6 | 36 | Would you find it convenient to wear a device such as a watch, bracelet, or belt that allows you to “monitor” your physical activity or exercise? (e.g., to count your steps or measure your heart rate)? | 1. Yes 2. No 3. NA |
References
- Bull, F.C.; Al-Ansari, S.S.; Biddle, S.; Borodulin, K.; Buman, M.P.; Cardon, G.; Carty, C.; Chaput, J.P.; Chastin, S.; Chou, R.; et al. World Health Organization 2020 guidelines on physical activity and sedentary behaviour. Br. J. Sport. Med. 2020, 54, 1451–1462. [Google Scholar] [CrossRef]
- Satonaka, A.; Suzuki, N. Aerobic fitness and lifestyle with non-exercise physical activity in adults with cerebral palsy. J. Phys. Fit. Sport. Med. 2018, 7, 1–7. [Google Scholar] [CrossRef]
- WHO. A Guide for Population-Based Approaches to Increasing Levels of Physical Activity: Implementation of the WHO Global Strategy on Diet, Physical Activity and Health; World Health Organization: Geneva, Switzerland, 2007; pp. 1–20. [Google Scholar]
- Clutterbuck, G.; Auld, M.; Johnston, L. Active exercise interventions improve gross motor function of ambulant/semi-ambulant children with cerebral palsy: A systematic review. Disabil. Rehabil. 2019, 41, 1131–1151. [Google Scholar] [CrossRef]
- Caspersen, C.J.; Powell, K.E.; Christenson, G.M. Physical activity, exercise, and physical fitness: Definitions and distinctions for health-related research. Public Health Rep. 1985, 100, 126–131. [Google Scholar]
- Ryan, J.M.; Cassidy, E.E.; Noorduyn, S.G.; O’Connell, N.E. Exercise interventions for cerebral palsy. Cochrane Database Syst. Rev. 2017, 2017, 1–200. [Google Scholar] [CrossRef]
- Samsir, M.S.; Zakaria, R.; Razak, S.A.; Ismail, M.S.; Rahim, M.Z.A.; Lin, C.S.; Osman, N.M.F.N.; Asri, M.A.; Mohd, N.H.; Ahmad, A.H. Six months guided exercise therapy improves motor abilities and white matter connectivity in children with cerebral palsy. Malays. J. Med Sci. 2020, 27, 90–100. [Google Scholar] [CrossRef] [PubMed]
- Bar-Haim, S.; Aviram, R.; Rabani, A.S.; Amro, A.; Nammourah, I.; Al-Jarrah, M.; Raanan, Y.; Loeppky, J.A.; Harries, N. Effects of exercise interventions on habitual physical activity and sedentary behavior in adolescents with cerebral palsy. Pediatr. Exerc. Sci. 2019, 31, 416–424. [Google Scholar] [CrossRef] [PubMed]
- Liang, X.; Tan, Z.; Yun, G.; Cao, J.; Wang, J.; Liu, Q.; Chen, T. Effectiveness of exercise interventions for children with cerebral palsy: A systematic review and meta-analysis of randomized controlled trials. J. Rehabil. Med. 2021, 53, 2733. [Google Scholar] [CrossRef] [PubMed]
- Chen, Y.; Fanchiang, H.; Howard, A. Effectiveness of virtual reality in children with cerebral palsy: A systematic review and meta-analysis of randomized controlled trials. Phys. Ther. 2017, 98, 63–77. [Google Scholar] [CrossRef] [PubMed]
- Adar, S.; Dündar, Ü.; Demirdal, Ü.S.; Ulaşlı, A.M.; Toktaş, H.; Solak, Ö. The effect of aquatic exercise on spasticity, quality of life, and motor function in cerebral palsy. Turk. J. Phys. Med. Rehabil. 2017, 63, 239–248. [Google Scholar] [CrossRef] [PubMed]
- Reddy, S.; Balaji, G.K. Dynamic surface exercise training in improving trunk control and gross motor functions among children with quadriplegic cerebral palsy: A single center, randomized controlled trial. J. Pediatr. Neurosci. 2020, 15, 214–219. [Google Scholar]
- Fujimoto, J.; Umemoto, Y.; Koike, Y.; Isida, K.; Sakamoto, K.; Tajima, F. Immediate effects of short period lower limb ergometer exercise in adolescent and young adult patients with cerebral palsy and spastic diplegia. J. Phys. Ther. Sci. 2021, 33, 52–56. [Google Scholar] [CrossRef]
- Verschuren, O.; Peterson, M.D.; Balemans, A.C.; Hurvitz, E.A. Exercise and physical activity recommendations for people with cerebral palsy. Dev. Med. Child Neurol. 2016, 58, 798–808. [Google Scholar] [CrossRef]
- Slaman, J.; Roebroeck, M.; van der Slot, W.; Twisk, J.; Wensink, A.; Stam, H.; van den Berg-Emons, R.; LEARN 2 MOVE Research Group. Can a lifestyle intervention improve physical fitness in adolescents and young adults with spastic cerebral palsy? A randomized controlled trial. Arch. Phys. Med. Rehabil. 2014, 95, 1646–1655. [Google Scholar] [CrossRef] [PubMed]
- Tran, D.L.; Kamaladasa, Y.; Munoz, P.A.; Kotchetkova, I.; D’Souza, M.; Celermajer, D.S.; Maiorana, A.; Cordina, R. Estimating exercise intensity using heart rate in adolescents and adults with congenital heart disease: Are established methods valid? Int. J. Cardiol. Congenit. Heart Dis. 2022, 8, 100362. [Google Scholar] [CrossRef]
- Stricker, P.R.; Faigenbaum, A.D.; McCambridge, T.M.; LaBella, C.R.; Brooks, M.A.; Canty, G.; Diamond, A.B.; Hennrikus, W.; Logan, K.; Moffatt, K.; et al. Resistance training for children and adolescents. Pediatrics 2020, 145, e20201011. [Google Scholar] [CrossRef] [PubMed]
- Myers, A.M.; Beam, N.W.; Fakhoury, J.D. Resistance training for children and adolescents. Transl. Pediatr. 2017, 6, 137. [Google Scholar] [CrossRef] [PubMed]
- Kim, B.J. Effects of group exercise program on the health condition and quality of life in adults with cerebral palsy. J. Int. Acad. Phys. Ther. Res. 2018, 9, 1549–1557. [Google Scholar] [CrossRef]
- Gannotti, M.E.; Liquori, B.M.; Thorpe, D.E.; Fuchs, R.K. Designing exercise to improve bone health among individuals with cerebral palsy. Pediatr. Phys. Ther. 2021, 33, 50–56. [Google Scholar] [CrossRef]
- Kim, B.J.; Kim, S.M.; Kwon, H.Y. The effect of group exercise program on the self-efficacy and activities of daily living in adults with cerebral palsy. J. Phys. Ther. Sci. 2017, 29, 2184–2189. [Google Scholar] [CrossRef]
- Qi, Y.C.; Niu, X.L.; Gao, Y.R.; Wang, H.b.; Hu, M.; Dong, L.P.; Li, Y.Z. Therapeutic effect evaluation of neuromuscular electrical stimulation with or without strengthening exercise on spastic cerebral palsy. Clin. Pediatr. 2018, 57, 580–583. [Google Scholar] [CrossRef]
- Armstrong, E.L.; Boyd, R.N.; Kentish, M.J.; Carty, C.P.; Horan, S.A. Effects of a training programme of functional electrical stimulation (FES) powered cycling, recreational cycling and goal-directed exercise training on children with cerebral palsy: A randomised controlled trial protocol. Br. Med. J. Open 2019, 9, e024881. [Google Scholar] [CrossRef]
- Ahmadizadeh, Z.; Amozade Khalili, M.; Simin Ghalam, M.; Mokhlesin, M. Effect of whole body vibration with stretching exercise on active and passive range of motion in lower extremities in children with cerebral palsy: A randomized clinical trial. Iran. J. Pediatr. 2019, 29, e84436. [Google Scholar] [CrossRef]
- Kotrlik, J.; Higgins, C. Organizational research: Determining appropriate sample size in survey research appropriate sample size in survey research. Inf. Technol. Learn. Perform. J. 2001, 19, 43. [Google Scholar]
- Rosenbaum, P.L.; Palisano, R.J.; Bartlett, D.J.; Galuppi, B.E.; Russell, D.J. Development of the gross motor function classification system for cerebral palsy. Dev. Med. Child Neurol. 2008, 50, 249–253. [Google Scholar] [CrossRef]
- Hidecker, M.J.C.; Paneth, N.; Rosenbaum, P.L.; Kent, R.D.; Lillie, J.; Eulenberg, J.B.; Chester, K., Jr.; Johnson, B.; Michalsen, L.; Evatt, M.; et al. Developing and validating the Communication Function Classification System for individuals with cerebral palsy. Dev. Med. Child Neurol. 2011, 53, 704–710. [Google Scholar] [CrossRef]
- Nuttall, F.Q. Body mass index: Obesity, BMI, and health: A critical review. Nutr. Today 2015, 50, 117. [Google Scholar] [CrossRef] [PubMed]
- Berrigan, D.; Troiano, R.P.; Graubard, B.I. BMI and mortality: The limits of epidemiological evidence. Lancet 2016, 388, 734–736. [Google Scholar] [CrossRef]
- Tremblay, M.S.; Aubert, S.; Barnes, J.D.; Saunders, T.J.; Carson, V.; Latimer-Cheung, A.E.; Chastin, S.F.; Altenburg, T.M.; Chinapaw, M.J. Sedentary behavior research network (SBRN)–terminology consensus project process and outcome. Int. J. Behav. Nutr. Phys. Act. 2017, 14, 1–17. [Google Scholar] [CrossRef]
- Whitney, D.G.; Gross-Richmond, P.; Hurvitz, E.A.; Peterson, M.D. Total and regional body fat status among children and young people with cerebral palsy: A scoping review. Clin. Obes. 2019, 9, e12327. [Google Scholar] [CrossRef] [PubMed]
- Whitney, D.G.; Singh, H.; Zhang, C.; Miller, F.; Modlesky, C.M. Greater visceral fat but no difference in measures of total body fat in ambulatory children with spastic cerebral palsy compared to typically developing children. J. Clin. Densitom. 2020, 23, 459–464. [Google Scholar] [CrossRef]
- Carlon, S.L.; Taylor, N.F.; Dodd, K.J.; Shields, N. Differences in habitual physical activity levels of young people with cerebral palsy and their typically developing peers: A systematic review. Disabil. Rehabil. 2013, 35, 647–655. [Google Scholar] [CrossRef]
- Palisano, R.; Rosenbaum, P.; Walter, S.; Russell, D.; Wood, E.; Galuppi, B. Development and reliability of a system to classify gross motor function in children with cerebral palsy. Dev. Med. Child Neurol. 1997, 39, 214–223. [Google Scholar] [CrossRef]
- Molina-Cantero, A.J.; Merino-Monge, M.; Castro-García, J.A.; Pousada-García, T.; Valenzuela-Muñoz, D.; Gutiérrez-Párraga, J.; López-Álvarez, S.; Gómez-González, I.M. A study on physical exercise and general mobility in people with cerebral palsy: Health through costless routines. Int. J. Environ. Res. Public Health 2021, 18, 9179. [Google Scholar] [CrossRef]
- Katzmarzyk, P.T.; Church, T.S.; Craig, C.L.; Bouchard, C. Sitting time and mortality from all causes, cardiovascular disease, and cancer. Med. Sci. Sport. Exerc. 2009, 41, 998–1005. [Google Scholar] [CrossRef]
- Smati, S.; Pouliot-Laforte, A.; Chevalier, M.; Lemay, M.; Ballaz, L. Effect of power training on locomotion capacities in children with cerebral palsy with GMFCS level III–IV. Disabil. Rehabil. 2023, 45, 2329–2335. [Google Scholar] [CrossRef]
- Healy, G.N.; Dunstan, D.W.; Salmon, J.; Cerin, E.; Shaw, J.E.; Zimmet, P.Z.; Owen, N. Breaks in sedentary time: Beneficial associations with metabolic risk. Diabetes Care 2008, 31, 661–666. [Google Scholar] [CrossRef] [PubMed]
- Peddie, M.C.; Bone, J.L.; Rehrer, N.J.; Skeaff, C.M.; Gray, A.R.; Perry, T.L. Breaking prolonged sitting reduces postprandial glycemia in healthy, normal-weight adults: A randomized crossover trial. Am. J. Clin. Nutr. 2013, 98, 358–366. [Google Scholar] [CrossRef] [PubMed]
- Katzmarzyk, P.T. Physical activity, sedentary behavior, and health: Paradigm paralysis or paradigm shift? Diabetes 2010, 59, 2717–2725. [Google Scholar] [CrossRef] [PubMed]
- Hsu, C.W.; Kang, Y.N.; Tseng, S.H. Effects of therapeutic exercise intensity on cerebral palsy outcomes: A systematic review with meta-regression of randomized clinical trials. Front. Neurol. 2019, 10, 1–9. [Google Scholar] [CrossRef] [PubMed]
- Cleary, S.L.; Taylor, N.F.; Dodd, K.J.; Shields, N. An aerobic exercise program for young people with cerebral palsy in specialist schools: A phase I randomized controlled trial. Dev. Neurorehabilit. 2017, 20, 331–338. [Google Scholar] [CrossRef]
- Parent, A.; Raison, M.; Pouliot-Laforte, A.; Marois, P.; Maltais, D.B.; Ballaz, L. Impact of a short walking exercise on gait kinematics in children with cerebral palsy who walk in a crouch gait. Clin. Biomech. 2016, 34, 18–21. [Google Scholar] [CrossRef] [PubMed]
- Chappell, A.; Gibson, N.; Williams, G.; Allison, G.T.; Morris, S. Propulsion strategy in running in children and adolescents with cerebral palsy. Gait Posture 2019, 70, 305–310. [Google Scholar] [CrossRef]
- Pingel, J.; Andersen, I.T.; Broholm, R.; Harder, A.; Bartels, E.M.; Bülow, J.; Harrison, A. An acoustic myography functional assessment of cerebral palsy subjects compared to healthy controls during physical exercise. J. Muscle Res. Cell Motil. 2019, 40, 53–58. [Google Scholar] [CrossRef]
- Noorkoiv, M.; Lavelle, G.; Theis, N.; Korff, T.; Kilbride, C.; Baltzopoulos, V.; Shortland, A.; Levin, W.; Ryan, J.M. Predictors of walking efficiency in children with cerebral palsy: Lower-body joint angles, moments, and power. Phys. Ther. 2019, 99, 711–720. [Google Scholar] [CrossRef]
- Cleary, S.L.; Taylor, N.F.; Dodd, K.J.; Shields, N. A qualitative evaluation of an aerobic exercise program for young people with cerebral palsy in specialist schools. Dev. Neurorehabilit. 2017, 20, 339–346. [Google Scholar] [CrossRef]
- Tahayneh, M.; Humayra, S.; Fall, A.A.; Rosland, H.; Amro, A.; Mohammed, A.; Mohamed, A.L. Factors affecting mother’s adherence towards cerebral palsy home exercise program among children at Hebron and Bethlehem, Palestine. Int. J. Pharm. Res. 2020, 12, 1019–1024. [Google Scholar]
- Fauzi, A.A.; Khayat, M.M.; Sabirin, S.; Haron, N.; Mohamed, M.N.A.; Davis, G.M. Structured home-based exercise program for improving walking ability in ambulant children with cerebral palsy. J. Pediatr. Rehabil. Med. 2019, 12, 161–169. [Google Scholar] [CrossRef] [PubMed]
- Fauzi, A.A.; Khayat, M.M.; Haron, N.; Mahmud, S.; Sabirin, S. Structured home-based exercise program to improve ADL and participation among children with cerebral palsy. Ann. Phys. Rehabil. Med. 2018, 61, e319–e320. [Google Scholar] [CrossRef]
- Johnson, R.W.; Williams, S.A.; Gucciardi, D.F.; Bear, N.; Gibson, N. Can an online exercise prescription tool improve adherence to home exercise programmes in children with cerebral palsy and other neurodevelopmental disabilities? A randomised controlled trial. Br. Med. J. Open 2020, 10, 1–11. [Google Scholar] [CrossRef]
- Lauruschkus, K.; Hallström, I.; Westbom, L.; Tornberg, Å.; Nordmark, E. Participation in physical activities for children with cerebral palsy: Feasibility and effectiveness of physical activity on prescription. Arch. Physiother. 2017, 7, 1–11. [Google Scholar] [CrossRef]
- Kim, S.H.; Shin, H.J.; Hahm, S.C.; Park, S.W.; Cho, H.Y.; Lee, M.G. The effect of a program combining resistance exercise and group exercise on balance, grip strength, and quality of life of children with cerebral palsy. J. Korean Soc. Phys. Med. 2020, 15, 75–85. [Google Scholar] [CrossRef]
- Ghadiri, F.; Sajadi, H.R.; Bahmani, M.; Bahram, A.a. Effect of group resistance exercise with exciting music on spasticity, muscle strength and walking for children with cerebral palsy. Iran. J. Pediatr. Nurs. 2019, 6, 15–22. [Google Scholar]
- Joung, H.J.; Park, J.; Ahn, J.; Park, M.S.; Lee, Y. Effects of creative dance-based exercise on gait performance in adolescents with cerebral palsy. J. Exerc. Rehabil. 2020, 16, 332–343. [Google Scholar] [CrossRef]
- Clutterbuck, G.L.; Auld, M.L.; Johnston, L.M. SPORTS STARS: A practitioner-led, peer-group sports intervention for ambulant, school-aged children with cerebral palsy. Parent and physiotherapist perspectives. Disabil. Rehabil. 2022, 44, 956–965. [Google Scholar] [CrossRef]
- De Hollander, E.L.; Proper, K.I. Physical activity levels of adults with various physical disabilities. Prev. Med. Rep. 2018, 10, 370–376. [Google Scholar] [CrossRef] [PubMed]
- Komatireddy, R.; Chokshi, A.; Basnett, J.; Casale, M.; Goble, D.; Shubert, T. Quality and quantity of rehabilitation exercises delivered by a 3-D motion controlled camera: A pilot study. Int. J. Phys. Med. Rehabil. 2014, 2, 1–6. [Google Scholar] [CrossRef] [PubMed]
- Fasola, J.; Matarić, M.J. Socially assistive robot exercise coach: Motivating older adults to engage in physical exercise. Exp. Robot. 2013, 13, 463–479. [Google Scholar]
- Jafari, N.; Adams, K.; Tavakoli, M.; Wiebe, S.; Janz, H. Usability testing of a developed assistive robotic system with virtual assistance for individuals with cerebral palsy: A case study. Disabil. Rehabil. Assist. Technol. 2018, 13, 517–522. [Google Scholar] [CrossRef] [PubMed]
- Bainbridge, W.A.; Hart, J.W.; Kim, E.S.; Scassellati, B. The benefits of interactions with physically present robots over video-displayed agents. Int. J. Soc. Robot. 2011, 3, 41–52. [Google Scholar] [CrossRef]
- Meriggi, P.; Mandalà, M.; Brazzoli, E.; Piacente, T.; Mazzola, M.; Olivieri, I. From AAL to ambient assisted rehabilitation: A research pilot protocol based on smart objects and biofeedback. J. Ambient Intell. Humaniz. Comput. 2021, 12, 4437–4448. [Google Scholar] [CrossRef]


| Block | Questions | Content |
|---|---|---|
| 1 | 2–5 | Demographic data collection about age, weight, height, and sex, including a label for identification. BMI was calculated with weight and height. |
| 2 | 6–9 | Mobility, communication skills, and the use of assistive technology. |
| 3 | 11, 18–26 | Aspects regarding physical activity (type, motivation, frequency, time, intensity, environment, purpose, recommendation) |
| 4 | 14–16 | Other daily activities (instrumental activities of daily life, leisure, and mobility in the community) |
| 5 | 10, 12, 13, 27–28, 33–35 | Personal beliefs and preferences about the practice of physical activities |
| 6 | 29–32, 36 | The use of technical gadgets or applications for promoting and controlling the intensity of the exercise. |
| 7 | 1, 17 | For control purposes. Item 1 is a label used for identification, and item 17 is a control question that allows participants to continue with the survey. |
| Group | Males | Females | Total |
|---|---|---|---|
| Early childhood | 1 (0.6%) | 0 | 1 (0.6%) |
| Childhood and Adolescence | 27 (15.9%) | 34 (20%) | 61 (38%) |
| Adults | 56 (32.9%) | 49 (28.8%) | 105 (61.8%) |
| Older adults | 1 (0.6%) | 2 (1.2%) | 3 (17.6%) |
| Total | 85 (50%) | 85 (50%) | 170 (100%) |
| BMI | ||||||
|---|---|---|---|---|---|---|
| Overall n (%) | U18 Group n (%) | O18 Group n (%) | ||||
| Males | Females | Males | Females | Males | Females | |
| Obesity | 19 (22) | 16 (18.3) | 7 (25.9) | 7 (19.3) | 12 (20) | 9 (17.6) |
| Overweight | 19 (22) | 23 (26.8) | 1 (3.7) | 3 (9.7) | 18 (30.9) | 19 (37.3) |
| Normal | 37 (43.9) | 39 (46.3) | 15 (51) | 20 (61.3) | 22 (40) | 19 (37.3) |
| Underweight | 10 (12.1) | 7 (8.6) | 5 (18.5) | 3 (9.7) | 5 (9.1) | 4 (7.8) |
| Gender | Age Range | ||||
|---|---|---|---|---|---|
| GMFCS Question Q6 | Males | Females | Childhood & Adolescence (U18) | Adults (O18) | Total |
| I | 27 | 30 | 33 | 24 | 57 |
| II | 8 | 12 | 8 | 12 | 20 |
| III | 3 | 11 | 6 | 8 | 14 |
| IV | 9 | 7 | 4 | 12 | 16 |
| V | 38 | 25 | 11 | 52 | 63 |
| Total | 85 | 85 | 62 | 108 | 170 |
| CFCS Question Q7 | |||||
| I | 20 | 38 | 26 | 32 | 58 |
| II | 19 | 13 | 17 | 15 | 32 |
| III | 3 | 4 | 2 | 5 | 7 |
| IV | 15 | 12 | 9 | 18 | 27 |
| V | 28 | 18 | 8 | 38 | 46 |
| Total | 85 | 85 | 62 | 108 | 170 |
| Gender | Age Range | ||||||||||
|---|---|---|---|---|---|---|---|---|---|---|---|
| Male | Female | U18 | O18 | Total | |||||||
| Count | % | Count | % | Count | % | Count | % | Count | % | ||
| Recommended | Yes | 52 | 69.3 | 55 | 77.5 | 51 | 89.5 | 56 | 62.9 | 107 | 68.6 |
| No | 23 | 30.7 | 16 | 22.5 | 6 | 10.5 | 33 | 37.1 | 39 | 31.4 | |
| Goal for PA | Rehab/Treatment | 45 | 59.2 | 44 | 62.9 | 27 | 45.8 | 62 | 71.3 | 89 | 61 |
| Personal Choice | 7 | 9.2 | 7 | 10 | 7 | 11.9 | 7 | 8 | 14 | 9.6 | |
| Both | 24 | 31.6 | 19 | 27.1 | 25 | 42.3 | 18 | 20.7 | 43 | 29.4 | |
| Males | Females | U18 | O18 | Total | ||||||
|---|---|---|---|---|---|---|---|---|---|---|
| Motivation | Count | % | Count | % | Count | % | Count | % | Count | % |
| I don’t like it | 1 | 1.4 | 2 | 2.9 | 0 | 0 | 3 | 4.8 | 3 | 2.2 |
| I barely like it | 10 | 14.3 | 10 | 14.5 | 9 | 17.7 | 11 | 17.5 | 20 | 14.4 |
| I don’t mind it | 7 | 10 | 2 | 2.9 | 5 | 9.8 | 4 | 6.3 | 9 | 6.5 |
| I like it | 30 | 42.9 | 26 | 37.7 | 19 | 37.2 | 40 | 63.5 | 56 | 40.2 |
| I like it a lot | 22 | 31.4 | 29 | 42 | 18 | 35.3 | 5 | 7.9 | 51 | 36.7 |
| Males | Females | Total | |
|---|---|---|---|
| Physical barriers in the environment | 24 | 32 | 56 |
| Lack of resources for sports practice near m residence | 24 | 31 | 55 |
| Not having the appropriate adapted sports equipment | 26 | 26 | 52 |
| Lack of information or advice | 9 | 8 | 18 |
| Lack of support from family members | 31 | 38 | 69 |
| Personal disinterest | 43 | 54 | 97 |
| Other reasons | 16 | 19 | 35 |
| Overall (%) | U18 Group (%) | O18 Group (%) | ||||
|---|---|---|---|---|---|---|
| Males | Females | Males | Females | Males | Females | |
| Yes | 34.7 | 34.3 | 33.3 | 43.9 | 37.5 | 20.7 |
| No | 32.0 | 38.6 | 29.4 | 26.8 | 37.5 | 55.2 |
| NA | 33.3 | 27.1 | 37.3 | 24.3 | 25 | 24.1 |
| Cathegory | Devices | Frequency (%) |
|---|---|---|
| Walking devices | Walkers, standing frames, parallel bars, treadmill | 43.1 |
| Positioning devices | Standing frames and cranes | 8.6 |
| Wheelchairs | Manual or powered | 15.5 |
| Orthoses | Splints, DAFO, wrist braces | 15.5 |
| Robotics | Exoskeletons, Lokomat | 6.9 |
| Others | Adapted bicycles, stabilo (skiing) | 10.3 |
| BMI | ||||||||
|---|---|---|---|---|---|---|---|---|
| Sample (%) | General Population in Spain (%) (Source: INE, 2020) | |||||||
| U18 Group (%) | O18 Group (%) | U18 Group (%) | O18 Group (%) | |||||
| Males | Females | Males | Females | Males | Females | Males | Females | |
| Obesity | 25.9 | 19.3 | 25.9 | 19.3 | 10.4 | 10.2 | 16.5 | 15.5 |
| Overweight | 3.7 | 9.7 | 3.7 | 9.7 | 18.3 | 18.3 | 44.9 | 30.6 |
| Normal | 51 | 61.3 | 51 | 61.3 | 58.6 | 57.6 | 37.8 | 50.6 |
| Underweight | 18.5 | 9.7 | 18.5 | 9.7 | 12.6 | 14.0 | 0.8 | 3.3 |
| Males | Females | All | |||||||
|---|---|---|---|---|---|---|---|---|---|
| Mobility Level | Freq (days/w) | Duration (min/session) | Trend (min/w×y) | Freq (days/w) | Duration (min/session) | Trend (min/w×y) | Freq (days/w) | Duration (min/session) | Trend (min/w×y) |
| I | 3.6 (2.4) | 53.4 (19.5) | −2.9 | 3.2 (1.3) | 54 (22.7) | −0.5 | 3.3 (1.9) | 53.7 (21.1) | −1.6 |
| II | 3.3 (1.4) | 47.5 (6.1) | −1.1 | 4.2 (1.4) | 41.9 (9.6) | −1.4 | 3.8 (1.4) | 43.3 (8.5) | −1.1 |
| III | 3.3 (1.5) | 60 (30.4) | 1.2 | 3.8 (2.3) | 49.4 (13.3) | −4.4 | 3.7 (2.1) | 52.1 (17.) | −3.8 |
| IV | 3.6 (1.7) | 40 (7.9) | −2.0 | 3.8 (2.1) | 48 (12.6) | −4.9 ** | 3.7 (1.8) | 42.9 (10.1) | −3.7 ** |
| V | 2.4 (1.5) | 43.5 (10.4) | −2.6 ** | 2.7 (2.0) | 41.5 (14.1) | −1.3 | 2.5 (1.7) | 42.7 (12.0) | −2 ** |
| Males | Females | All | |||||||
|---|---|---|---|---|---|---|---|---|---|
| Mobility Level | Alone | Group | Both | Alone | Group | Both | Alone | Group | Both |
| I | 4.5 | 45.5 | 50 | 15.4 | 42.3 | 43.3 | 10.4 | 43.8 | 45.8 |
| II | 30 | 30 | 40 | 0 | 66.7 | 33.3 | 15.8 | 47.4 | 36.8 |
| III | 33.3 | 0 | 66.7 | 50 | 30 | 20 | 46.2 | 23.1 | 30.7 |
| IV | 33.3 | 44.4 | 22.3 | 40 | 20 | 40 | 35.7 | 35.7 | 28.6 |
| V | 35.3 | 29.4 | 35.3 | 42.9 | 33.3 | 23.8 | 38.2 | 30.1 | 30.1 |
| Total | 25.6 | 34.6 | 39.8 | 28.2 | 39.4 | 32.4 | 26.9 | 36.9 | 36.2 |
| Males | Females | Overall | |||||||
|---|---|---|---|---|---|---|---|---|---|
| Communicative Skills Level | Yes | No | NA | Yes | No | NA | Yes | No | NA |
| I | 55 | 30.5 | 15 | 48.5 | 33.3 | 18.2 | 50.9 | 32.1 | 17 |
| II | 31.6 | 26.3 | 42.1 | 16.7 | 58.3 | 25.0 | 25.8 | 38.7 | 35.5 |
| III | 33.3 | 33.3 | 33.3 | 0 | 25 | 75 | 14.3 | 28.6 | 57.1 |
| IV | 28.6 | 35.7 | 35.7 | 22.2 | 44.4 | 33.4 | 26.1 | 39.1 | 34.8 |
| V | 17.4 | 30.4 | 52.2 | 38.5 | 30.7 | 30.8 | 25 | 30.6 | 44.4 |
| Total | 32.9 | 30.4 | 36.7 | 35.2 | 38 | 26.8 | 34 | 34 | 32 |
Disclaimer/Publisher’s Note: The statements, opinions and data contained in all publications are solely those of the individual author(s) and contributor(s) and not of MDPI and/or the editor(s). MDPI and/or the editor(s) disclaim responsibility for any injury to people or property resulting from any ideas, methods, instructions or products referred to in the content. |
© 2024 by the authors. Licensee MDPI, Basel, Switzerland. This article is an open access article distributed under the terms and conditions of the Creative Commons Attribution (CC BY) license (https://creativecommons.org/licenses/by/4.0/).
Share and Cite
Molina-Cantero, A.J.; Pousada García, T.; Pacheco-da-Costa, S.; Lebrato-Vázquez, C.; Mendoza-Sagrera, A.; Meriggi, P.; Gómez-González, I.M. Physical Activity in Cerebral Palsy: A Current State Study. Healthcare 2024, 12, 535. https://doi.org/10.3390/healthcare12050535
Molina-Cantero AJ, Pousada García T, Pacheco-da-Costa S, Lebrato-Vázquez C, Mendoza-Sagrera A, Meriggi P, Gómez-González IM. Physical Activity in Cerebral Palsy: A Current State Study. Healthcare. 2024; 12(5):535. https://doi.org/10.3390/healthcare12050535
Chicago/Turabian StyleMolina-Cantero, Alberto J., Thais Pousada García, Soraya Pacheco-da-Costa, Clara Lebrato-Vázquez, Alejandro Mendoza-Sagrera, Paolo Meriggi, and Isabel M. Gómez-González. 2024. "Physical Activity in Cerebral Palsy: A Current State Study" Healthcare 12, no. 5: 535. https://doi.org/10.3390/healthcare12050535
APA StyleMolina-Cantero, A. J., Pousada García, T., Pacheco-da-Costa, S., Lebrato-Vázquez, C., Mendoza-Sagrera, A., Meriggi, P., & Gómez-González, I. M. (2024). Physical Activity in Cerebral Palsy: A Current State Study. Healthcare, 12(5), 535. https://doi.org/10.3390/healthcare12050535