
The Relationship between Magnetic Resonance Imaging and Functional Tests Assessment in Patients with Lumbar Disk Hernia

 ,
,  ,
,  , and
, and
Abstract
1. Introduction
2. Materials and Methods
2.1. Study Design
2.2. Participants
2.3. Procedures
2.4. Measurements
2.4.1. Functional Tests Assessment
Crossed Straight Leg Test or LASEGUE’s Sign
SLUMP Test
Sciatica Bothersomeness Index (SBI)
Oswestry Disability Index (ODI)
Visual Analogue Scale (VAS)
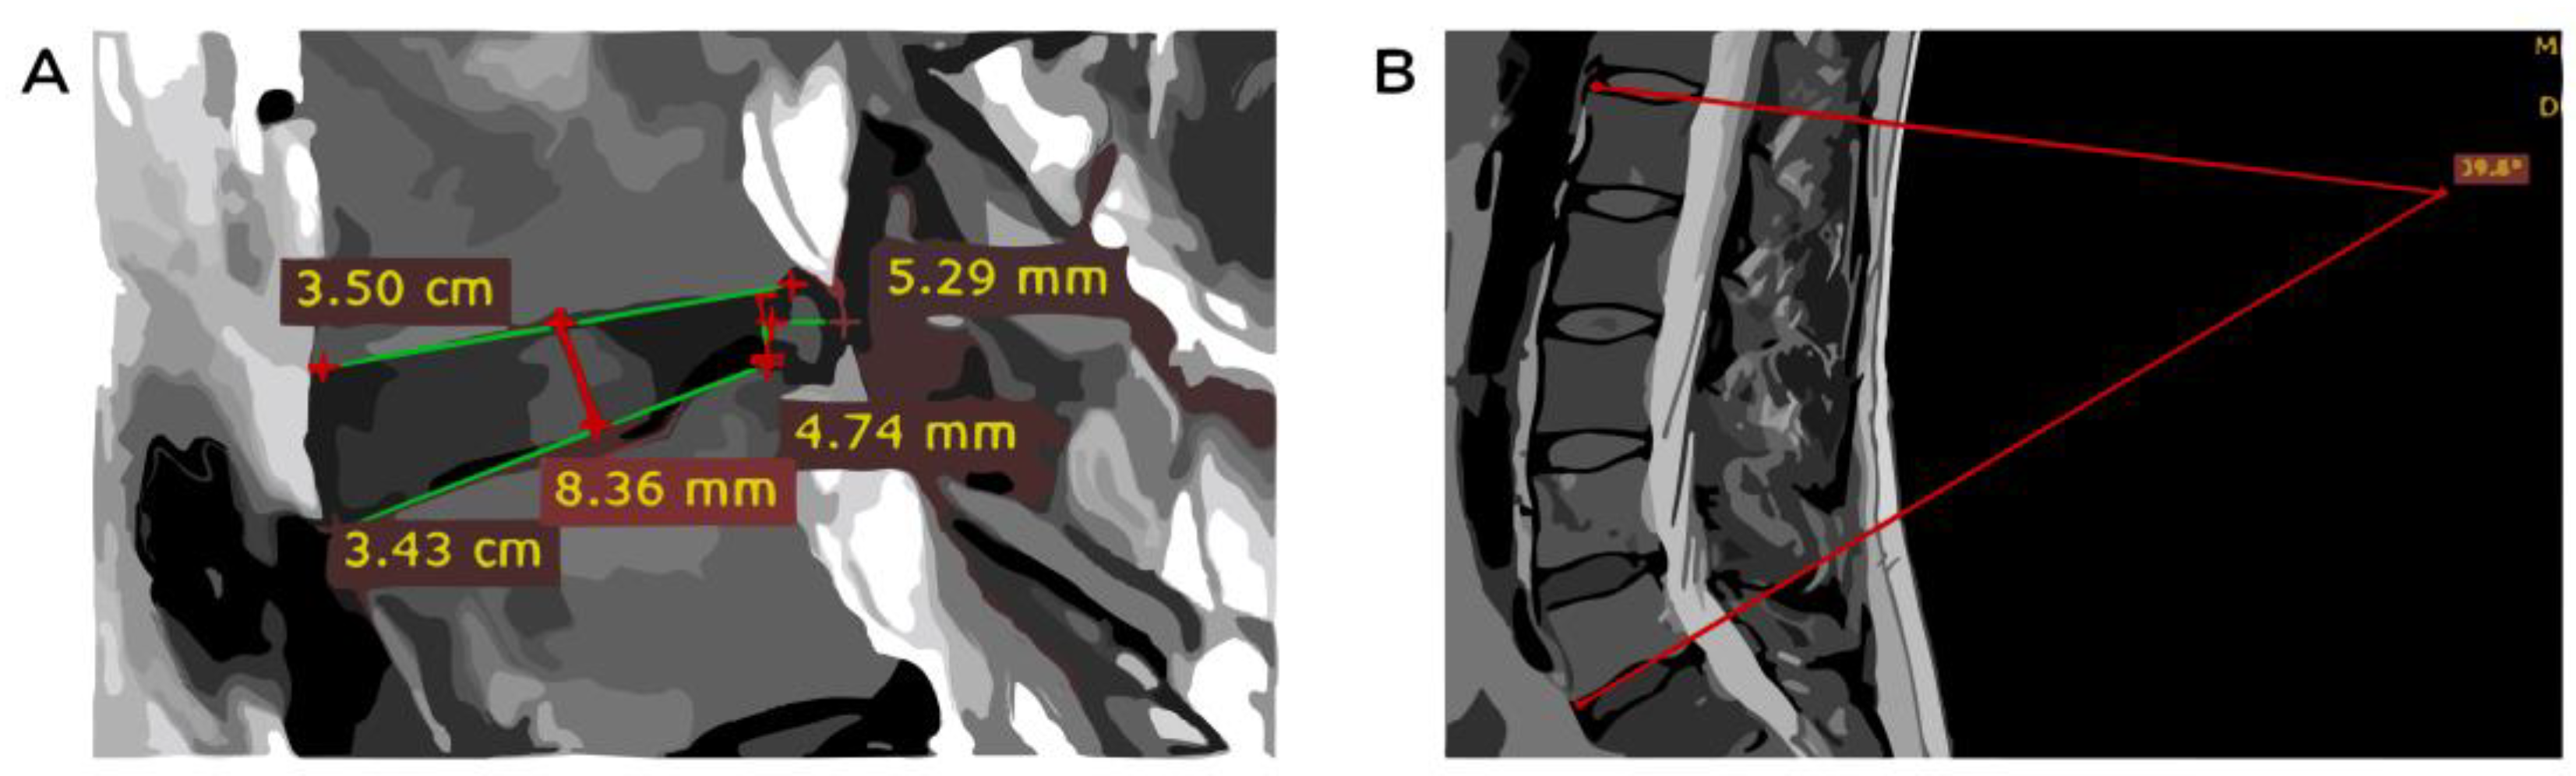
2.4.2. Assessment of MRI Images
2.5. Statistical Analysis
3. Results
4. Discussion
4.1. Limitations
4.2. Conclusions
Author Contributions
Funding
Institutional Review Board Statement
Informed Consent Statement
Data Availability Statement
Conflicts of Interest
Abbreviations
| DH | Disk hernia |
| DHS | Disk hernia size |
| FT | Functional test |
| IVD | Intervertebral disk |
| IVDH | Intervertebral disk height |
| LBP | Low back pain |
| LSA | Lumbar spine angle |
| MRI | Magnetic resonance imaging |
| OSF | Open Science Framework |
| ODI | Oswestry Disability Index |
| QuOCCA | Quality Output Checklist and Content Assessment |
| ROM | Range of motion |
| SBI | Sciatica Bothersomeness Index |
| VAS | Visual analog scale |
Appendix A. Normality Analysis Results of Kolmogorov Smirnow
| Variables | D-Value | p-Value |
| VAS | 0.09 | 0.51 |
| SLUMP | 0.37 | 0.00 |
| LASEG | 0.15 | 0.05 |
| SBİ | 0.14 | 0.07 |
| ODİ | 0.10 | 0.30 |
| LSA | 0.07 | 0.79 |
| IVDH L4-L5 (mm) | 0.05 | 0.96 |
| IVDH L5-S1 (mm) | 0.06 | 0.85 |
| DHS L4-L5 (mm) | 0.12 | 0.17 |
| DHS L5-S1 (mm) | 0.11 | 0.22 |
| Note. LSA: Lumbar spine angel; IVDH: Inter vertebral disk height (mm); DHS: Disk hernia size; VAS: Visual analogue scale; SBI: sciatica bothersomeness index; ODI: Oswestry disability index. | ||
Appendix B
Appendix C. Data Took from All Participants
| Nr. Crt | Initials | S | D | PAL | Age | LSA | IVDH L4-L5 (mm) | IVDH L5-S1 (mm) | DHS L4-L5 (mm) | DHS L5-S1 (mm) | VAS (1–10) | SLUMP (1—Positive, 0— Negative) | LASEGUE (grades) | SBI (1–6) | ODI |
| A.L. | 1 | HD L40L5, L50S1 | 1 | 54 | 42 | 6.5 | 4.5 | 5.3 | 3.2 | 6 | 1 | 80 | 3 | 17 | |
| A.D. | 2 | PD L40L5 | 1 | 38 | 33 | 10 | 7.9 | 5 | 0 | 6 | 1 | 61 | 3 | 5 | |
| A.V. | 2 | HD L50S1 | 1 | 39 | 30 | 9.5 | 10.4 | 0 | 6.2 | 4 | 0 | 0 | 2 | 35 | |
| B.I. | 1 | PD L40L5. | 1 | 38 | 28 | 10.9 | 9.7 | 0 | 9 | 3 | 0 | 0 | 3 | 7 | |
| B.M. | 1 | HD L40L5, L50S1 | 2 | 43 | 33 | 9.5 | 7.8 | 4.5 | 6 | 9 | 1 | 20 | 5 | 28 | |
| B.L. | 1 | HD L40L5, PD L40L5 | 2 | 42 | 33 | 7.8 | 11.0 | 9.5 | 4.5 | 4 | 1 | 30 | 5 | 18 | |
| B.S. | 1 | HD L40L5 | 1 | 47 | 46 | 14 | 7.5 | 0 | 5 | 6 | 1 | 45 | 6 | 13 | |
| B.I. | 2 | HD L40L5 | 1 | 38 | 43 | 5.6 | 8.5 | 8.4 | 0 | 10 | 1 | 0 | 6 | 45 | |
| B.E. | 2 | PD L40L5, L50S1 | 1 | 39 | 42 | 9.2 | 8.3 | 2.5 | 2.5 | 6 | 1 | 45 | 3 | 25 | |
| C.P. | 2 | PD L40L5 | 1 | 25 | 27 | 7.3 | 8.2 | 0 | 5 | 2 | 0 | 0 | 1 | 4 | |
| C.I. | 1 | PD L30L4, L40L5. | 1 | 38 | 28 | 9.0 | 10 | 0 | 7 | 7 | 0 | 45 | 2 | 19 | |
| C.I. | 1 | DL L40L5 | 1 | 43 | 49 | 13 | 9.3 | 5 | 0 | 3 | 0 | 0 | 0 | 8 | |
| C.C. | 1 | HD L40L5, L50S1 | 2 | 48 | 30 | 9.6 | 8.5 | 7 | 4.5 | 6 | 1 | 30 | 4 | 23 | |
| C.D. | 1 | PD L40L5, HD L405 | 1 | 44 | 33 | 12 | 13 | 4 | 4 | 5 | 0 | 0 | 2 | 10 | |
| C.C. | 1 | DL L40L5 | 1 | 72 | 52 | 11.0 | 12.1 | 2 | 0 | 3 | 0 | 0 | 0 | 9 | |
| C.D. | 1 | HD L40L5 | 2 | 59 | 52 | 7.5 | 9.8 | 0 | 3 | 4 | 0 | 0 | 1 | 22 | |
| C.D. | 1 | HD L40L5 | 3 | 49 | 37 | 10 | 5.5 | 0 | 7.5 | 8 | 1 | 10 | 6 | 33 | |
| C.R. | 1 | HD L40L5, L50S1 | 1 | 64 | 52 | 7.4 | 7.5 | 8 | 4 | 10 | 1 | 10 | 6 | 34 | |
| C.D. | 1 | HD L40L5PD l40l5 | 1 | 68 | 37 | 9.3 | 8.5 | 3 | 9.8 | 6 | 1 | 30 | 4 | 17 | |
| C.G. | 2 | HD L405 | 2 | 50 | 47 | 8.5 | 6.5 | 0 | 2.5 | 3 | 0 | 90 | 1 | 8 | |
| C.L. | 1 | HD L40L5, L50S1 | 1 | 22 | 44 | 8.1 | 7.5 | 3.5 | 5.3 | 7 | 1 | 25 | 2 | 18 | |
| C.V. | 1 | PD L50S1 | 1 | 37 | 28 | 11 | 12 | 0 | 2 | 3 | 0 | 91 | 2 | 5 | |
| D.A. | 1 | HD L40L5 | 2 | 34 | 57 | 10 | 7 | 3 | 0 | 6 | 0 | 60 | 3 | 12 | |
| D.C. | 2 | AL L40L5HD L40L5, L50S1 | 1 | 54 | 47 | 8 | 11 | 4.5 | 2.5 | 4 | 1 | 45 | 3 | 14 | |
| D.V. | 1 | HD L40L5 | 1 | 76 | 46 | 12.7 | 13 | 4.3 | 0 | 10 | 1 | 10 | 6 | 42 | |
| D.G. | 2 | PD L40L5 | 3 | 27 | 46 | 7.8 | 9.2 | 2 | 0 | 5 | 0 | 91 | 1 | 5 | |
| D.D. | 2 | HD L40L5 | 1 | 71 | 77 | 11 | 9 | 3 | 0 | 8 | 1 | 30 | 5 | 34 | |
| D.M. | 1 | HD L40L5, L50S1 | 3 | 55 | 31 | 11.5 | 12.3 | 5.5 | 3 | 4 | 1 | 60 | 3 | 13 | |
| E.G. | 1 | HD L40L5 | 2 | 35 | 38 | 10.6 | 12.5 | 0 | 9 | 7 | 1 | 45 | 4 | 14 | |
| L.D. | 1 | PD L40L5 | 1 | 32 | 16.5 | 15.4 | 14.6 | 2 | 0 | 4 | 0 | 91 | 2 | 6 | |
| L.D. | 2 | HD L40L5, L50S1 | 1 | 60 | 42 | 8.3 | 11.5 | 7.1 | 7.5 | 10 | 1 | 15 | 6 | 38 | |
| 2.P. | 1 | HD L40L5 | 1 | 47 | 49 | 10.7 | 11.2 | 6 | 0 | 9 | 1 | 20 | 5 | 28 | |
| 2.I | 1 | PD L40L5 | 2 | 40 | 38 | 11.5 | 10.5 | 4.5 | 0 | 1 | 0 | 50 | 2 | 7 | |
| G.T. | 2 | HD L40L5, L50S1 | 1 | 68 | 32 | 10.5 | 7.4 | 7.1 | 6.3 | 5 | 1 | 60 | 3 | 25 | |
| G.V. | 1 | HD L40L5 | 2 | 48 | 51 | 9.7 | 7.2 | 0 | 3.5 | 6 | 0 | 50 | 3 | 30 | |
| G.R. | 2 | HD L40L5 | 2 | 49 | 56 | 10.3 | 11.5 | 3.5 | 0 | 7 | 1 | 40 | 4 | 6 | |
| H.V. | 1 | HD L40L5, L50S1 | 1 | 80 | 48 | 10 | 9 | 9.1 | 5 | 8 | 1 | 10 | 6 | 41 | |
| H.D. | 2 | HD L50S1 | 1 | 49 | 41 | 12 | 9 | 8.5 | 8 | 1 | 10 | 5 | 28 | ||
| H.A. | 1 | HD L50S1 | 3 | 32 | 49 | 13 | 9.8 | 0 | 2 | 4 | 0 | 90 | 2 | 8 | |
| I.M. | 1 | HD L50S1 | 1 | 42 | 46 | 9.6 | 8.6 | 0 | 5 | 5 | 0 | 60 | 3 | 25 | |
| I.I | 1 | Hd l40l5 | 1 | 66 | 46 | 8.7 | 9.6 | 5.5 | 5 | 9 | 1 | 10 | 6 | 34 | |
| M.D. | 1 | PD L50S1 | 3 | 23 | 30 | 10.2 | 8.3 | 0 | 6 | 6 | 0 | 0 | 3 | 10 | |
| M.M. | 2 | Hd l40l5 l50s1 | 1 | 64 | 30 | 8 | 7 | 3.5 | 2.8 | 2 | 0 | 120 | 1 | 11 | |
| M.E. | 2 | HSD L50S1 | 1 | 60 | 35 | 12.8 | 9.1 | 0 | 6.5 | 10 | 1 | 10 | 6 | 34 | |
| M.C. | 1 | HD L40L5 | E | 25 | 25 | 7.5 | 9.5 | 7.5 | 0 | 9 | 1 | 10 | 6 | 39 | |
| M.A. | 1 | HD L40L5 | 2 | 27 | 44 | 8.7 | 5.5 | 6.7 | 0 | 7 | 1 | 30 | 4 | 17 | |
| M.B. | 1 | HD L40L5 | 2 | 31 | 41 | 8 | 10.9 | 4 | 0 | 10 | 1 | 10 | 6 | 15 | |
| N | N.A. | 1 | PD L50S1 | 1 | 22 | 31 | 1.6 | 1.3 | 0 | 3.65 | 5 | 0 | 120 | 2 | 15 |
| N.M. | 2 | HD L50S1 | 3 | 30 | 40 | 11.5 | 11 | 0 | 2 | 7 | 1 | 45 | 3 | 12 | |
| O.C | 2 | HD l40L5, L50S1 | 2 | 37 | 28 | 11.5 | 10.5 | 12 | 6.7 | 10 | 1 | 15 | 6 | 38 | |
| O.I | 2 | HD L40l5 | 1 | 39 | 55 | 9.3 | 9.2 | 2 | 0 | 3 | 0 | 0 | 1 | 6 | |
| P.G. | 2 | PD L50S1 | 1 | 77 | 49 | 10.8 | 14 | 0 | 4.3 | 3 | 0 | 120 | 3 | 3 | |
| P.M. | 2 | Pd L50S1 | 1 | 71 | 54 | 12 | 13 | 0 | 4.1 | 5 | 0 | 120 | 2 | 6 | |
| P.L. | 1 | HD L50S1 | 2 | 50 | 43 | 9.6 | 7.7 | 0 | 6 | 6 | 1 | 60 | 4 | 11 | |
| P.M | 2 | HD L40L5 | 2 | 36 | 22 | 8.6 | 9.2 | 10.3 | 0 | 10 | 1 | 10 | 6 | 35 | |
| P.E. | 1 | HD L40L5, l50S1 | 1 | 40 | 37 | 6.8 | 6.5 | 6 | 10.2 | 7 | 1 | 15 | 5 | 23 | |
| M.C. | 1 | Hd l40l5 l50s1 | 1 | 50 | 40 | 7.2 | 9.8 | 3.5 | 7.5 | 8 | 1 | 0 | 6 | 18 | |
| M.P. | 1 | Hd l50s1, l40l5 | 1 | 74 | 34 | 12 | 3 | 3 | 1 | 7 | 1 | 30 | 5 | 26 | |
| N.I. | 2 | HD L50S1 | 1 | 46 | 45 | 10.5 | 11.6 | 4.5 | 0 | 6 | 1 | 45 | 4 | 26 | |
| T.R. | 2 | HD L50S1 | 2 | 35 | 39 | 10.1 | 9.8 | 0 | 3.5 | 8 | 1 | 45 | 6 | 21 | |
| T.C. | 1 | HD L40L5 | 2 | 58 | 39 | 8.2 | 15.3 | 6.1 | 0 | 10 | 1 | 30 | 6 | 40 | |
| T.I. | 1 | HD L40L5, L50S1 | 1 | 27 | 41 | 8.8 | 10.6 | 6.5 | 5.5 | 9 | 1 | 30 | 5 | 36 | |
| T.M. | 2 | PD L40L5, L50S1 | 2 | 53 | 43 | 10.4 | 12.3 | 2 | 2.5 | 5 | 0 | 120 | 3 | 13 | |
| S.C. | 2 | HD L40L5, L50S1 | 1 | 63 | 23 | 4.5 | 8.7 | 3.9 | 4.2 | 6 | 1 | 60 | 4 | 11 | |
| S.C | 1 | HD L40L5, PD L50S1 | 1 | 50 | 50 | 10.7 | 6 | 3 | 6 | 8 | 1 | 45 | 3 | 28 | |
| S.A. | 1 | HD L40L5, L50S1 | 1 | 47 | 46 | 12 | 7.7 | 8.5 | 11 | 7 | 1 | 20 | 5 | 36 | |
| S.M. | 2 | HD L40L5, L50S1 | 1 | 60 | 45 | 4.4 | 6.6 | 7.5 | 3.6 | 7 | 0 | 60 | 4 | 35 | |
| S.M. | 2 | HD L40L5m L50S1 | 3 | 53 | 30 | 7.3 | 12.7 | 7.3 | 2.8 | 9 | 1 | 45 | 5 | 37 | |
| R.I. | 2 | PD L40L5 | 1 | 22 | 55 | 9 | 9 | 5.5 | 2.5 | 8 | 1 | 3 | 3 | 24 | |
| R.L | 2 | HD L40L5 | 1 | 42 | 57 | 9.8 | 7.8 | 3.5 | 0 | 7 | 1 | 60 | 4 | 32 | |
| R.M. | 1 | HD L40L5 | 1 | 62 | 31 | 6.8 | 8.5 | 2.8 | 0 | 7 | 1 | 30 | 4 | 24 | |
| R.C. | 1 | HD L40L5 | 1 | 26 | 49 | 10.8 | 9.4 | 0 | 5.2 | 10 | 1 | 15 | 6 | 44 | |
| R.C. | 1 | HD L50S1 | 1 | 46 | 41 | 12.7 | 6.1 | 0 | 2.5 | 6 | 0 | 76 | 3 | 9 | |
| R.D. | 1 | Hd l40l4 l50s1 | 1 | 55 | 33 | 11.8 | 11.5 | 4 | 5 | 10 | 1 | 15 | 5 | 38 | |
| R.N. | 1 | Hd l40l5 | 1 | 63 | 35 | 7.2 | 10.2 | 6.3 | 0 | 8 | 1 | 15 | 6 | 27 | |
| S.R. | 1 | HD L40l5 | 1 | 55 | 46 | 10.1 | 13.3 | 4.1 | 0 | 7 | 1 | 30 | 4 | 19 | |
| V.G. | 1 | PD L40L5 | 3 | 44 | 38 | 9.1 | 9 | 1.5 | 0 | 4 | 0 | 120 | 2 | 4 | |
| Z.S. | 2 | HD L50S1 | 1 | 45 | 51 | 12.1 | 9.5 | 0 | 5 | 5 | 0 | 120 | 3 | 12 | |
| Legend: I = initials; S = sex; D = diagnostic; Physical activity level (1 – static, 2 – average active, 3 –active); LSA = Lumbar Spine Angel; IVDH = Inter Vertebral Disk Height (mm); DHS = Disk hernia size; VAS = Visual Analogue Scale; SBI = Sciatica Bothersomeness Index; ODI =Oswestry Disability Index. | |||||||||||||||
References
- Kerr, D.; Zhao, W.; Lurie, J.D. What Are Long-Term Predictors of Outcomes for Lumbar Disc Herniation? A Randomized and Observational Study. Clin. Orthop. Relat. Res. 2015, 473, 1920–1930. [Google Scholar] [CrossRef] [PubMed]
- Cristuta, A.M.; Hanna-Mariye, N. Effectiveness of physiotherapy in improving unoperated herniated disc symptoms. Sci. Mov. Health 2021, 21, 261–266. [Google Scholar]
- Alzahrani, H.; Alshehri, M.A.; Alzhrani, M.; Alshehri, Y.S.; Al Attar, W.S.A. The association between sedentary behavior and low back pain in adults: A systematic review and meta-analysis of longitudinal studies. PeerJ 2022, 10, e13127. [Google Scholar] [CrossRef] [PubMed]
- Apfel, C.C.; Cakmakkaya, O.S.; Martin, W.; Richmond, C.; Macario, A.; George, E.; Schaefer, M.; Pergolizzi, J. V Restoration of Disk Height through Non-Surgical Spinal Decompression Is Associated with Decreased Discogenic Low Back Pain: A Retrospective Cohort Study. BMC Musculoskelet. Disord. 2010, 11, 155. [Google Scholar] [CrossRef]
- Miwa, S.; Yokogawa, A.; Kobayashi, T.; Nishimura, T.; Igarashi, K.; Inatani, H.; Tsuchiya, H. Risk Factors of Recurrent Lumbar Disk Herniation. J. Spinal Disord. Tech. 2015, 28, E265–E269. [Google Scholar] [CrossRef]
- Benzakour, T.; Igoumenou, V.; Mavrogenis, A.F.; Benzakour, A. Current Concepts for Lumbar Disc Herniation. Int. Orthop. 2019, 43, 841–851. [Google Scholar] [CrossRef]
- Vialle, L.R.; Vialle, E.N.; Henao, J.E.S.; Giraldo, G. Hérnia Discal Lombar. Rev. Bras. Ortop. 2010, 45, 17–22. [Google Scholar] [CrossRef]
- Demirel, A.; Yorubulut, M.; Ergun, N. Regression of Lumbar Disc Herniation by Physiotherapy. Does Non-Surgical Spinal Decompression Therapy Make a Difference? Double-Blind Randomized Controlled Trial. J. Back Musculoskelet. Rehabil. 2017, 30, 1015–1022. [Google Scholar] [CrossRef]
- Carlson, B.B.; Albert, T.J. Lumbar Disc Herniation: What Has the Spine Patient Outcomes Research Trial Taught Us? Int. Orthop. 2019, 43, 853–859. [Google Scholar] [CrossRef]
- Miller, K.J. Physical Assessment of Lower Extremity Radiculopathy and Sciatica. J. Chiropr. Med. 2007, 6, 75–82. [Google Scholar] [CrossRef]
- Gregory, D.S.; Seto, C.K.; Wortley, G.C.; Shugart, C.M. Acute Lumbar Disk Pain: Navigating Evaluation and Treatment Choices. Am. Fam. Physician 2008, 78, 835–842. [Google Scholar]
- Janssen, M.E.; Bertrand, S.L.; Joe, C.; Levine, M.I. Lumbar Herniated Disk Disease: Comparison of MRI, Myelography, and Post-Myelographic CT Scan with Surgical Findings. Orthopedics 1994, 17, 121–127. [Google Scholar] [CrossRef] [PubMed]
- Bovenschulte, H.; Schlüter-Brust, K.; Liebig, T.; Erdmann, E.; Eysel, P.; Zobel, C. MRI in Patients with Pacemakers. Dtsch. Arztebl. Int. 2012, 109, 270–275. [Google Scholar] [CrossRef] [PubMed]
- Grover, V.P.B.; Tognarelli, J.M.; Crossey, M.M.E.; Cox, I.J.; Taylor-Robinson, S.D.; McPhail, M.J.W. Magnetic Resonance Imaging: Principles and Techniques: Lessons for Clinicians. J. Clin. Exp. Hepatol. 2015, 5, 246–255. [Google Scholar] [CrossRef]
- Zargar, B.J.S.; Sari, A.A.; Majdzadeh, R.; Rashidian, A.; Arab, M.; Rahmani, H. The Extent of Inappropriate Use of Magnetic Resonance Imaging in Low Back Pain and Its Contributory Factors. Int. J. Prev. Med. 2014, 5, 1029. [Google Scholar]
- Héroux, M.E.; Butler, A.A.; Cashin, A.G.; McCaughey, E.J.; Affleck, A.J.; Green, M.A.; Cartwright, A.; Jones, M.; Kiely, K.M.; van Schooten, K.S.; et al. Quality Output Checklist and Content Assessment (QuOCCA): A New Tool for Assessing Research Quality and Reproducibility. BMJ Open 2022, 12, e060976. [Google Scholar] [CrossRef]
- Hancock, M.J.; Koes, B.; Ostelo, R.; Peul, W. Diagnostic Accuracy of the Clinical Examination in Identifying the Level of Herniation in Patients with Sciatica. Spine 2011, 36, E712–E719. [Google Scholar] [CrossRef]
- Capra, F.; Vanti, C.; Donati, R.; Tombetti, S.; O’Reilly, C.; Pillastrini, P. Validity of the Straight-Leg Raise Test for Patients with Sciatic Pain with or without Lumbar Pain Using Magnetic Resonance Imaging Results as a Reference Standard. J. Manip. Physiol. Ther. 2011, 34, 231–238. [Google Scholar] [CrossRef] [PubMed]
- Majlesi, J.; Togay, H.; Ünalan, H.; Toprak, S. The Sensitivity and Specificity of the Slump and the Straight Leg Raising Tests in Patients with Lumbar Disc Herniation. JCR J. Clin. Rheumatol. 2008, 14, 87–91. [Google Scholar] [CrossRef] [PubMed]
- Stankovic, R.; Johnell, O.; Maly, P.; Wilmer, S. Use of Lumbar Extension, Slump Test, Physical and Neurological Examination Inthe Evaluation of Patients with Suspected Herniated Nucleurs Pulposus. A Prospective Clinical Study. Man. Ther. 1999, 4, 25–32. [Google Scholar] [CrossRef]
- Grøvle, L.; Haugen, A.J.; Keller, A.; Natvig, B.; Brox, J.I.; Grotle, M. The Bothersomeness of Sciatica: Patients’ Self-Report of Paresthesia, Weakness and Leg Pain. Eur. Spine J. 2010, 19, 263–269. [Google Scholar] [CrossRef]
- Lee, C.-P.; Fu, T.-S.; Liu, C.-Y.; Hung, C.-I. Psychometric Evaluation of the Oswestry Disability Index in Patients with Chronic Low Back Pain: Factor and Mokken Analyses. Health Qual. Life Outcomes 2017, 15, 192. [Google Scholar] [CrossRef]
- Tunset, A.; Kjaer, P.; Samir Chreiteh, S.; Secher Jensen, T. A Method for Quantitative Measurement of Lumbar Intervertebral Disc Structures: An Intra- and Inter-Rater Agreement and Reliability Study. Chiropr. Man. Ther. 2013, 21, 26. [Google Scholar] [CrossRef] [PubMed]
- Hopkins, W.G.; Marshall, S.W.; Batterham, A.M.; Hanin, J. Progressive Statistics for Studies in Sports Medicine and Exercise Science. Med. Sci. Sport. Exerc. 2009, 41, 3–12. [Google Scholar] [CrossRef] [PubMed]
- Brinjikji, W.; Diehn, F.E.; Jarvik, J.G.; Carr, C.M.; Kallmes, D.F.; Murad, M.H.; Luetmer, P.H. MRI Findings of Disc Degeneration Are More Prevalent in Adults with Low Back Pain than in Asymptomatic Controls: A Systematic Review and Meta-Analysis. Am. J. Neuroradiol. 2015, 36, 2394–2399. [Google Scholar] [CrossRef]
- Jette, A.M.; Smith, K.; Haley, S.M.; Davis, K.D. Physical Therapy Episodes of Care for Patients with Low Back Pain. Phys. Ther. 1994, 74, 101–110. [Google Scholar] [CrossRef]
- Menezes-Reis, R.; Salmon, C.E.G.; Bonugli, G.P.; Mazoroski, D.; Tamashiro, M.H.; Savarese, L.G.; Nogueira-Barbosa, M.H. Lumbar Intervertebral Discs T2 Relaxometry and T1ρ Relaxometry Correlation with Age in Asymptomatic Young Adults. Quant. Imaging Med. Surg. 2016, 6, 402–412. [Google Scholar] [CrossRef]
- Newell, N.; Little, J.; Christou, A.; Adams, M.; Adam, C.; Masouros, S. Biomechanics of the Human Intervertebral Disc: A Review of Testing Techniques and Results. J. Mech. Behav. Biomed. Mater. 2017, 69, 420–434. [Google Scholar] [CrossRef] [PubMed]
- Jensen, M.C.; Brant-Zawadzki, M.N.; Obuchowski, N.; Modic, M.T.; Malkasian, D.; Ross, J.S. Magnetic Resonance Imaging of the Lumbar Spine in People without Back Pain. N. Engl. J. Med. 1994, 331, 69–73. [Google Scholar] [CrossRef] [PubMed]
- Ravikanth, R. Magnetic Resonance Evaluation of Lumbar Disc Degenerative Disease as an Implication of Low Back Pain: A Prospective Analysis. Neurol. India 2020, 68, 1378–1384. [Google Scholar] [CrossRef]
- Savage, R.A.; Whitehouse, G.H.; Roberts, N. The Relationship between the Magnetic Resonance Imaging Appearance of the Lumbar Spine and Low Back Pain, Age and Occupation in Males. Eur. Spine J. 1997, 6, 106–114. [Google Scholar] [CrossRef] [PubMed]
- Bajpai, J.; Saini, S.; Singh, R. Clinical Correlation of Magnetic Resonance Imaging with Symptom Complex in Prolapsed Intervertebral Disc Disease: A Cross-Sectional Double Blind Analysis. J. Craniovertebral Junction Spine 2013, 4, 16–20. [Google Scholar] [CrossRef] [PubMed]
- Eun, S.S.; Lee, H.-Y.; Lee, S.-H.; Kim, K.H.; Liu, W.C. MRI versus CT for the Diagnosis of Lumbar Spinal Stenosis. J. Neuroradiol. 2012, 39, 104–109. [Google Scholar] [CrossRef] [PubMed]
- Sunil Singh Thapa Correlation between Clinical Features and Magnetic Resonance Imaging Findings in Lumbar Disc Prolapse. J. Nepal Health Res. Counc. 2016, 12, 85–88.
- Mulleman, D.; Mammou, S.; Griffoul, I.; Watier, H.; Goupille, P. Pathophysiology of Disk-Related Sciatica. I.—Evidence Supporting a Chemical Component. Jt. Bone Spine 2006, 73, 151–158. [Google Scholar] [CrossRef] [PubMed]
- Luoma, K.; Riihimäki, H.; Luukkonen, R.; Raininko, R.; Viikari-Juntura, E.; Lamminen, A. Low Back Pain in Relation to Lumbar Disc Degeneration. Spine 2000, 25, 487–492. [Google Scholar] [CrossRef]
- Çakmak, A.; Yücel, B.; Özyalçn, S.N.; Bayraktar, B.; İbrahim Ural, H.; Tuncay Duruöz, M.; Genç, A. The Frequency and Associated Factors of Low Back Pain among a Younger Population in Turkey. Spine 2004, 29, 1567–1572. [Google Scholar] [CrossRef]
- Heneweer, H.; Vanhees, L.; Picavet, S.J.H. Physical Activity and Low Back Pain: A U-Shaped Relation? Pain 2009, 143, 21–25. [Google Scholar] [CrossRef]
- Skolasky, R.L.; Scherer, E.A.; Wegener, S.T.; Tosteson, T.D. Does Reduction in Sciatica Symptoms Precede Improvement in Disability and Physical Health among Those Treated Surgically for Intervertebral Disc Herniation? Analysis of Temporal Patterns in Data from the Spine Patient Outcomes Research Trial. Spine J. 2018, 18, 1318–1324. [Google Scholar] [CrossRef]
- Mertimo, T.; Karppinen, J.; Niinimäki, J.; Blanco, R.; Määttä, J.; Kankaanpää, M.; Oura, P. Association of Lumbar Disc Degeneration with Low Back Pain in Middle Age in the Northern Finland Birth Cohort 1966. BMC Musculoskelet. Disord. 2022, 23, 359. [Google Scholar] [CrossRef]
- Tsuji, T.; Matsuyama, Y.; Sato, K.; Hasegawa, Y.; Yimin, Y.; Iwata, H. Epidemiology of Low Back Pain in the Elderly: Correlation Withlumbar Lordosis. J. Orthop. Sci. 2001, 6, 307–311. [Google Scholar] [CrossRef]
- Sigmundsson, F.G.; Kang, X.P.; Jönsson, B.; Strömqvist, B. Correlation between Disability and MRI Findings in Lumbar Spinal Stenosis. Acta Orthop. 2011, 82, 204–210. [Google Scholar] [CrossRef]
- Middendorp, M.; Vogl, T.J.; Kollias, K.; Kafchitsas, K.; Khan, M.F.; Maataoui, A. Association between Intervertebral Disc Degeneration and the Oswestry Disability Index. J. Back Musculoskelet. Rehabil. 2017, 30, 819–823. [Google Scholar] [CrossRef]
- Hong, J.H.; Lee, M.Y.; Jung, S.W.; Lee, S.Y. Does Spinal Stenosis Correlate with MRI Findings and Pain, Psychologic Factor and Quality of Life? Korean J. Anesthesiol. 2015, 68, 481. [Google Scholar] [CrossRef]
- Tabesh, H.; Tabesh, A.; Fakharian, E.; Fazel, M.; Abrishamkar, S. The Effect of Age on Result of Straight Leg Raising Test in Patients Suffering Lumbar Disc Herniation and Sciatica. J. Res. Med. Sci. 2015, 20, 150. [Google Scholar]
- Miranda, I.H.; Raymundo, J.L.P.; Klein, K.M. Sensitivity of Laségue Sign and Slump Test in Hernia and Disc Bulging Diagnoses Compared with Magnetic Resonance Imaging. Rev. Bras. Ortop. 2021, 56, 761–765. [Google Scholar] [CrossRef]
- M’kumbuzi, V.R.P.; Ntawukuriryayo, J.T.; Haminana, J.D.; Munyandamutsa, J.; Nzakizwanimana, E. Accuracy of Straight Leg Raise and Slump Tests in Detecting Lumbar Disc Herniation: A Pilot Study. Cent. Afr. J. Med. 2012, 58, 5–11. [Google Scholar]
- González Espinosa de los Monteros, F.J.; Gonzalez-Medina, G.; Ardila, E.M.G.; Mansilla, J.R.; Expósito, J.P.; Ruiz, P.O. Use of Neurodynamic or Orthopedic Tension Tests for the Diagnosis of Lumbar and Lumbosacral Radiculopathies: Study of the Diagnostic Validity. Int. J. Environ. Res. Public Health 2020, 17, 7046. [Google Scholar] [CrossRef]


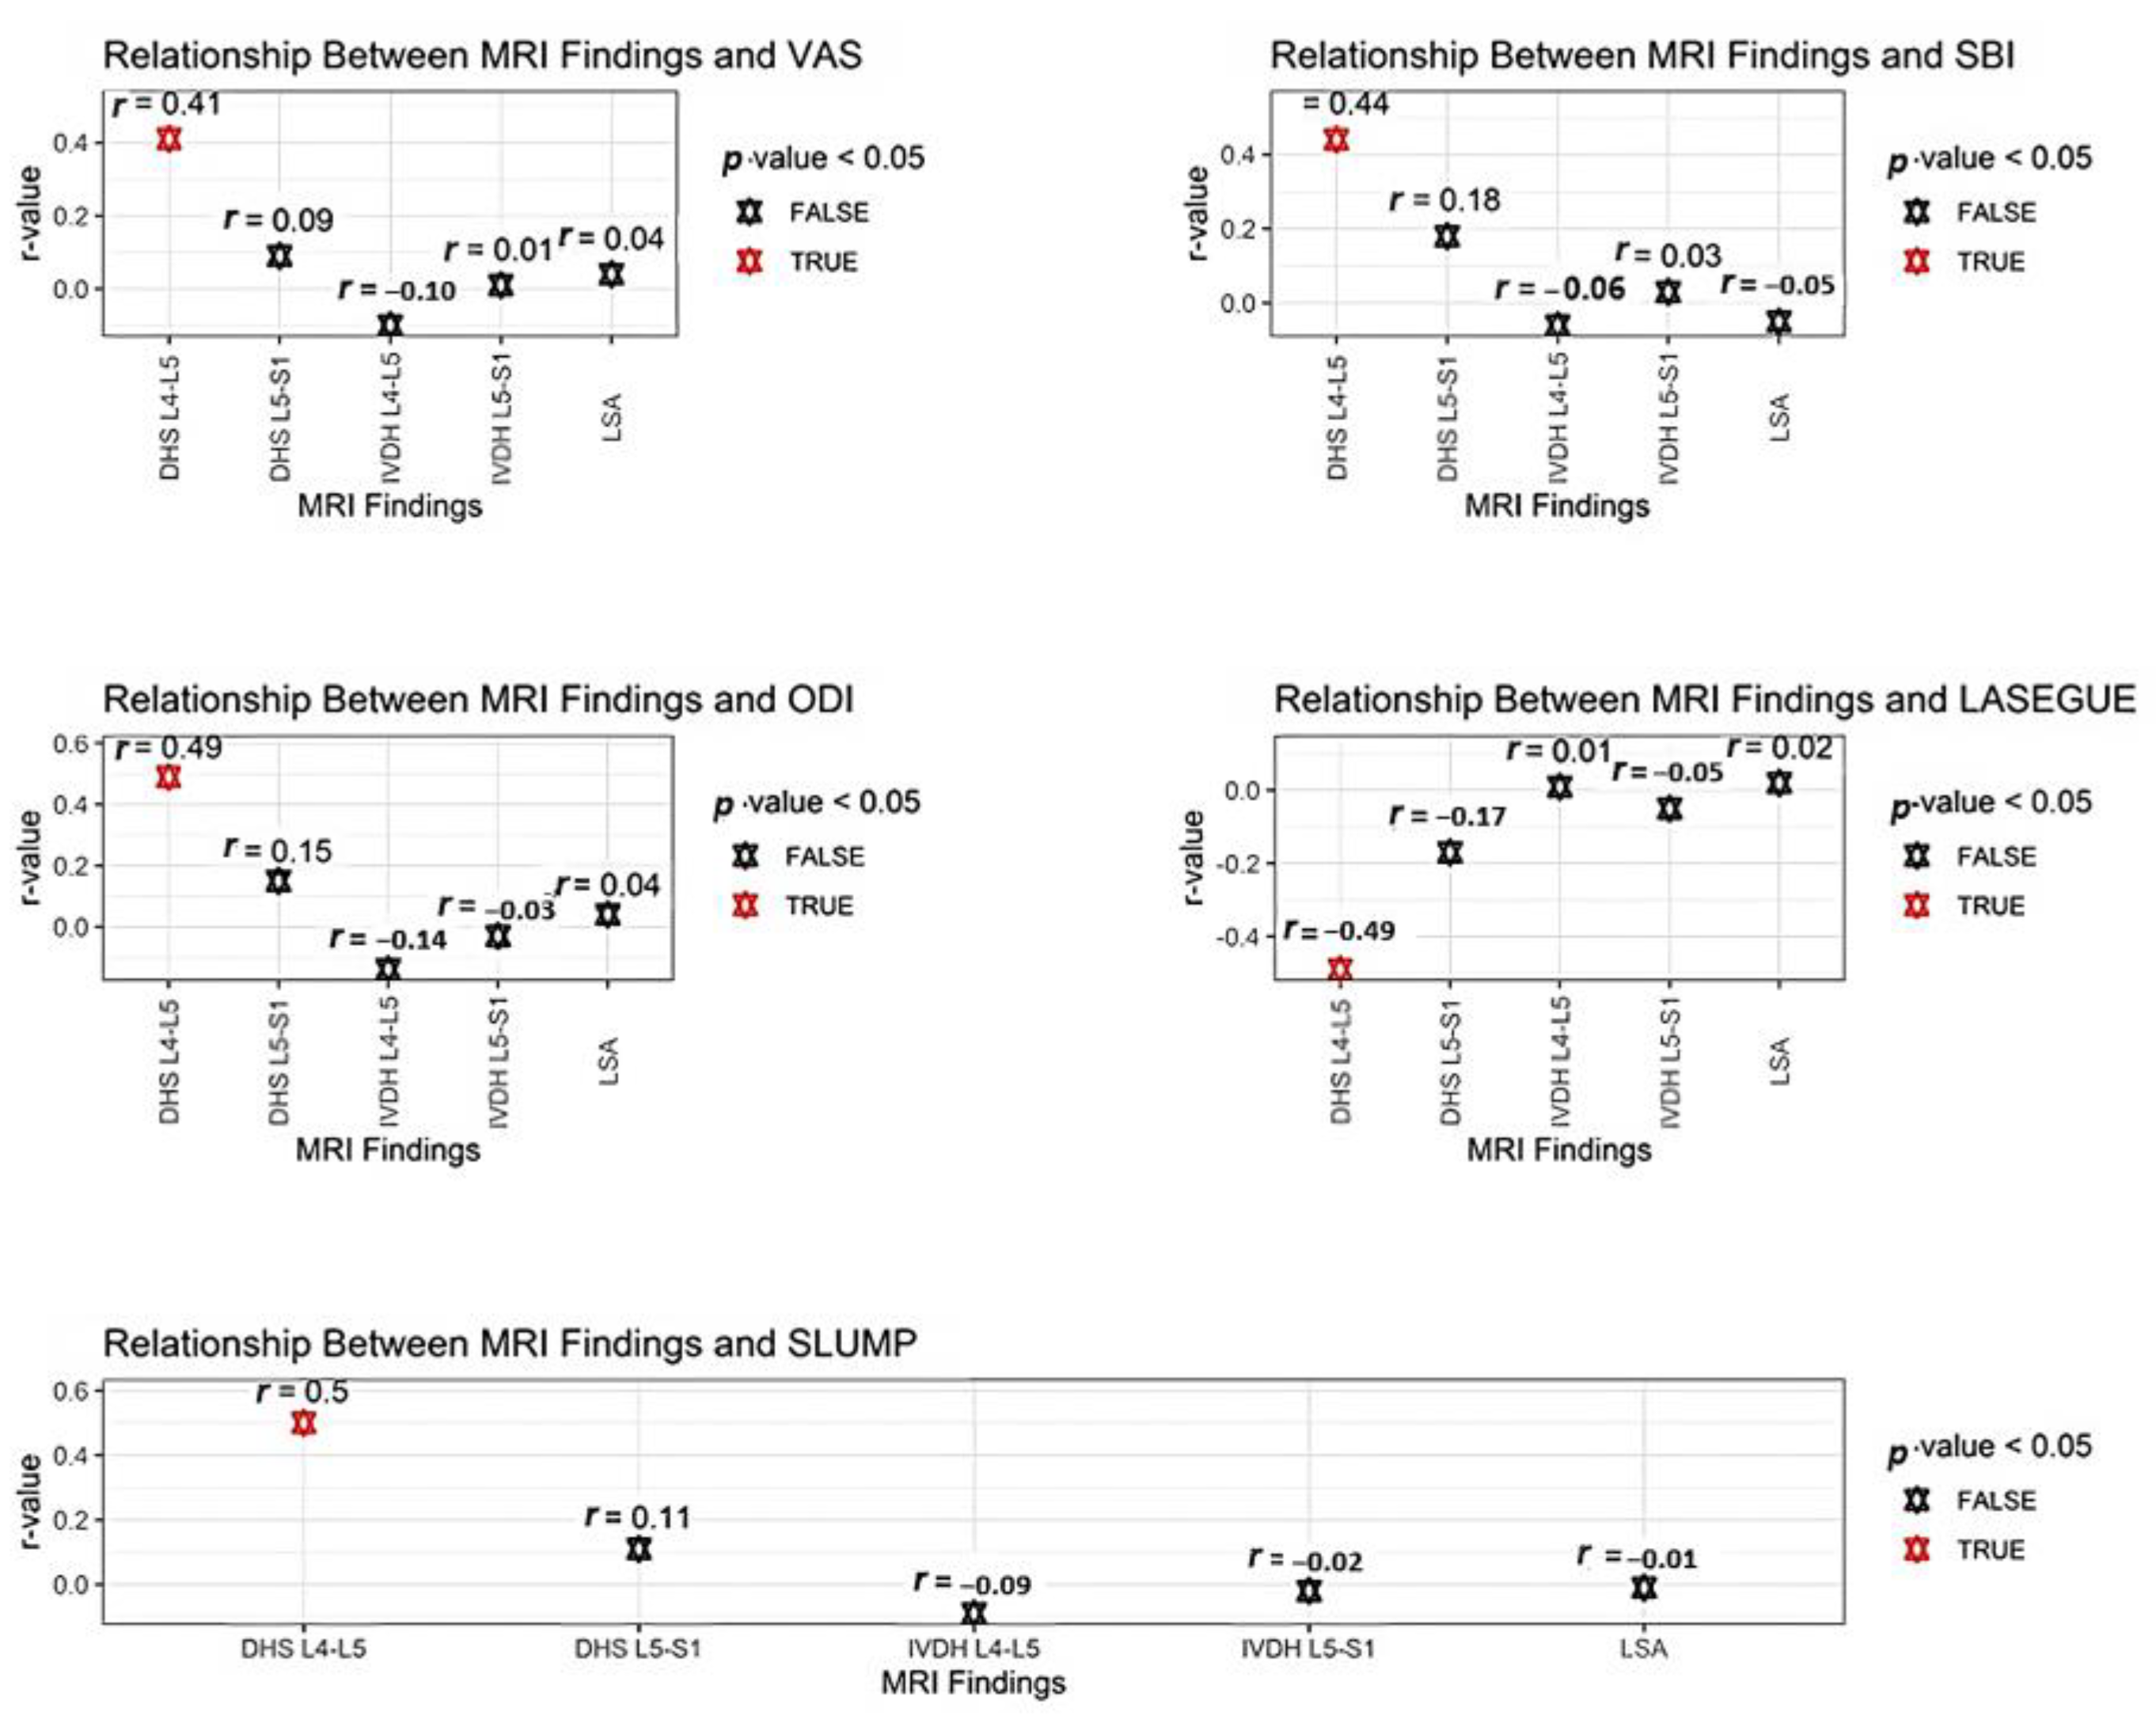
| MRI Finding | VAS r (p-Value) | Sex r (p-Value) | Physical Activity Level r (p-Value) | Age r (p-Value) | ||||
|---|---|---|---|---|---|---|---|---|
| Male (n = 48) | Female (n = 30) | Sedentary (n = 52) | Moderate Active (n =18) | Active (n = 8) | 20–40 Age (n = 31) | Above 40 Age (n = 47) | ||
| LSA | 0.04 (0.68) | 0.15 (0.29) | −0.05 (0.77) | 0.21 (0.13) | −0.37 (0.13) | −0.40 (0.31) | 0.08 (0.66) | −0.00 (0.99) |
| IVDH L4-L5 (mm) | −0.10 (0.35) | −0.22 (0.13) | 0.06 (0.72) | −0.08 (0.56) | −0.08 (0.74) | −0.43 (0.28) | −0.21 (0.23) | −0.02 (0.86) |
| IVDH L5-S1 (mm) | 0.01 (0.89) | −0.01 (0.93) | 0.09 (0.62) | −0.04 (0.73) | 0.21 (0.38) | −0.04 (0.90) | −0.02 (0.87) | 0.04 (0.78) |
| DHS L4-L5 (mm) | 0.41 (0.00) * | 0.32 (0.02) * | 0.54 (0.00) * | 0.45 (0.00) * | 0.37 (0.12) | 0.20 (0.62) | 0.55 (0.00) * | 0.28 (0.05) |
| DHS L5-S1 (mm) | 0.09 (0.42) | 0.10 (0.48) | 0.06 (0.74) | 0.07 (0.62) | 0.03 (0.89) | 0.50 (0.20) | 0.01 (0.94) | 0.15 (0.31) |
| MRI Finding | SBI r (p-Value) | Sex r (p-Value) | Physical Activity Level r (p-Value) | Age r (p-Value) | ||||
|---|---|---|---|---|---|---|---|---|
| Male (n = 48) | Female (n = 30) | Sedentary (n = 52) | Moderate Active (n =18) | Active (n = 8) | 20–40 Age (n = 31) | Above 40 Age (n = 47) | ||
| LSA | −0.05 (0.65) | 0.00 (0.95) | −0.10 (0.58) | 0.12 (0.36) | −0.59 (0.00) * | −0.54 (0.15) | −0.05 (0.77) | −0.11 (0.45) |
| IVDH L4-L5 (mm) | −0.06 (0.57) | −0.15 (0.28) | 0.08 (0.67) | −0.05 (0.70) | −0.01 (0.95) | −0.14 (0.73) | −0.09 (0.59) | −0.06 (0.68) |
| IVDH L5-S1 (mm) | 0.03 (0.76) | −0.00 (0.96) | 0.16 (0.37) | −0.03 (0.82) | 0.34 (0.16) | −0.18 (0.65) | 0.06 (0.71) | 0.00 (0.95) |
| DHS L4-L5 (mm) | 0.44 (0.00) * | 0.42 (0.00) * | 0.49 (0.00) * | 0.42 (0.00) * | 0.55 (0.01) * | 0.21 (0.60) | 0.57 (0.00) * | 0.34 (0.01) * |
| DHS L5-S1 (mm) | 0.18 (0.10) | 0.18 (0.20) | 0.15 (0.40) | 0.15 (0.25) | 0.06 (0.78) | 0.76 (0.02) * | 0.03 (0.84) | 0.27 (0.06) |
| MRI Finding | ODI r (p-Value) | Sex r (p-Value) | Physical Activity Level r (p-Value) | Age r (p-Value) | ||||
|---|---|---|---|---|---|---|---|---|
| Male (n = 48) | Female (n = 30) | Sedentary (n = 52) | Moderate Active (n =18) | Active (n = 8) | 20–40 Age (n = 31) | Above 40 Age (n = 47) | ||
| LSA | 0.04 (0.67) | 0.20 (0.15) | −0.11 (0.55) | 0.22 (0.11) | −0.53 (0.02) * | −0.47 (0.23) | 0.01 (0.92) | 0.02 (0.86) |
| IVDH L4-L5 (mm) | −0.14 (0.19) | −0.18 (0.21) | −0.10 (0.59) | −0.12 (0.37) | −0.15 (0.52) | −0.33 (0.44) | −0.29 (0.19) | −0.10 (0.50) |
| IVDH L5-S1 (mm) | −0.03 (0.72) | −0.01 (0.93) | −0.09 (0.60) | −0.08 (0.53) | 0.19 (0.43) | 0.00 (0.99) | −0.02 (0.90) | −0.05 (0.69) |
| DHS L4-L5 (mm) | 0.49 (0.00) * | 0.42 (0.00) * | 0.56 (0.00) * | 0.50 (0.00) * | 0.50 (0.03) * | 0.43 (0.28) | 0.51 (0.00) * | 0.45 (0.00) * |
| DHS L5-S1 (mm) | 0.15 (0.17) | 0.13 (0.35) | 0.19 (0.30) | 0.08 (0.53) | 0.13 (0.59) | 0.57 (0.13) | 0.12 (0.50) | 0.16 (0.26) |
| MRI Finding | LASEGUE r (p-Value) | Sex r (p-Value) | Physical Activity Level r (p-Value) | Age r (p-Value) | ||||
|---|---|---|---|---|---|---|---|---|
| Male (n = 48) | Female (n = 30) | Sedentary (n = 52) | Moderate Active (n =18) | Active (n = 8) | 20–40 Age (n = 31) | Above 40 Age (n = 47) | ||
| LSA | 0.02 (0.83) | −0.16 (0.25) | 0.15 (0.41) | −0.08 (0.52) | 0.34 (0.15) | 0.56 (0.14) | −0.08 (0.92) | 0.02 (0.88) |
| IVDH L4-L5 (mm) | 0.01 (0.87) | −0.01 (0.90) | 0.11 (0.54) | −0.02 (0.85) | 0.33 (0.16) | −0.04 (0.91) | 0.09 (0.61) | −0.04 (0.78) |
| IVDH L5-S1 (mm) | −0.05 (0.64) | −0.20 (0.16) | 0.15 (0.40) | −0.11 (0.42) | −0.05 (0.82) | 0.25 (0.53) | −0.06 (0.73) | −0.05 (0.73) |
| DHS L4-L5 (mm) | −0.48 (0.00) * | −0.53 (0.00) * | −0.44 (0.02) * | −0.48 (0.00) * | −0.61 (0.00) * | −0.08 (0.86) | −0.59 (0.00) * | −0.42 (0.00) * |
| DHS L5-S1 (mm) | −0.17 (0.14) | −0.20 (0.20) | −0.12 (0.54) | −0.13 (0.37) | 0.00 (0.98) | −0.87 (0.01) * | −0.20 (0.31) | −0.17 (0.26) |
| MRI Finding | SLUMP r (p-Value) | Sex r (p-Value) | Physical Activity Level r (p-Value) | Age r (p-Value) | ||||
|---|---|---|---|---|---|---|---|---|
| Male (n = 48) | Female (n = 30) | Sedentary (n = 52) | Moderate Active (n =18) | Active (n = 8) | 20–40 Age (n = 31) | Above 40 Age (n = 47) | ||
| LSA | −0.01 (0.92) | 0.05 (0.72) | −0.07 (0.67) | 0.18 (0.19) | −0.54 (0.01) * | −0.46 (0.24) | 0.13 (0.45) | −0.18 (0.20) |
| IVDH L4-L5 (mm) | −0.09 (0.41) | −0.20 (0.16) | 0.09 (0.62) | −0.10 (0.46) | −0.09 (0.72) | 0.01 (0.97) | −0.12 (0.50) | −0.09 (0.52) |
| IVDH L5-S1 (mm) | −0.02 (0.81) | −0.04 (0.78) | 0.00 (0.96) | −0.14 (0.30) | 0.22 (0.37) | 0.29 (0.47) | 0.02 (0.90) | −0.06 (0.65) |
| DHS L4-L5 (mm) | 0.50 (0.00) * | 0.55 (0.00) * | 0.44 (0.01) * | 0.53 (0.00) * | 0.46 (0.05) | 0.43 (0.27) | 0.57 (0.00) * | 0.43 (0.00) * |
| DHS L5-S1 (mm) | 0.11 (0.32) | 0.20 (0.16) | −0.06 (0.72) | 0.30 (0.79) * | 0.24 (0.32) | 0.36 (0.37) | −0.03 (0.87) | 0.21 (0.15) |
Disclaimer/Publisher’s Note: The statements, opinions and data contained in all publications are solely those of the individual author(s) and contributor(s) and not of MDPI and/or the editor(s). MDPI and/or the editor(s) disclaim responsibility for any injury to people or property resulting from any ideas, methods, instructions or products referred to in the content. |
© 2023 by the authors. Licensee MDPI, Basel, Switzerland. This article is an open access article distributed under the terms and conditions of the Creative Commons Attribution (CC BY) license (https://creativecommons.org/licenses/by/4.0/).
Share and Cite
Antohe, B.-A.; Uysal, H.Ş.; Panaet, A.-E.; Iacob, G.-S.; Rață, M. The Relationship between Magnetic Resonance Imaging and Functional Tests Assessment in Patients with Lumbar Disk Hernia. Healthcare 2023, 11, 2669. https://doi.org/10.3390/healthcare11192669
Antohe B-A, Uysal HŞ, Panaet A-E, Iacob G-S, Rață M. The Relationship between Magnetic Resonance Imaging and Functional Tests Assessment in Patients with Lumbar Disk Hernia. Healthcare. 2023; 11(19):2669. https://doi.org/10.3390/healthcare11192669
Chicago/Turabian StyleAntohe, Bogdan-Alexandru, Hüseyin Şahin Uysal, Adelina-Elena Panaet, George-Sebastian Iacob, and Marinela Rață. 2023. "The Relationship between Magnetic Resonance Imaging and Functional Tests Assessment in Patients with Lumbar Disk Hernia" Healthcare 11, no. 19: 2669. https://doi.org/10.3390/healthcare11192669
APA StyleAntohe, B.-A., Uysal, H. Ş., Panaet, A.-E., Iacob, G.-S., & Rață, M. (2023). The Relationship between Magnetic Resonance Imaging and Functional Tests Assessment in Patients with Lumbar Disk Hernia. Healthcare, 11(19), 2669. https://doi.org/10.3390/healthcare11192669