
A Balanced Dietary Ratio of n-6:n-3 Polyunsaturated Fatty Acids Exerts an Effect on Total Fatty Acid Profile in RBCs and Inflammatory Markers in Subjects with Obesity

 ,
,  , ,
, ,  , and
, and
Abstract
1. Introduction
2. Materials and Methods
2.1. Subjects
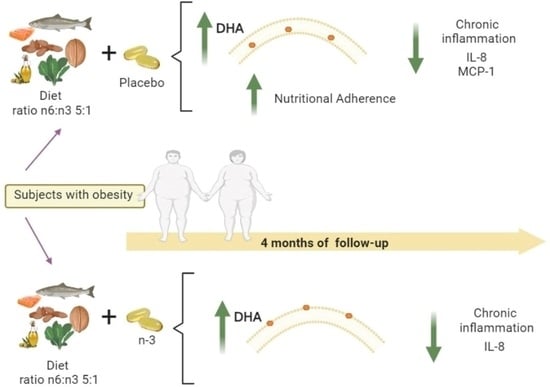
2.2. Nutritional Intervention
2.3. Adherence Evaluation
2.4. Anthropometric Measurements
2.5. Biochemical Measurements
2.6. Cytokine Levels
2.7. Total Fatty Acid Profile of the RBCs
2.8. Statistical Analysis
3. Results
3.1. Baseline Characteristics
3.2. Changes in Nutritional Data at the End of the Study
3.3. Changes in Anthropometric Data at the End of the Study
3.4. Changes in Biochemical Parameters at the End of the Study in Both Groups
3.5. Adherence to Diet during the Intervention
3.6. Changes in Inflammatory Markers at the End of the Study and Differences between Groups
4. Discussion
5. Conclusions
Supplementary Materials
Author Contributions
Funding
Institutional Review Board Statement
Informed Consent Statement
Data Availability Statement
Acknowledgments
Conflicts of Interest
References
- Lin, X.; Li, H. Obesity: Epidemiology, Pathophysiology, and Therapeutics. Front. Endocrinol. 2021, 12, 706978. [Google Scholar] [CrossRef] [PubMed]
- Obesidad y Sobrepeso. Available online: https://www.who.int/es/news-room/fact-sheets/detail/obesity-and-overweight (accessed on 10 April 2020).
- Andolfi, C.; Fisichella, P.M. Epidemiology of Obesity and Associated Comorbidities. J. Laparoendosc. Adv. Surg. Tech. A 2018, 28, 919–924. [Google Scholar] [CrossRef] [PubMed]
- Powell-Wiley, T.M.; Poirier, P.; Burke, L.E.; Després, J.-P.; Gordon-Larsen, P.; Lavie, C.J.; Lear, S.A.; Ndumele, C.E.; Neeland, I.J.; Sanders, P.; et al. Obesity and Cardiovascular Disease: A Scientific Statement from the American Heart Association. Circulation 2021, 143, e984–e1010. [Google Scholar] [CrossRef] [PubMed]
- Semlitsch, T.; Stigler, F.L.; Jeitler, K.; Horvath, K.; Siebenhofer, A. Management of Overweight and Obesity in Primary Care—A Systematic Overview of International Evidence-Based Guidelines. Obes. Rev. 2019, 20, 1218–1230. [Google Scholar] [CrossRef]
- Endalifer, M.L.; Diress, G. Epidemiology, Predisposing Factors, Biomarkers, and Prevention Mechanism of Obesity: A Systematic Review. J. Obes. 2020, 2020, 6134362. [Google Scholar] [CrossRef]
- Simopoulos, A.P.; DiNicolantonio, J.J. The Importance of a Balanced ω-6 to ω-3 Ratio in the Prevention and Management of Obesity. Open. Heart 2016, 3, e000385. [Google Scholar] [CrossRef]
- D’Angelo, S.; Motti, M.L.; Meccariello, R. ω-3 and ω-6 Polyunsaturated Fatty Acids, Obesity and Cancer. Nutrients 2020, 12, 2751. [Google Scholar] [CrossRef]
- Torres-Castillo, N.; Campos-Perez, W.; Gonzalez-Becerra, K.; Hernandez-Cañaveral, I.; Vizmanos, B.; Muñoz-Valle, J.; Martinez-Lopez, E. Waist Circumference Is an Anthropometric Parameter That Identifies Women with Metabolically Unhealthy Phenotypes. Nutrients 2018, 10, 447. [Google Scholar] [CrossRef]
- Albracht-Schulte, K.; Kalupahana, N.S.; Ramalingam, L.; Wang, S.; Rahman, S.M.; Robert-McComb, J.; Moustaid-Moussa, N. Omega-3 Fatty Acids in Obesity and Metabolic Syndrome: A Mechanistic Update. J. Nutr. Biochem. 2018, 58, 1–16. [Google Scholar] [CrossRef]
- Kapoor, B.; Kapoor, D.; Gautam, S.; Singh, R.; Bhardwaj, S. Dietary Polyunsaturated Fatty Acids (PUFAs): Uses and Potential Health Benefits. Curr. Nutr. Rep. 2021, 10, 232–242. [Google Scholar] [CrossRef] [PubMed]
- Dyall, S.C.; Balas, L.; Bazan, N.G.; Brenna, J.T.; Chiang, N.; da Costa Souza, F.; Dalli, J.; Durand, T.; Galano, J.-M.; Lein, P.J.; et al. Polyunsaturated Fatty Acids and Fatty Acid-Derived Lipid Mediators: Recent Advances in the Understanding of Their Biosynthesis, Structures, and Functions. Prog. Lipid Res. 2022, 86, 101165. [Google Scholar] [CrossRef] [PubMed]
- Orton, H.D.; Szabo, N.J.; Clare-Salzler, M.; Norris, J.M. Comparison between Omega-3 and Omega-6 Polyunsaturated Fatty Acid Intakes as Assessed by a Food Frequency Questionnaire and Erythrocyte Membrane Fatty Acid Composition in Young Children. Eur. J. Clin. Nutr. 2008, 62, 733–738. [Google Scholar] [CrossRef] [PubMed][Green Version]
- Wander, R.; Patton, B. Comparison of Three Species of Fish Consumed as Part of a Western Diet: Effects on Platelet Fatty Acids and Function, Hemostasis, and Production of Thromboxane. Am. J. Clin. Nutr. 1991, 54, 326–333. [Google Scholar] [CrossRef]
- Liput, K.P.; Lepczyński, A.; Ogłuszka, M.; Nawrocka, A.; Poławska, E.; Grzesiak, A.; Ślaska, B.; Pareek, C.S.; Czarnik, U.; Pierzchała, M. Effects of Dietary n–3 and n–6 Polyunsaturated Fatty Acids in Inflammation and Cancerogenesis. Int. J. Mol. Sci. 2021, 22, 6965. [Google Scholar] [CrossRef] [PubMed]
- Hooper, L.; Al-Khudairy, L.; Abdelhamid, A.S.; Rees, K.; Brainard, J.S.; Brown, T.J.; Ajabnoor, S.M.; O’Brien, A.T.; Winstanley, L.E.; Donaldson, D.H.; et al. Omega-6 Fats for the Primary and Secondary Prevention of Cardiovascular Disease. Cochrane Database Syst. Rev. 2018, 2018, CD011094. [Google Scholar] [CrossRef]
- Spencer, M.; Finlin, B.S.; Unal, R.; Zhu, B.; Morris, A.J.; Shipp, L.R.; Lee, J.; Walton, R.G.; Adu, A.; Erfani, R.; et al. Omega-3 Fatty Acids Reduce Adipose Tissue Macrophages in Human Subjects with Insulin Resistance. Diabetes 2013, 62, 1709–1717. [Google Scholar] [CrossRef]
- International Diabetes Federation—Home. Available online: https://idf.org/ (accessed on 31 May 2021).
- Global Recommendations on Physical Activity for Health. Available online: https://www.who.int/publications-detail-redirect/9789241599979 (accessed on 27 April 2021).
- World Medical Association. World Medical Association Declaration of Helsinki: Ethical Principles for Medical Research Involving Human Subjects. JAMA 2013, 310, 2191. [Google Scholar] [CrossRef]
- Dawczynski, C.; Dittrich, M.; Neumann, T.; Goetze, K.; Welzel, A.; Oelzner, P.; Völker, S.; Schaible, A.M.; Troisi, F.; Thomas, L.; et al. Docosahexaenoic Acid in the Treatment of Rheumatoid Arthritis: A Double-Blind, Placebo-Controlled, Randomized Cross-over Study with Microalgae vs. Sunflower Oil. Clin. Nutr. 2018, 37, 494–504. [Google Scholar] [CrossRef]
- Lee, J.; Jang, S.; Jeong, H.; Ryu, O.-H. Validation of the Friedewald Formula for Estimating Low Density Lipoprotein Cholesterol: The Korea National Health and Nutrition Examination Survey, 2009 to 2011. Korean J. Intern. Med. 2020, 35, 150–159. [Google Scholar] [CrossRef]
- Folch, J.; Lees, M.; Sloane Stanley, G.H. A Simple Method for the Isolation and Purification of Total Lipides from Animal Tissues. J. Biol. Chem. 1957, 226, 497–509. [Google Scholar] [CrossRef]
- Rodríguez, V.M.V. Muestreo y Tamaño de la Muestra. Una Guía Práctica para Personal de Salud Que Realiza Investigación; El Cid Editor: Córdoba, Spain, 2003; ISBN 978-1-4492-1654-2. [Google Scholar]
- Sugawara, K.; Takahashi, H.; Kasai, C.; Kiyokawa, N.; Watanabe, T.; Fujii, S.; Kashiwagura, T.; Honma, M.; Satake, M.; Shioya, T. Effects of Nutritional Supplementation Combined with Low-Intensity Exercise in Malnourished Patients with COPD. Respir. Med. 2010, 104, 1883–1889. [Google Scholar] [CrossRef] [PubMed]
- Benjamini, Y.; Hochberg, Y. Controlling the False Discovery Rate: A Practical and Powerful Approach to Multiple Testing. J. R. Stat. Soc. Ser. B (Methodol.) 1995, 57, 289–300. [Google Scholar] [CrossRef]
- R Project for Statistical Computing, Version 4.2.2; software for Statistical Computing, Vienna, Austria. Available online: https://www.R-project.org/ (accessed on 10 July 2023).
- Guebre-Egziabher, F.; Rabasa-Lhoret, R.; Bonnet, F.; Bastard, J.-P.; Desage, M.; Skilton, M.R.; Vidal, H.; Laville, M. Nutritional Intervention to Reduce the N-6/n-3 Fatty Acid Ratio Increases Adiponectin Concentration and Fatty Acid Oxidation in Healthy Subjects. Eur. J. Clin. Nutr. 2008, 62, 1287–1293. [Google Scholar] [CrossRef]
- Djuricic, I.; Calder, P.C. Beneficial Outcomes of Omega-6 and Omega-3 Polyunsaturated Fatty Acids on Human Health: An Update for 2021. Nutrients 2021, 13, 2421. [Google Scholar] [CrossRef]
- Żebrowska, A.; Hall, B.; Stolecka-Warzecha, A.; Stanula, A.; Sadowska-Krępa, E. The Effect of Omega-3 Fatty Acid Supplementation on Serum Adipocytokines, Lipid Profile and Biochemical Markers of Inflammation in Recreational Runners. Nutrients 2021, 13, 456. [Google Scholar] [CrossRef] [PubMed]
- Dansinger, M.L.; Gleason, J.A.; Griffith, J.L.; Selker, H.P.; Schaefer, E.J. Comparison of the Atkins, Ornish, Weight Watchers, and Zone Diets for Weight Loss and Heart Disease Risk Reduction: A Randomized Trial. JAMA 2005, 293, 43–53. [Google Scholar] [CrossRef]
- Chao, A.M.; Quigley, K.M.; Wadden, T.A. Dietary Interventions for Obesity: Clinical and Mechanistic Findings. J. Clin. Investig. 2021, 131, e140065. [Google Scholar] [CrossRef]
- Redruello-Requejo, M.; de Samaniego-Vaesken, M.L.; Puga, A.M.; Montero-Bravo, A.; Ruperto, M.; Rodríguez-Alonso, P.; Partearroyo, T.; Varela-Moreiras, G. Omega-3 and Omega-6 Polyunsaturated Fatty Acid Intakes, Determinants and Dietary Sources in the Spanish Population: Findings from the ANIBES Study. Nutrients 2023, 15, 562. [Google Scholar] [CrossRef]
- Ishihara, T.; Yoshida, M.; Arita, M. Omega-3 Fatty Acid-Derived Mediators That Control Inflammation and Tissue Homeostasis. Int. Immunol. 2019, 31, 559–567. [Google Scholar] [CrossRef]
- Kim, C.-S.; Park, H.-S.; Kawada, T.; Kim, J.-H.; Lim, D.; Hubbard, N.E.; Kwon, B.-S.; Erickson, K.L.; Yu, R. Circulating Levels of MCP-1 and IL-8 Are Elevated in Human Obese Subjects and Associated with Obesity-Related Parameters. Int. J. Obes. 2006, 30, 1347–1355. [Google Scholar] [CrossRef]
- Frank, A.P.; de Souza Santos, R.; Palmer, B.F.; Clegg, D.J. Determinants of Body Fat Distribution in Humans May Provide Insight about Obesity-Related Health Risks. J. Lipid Res. 2019, 60, 1710–1719. [Google Scholar] [CrossRef] [PubMed]
- Jensen, M.D. Visceral Fat: Culprit or Canary? Endocrinol. Metab. Clin. N. Am. 2020, 49, 229–237. [Google Scholar] [CrossRef] [PubMed]
- Castela, I.; Rodrigues, C.; Ismael, S.; Barreiros-Mota, I.; Morais, J.; Araújo, J.R.; Marques, C.; Silvestre, M.P.; Ângelo-Dias, M.; Martins, C.; et al. Intermittent Energy Restriction Ameliorates Adipose Tissue-Associated Inflammation in Adults with Obesity: A Randomised Controlled Trial. Clin. Nutr. 2022, 41, 1660–1666. [Google Scholar] [CrossRef] [PubMed]
- Montefusco, L.; D’Addio, F.; Loretelli, C.; Ben Nasr, M.; Garziano, M.; Rossi, A.; Pastore, I.; Plebani, L.; Lunati, M.E.; Bolla, A.M.; et al. Anti-Inflammatory Effects of Diet and Caloric Restriction in Metabolic Syndrome. J. Endocrinol. Investig. 2021, 44, 2407–2415. [Google Scholar] [CrossRef]
- Hossain, M.; Faruque, M.O.; Kabir, G.; Hassan, N.; Sikdar, D.; Nahar, Q.; Ali, L. Association of Serum TNF-α and IL-6 with Insulin Secretion and Insulin Resistance in IFG and IGT Subjects in a Bangladeshi Population. Int. J. Diabetes Mellit. 2010, 2, 165–168. [Google Scholar] [CrossRef]
- Oh, D.Y.; Talukdar, S.; Bae, E.J.; Imamura, T.; Morinaga, H.; Fan, W.; Li, P.; Lu, W.J.; Watkins, S.M.; Olefsky, J.M. GPR120 Is an Omega-3 Fatty Acid Receptor Mediating Potent Anti-Inflammatory and Insulin-Sensitizing Effects. Cell 2010, 142, 687–698. [Google Scholar] [CrossRef]
- Baker, E.J.; Yusof, M.H.; Yaqoob, P.; Miles, E.A.; Calder, P.C. Omega-3 Fatty Acids and Leukocyte-Endothelium Adhesion: Novel Anti-Atherosclerotic Actions. Mol. Asp. Med. 2018, 64, 169–181. [Google Scholar] [CrossRef] [PubMed]
- Souza, P.R.; Marques, R.M.; Gomez, E.A.; Colas, R.A.; De Matteis, R.; Zak, A.; Patel, M.; Collier, D.J.; Dalli, J. Enriched Marine Oil Supplements Increase Peripheral Blood Specialized Pro-Resolving Mediators Concentrations and Reprogram Host Immune Responses: A Randomized Double-Blind Placebo-Controlled Study. Circ. Res. 2020, 126, 75–90. [Google Scholar] [CrossRef]


| Variable | n-3 PUFA Group Mean ± SD | Placebo Group Mean ± SD | p Value |
|---|---|---|---|
| Age (years) | 39.5 ± 6.8 | 35.8 ± 6.6 | 0.092 |
| Sex % (women/men) | 55/50 | 45/50 | |
| Nutritional | |||
| Energy (kcal/day) | 2555 ± 760.8 | 2148 ± 888.5 | 0.729 |
| Protein (%) | 17.0 ± 3.4 | 18.2 ± 2.7 | 0.312 |
| Carbohydrates (%) | 48.7 ± 11.3 | 42.3 ± 8.7 | 0.495 |
| Fats (%) | 35.8 ± 8.5 | 39.4 ± 7.9 | 0.276 |
| SFAs (%) | 12.2 ± 4.6 | 14.0 ± 3.8 | 0.155 |
| MUFAs (%) | 11.9 ± 3.4 | 14.1 ± 4.1 | 0.534 |
| PUFAs (%) | 3.4 ± 1.5 | 2.8 ± 1.4 | 0.440 |
| Cholesterol (mg) | 396.3 ± 230.2 | 442.4 ± 229.5 | 0.631 |
| Linoleic (g) | 21.2 ± 14.6 | 14.1 ± 10.0 | 0.413 |
| 20:4 AA | 0.1 ± 0.1 | 0.1 ± 0.05 | 0.683 |
| Linolenic (g) | 1.7 ± 0.7 | 1.3 ± 0.6 | 0.759 |
| EPA (g) | 0.02 ± 0.04 | 0.02 ± 0.05 | 0.506 |
| DHA (g) | 0.06 ± 0.04 | 0.05 ± 0.04 | 0.395 |
| 22:5 DPA (g) | 0.02 ± 0.01 | 0.01 ± 0.01 | 0.820 |
| n6:n3 PUFA ratio | 14:1 | 12:1 | 0.891 |
| tFAs | 0.7 ± 0.7 | 0.6 ± 0.7 | 0.867 |
| Fiber (g) | 22.2 ± 12.0 | 28.4 ± 16.4 | 0.179 |
| Total sugar (g) | 97.0 ± 38.2 | 80.5 ± 54.1 | 0.471 |
| Anthropometric | |||
| Weight (kg) | 88.1 ± 9.8 | 92.4 ± 13.5 | 0.419 |
| BMI (kg/m2) | 32.8 ± 2.7 | 33.7 ± 32.3 | 0.372 |
| WC (cm) | 100.1 ± 9.6 | 102.5 ± 10.2 | 0.472 |
| BFM (kg) | 36.4 ± 5.5 | 38.8 ± 8.4 | 0.212 |
| SM (kg) | 28.4 ± 5.9 | 29.8 ± 7.2 | 0.954 |
| Fat (%) | 49.2 ± 9.9 | 48.5 ± 10.9 | 0.519 |
| Lean body mass (kg) | 41.7 ± 6.3 | 42.2 ± 7.5 | 0.901 |
| Abdominal fat (%) | 19.4 ± 2.1 | 19.5 ± 3.2 | 0.742 |
| Water (kg) | 37.0 ± 8.0 | 39.4 ± 8.5 | 0.699 |
| Biochemical | |||
| Glucose (mg/dL) | 90.8 ± 8.3 | 102.3 ± 10.4 | 0.597 |
| Insulin (µU/mL) | 21.4 ± 14.9 | 24.1 ± 13.7 | 0.569 |
| HOMA-IR | 5.0 ± 4.1 | 5.8 ± 3.5 | 0.587 |
| Total cholesterol (mg/dL) | 181.6 ± 37.1 | 187.3 ± 35.5 | 0.711 |
| HDL-c (mg/dL) | 37.8 ± 6.3 | 39.3 ± 7.8 | 0.714 |
| LDL-c (mg/dL) | 126.1 ± 26.3 | 114.6 ± 23 | 0.767 |
| VLDL-c (mg/dL) | 28.2 ± 14.6 | 34.4 ± 1.9 | 0.294 |
| TGs (mg/dL) | 139.0 ± 68.5 | 169.1 ± 66.6 | 0.277 |
| TC/HDL | 5.0 ± 1.3 | 5.0 ± 1.4 | 0.881 |
| LDL/HDL | 3.2 ± 1.0 | 3.1 ± 0.9 | 0.743 |
| Variable | n-3 PUFA Group | Placebo Group | ||||||||
|---|---|---|---|---|---|---|---|---|---|---|
| Baseline t = 0 | Final t = 4 | p-Value a | Δ | Baseline t = 0 | Final t = 4 | p-Value a | Δ | p-Value b | q-Value c | |
| Energy (kcal) | 2555 ± 760 | 1590.7 ± 264 | 0.010 | −964 ± 685 | 2148 ± 888 | 1597.5 ± 431 | 0.043 | −550 ± 880 | 0.297 | 0.571 |
| Protein (%) | 17.0 ± 3.4 | 20.8 ± 2.3 | 0.077 | 3.7 ± 4.6 | 18.2 ± 2.7 | 18.7 ± 3.1 | 0.557 | 0.4 ± 2.8 | 0.065 | 0.406 |
| Carbohydrates (%) | 48.7 ± 11.3 | 46.0 ± 2.8 | 0.612 | −2.6 ± 13.2 | 42.3 ± 8.7 | 40.8 ± 5.0 | 0.484 | −1.5 ± 7.5 | 0.803 | 0.933 |
| Lipids (%) | 35.8 ± 8.5 | 35.5 ± 4.3 | 0.947 | −0.3 ± 12.4 | 39.4 ± 7.9 | 43.4 ± 5.6 | 0.120 | 4.04 ± 8.7 | 0.368 | 0.634 |
| SFAs (%) | 12.2 ± 4.6 | 10.3 ± 1.6 | 0.345 | −1.8 ± 4.8 | 14.0 ± 3.8 | 12.5 ± 2.0 | 0.230 | −1.4 ± 4.1 | 0.840 | 0.933 |
| MUFAs (%) | 11.9 ± 3.4 | 12.8 ± 2.9 | 0.713 | 0.8 ± 5.9 | 14.1 ± 4.1 | 16.4 ± 4.2 | 0.192 | 2.2 ± 5.9 | 0.618 | 0.858 |
| PUFAs (%) | 3.4 ± 1.5 | 8.1 ± 3.0 | 0.015 | 4.6 ± 3.6 | 2.8 ± 1.4 | 10.1 ± 2.0 | <0.001 | 7.2 ± 2.7 | 0.088 | 0.425 |
| Cholesterol (mg) | 396.3 ± 230.2 | 330.4 ± 115.0 | 0.532 | −65 ± 262 | 442.4 ± 229.5 | 281.9 ± 101.1 | 0.058 | −160 ± 275 | 0.466 | 0.706 |
| Linoleic LA (g) | 21.2 ± 14.6 | 12.1 ± 4.9 | 0.163 | −9.1 ± 15.1 | 14.1 ± 10.0 | 15.7 ± 5.5 | 0.663 | 1.5 ± 12.7 | 0.111 | 0.426 |
| 20:4 AA (g) | 0.1 ± 0.1 | 0.1 ± 0.06 | 0.856 | −0.009 ± 0.1 | 0.1 ± 0.05 | 0.2 ± 0.1 | 0.085 | −0.06 ± 0.1 | 0.091 | 0.425 |
| Linolenic ALA (g) | 1.7 ± 0.7 | 1.3 ± 0.7 | 0.352 | −0.4 ± 1.1 | 1.3 ± 0.6 | 1.5 ± 0.8 | 319 | 0.2 ± 1.0 | 0.158 | 0.535 |
| EPA (g) | 0.02 ± 0.04 | 0.06 ± 0.06 | 0.186 | 0.04 ± 0.07 | 0.02 ± 0.05 | 0.1 ± 0.1 | 0.016 | 0.1 ± 0.1 | 0.282 | 0.571 |
| DHA (g) | 0.06 ± 0.04 | 0.1 ± 0.09 | 0.141 | 0.08 ± 0.1 | 0.05 ± 0.04 | 0.2 ± 0.1 | 0.003 | 0.2 ± 0.2 | 0.195 | 0.541 |
| 22:5 DPA (g) | 0.02 ± 0.01 | 0.02 ± 0.01 | 0.185 | 0.005 ± 0.01 | 0.01 ± 0.01 | 0.02 ± 0.01 | 0.126 | 0.01 ± 0.02 | 0.596 | 0.851 |
| n6:n3 PUFA ratio | 14:1 | 9:1 | 0.480 | −5:1 | 12:1 | 10:1 | 0.282 | −2:1 | ||
| tFAs (g) | 0.7 ± 0.7 | 0.3 ± 0.3 | 0.210 | −0.3 ± 0.6 | 0.6 ± 0.7 | 0.1 ± 0.1 | 0.051 | −0.4 ± 0.7 | 0.840 | 0.933 |
| Total sugar (g) | 97.0 ± 38.2 | 58.6 ± 17.1 | 0.047 | −38.3 ± 40.7 | 80.5 ± 54.1 | 58.2 ± 21.4 | 0.100 | −22.3 ± 45 | 0.444 | 0.693 |
| Variable | n-3 PUFA Group | Placebo Group | ||||||||
|---|---|---|---|---|---|---|---|---|---|---|
| Baseline t = 0 | Final t = 4 | p-Value a | Δ | Baseline t = 0 | Final t = 4 | p-Value a | Δ | p-Value b | q-Value c | |
| Weight (kg) | 88.1 ± 9.8 | 87.5 ± 9.3 | 0.520 | −0.6 ± 4.0 | 92.4 ± 13.5 | 88.5 ± 14.3 | 0.001 | −3.9 ± 3.1 | 0.008 | 0.216 * |
| BMI (kg/m2) | 32.8 ± 2.7 | 32.8 ± 3.0 | 0.866 | −0.07 ± 1.9 | 33.7 ± 32.3 | 32.3 ± 3.8 | 0.001 | −1.3 ± 1.0 | 0.013 | 0.216 * |
| WC (cm) | 100.1 ± 9.6 | 95.5 ± 8.3 | 0.001 | −4.5 ± 4.5 | 102.5 ± 10.2 | 96.5 ± 10.5 | 0.001 | −6.0 ± 3.1 | 0.229 | 0.557 |
| BFM (kg) | 36.4 ± 5.5 | 36.6 ± 6.8 | 0.857 | 0.1 ± 3.6 | 38.8 ± 8.4 | 36.8 ± 9.5 | 0.010 | −1.9 ± 3.1 | 0.062 | 0.406 |
| SM (kg) | 28.4 ± 5.9 | 27.9 ± 5.6 | 0.031 | −0.5 ± 0.8 | 29.8 ± 7.2 | 28.6 ± 7.0 | 0.001 | −1.1 ± 0.9 | 0.052 | 0.406 |
| LBM (kg) | 49.2 ± 9.9 | 48.9 ± 10.5 | 0.653 | −0.5 ± 0.8 | 48.5 ± 10.9 | 50.4 ± 11.2 | 0.001 | −1.8 ± 1.3 | 0.012 | 0.216 * |
| Fat (%) | 41.7 ± 6.3 | 42.0 ± 7.4 | 0.546 | 0.3 ± 2.2 | 42.2 ± 7.5 | 41.8 ± 7.9 | 0.460 | −0.3 ± 2.3 | 0.343 | 0.634 |
| Abdominal fat (kg) | 19.4 ± 2.1 | 19.4 ± 2.7 | 0.936 | 0.02 ± 1.3 | 19.5 ± 3.2 | 18.6 ± 3.7 | 0.023 | −0.8 ± 1.5 | 0.977 | 0.981 |
| Water (kg) | 37.0 ± 8.0 | 36.9 ± 7.5 | 0.520 | −0.07 ± 2.6 | 39.4 ± 8.5 | 37.8 ± 8.4 | 0.001 | −1.5 ± 1.2 | 0.029 | 0.300 * |
| Variable | n-3 PUFA Group | Placebo Group | ||||||||
|---|---|---|---|---|---|---|---|---|---|---|
| Baseline t = 0 | Final t = 4 | p-Value a | Δ | Baseline t = 0 | Final t = 4 | p-Value a | Δ | p-Value b | q-Value c | |
| Glucose (mg/dL) | 90.8 ± 8.3 | 87.5 ± 4.7 | 0.092 | −3.1 ± 7.5 | 102.3 ± 10.4 | 96.2 ± 10.7 | 0.104 | −3.4 ± 9.3 | 0.911 | 0.969 |
| Insulin (µU/mL) | 21.4 ± 14.9 | 24.8 ± 22.9 | 0.289 | 3.3 ± 13.0 | 24.1 ± 13.7 | 22.2 ± 13.6 | 0.435 | −1.8 ± 10.4 | 0.179 | 0.535 |
| HOMA-IR | 5.0 ± 4.1 | 5.7 ± 6.2 | 0.459 | 0.6 ± 3.3 | 5.8 ± 3.5 | 5.1 ± 3.4 | 0.279 | −0.6 ± 2.6 | 0.206 | 0.542 |
| TC (mg/dL) | 181.6 ± 37.1 | 177.0 ± 32.1 | 0.442 | −4.6 ± 24.8 | 187.3 ± 35.5 | 189.4 ± 24.1 | 0.701 | 2.1 ± 25.1 | 0.406 | 0.676 |
| HDL-c (mg/dL) | 37.8 ± 6.3 | 39.1 ± 9.9 | 0.496 | 1.2 ± 7.7 | 39.3 ± 7.8 | 39.1 ± 8.3 | 0.674 | 0.5 ± 5.6 | 0.728 | 0.910 |
| LDL-c (mg/dL) | 126.1 ± 26.3 | 117.2 ± 25.9 | 0.158 | −8.4 ± 23.4 | 114.6 ± 23.7 | 125.6 ± 35.2 | 0.902 | 11.0 ± 28.4 | 0.030 | 0.300 * |
| VLDL-c (mg/dL) | 28.2 ± 14.6 | 29.0 ± 13.7 | 0.471 | 1.7 ± 10.2 | 34.4 ± 1.9 | 31.0 ± 12.1 | 0.386 | −3.1 ± 16.4 | 0.275 | 0.571 |
| TGs (mg/dL) | 139.0 ± 68.5 | 147.7 ± 68.4 | 0.478 | 8.7 ± 50.9 | 169.1 ± 93.2 | 143.1 ± 50.7 | 0.224 | −25.9 ± 94.7 | 0.173 | 0.535 |
| Variable | n-3 PUFA Group n = 19 | Placebo Group n = 22 | p Value |
|---|---|---|---|
| Adherence 1st month (%) | 71.5 ± 17.8 | 78.9 ± 13.6 | 0.141 |
| Adherence 2nd month (%) | 66.5 ± 15.7 | 74.2 ± 17.8 | 0.135 |
| Adherence 3rd month (%) | 61.0 ± 19.4 | 73.8 ± 15.5 | 0.024 |
| Adherence 4th month (%) | 50.0 ± 19.7 * | 65.5 ± 14.9 * | 0.007 |
| Variable | n3 PUFA Group | Placebo Group | ||||||||
|---|---|---|---|---|---|---|---|---|---|---|
| Baseline t = 0 | Final t = 4 | p-Value a | Δ | Baseline t = 0 | Final t = 4 | p-Value a | Δ | p-Value b | q-Value c | |
| IFNγ (pg/mL) | 10.1 ± 12.9 | 12.2 ± 17.0 | 0.860 | 2.0 ± 24.1 | 2.4 ± 2.3 | 1.1 ± 1.0 | 0.348 | −1.3 ± 2.8 | 0.764 | 0.910 |
| IL-12 (pg/mL) | 0.6 ± 0.3 | 0.6 ± 0.3 | 0.420 | −0.3 ± 1.5 | 0.7 ± 0.4 | 0.6 ± 0.5 | 0.423 | −0.1 ± 0.1 | 0.286 | 0.571 |
| IL-13 (pg/mL) | 1.0 ± 1.3 | 0.7 ± 0.5 | 0.573 | −0.3 ± 1.5 | 0.4 ± 0.3 | 1.7 ± 3.6 | 0.402 | 1.2 ± 1.3 | 0.268 | 0.571 |
| IL-8 (pg/mL) | 4.1 ± 1.5 | 3.7 ± 1.8 | 0.341 | −0.3 ± 2.4 | 6.2 ± 2.8 | 4.2 ± 2.8 | 0.014 | −2.0 ± 3.3 | 0.097 | 0.425 |
| IL-6 (pg/mL) | 0.6 ± 0.4 | 1.1 ± 0.9 | 0.513 | 0.5 ± 0.2 | 0.7 ± 0.4 | 0.1 ± 0.3 | 0.443 | −0.6 ± 0.3 | 0.182 | 0.535 |
| MCP-1(pg/mL) | 71.1 ± 65.6 | 53.1 ± 43.3 | 0.197 | −17.9 ± 48.5 | 54.7 ± 36.7 | 40.6 ± 25.9 | 0.033 | −14.0 ± 27.4 | 0.760 | 0.910 |
| MIP1β (pg/mL) | 21.4 ± 13.1 | 17.2 ± 12.3 | 0.193 | −4.2 ± 12.9 | 22.2 ± 21.2 | 16.2 ± 13.1 | 0.169 | −5.9 ± 18.5 | 0.759 | 0.910 |
| Adiponectin (μg/mL) | 3.0 ± 2.9 | 2.2 ± 1.7 | 0.284 | −0.8 ± 3.1 | 3.5 ± 4.2 | 3.1 ± 3.5 | 0.671 | −0.4 ± 4.5 | 0.765 | 0.910 |
| Variable | n3 PUFA Group | Placebo Group | ||||||||
|---|---|---|---|---|---|---|---|---|---|---|
| Baseline t = 0 | Final t = 4 | p-Value a | Δ | Baseline t = 0 | Final t = 4 | p-Value a | Δ | p-Value b | q-Value c | |
| Linoleic acid (%) | 7.8 ± 2.0 | 7.1 ± 1.6 | 0.209 | −0.7 ± 2.3 | 8.8 ± 3.7 | 8.0 ± 2.2 | 0.386 | −0.7 ± 4.0 | 0.981 | 0.981 |
| AA (%) | 8.3 ± 1.8 | 7.8 ± 2.4 | 0.487 | −0.5 ± 3.2 | 7.6 ± 2.2 | 8.6 ± 1.8 | 0.085 | 0.9 ± 2.5 | 0.102 | 0.425 |
| Total n-6 (%) | 16.1 ± 3.5 | 14.9 ± 3.7 | 0.311 | −1.2 ± 5.3 | 16.4 ± 4.4 | 16.7 ± 3.8 | 0.804 | 0.2 ± 5.0 | 0.361 | 0.634 |
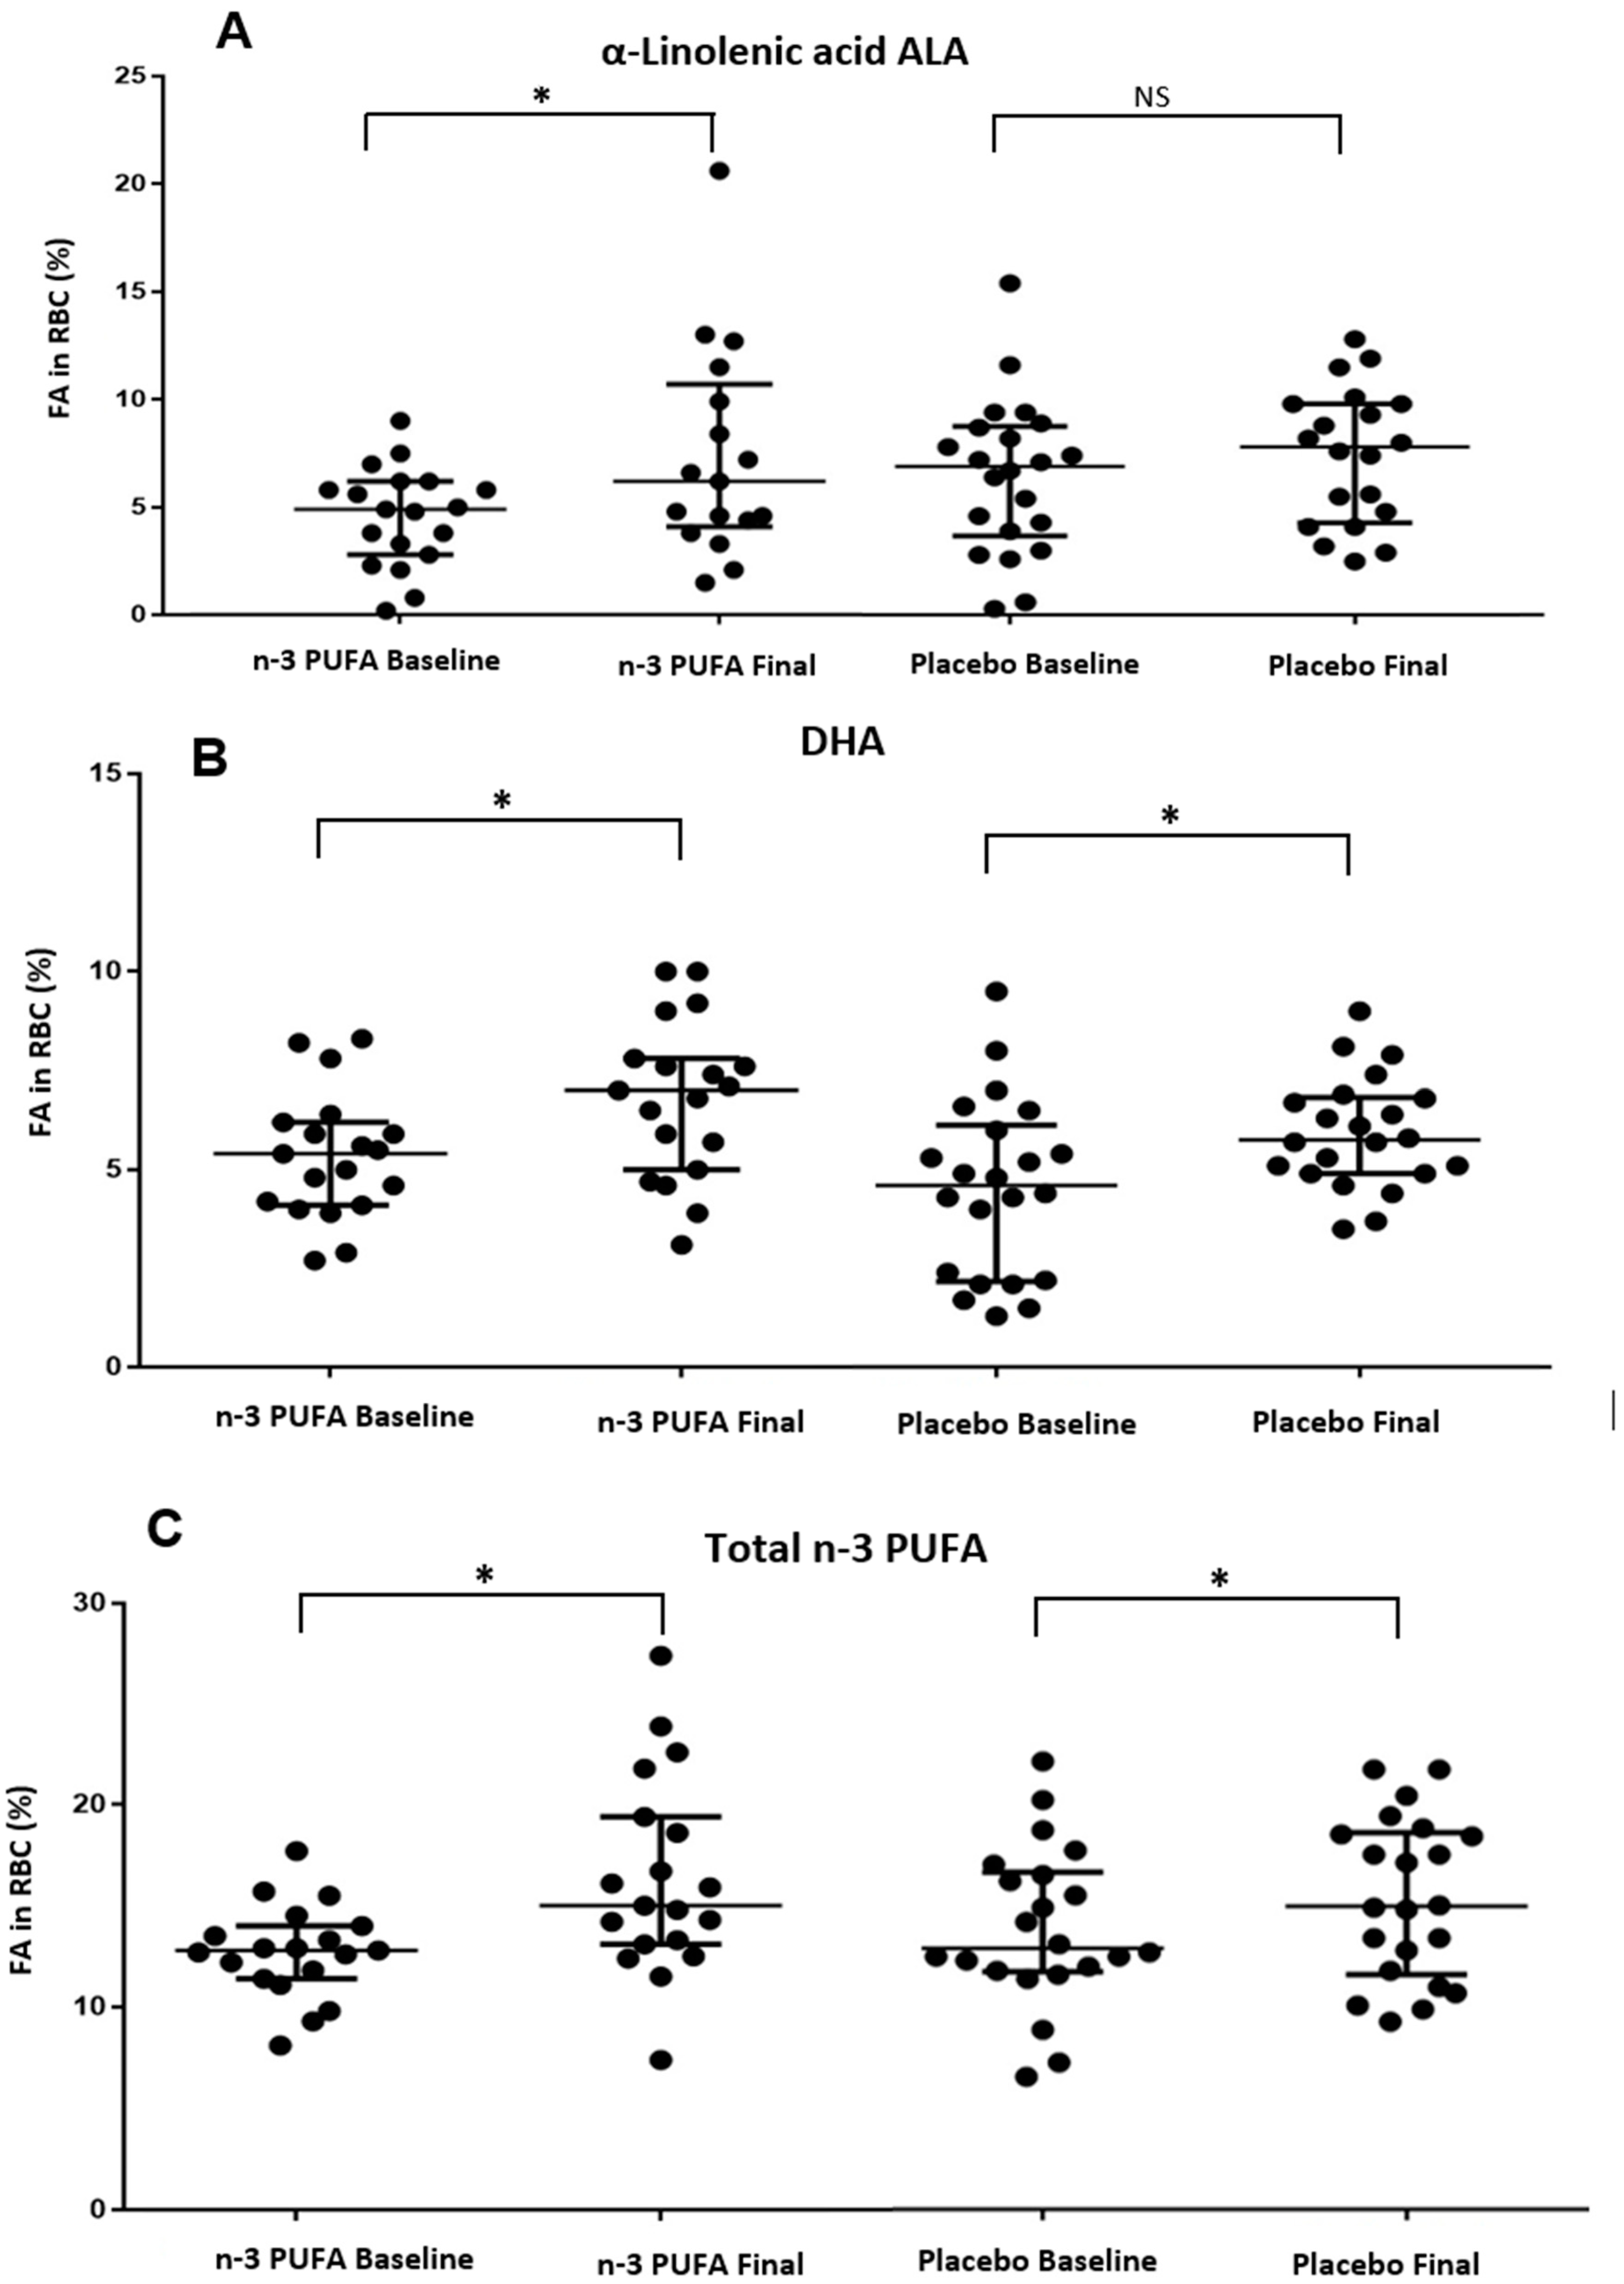
| α linolenic acid (%) | 4.4 ± 2.3 | 7.3 ± 4.8 | 0.024 | 2.9 ± 4.8 | 6.1 ± 3.5 | 7.3 ± 3.1 | 0.248 | 1.2 ± 4.5 | 0.437 | 0.693 |
| EPA (%) | 1.5 ± 0.3 | 1.6 ± 0.3 | 0.420 | 0.08 ± 0.4 | 1.5 ± 0.3 | 1.5 ± 0.4 | 0.738 | 0.03 ± 0.5 | 0.732 | 0.910 |
| DPA (%) | 1.1 ± 0.5 | 1.4 ± 0.4 | 0.122 | 0.3 ± 0.8 | 1.1 ± 0.5 | 1.0 ± 0.2 | 0.323 | −0.1 ± 0.5 | 0.234 | 0.557 |
| DHA (%) | 5.3 ± 1.6 | 6.7 ± 1.9 | 0.036 | 1.4 ± 2.7 | 4.5 ± 2.2 | 5.9 ± 1.4 | 0.035 | 1.4 ± 2.9 | 0.956 | 0.981 |
| Total n-3 (%) | 12.7 ± 2.8 | 16.3 ± 4.8 | 0.014 | 3.6 ± 5.8 | 15.2 ± 3.9 | 13.7 ± 3.9 | 0.321 | 1.4 ± 6.8 | 0.569 | 0.836 |
| Total PUFAs (%) | 28.8 ± 4.9 | 31.4 ± 6.6 | 0.269 | 2.5 ± 9.8 | 30.2 ± 6.2 | 32.0 ± 5.9 | 0.408 | 1.7 ± 9.6 | 0.874 | 0.950 |
| B | CI | p Value | |
|---|---|---|---|
| n-3 PUFA group (n = 19) | |||
| DHA in RBCs t = 4 (%) | −0.426 | −0.824–−0.028 | 0.038 |
| BFM (kg) t = 4 | −0.138 | −0.275–0.000 | 0.051 |
| Sex (1 woman, 0 men) | 0.611 | −1.473–2.695 | 0.535 |
| Placebo group (n = 22) | |||
| DHA in RBCs t = 4 (%) | −0.863 | −1.682–−0.044 | 0.040 |
| BFM (kg) t = 4 | −0.028 | −0.170–0.115 | 0.685 |
| Sex (1 woman, 0 men) | 2.253 | −0.536–5.042 | 0.106 |
Disclaimer/Publisher’s Note: The statements, opinions and data contained in all publications are solely those of the individual author(s) and contributor(s) and not of MDPI and/or the editor(s). MDPI and/or the editor(s) disclaim responsibility for any injury to people or property resulting from any ideas, methods, instructions or products referred to in the content. |
© 2023 by the authors. Licensee MDPI, Basel, Switzerland. This article is an open access article distributed under the terms and conditions of the Creative Commons Attribution (CC BY) license (https://creativecommons.org/licenses/by/4.0/).
Share and Cite
Gonzalez-Becerra, K.; Barron-Cabrera, E.; Muñoz-Valle, J.F.; Torres-Castillo, N.; Rivera-Valdes, J.J.; Rodriguez-Echevarria, R.; Martinez-Lopez, E. A Balanced Dietary Ratio of n-6:n-3 Polyunsaturated Fatty Acids Exerts an Effect on Total Fatty Acid Profile in RBCs and Inflammatory Markers in Subjects with Obesity. Healthcare 2023, 11, 2333. https://doi.org/10.3390/healthcare11162333
Gonzalez-Becerra K, Barron-Cabrera E, Muñoz-Valle JF, Torres-Castillo N, Rivera-Valdes JJ, Rodriguez-Echevarria R, Martinez-Lopez E. A Balanced Dietary Ratio of n-6:n-3 Polyunsaturated Fatty Acids Exerts an Effect on Total Fatty Acid Profile in RBCs and Inflammatory Markers in Subjects with Obesity. Healthcare. 2023; 11(16):2333. https://doi.org/10.3390/healthcare11162333
Chicago/Turabian StyleGonzalez-Becerra, Karina, Elisa Barron-Cabrera, Jose F. Muñoz-Valle, Nathaly Torres-Castillo, Juan J. Rivera-Valdes, Roberto Rodriguez-Echevarria, and Erika Martinez-Lopez. 2023. "A Balanced Dietary Ratio of n-6:n-3 Polyunsaturated Fatty Acids Exerts an Effect on Total Fatty Acid Profile in RBCs and Inflammatory Markers in Subjects with Obesity" Healthcare 11, no. 16: 2333. https://doi.org/10.3390/healthcare11162333
APA StyleGonzalez-Becerra, K., Barron-Cabrera, E., Muñoz-Valle, J. F., Torres-Castillo, N., Rivera-Valdes, J. J., Rodriguez-Echevarria, R., & Martinez-Lopez, E. (2023). A Balanced Dietary Ratio of n-6:n-3 Polyunsaturated Fatty Acids Exerts an Effect on Total Fatty Acid Profile in RBCs and Inflammatory Markers in Subjects with Obesity. Healthcare, 11(16), 2333. https://doi.org/10.3390/healthcare11162333